46
1 9M 2017 Unaudited Results WIP 9M 2017 Financial Results Presentation November 7, 2017

19M 2017 Unaudited Results
WIP
9M 2017 Financial Results Presentation
November 7, 2017

29M 2017 Unaudited Results
Disclaimer
This presentation contains or incorporates by reference ‘forward-looking statements’ regarding the belief orcurrent expectations of Union Bank Plc, the Directors and other members of its senior management aboutthe Group’s businesses and the transactions described in this presentation. Generally, words such as ‘‘could’’,‘‘will’’, ‘‘expect’’, ‘‘intend’’, ‘‘anticipate’’, ‘‘believe’’, ‘‘plan’’, ‘‘seek’’ or similar expressions identify forward-lookingstatements.
These forward-looking statements are not guarantees of future performance. Rather, they are based oncurrent views and assumptions and involve known and unknown risks, uncertainties and other factors, manyof which are outside the control of the Company and/or its Group and are difficult to predict, that may causeactual results to differ materially from any future results or developments expressed or implied from theforward-looking statements. Such risks and uncertainties include, but are not limited to, regulatorydevelopments, competitive conditions, technological developments and general economic conditions. TheBank assumes no responsibility to update any of the forward looking statements contained in thispresentation.
Any forward-looking statement contained in this presentation based on past or current trends and/or activitiesof Union Bank should not be taken as a representation that such trends or activities will continue in the future.No statement in this presentation is intended to be a profit forecast or to imply that the earnings of theCompany for the current year or future years will necessarily match or exceed the historical or publishedearnings of the Company. Each forward-looking statement speaks only as of the date of the particularstatement. Union Bank expressly disclaims any obligation or undertaking to release publicly any updates orrevisions to any forward-looking statements contained herein to reflect any change in Union Bank’sexpectations with regard thereto or any change in events, conditions or circumstances on which any suchstatement is based.

39M 2017 Unaudited Results
UBN – Celebrating 100 Years of Strength, Reliability and Growth
1917 - 1970 1971 - 1990 1991 - 2008 2009 - 2012 2013 - 2015 2016 - 2017
Established as
Colonial Bank
Became Barclays
Bank DCO, 2nd
commercial bank
in Nigeria
Became Barclays
Bank of Nigeria
Ltd.
1917
1925
1969
Listed on the
Nigerian Stock
Exchange
Became Union
Bank of Nigeria
Plc.
1971
1979
2nd largest
branch network
with ~280
branches
Established UK
subsidiary
Acquired
Universal Trust
Bank & Broad
Bank
1999
2004
2005
Banking crisis /
CBN
intervention
3rd largest
branch network
with ~350
branches
2009
2012
Strategy
redefined with
new
management
Sale of
subsidiaries
with focus on
core banking
Huge
investments in
people, process
& technology
2013
2014
2015
Launched re-
energized
brand. Awards
received
2015
Received most
improved retail
bank award
Simpler,
Smarter Bank
2016
2016
2017
Received
Nigeria’s Best
Bank Awards in
2000-2, 2004,
2006
Opened full-
fledged branch
in London
1983
Grew branch
network to 59
1970
Recapitalization
with UGPL as
core investors
2012

49M 2017 Unaudited Results
Union @ 100 – Celebrate. Impact. Lead.
LeadCelebrate
Impact
Sustainability
He
rita
ge
Inn
ova
tio
n
Drive change in our community:
• Continue to create sustainable impact in
our communities
• Establish a standard for sustainable
citizenship for the private sector.
How we will lead in the future:
• Be at the leading edge of innovation,
placing emphasis on enhancing
customer experience and driving social
innovation
We have a rich, long heritage made possible
by key stakeholders in our journey and we
must celebrate them:
• Employees, Customers, Alumni, Other
stakeholders
59M 2017 Unaudited Results
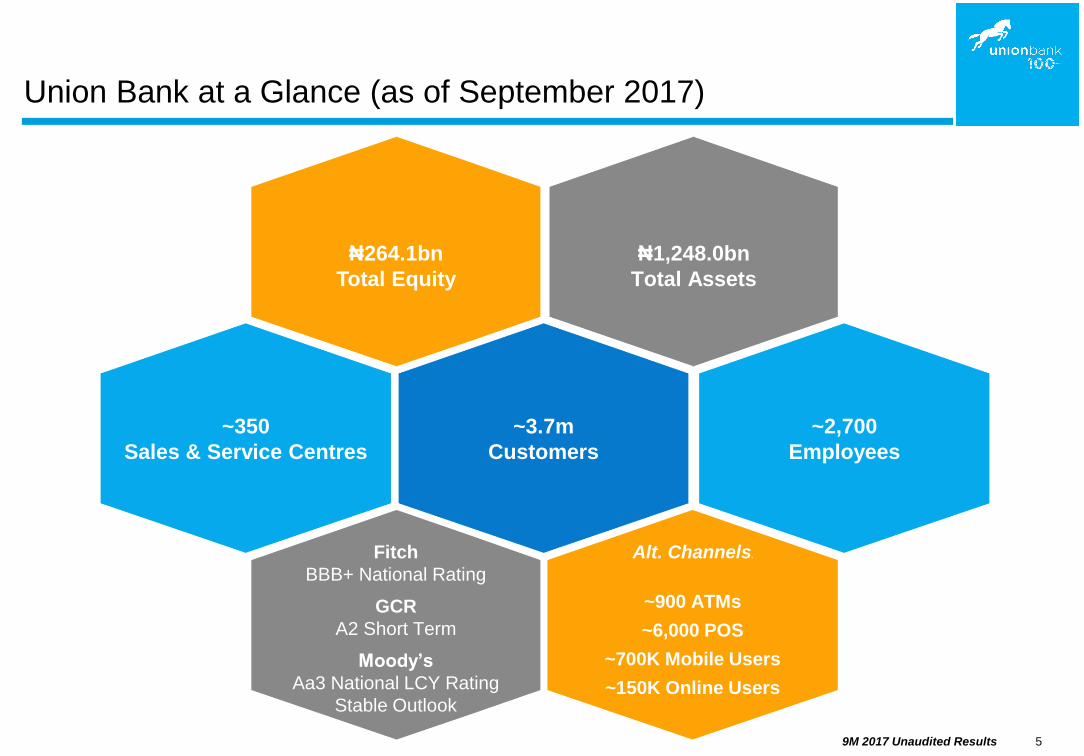
Union Bank at a Glance (as of September 2017)
₦1,248.0bn
Total Assets
₦264.1bn
Total Equity
~3.7m
Customers
~2,700
Employees
Alt. Channels5
~900 ATMs
~6,000 POS
~700K Mobile Users
~150K Online Users
Fitch
BBB+ National Rating
GCR
A2 Short Term
Moody’s
Aa3 National LCY Rating
Stable Outlook
~350
Sales & Service Centres

The Operating Environment
Union Bank Update
9M 2017 Financial Performance
Looking Ahead
1
2
3
4

The OperatingEnvironment
Emeka Emuwa
Chief Executive Officer
1

89M 2017 Unaudited Results
In 2017, the Nigerian economy has seen some ups and downs
Nigeria is exiting the recession
Macro-
Economic
Conditions
Changing
Regulation
Socio-Political
Development
Consumer
Trends
• Slow start to the
year, exiting
recession in Q2
• Declining inflation,
though higher than
pre-recession levels
• Volatile oil prices –
improving reserves
• Domestic
commodity prices
responding
positively to
increased harvest
output
• Additional FX
windows restored
stability
• Tight monetary
policy – consistently
high rates
• CBN policies to
boost financial
inclusion, agric. and
SME
• Launch of ERGP
2017-2020
• Delayed release of
funding, impacting
progress on 2017
plans requiring
capital expenditure
• Consumers are
under economic
pressure therefore
more “Made in
Nigeria” -inclined
• More tech savvy
customers, and
are therefore driving
rise of more efficient
& service-oriented
start-ups
TH
E O
PE
RA
TIN
G E
NV
IRO
NM
EN
T

99M 2017 Unaudited Results
Current macroeconomic trends in Nigeria reveal some positives
Nigeria’s GDP is projected to expand 0.81-1%2 in 2017.
In Q2’17, GDP grew by 0.55% year-on-year following
five consecutive quarters of negative growth.
Source: CBN, NBS , FDC,OPEC, other research
Reserves currently stand at $33.2bn (as of Nov 3), vs.
$32.2bn in Sept’17, and $25.8bn in Dec’16.
Crude oil (Bonny Light) was $64.27 (as of Nov 6), up
from $54.6 in Sept’17 and $53.90 in Dec’16 (fuelled by
higher demand and output cuts limiting supply).
As at Nov 3, the IEFX window closed at ₦360.57/$.
CBN’s official FX has rate remained flat at ₦305.85/$.
In Sept, inflation improved slightly to 15.98%. It reached
an all year high of 18.60% in Dec’16 driven by
increased price of general consumer goods
Notes: 1 IMF GDP forecasts; 2 World bank GDP growth forecasts
Real
GDP
Growth
Rate
Crude Oil
(Bonny Light)
$/barrel
Inflation
External
Reserves
-2.3%
-1.7%-0.9%
0.6%
24.5 25.8
30.3 30.3 32.2
50.6 53.9
51.9
46.9 54.6
Official
Rate N/$
BDC Rate N/$
305 305
306 306 306
470 482
395368
362 NAFEX Rate
N/$
17.9% 18.6%17.3% 16.1% 16.0%
Sep-16 Dec-16 Mar-17 Jun-17 Sep-17
TH
E O
PE
RA
TIN
G E
NV
IRO
NM
EN
T

109M 2017 Unaudited Results
Recent regulatory developments highlight some positives
Flexible FX rules were introduced by the Central Bank of Nigeria (CBN), including the removal of
the 60:40 FX allocation to manufacturers
The nationwide implementation of the cashless policy is suspended, with CBN directing banks to
revert to old charges and refund debited customers
A special FX window for SMEs is introduced, to enable operators import eligible items
A special FX window for investors and exporters is introduced, to improve liquidity in the forex
market
Bank charges were revised, effective May 1
Q3
2017
CBN reiterated the IFRS 9 guidance that was released in December 2016, providing guidance for
banks to commence the parallel run of IAS 39 and IFRS 9 by October 1, 2017
CBN announced plans to establish two new financial instruments: “Funding for Liquidity Facility
(FfLF)’’ and ‘’Intra-Day Facility (IDF)’’; to provide liquidity support to licensed Non-Interest Financial
Institutions (NIFI)
Rates retained at 30%, 14% and 22.5% for liquidity ratio, MPR and CRR respectively, by MPC
Q1
2017
Q2
2017
TH
E O
PE
RA
TIN
G E
NV
IRO
NM
EN
T

Union Bank Update
2

129M 2017 Unaudited Results
Today, Union Bank is a simpler, smarter bank
Robust risk
management and
compliance
standards
Improving
operational
efficiency
Iconic brand with
rich heritage
Solid and
experienced
leadership team
Steadily growing
and resilient
customer base
(~3.7m customers)
Extensive
distribution with
~350 branches with
omni-channel
network
Sustained positive
financial
performance
trajectory
State of the art
core banking
platform
Strengthened
talent pool with
improving
productivity
Strong reputation
for ethical
standards (trust,
professionalism)
UN
ION
BA
NK
UP
DA
TE

139M 2017 Unaudited Results
Our focus remains retail, trade and transaction banking
People
Risk &
ComplianceSystems/
ProcessesQuality of
Earnings
Retail
Trade &
Transaction
Banking
Commercial Corporate
Areas of Focus
Efficient Channels:
Online & Mobile
Innovative
Products
Predictable Service
Delivery
Strong Focus on
Customer
Acquisition
Enhanced Service
Delivery
Market Leader in
Domestic Trade
Leverage Value
Chain for Network
Effect
Deep Sector
Expertise
e.g. Agriculture
Cost Efficiency &
Productivity
Strong Sales/Service
Capability
Proactive Risk
Management
Enabling
Partnerships
Quality of our talent & professional standards Quality of our banking platform
UN
ION
BA
NK
UP
DA
TE

149M 2017 Unaudited Results
Strategy is consistent across our businesses
Corporate RetailCommercial
• Key transaction banking
partner for strategic clients
• Optimally defend asset portfolio
while deploying core product
capabilities
• Provide structured
solutions/services to clients
• Provide solutions to address
specific sectors
• Provide consistent service across
channels
• Deliver customized advice and
support
• Fully segmented retail business
maximizing resource deployment
• Focus on innovative deposit
solutions
• Continue to enhance alternative
channel features based on
customer needs and innovation
Value Chain Approach

159M 2017 Unaudited Results
We have made great strides in our priority areas
PeopleFunding &
LiquidityPositioning
Operational
& Cost
Efficiency
Capital
• Invested in our
people to drive
productivity
• Launched revised
employee value
proposition to
drive retention
• 9th Best Company
to Work For
(Jobberman)
• N50bn rights issue
closed
• Resolved negative
retained earnings
constraint to allow
future dividend
payments
• Liquidity remains
above regulatory
requirements of
30%
• Secured new
funding and trade
lines
• Reinvested cost
savings in
technology and
process
enhancements
• Increased
alternative
channel push
driving reduced
cost to serve
• Launched “Clear
Your Doubt”
campaign yielding
positive results
• Reinforced
simpler smarter
bank through new
UnionMobile and
UnionOnline
• Centenary
celebrations and
engagement
across Nigeria
UN
ION
BA
NK
UP
DA
TE

169M 2017 Unaudited Results
Our omni-channel network is delivering rapid digital penetration
Almost 11x growth in active
debit card users since 2012
(~2.2m vs. ~200k)
>3x growth in number of active
ATMs across Nigeria since 2012
(~860 vs. ~270)
Almost 62x growth in active
mobile banking users since
2012 (~689k vs. ~11k)
Almost 18x growth in active
online banking users since 2012
(>141k vs. ~8k)
~₦80bn in transactions processed
monthly for >830 transacting clients
on UnionOne (vs. 19 in 2014 post-
launch)
Almost 6x growth in number of active
POS devices across Nigeria since
2012 (~5.7k vs. ~1k)
Channel Productivity and Digital Penetration
UN
ION
BA
NK
UP
DA
TE

179M 2017 Unaudited Results
In 2017, we upgraded 50+ branches and continued our
community and sustainability efforts
65+ transformation projects in progress; 50 projects
completed in 9M’17
70+ projects to be completed by end of 2017
Partnered with JAN (Junior Achievement Nigeria) on
second year of LEAD Camp 2017
Sponsored the 2nd edition of Foto.Factory.Lagos, a
platform for supporting budding photographers
Partnered with Girls Coding (Pearls Africa Foundation) to
organize a tech training residential camp for 50 girls from
underserved communities around Lagos
Conducted wehub (the bank’s internal women’s
empowerment network) hangouts in over 15 states across
the country
Impacted over 3000 students through our bank-led
financial inclusion teaching/mentoring activities
Trained 36 entrepreneurs with Junior Chamber
International, as part of 19th Leadership Academy
Continuously adopted environmentally friendly business
practices and operations:
‒ Deployment of energy efficient equipment to help
reduce our carbon footprint
‒ Continued expansion of recycling footprints, with
plans to expand to 40 remaining Lagos branches,
Abuja and Kano in 2018
Upgraded Branches Community and Sustainability Achievements1 2
UN
ION
BA
NK
UP
DA
TE

189M 2017 Unaudited Results
Union @ 100: Our centenary celebrations have been community
and customer-focused, inspiring discussions around “the next 100”
Launched 30+ branches across 16
states (Abia, Abuja, Benue, Delta,
Ebonyi, Enugu, Kaduna, Kano,
Katsina, Kogi, Kwara, Lagos, Niger,
Ogun, Oyo and Plateau)
‘‘The Next 100: A Call to Action,’’ organized to
position the bank as a leading private sector
organization for the achievement of the
sustainable development goals (SDGs) in
Nigeria
Hosted anniversary galas across
the country to honor customers
and stakeholders who have
supported the bank over the
years
Celebrated customers and employees
during the 100th Anniversary Customer
and Employee Giveaway promos
Engaged Nigeria in special ways – through the
Centenary Art Challenge, we engaged
creatives across Nigeria, further recognizing
art as an important expression of our culture.
The Centenary Innovation Challenge focused
on ideas that can resolve typical issues faced
by everyday Nigerians
Supported the growth of
technology-enabled startups
through Start-Up Connect, an
acceleration programme designed
in partnership with Co-Creation Hub
100th Anniversary Initiatives and Celebrations in H2 2017
UN
ION
BA
NK
UP
DA
TE

199M 2017 Unaudited Results
Our rights issue closed on Oct 30 and proceeds expected by
year-end
Overview
• ₦49.7 billion rights issue size
• 12.1 billion ordinary shares of 50 kobo each at N4.10 per
share
• On the basis of 5 (five) new ordinary shares for every 7
(seven) ordinary shares held as at August 21, 2017
• Acceptance list opened Sept 20 and closed Oct 30, 2017
Use of
Proceeds
• Enhance the Bank’s regulatory capital requirement
• Increase working capital and grow in strategic areas that
correspond to emerging opportunities in Nigeria
• Enhance technological platforms through strategic
investments in technology and digitalization
• Optimize customer experience with investments in
customer touch points.
UN
ION
BA
NK
UP
DA
TE

9M 2017 Financial Performance
Oyinkan Adewale
Chief Financial Officer
3

219M 2017 Unaudited Results
Group Key Financial Highlights – 9M 2017
Gross Earnings Up 16% to ₦109.5bn (₦94.8bn in 9M 2016)
Non-Interest Income Down 6% to ₦21.0bn (₦22.5bn in 9M 2016)
Customer Deposits Up 17% to ₦767.9bn (₦658.4bn at Dec 2016)
Profit Before Tax (PBT) Down 2% to ₦13.0bn (₦13.3bn in 9M 2016)
Gross Loans Down 5% to ₦508.6bn (₦535.8bn at Dec 2016)
Interest Income Up 22% to ₦88.5bn (₦72.3bn in 9M 2016)
Net Interest Income
after ImpairmentUp 16% to ₦40.9bn (₦35.2bn in 9M 2016)
9M
2017 F
INA
NC
IAL P
ER
FO
RM
AN
CE

229M 2017 Unaudited Results
9M 2017 Performance – Group Financial Summary
Sept-2017 Dec-2016 Δ
Balance
Sheet
(₦ ’bn)
Assets 1,358.2 1,252.7 8%
Gross Loans 508.6 535.8 (5%)
Customer Deposits 767.9 658.4 17%
Equity 285.5 271.7 5%
Key
Ratios
Loan to Deposit Ratio 66.0% 81.4% (15.4%)
Non-Performing Loan Ratio 9.1% 6.9% 2.2%
9M 2017 9M 2016 Δ
Income
Statement
(₦ ’bn)
Gross Earnings 109.5 94.8 16%
Interest Income 88.5 72.3 22%
Net Interest Income 46.9 48.1 (2%)
Non-Interest Income 21.0 22.5 (6%)
Credit Impairment (6.0) (12.9) (53%)
Operating Expenses (49.0) (44.6) 10%
Profit Before Tax 13.0 13.3 (2%)
Profit After Tax 12.4 13.0 (5%)
Key
Ratios
Net Interest Margin 7.5% 8.8% (1.3%)
Cost to Income Ratio 72% 63% 9%
Return on Equity 6.0% 6.9% (0.9%)
Return on Assets 1.3% 1.6% (0.3%)
Net Asset Value per share ₦16.86 ₦14.95 ₦1.91
Earnings Per Share 72k 76k (4k)
9M
2017 F
INA
NC
IAL P
ER
FO
RM
AN
CE

239M 2017 Unaudited Results
Bank Key Financial Highlights – 9M 2017
Gross Earnings
Non-Interest Income
Customer Deposits Up 20% to ₦757.9bn (₦633.8bn at Dec 2016)
Profit Before Tax (PBT)
Gross Loans Down 6% to ₦486.5bn (₦518.3bn at Dec 2016)
Interest Income
Net Interest Income
after Impairment
Up 14% to ₦105.3bn (₦92.7bn in 9M 2016)
Down 9% to ₦20.3bn (₦22.1bn in 9M 2016)
Down 11% to ₦11.7bn (₦13.2bn in 9M 2016)
Up 21% to ₦85.1bn (₦70.5bn in 9M 2016)
Up 13% to ₦37.9bn (₦33.5bn in 9M 2016)
9M
2017 F
INA
NC
IAL P
ER
FO
RM
AN
CE

249M 2017 Unaudited Results
9M 2017 Performance – Bank Financial Summary
Sept-2017 Dec-2016 Δ
Balance
Sheet
(₦ ’bn)
Total Assets 1,248.0 1,123.5 11%
Gross Loans 486.5 518.3 (6%)
Customer Deposits 757.9 633.8 20%
Equity 264.1 251.3 5%
Key
Ratios
Liquidity Ratio(regulatory minimum - 30%)
40.6% 33.1% 7.5%
Loan to Deposit Ratio 64.0% 81.8% (17.6%)
Non-Performing Loan Ratio 9.6% 7.1% 2.5%
9M 2017 9M 2016 Δ
Income
Statement
(₦ ’bn)
Gross Earnings 105.3 92.7 14%
Interest Income 85.1 70.5 21%
Net Interest Income 43.8 46.4 (6%)
Non-Interest Income 20.3 22.1 (9%)
Credit Impairment (5.9) (12.8) (54%)
Operating Expenses (46.6) (42.7) 9%
Profit Before Tax 11.7 13.2 (11%)
Profit After Tax 11.4 13.1 (12%)
Key
Ratios
Net Interest Margin 8.2% 10.0% (1.8%)
Cost to Income Ratio 73% 62% 11%
Return on Equity 5.9% 7.5% (1.6%)
Return on Assets 1.3% 1.7% (0.4%)
Net Asset Value per share ₦15.59 ₦13.98 ₦1.61
Earnings Per Share 67k 77k (10k)9M
2017 F
INA
NC
IAL P
ER
FO
RM
AN
CE

259M 2017 Unaudited Results
Interest income is a leading driver of revenue growth
74.988.9 95.4
69.285.1
24.2 35.1 32.9 22.8 41.2
9.0% 9.0%9.4%
10.0%
8.2%
3.5%
4.5%
5.5%
6.5%
7.5%
8.5%
9.5%
10.5%
0.0
20.0
40.0
60.0
80.0
100.0
120.0
FY'14 FY'15 FY'16 9M'16 9M'17
Interest Income Interest Expense Net Interest Margin
Non-Interest Income (NII) (₦'Bn)Interest Income & Interest Expense (₦'Bn)
• Bank Gross Earnings up 14% to ₦105.3bn (₦92.7bn in
9M’16)
• Bank Interest Income up 21% to ₦85.1bn vs. ₦70.5bn
in 9M’16
• Non-Interest Income down by 9% to ₦20.3bn;
excluding one-off gains of ₦4.7bn in FX reval and
₦752m in subsidiary sales in 9M’16, NII grew by 20%
• Net Interest Income after Impairment up 13%
(₦37.9bn in 9M’17 vs. ₦33.5bn in 9M’16)
• ₦2.0bn in Recoveries in 9M’17 vs. ₦0.9bn in 9M’16
Gross Earnings (₦'Bn)
74.988.9 95.4
70.585.1
28.729.5 28.1
21.420.30.8
109.9
6.3
9M’17FY’16
124
92.7
0.8
FY’15
118
3.6
FY’14
105.3
9M’16
Interest IncomeNon-Interest IncomeGain on Subs. Sale
9.2 7.2 10.07.85.1
7.7 5.0
5.6
17.4 13.69.6
7.7
4.7 6.6
3.9
3.66.3
9M’17
20.3
9M’16
22.1
0.3
2.1
0.8
29.5
FY’14
35.0
28.1
FY’16FY’15
0.8
Net trading incomeGain on Subs. Sale
E-business and other fee incomeOther NII
FX Reval gain
9M
2017 F
INA
NC
IAL P
ER
FO
RM
AN
CE
BANK FINANCIAL FIGURES

269M 2017 Unaudited Results
Increased deposits driven by a revamped digital platform and a
customer-centric product suite
Customer Deposits (₦'Bn)
Deposits by Business Segment (Sept’17)
• Customer Deposits up 20% to ₦757.9bn (₦633.8bn
as at Dec 2016); low cost deposits increased to 66%
of total deposits vs. 65% in Dec 2016
- Growth led by rise in number of customers, increased
uptake of product offerings, increased market
penetration and financial inclusion initiatives
- ~90% YoY increase in new-to-bank customers
- ~103% growth YoY in active mobile subscribers
- ~148% growth YoY in active online subscribers
- ~38% growth YoY in active cards
62%14%
24%
Retail
Commercial
Corporate
161 208 225 257 226
347361
409430 523
258
500
Dec’15
686
Dec’16
634569
Mar’17 Jun’17
749
Sept’7
758
Dec’14
507
TermCurrent & Savings
Funding Structure (Sept’17)
67%
3%
1%6%
23%Customer deposits
Deposits from Banks
On-lending facilities
FCY Borrowings
Equity
9M
2017 F
INA
NC
IAL P
ER
FO
RM
AN
CE
BANK FINANCIAL FIGURES

279M 2017 Unaudited Results
Deliberate efforts to maintain balance of loan book
• Bank Gross Loans down 6% to ₦486.5bn
(₦518.3bn in Dec’16): improving FX availability
facilitated liquidation of mature obligations in the Fcy
book
• Fcy loan book down 19% from Dec’16; Lcy loan book
up 8%
• Fcy loan book now 44% of Gross Loans vs 51% at
Dec’ 16
• Concentration in the O&G sector has reduced
Gross Loans (₦'Bn)
130 174 165229 215
196197 253
264 271
214
272
98
Dec’14
326
Dec’15
371
Dec’16
518486
Jun’17Mar’17
493 486
Sept’17
FCYLCYDeval growth
Gross Loans by Sector
11%O & G Upstream 14%
ManufacturingPower & Energy 10%
9%8%
O & G Services
1%
6%
Public Sector
Real EstateGeneral Commerce
4%
7%
IT & Telecomms
7%
Others
4%Construction 5%
Individuals
Agriculture
O & G Downstream 15%
Dec’16Sept’1720%
19%
10%
9%
8%
4%
7%
5%
5%
5%
4%
4%
1%
Gross Loans by Business Segment (Jun’17)
5%
23%
72%
Gross Loans by Business Segment
5%
21%
74%
Sept’17 Dec’16
9M
2017 F
INA
NC
IAL P
ER
FO
RM
AN
CE
BANK FINANCIAL FIGURES

289M 2017 Unaudited Results
Strong focus on sufficient provisioning and recoveries
*Includes regulatory risk reserves
NPL & Coverage Ratios
Non Performing Loans By Sector (Sept’17)• NPL Ratio of 9.6% at Sept’17 (7.1% Dec’16),
reflects the challenging macro environment
• Coverage Ratio of 202% at 9M’17 (181.8% Dec’16)
reflects adequate provisioning
• We remain focused on NPL recovery and
continuous monitoring of loan book
• ₦2.0bn in Recoveries in 9M 2017 vs. ₦923m in
9M 2016 (119% increase)
39%
18%
11%
8%
10%
6% 4%
1%1%1%
Power & Energy (N=1)
Real Estate (N=1)
Finance & Insurance (N=1)
Oil & Gas Downstream
General Commerce
Individual
Transportation & Storage
Agriculture
Construction
Manufacturing
Others
5.1% 7.0% 7.0% 7.7% 8.6% 9.6%
191% 177% 182% 185% 185%202%
Dec'14 Dec'15 Dec'16 Mar'17 Jun'17 Sept'17
NPL Coverage*
9M
2017 F
INA
NC
IAL P
ER
FO
RM
AN
CE
BANK FINANCIAL FIGURES

299M 2017 Unaudited Results
Bank’s Financial Performance Trend
Note: *Includes one-time gain on sale of subsidiaries: FY’14 – ₦6.3bn; FY’15 – ₦3.6bn; FY’16 – ₦0.8bn
FY
2014
FY
2012
FY
2013
FY
2011
FY
2015
Gross Earnings (₦’bn) 109.896.5 103.271.2 118.4
Gross Loans (₦’bn) 326149 231156 371
Return On Assets
(With Core PBT / With Total PBT)0.4% 0.5%(12.3%)
Customer Deposits (₦’bn) 507482 480400 569
Profit Before Tax (PBT) (₦’bn)
(Core PBT / Total PBT)3.4 4.2(102.6)
Return On Equity
(With Core PBT / With Total PBT)1.8% 2.8%(428%)
Cost To Income Ratio 67%96% 71%183% 67%
FY
2016
123.5
518
634
65%
20.7* 18.5* 16.1*
14.4 14.9 15.3
2.3%* 1.9%* 1.5%*
10.4%* 8.2%* 6.6%*
7.2% 6.6% 6.2%
1.6% 1.6% 1.4%
9M
2017
92.7
515
618
62%
105.3
487
1.3%
758
11.7
5.9%
73%
9M
2016
13.2
12.4
7.5%*
7.0%
1.7%*
1.6%
9M
2017 F
INA
NC
IAL P
ER
FO
RM
AN
CE

Looking Ahead
Emeka Emuwa
Chief Executive Officer
4

319M 2017 Unaudited Results
Looking Ahead:
Union Bank Mission and Ambition
Growth
Leader in Retail
Banking, Trade and
Transaction
Banking
1
Nigeria’s Most
Reliable and
Trusted Banking
Partner
2
Leader in
Citizenship,
Sustainability and
Innovation
3
LO
OK
ING
AH
EA
D
• Leader in governance
and controls with
international standard
compliance
• Service predictability and
consistency
• Leading driver of change
and sustainable
development goals
• Well recognized brand
and benchmark for high
customer satisfaction
• Market leader in
domestic trade; payment
and collections across
value chain

329M 2017 Unaudited Results
Closing Out 2017 – Consolidating Gains for 2018 Growth
LO
OK
ING
AH
EA
D
Enhanced Capital
Profile
Enhanced Platforms
(Channels, People, Processes)
Sustained Customer Growth
Strengthened
Brand

339M 2017 Unaudited Results
Looking ahead, we have identified real opportunities for growth
Invest in Key Sectors for
Nigeria’s Growth(Facilitate Trade & Transactions
across sectors & their value chain)
Harness
“The Platform”(People, Technology, Capital,
Infrastructure, Brand)
Continue to drive retail
proposition(SME, Lending, Digital)
Leverage partnerships for
business growth and
operational enhancement
LO
OK
ING
AH
EA
D

349M 2017 Unaudited Results
We have invested in “The Platform” and we will leverage it to
drive productivity and profitability
Revenue Generation
Cost Efficiency
Productivity Profitability
People
Balance Sheet and
Capital
Operations
LO
OK
ING
AH
EA
D

359M 2017 Unaudited Results
2017
2019
& Beyond
• UBN @ 100 – from awareness of brand vs.
affinity to brand
• Enhanced customer engagement and
service delivery
• Innovation efforts
• Simpler & smarter bank
• Nigeria’s most reliable and trusted
banking partner
2015 - 2016
On the Right Track to Becoming a Simpler and Smarter Bank
• Strategy defined
• Refocus on core banking
• Right-sized UBN
• Returned to profitability
• Brand re-launch
• Enhanced technology platform &
operations
• Robust and modern distribution network
• Strong push towards alternative channels
2013 - 2014
2018
• The leading mid-tier bank
• Champion in service delivery
• Recognized as a leader in citizenship,
sustainability and innovation
LO
OK
ING
AH
EA
D

Q&A

Appendix -
Group Financial Performance
A

399M 2017 Unaudited Results
9M 2017 Performance – Group Profit and Loss Statement
₦'million 9M’17 9M’16 %Δ
Gross earnings 109,513 94,759 16%
Interest income 88,470 72,290 22%
Interest expense (41,564) (24,220) 72%
Net interest income 46,906 48,070 (2%)
Impairment charge for credit loss (6,009) (12,870) (53%)
Net interest income after impairment charge 40,897 35,200 16%
Net trading income 5,763 5,148 12%
Gain on disposal of subsidiaries - 318 (100%)
Fees, commissions and other operating Income 15,280 17,003 (10%)
Non interest income 21,043 22,469 (6%)
Operating Income 61,940 57,669 7%
Net impairment write-back on other financial assets 102 165 (38%)
Operating expenses (49,044) (44,559) 10%
Profit before tax 12,998 13,275 (2%)
Profit after tax 12,410 13,012 (5%)GR
OU
P F
INA
NC
IAL P
ER
FO
MA
NC
E

409M 2017 Unaudited Results
September 2017 Performance – Group Balance Sheet
₦'million Sept-2017 Dec-2016%Δ
₦'million ₦'million
Assets
Cash and cash equivalents 174,128 136,194 27.9%
Non-pledged trading assets 44,197 8,323 431.0%
Pledged assets 64,380 53,430 20.5%
Derivative assets held for risk management 96 2,747 (96.5%)
Loans and advances to customers 475,270 507,190 (6.3%)
Investments in equity accounted investee - - -
Investment securities 190,618 181,720 4.9%
Trading properties 958 2,309 (58.5%)
Investment properties 4,778 4,347 9.9%
Property and equipment 54,651 52,800 3.5%
Intangible assets (software) 4,521 3,374 34.0%
Deferred tax assets 95,910 95,910 -
Cash reserve requirement 211,460 154,954 36.5%
Other assets 36,837 47,344 (22.2%)
Defined benefit assets 29 1,643 (98.2%)
Assets classified as held for sale 397 397 -
Total Assets 1,358,230 1,252,682 8.4%
GR
OU
P F
INA
NC
IAL P
ER
FO
MA
NC
E

419M 2017 Unaudited Results
September 2017 Performance – Group Balance Sheet (cont’d)
₦'million Sept-2017 Dec-2016
%Δ₦'million ₦'million
Liabilities
Deposits from banks 108,391 90,266 20.1%
Deposits from customers 767,861 658,444 16.6%
Current tax liabilities 713 465 53.3%
Deferred tax liabilities 151 101 49.5%
Derivative liabilities held for risk management 90 13 592.3%
Other Liabilities 114,171 141,404 (19.3)%
Retirement benefit obligations 896 805 11.3%
Other borrowed funds 80,414 89,514 (10.2%)
Total Liabilities 1,072,687 981,012 9.3%
Equity
Share capital and share premium 401,304 400,109 0.3%
Retained earnings / (accumulated loss) (254,400) (244,183) 4.2%
Other reserves 133,359 110,633 20.5%
Equity attributable to equity-holders 280,263 266,559 5.1%
Non-controlling interest 5,280 5,111 3.3%Total Equity 285,543 271,670 5.1%
Total Liabilities and Equity 1,358,230 1,252,682 8.4%
GR
OU
P F
INA
NC
IAL P
ER
FO
MA
NC
E

Appendix -
Bank Financial Performance
B

439M 2017 Unaudited Results
9M 2017 Performance – Bank Profit and Loss Statement
UB
N F
INA
NC
IAL P
ER
FO
MA
NC
E
₦'million 9M’17 9M’16 %Δ
Gross earnings 105,310 92,689 14%
Interest income 85,060 70,549 21%
Interest expense (41,247) (24,162) 71%
Net interest income 43,813 46,387 (6%)
Impairment charge for credit loss (5,865) (12,845) (54%)
Net interest income after impairment charge 37,948 33,542 13%
Net trading income 5,619 4,998 12%
Gain on disposal of subsidiaries - 752 -
Fees, commissions and other operating Income 14,631 16,390 (11%)
Non interest income 20,250 22,140 (9%)
Operating Income 58,198 55,682 5%
Net impairment write-back on other financial assets 102 165 (38%)
Operating expenses (46,567) (42,663) 9%
Profit before tax 11,733 13,184 (11%)
Profit after tax 11,445 13,053 (12%)

449M 2017 Unaudited Results
September 2017 Performance – Bank Balance Sheet
₦'million Sept-17 Dec-16%Δ
₦'million ₦'million
Assets
Cash and cash equivalents 94,477 35,536 >100%
Non-pledged trading assets 44,197 8,323 >100%
Pledged assets 64,380 53,430 20.5%
Derivative assets held for risk management 96 2,747 (96.5)%
Loans and advances to customers 453,493 489,890 (7.4)%
Investment securities 179,845 166,759 7.8%
Trading properties 513 1,124 (54.4)%
Investment in subsidiaries 10,567 10,567 -
Property and equipment 54,464 52,567 3.6%
Intangible assets (software) 4,115 2,859 43.9%
Deferred tax assets 95,875 95,875 -
Cash reserve requirement 211,460 154,954 36.5%
Other assets 36,242 46,884 (22.7%)
Defined benefit assets - 1,643 (100%)
Assets classified as held for sale 325 325 -
Total Assets 1,248,049 1,123,483 11.1%
UB
N F
INA
NC
IAL P
ER
FO
MA
NC
E

459M 2017 Unaudited Results
September 2017 Performance - Bank Balance Sheet (cont’d)
Sept-17
₦'million
Dec-16
₦'million %Δ
Liabilities
Deposits from banks 27,790 4,351 >100%
Deposits from customers 757,863 633,827 19.6%
Current tax liabilities 307 177 73.4%
Derivative Liabilities held for risk management 90 13 >100%
Other liabilities 111,675 141,191 (20.9)%
Retirement benefit obligations 867 773 12.2%
Other borrowed funds 85,378 91,812 (7.0%)
Total liabilities 983,970 872,144 12.8%
Equity
Share capital and share premium 401,304 400,109 0.3%
Treasury shares (624) - (>100%)
Retained earnings / (accumulated loss) (258,881) (247,868) 4.4%
Other reserves 122,280 99,098 23.4%
Equity attributable to equity-holders of the bank 264,079 251,339 5.1%
Total liabilities and equity 1,248,049 1,123,483 11.1%UB
N F
INA
NC
IAL P
ER
FO
MA
NC
E

THANK YOU
Head Office
Stallion Plaza 36, Marina
P.M.B 2027 Lagos, Nigeria
Telephone
UnionCare:+234-1-2716816
07007007000
London Office
1 King's Arms Yard
London
EC2R 7AF
Telephone: +44 (0) 20 79206100
Facsimile: +44 (0) 20 76387642
Contact Info
Website: www.unionbankng.com
Email: [email protected]


