Strategy ▪ Singapore 9M 2020 Outlook: Bottom for Singapore equities April 13, 2020 KGI Securities (Singapore) Pte. Ltd. • From an economic standpoint, 2Q20 is likely to be one of the worst quarters in history as the global economy enters into a synchronised recession. While China is showing a V- shape recovery after controlling the COVID-19 outbreak in 1Q20, its major export destinations (US and EU) are collapsing under the weight of shutdowns. • However, from an investment perspective, we expect that once the US passes the peak number of infections within the next 3 – 4 weeks, many beaten down sectors should outperform the recovery in the broader market. • We highlight sectors that will possibly see the biggest share of price gains once the impact of the COVID-19 outbreak begins to abate. Specifically, aviation, hotels, retail malls and commodities should see the most upside. It is important to choose the stronger companies that will come out of the crisis in a relatively better position. • Above all, technology companies will be the ultimate winner as COVID-19 accelerates the structural trends in how we live and conduct business. Welcome to the new normal. V, U or L shape recovery? Trying to determine the shape of the recovery is a challenge given that the rolling shutdowns of whole countries have never had precedents before, outside of wartime. The markets hate uncertainty, and until a medication or vaccine is developed to fight the coronavirus outbreak, COVID-19 will be an overhang on the economy. However, we are of the view that equity markets will react in a positive manner when the number of cases begin to peak. Buy in April and don’t look back. From an investment perspective, the largest market gains usually occur months before the economy begins to recover. As such, it pays to look at other factors when determining an entry point in the current environment. Based on fund flows, we believe the worst of the sell-off for Singapore equities is mainly over. Even as Singapore is highly likely to enter its worst recession on record, investors should look beyond this crisis and position themselves for the eventual recovery. In a nutshell, we are taking a firm view to buy in April and not look back. Our top picks in a nutshell. Technology companies, specifically cloud services are the biggest winners in the current environment. These also include supporting themes like semiconductor, data storage and 5G. Singapore-focused retail REITs have been punished due to government measures and are now trading at their cheapest levels in 10 years. Beaten down hospitality REITs are offering good risk-reward opportunities. Among commodities, we believe gold and oil should see respectable returns going forward. We avoid airlines but see value in the aviation service providers. We believe Singapore equities have bottomed. The risk/reward potential is favourable for Singapore equities as we make the following four arguments: 1. Fund outflows from Singapore equities have significantly slowed down since the second week of April. What this means is that the worst of the sell-off is likely over for local stocks as loose monetary and generous fiscal policies begin to have a positive impact on sentiments and risk assets. In terms of sectors, the banking and property-related stocks (including REITs) were the most heavily sold by institutional investors in March, which is not surprising as these stocks had the highest weight in the benchmarks (STI and MSCI Singapore). Figure 1: Institutional fund flows in April have calmed down from the sell- off in March 2020 Source: SGX, KGI Research A small sample survey of bullish or bearish sentiment from our sales team also showed an even split in terms of the short- term outlook of the stock market, meaning that rationality has returned to markets but generally lacks a strong market sentiment to push markets in either direction. Simply put, we expect equity markets in the short-term to be driven by news flows, which include COVID-19 updates and the upcoming 1Q earnings season. 2. “Peak shutdown” likely priced in. Based on the recovery trend in China, we expect the global “Peak shutdown”, which we define as the maximum amount of disruption caused by the government imposed lockdowns, to abate in 2Q20, and we are confident of a slow recovery from 3Q20 onwards. Singapore’s Ministry of Trade and Industry (MTI) recently downgraded the country’s 2020 economic outlook to a range of -4.0% to -1.0%, from an earlier forecast of -0.5% to -1.5%. This will be the first time since 2001 when Singapore’s economy contracted on a full-year basis. We believe this has been largely priced in by the markets, and hence, underpins our thesis that Singapore’s stock market has bottomed out. Week of Institutional Investors net buy/sell (S$M) Financial Services Industrials Real Estate (excl. REITs) REITs Technology (Hardware/ Software) (103.3) 2-Mar-20 (317.9) (30.6) 41.8 181.2 28.4 (486.0) 9-Mar-20 (422.5) (88.6) (0.9) 30.3 8.6 (842.0) 16-Mar-20 (428.3) (104.7) (48.0) (194.9) (23.3) 39.2 23-Mar-20 (20.6) (13.7) (7.1) 38.9 (4.4) (392.1) 30-Mar-20 (154.5) (30.2) (67.2) (123.9) (6.3) 52.4 6-Apr-20 20.6 (2.4) 26.7 (0.4) 25.8 Overall SGX Sector Classification 9M 2020 Outlook: Bottom for Singapore equities KGI Singapore Research Team / 65 6202 1194 / [email protected]
Transcript
Strategy ▪ Singapore
9M 2020 Outlook: Bottom for Singapore equities
April 13, 2020 KGI Securities (Singapore) Pte. Ltd.
• From an economic standpoint, 2Q20 is likely to be one of the worst quarters in history as the global economy enters into a synchronised recession. While China is showing a V-shape recovery after controlling the COVID-19 outbreak in 1Q20, its major export destinations (US and EU) are collapsing under the weight of shutdowns.
• However, from an investment perspective, we expect that once the US passes the peak number of infections within the next 3 – 4 weeks, many beaten down sectors should outperform the recovery in the broader market.
• We highlight sectors that will possibly see the biggest share of price gains once the impact of the COVID-19 outbreak begins to abate. Specifically, aviation, hotels, retail malls and commodities should see the most upside. It is important to choose the stronger companies that will come out of the crisis in a relatively better position.
• Above all, technology companies will be the ultimate winner as COVID-19 accelerates the structural trends in how we live and conduct business. Welcome to the new normal.
V, U or L shape recovery? Trying to determine the shape of the recovery is a challenge given that the rolling shutdowns of whole countries have never had precedents before, outside of wartime. The markets hate uncertainty, and until a medication or vaccine is developed to fight the coronavirus outbreak, COVID-19 will be an overhang on the economy. However, we are of the view that equity markets will react in a positive manner when the number of cases begin to peak. Buy in April and don’t look back. From an investment perspective, the largest market gains usually occur months before the economy begins to recover. As such, it pays to look at other factors when determining an entry point in the current environment. Based on fund flows, we believe the worst of the sell-off for Singapore equities is mainly over. Even as Singapore is highly likely to enter its worst recession on record, investors should look beyond this crisis and position themselves for the eventual recovery. In a nutshell, we are taking a firm view to buy in April and not look back. Our top picks in a nutshell. Technology companies, specifically cloud services are the biggest winners in the current environment. These also include supporting themes like semiconductor, data storage and 5G. Singapore-focused retail REITs have been punished due to government measures and are now trading at their cheapest levels in 10 years. Beaten down hospitality REITs are offering good risk-reward opportunities. Among commodities, we believe gold and oil should see respectable returns going forward. We avoid airlines but see value in the aviation service providers.
We believe Singapore equities have bottomed. The risk/reward potential is favourable for Singapore equities as we make the following four arguments: 1. Fund outflows from Singapore equities have significantly slowed down since the second week of April. What this means is that the worst of the sell-off is likely over for local stocks as loose monetary and generous fiscal policies begin to have a positive impact on sentiments and risk assets. In terms of sectors, the banking and property-related stocks (including REITs) were the most heavily sold by institutional investors in March, which is not surprising as these stocks had the highest weight in the benchmarks (STI and MSCI Singapore).
Figure 1: Institutional fund flows in April have calmed down from the sell-
off in March 2020
Source: SGX, KGI Research
A small sample survey of bullish or bearish sentiment from our sales team also showed an even split in terms of the short-term outlook of the stock market, meaning that rationality has returned to markets but generally lacks a strong market sentiment to push markets in either direction. Simply put, we expect equity markets in the short-term to be driven by news flows, which include COVID-19 updates and the upcoming 1Q earnings season. 2. “Peak shutdown” likely priced in. Based on the recovery trend in China, we expect the global “Peak shutdown”, which we define as the maximum amount of disruption caused by the government imposed lockdowns, to abate in 2Q20, and we are confident of a slow recovery from 3Q20 onwards. Singapore’s Ministry of Trade and Industry (MTI) recently downgraded the country’s 2020 economic outlook to a range of -4.0% to -1.0%, from an earlier forecast of -0.5% to -1.5%. This will be the first time since 2001 when Singapore’s economy contracted on a full-year basis. We believe this has been largely priced in by the markets, and hence, underpins our thesis that Singapore’s stock market has bottomed out.
9M 2020 Outlook: Bottom for Singapore equities KGI Singapore Research Team / 65 6202 1194 / [email protected]
9M 2020 Outlook: Bottom for Singapore equities Singapore
April 13, 2020 KGI Securities (Singapore) Pte. Ltd. 2
3. Singapore valuations are cheap and dividend yields are attractive. STI trades with one of the highest dividend yields (>5%), and compares favourably against regional and global peers.
Figure 2: Global Indices - Div yield and P/E
Source: Bloomberg, KGI Research
STI and S-REIT Index valuations and dividend yields are at the most attractive level since the global financial crisis in 2009. The 15-20% decline in STI earnings in 2020, as per Bloomberg consensus estimates, is largely dependent on the COVID-19 outbreak peaking in 2Q20.
Figure 3: STI P/E (2008-2020)
Source: Bloomberg, KGI Research
Figure 4: STI P/B (2008-2020)
Source: Bloomberg, KGI Research
Figure 5: STI Dividend Yield (%)
Source: Bloomberg, KGI Research
4. Stronger SGD going forward. While the SGD had depreciated by as much as 8% against the USD this year, it remains relatively stable when compared to other currencies in Asia. As such, investors looking at Asian equities may prefer investing into Singapore equities, especially as the dividend yield differential for income-producing stocks such as the banks and the REITs becomes too wide to ignore. Furthermore, we expect a reversal of SGD weakness as the freeze of the economy begins to thaw and as global trade starts to recover.
Figure 6: USD/SGD – 5 years. We expect SGD weakness to reverse going
into 2021
Source: Bloomberg, KGI Research
Figure 7: USD/SGD consensus forecast
Forecast 2018 2019 2020F 2021F 2020F
USD/SGD 1.36 1.35 1.40 1.35 1.32
Source: Bloomberg, KGI Research
Bloomberg Ticker Index Year To Date Total Return
(%)
Div Yield
(%)
PE Forward
(%)
AMERICAS
INDU Index DOW JONES INDUS. AVG -16.3 2.7 15.0
SPX Index S&P 500 INDEX -13.2 2.2 16.2
CCMP Index NASDAQ COMPOSITE INDEX -8.8 1.1 20.5
SPTSX Index S&P/TSX COMPOSITE INDEX -16.1 3.8 13.4
IBOV Index BRAZIL IBOVESPA INDEX -32.8 4.5 9.7
EURO
SX5E Index EURO STOXX 50 PR -22.4 3.9 12.0
UKX Index FTSE 100 INDEX -21.7 5.4 11.8
CAC Index CAC 40 INDEX -24.3 3.8 12.4
DAX Index DAX INDEX -20.3 3.5 11.3
ASIA
NKY Index NIKKEI 225 -16.8 2.4 13.6
HSI Index HANG SENG INDEX -13.6 4.0 9.4
SHSZ300 Index CSI 300 INDEX -8.0 2.7 10.0
AS51 Index S&P/ASX 200 INDEX -18.1 4.4 15.6
KOSPI Index KOSPI INDEX -15.3 2.5 8.8
NIFTY Index NIFTY 50 -24.8 2.2 11.8
TWSE Index TAIWAN TAIEX INDEX -15.1 4.2 13.2
JCI Index JAKARTA COMPOSITE INDEX -25.6 3.0 10.5
FBMKLCI Index FTSE BURSA MALAYSIA KLCI -13.2 4.0 13.9
STI Index STRAITS TIMES INDEX STI -19.8 5.1 10.5
PCOMP Index PSEI - PHILIPPINE SE IDX -28.8 2.4 10.5
Commodities: Gold and Oil ............................................................................................................................................................. 6
Buy the dip: Crude oil ................................................................................................................................................................. 7
Hedge against the downturn with gold ...................................................................................................................................... 7
Technology: The ultimate winner post COVID-19 .......................................................................................................................... 9
Western Digital (WDC US) / Not rated ....................................................................................................................................... 9
Microsoft (MSFT US) / Not rated ................................................................................................................................................ 9
Ascott Residence Trust (ART SP) / Not rated ............................................................................................................................ 15
Far East Hospitality Trust (FEHT SP) / Not rated ....................................................................................................................... 15
Aviation: Avoid airlines, but value emerging for service providers .............................................................................................. 16
SIA Engineering (SIE SP) / Not rated ......................................................................................................................................... 17
SATS (SATS SP) / Not rated ....................................................................................................................................................... 18
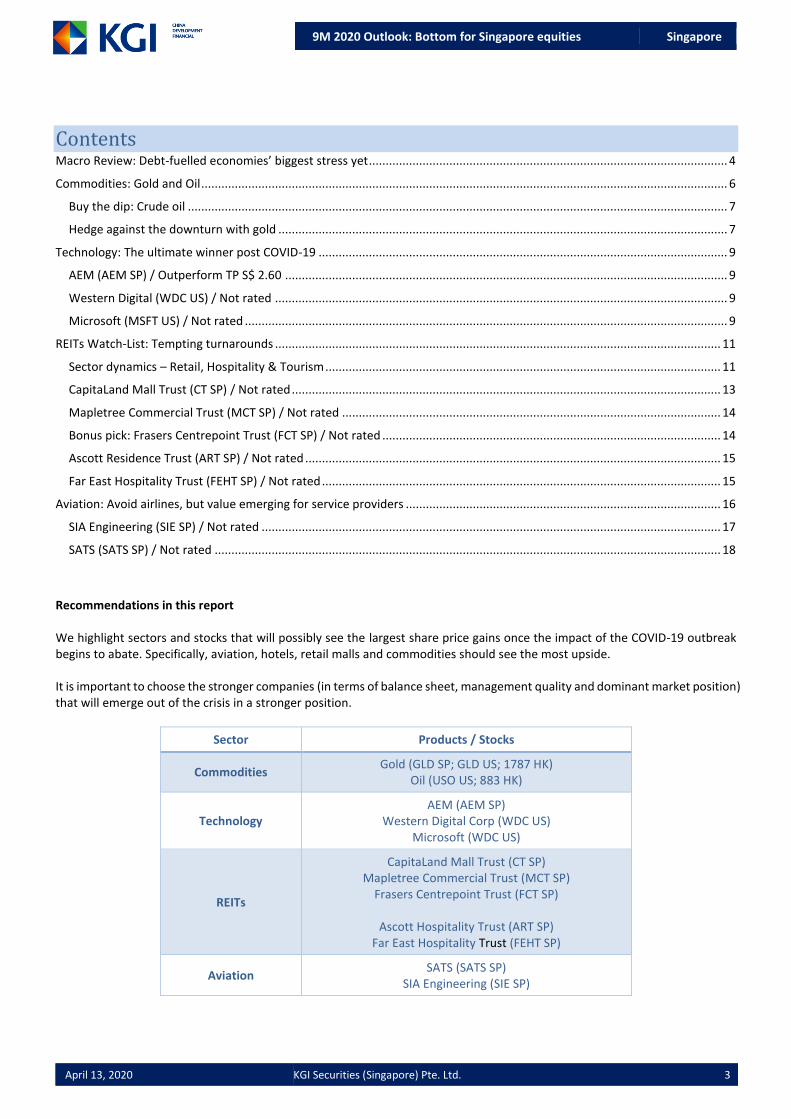
Recommendations in this report We highlight sectors and stocks that will possibly see the largest share price gains once the impact of the COVID-19 outbreak begins to abate. Specifically, aviation, hotels, retail malls and commodities should see the most upside. It is important to choose the stronger companies (in terms of balance sheet, management quality and dominant market position) that will emerge out of the crisis in a stronger position.
Ascott Hospitality Trust (ART SP) Far East Hospitality Trust (FEHT SP)
Aviation SATS (SATS SP)
SIA Engineering (SIE SP)
9M 2020 Outlook: Bottom for Singapore equities Singapore
April 13, 2020 KGI Securities (Singapore) Pte. Ltd. 4
Macro Review: Debt-fuelled economies’ biggest stress yet Unprecedented event. The unprecedented impact on the global economy due to the COVID-19 pandemic has never before been seen in human history, especially against the backdrop of a well-established globalisation trend that has been going on for decades. Before the COVID-19 outbreak started to spread, the world economy has been represented by three lows: low growth, low inflation, and low interest rates following the global financial crisis (GFC). Meanwhile, both the economic and financial systems have also been embracing three highs: high money supply, high debt, and high asset prices (Equities, Bonds, and Real Estate) over the last decade. Diminishing returns from a debt-fuelled economy. The fragility of the global economy was displayed when the outbreak of COVID-19 spread from local (China) to regional (Asia) and ended up going global, which resulted in worldwide lockdown of cities and borders on different draconian levels. The biggest fragility in the current economy is the affordability of pausing productivities and businesses which are mainly fuelled by debt, also known as a debt-driven economy. It is evident that the application of such a growth model has been producing diminishing marginal returns, as observed by the gradually increasing Debt-to-GDP ratios (less output generated per unit of debt). This is undoubtedly an unsustainable strategy in the long term. The rapid market crash in March accentuated the problems with this debt-fuelled model that had prevailed after the GFC, which is mainly that of a liquidity crunch. In financial markets, investors have gotten used to receiving cheap financing and enhancing returns or yields by leverage. The fire-sale was triggered by fears of an economic collapse. Prices of various financial assets took turns to plunge, leading to the explosion of volatility (proxy of risk). Investors, mainly institutions, had to reduce risk exposures by liquidating holdings of assets. The liquidation led to higher volatility which in turn caused more sell-off, and the vicious cycle was established. In the economy, the liquidity shortage proved more destructive. The inflows of income quickly halted for both individuals (unemployment or furlough) and corporates (share decline or suspension of business) but the outflows of expenditure, such as mortgages, rentals, employee compensations, and interest on loans or other debts carried on. The debt-driven model amplifies the impact on both markets because the leverages or debts that accumulated for decades have to be unwound in a short run unexpectedly during the COVID-19 period.
Figure 8: World economy real GDP growth (%)
Source: International Monetary Fund (IMF), KGI Research
Figure 9: World Inflation rate (%)
Source: IMF, KGI Research
Figure 10: Policy rates by major countries
Source: CEIC, KGI Research
9M 2020 Outlook: Bottom for Singapore equities Singapore
April 13, 2020 KGI Securities (Singapore) Pte. Ltd. 5
Central banks to the rescue. Central banks reacted and responded immediately by providing a seemingly effective solution, liquidity injection. Meanwhile, governments also launched the synchronized fiscal stimulus along with the monetary expansion to guarantee sufficient liquidity for the real economy. Those major economies’ bail-out of financial markets and economy is unprecedentedly massive, accounting for a substantial portion of GDP. We summarise the similarities in these stimulus packages and review them in the tables on the right. In fact, the overall measures are short-term and are meant to buffer the near-term downturn of the economy. In other words, the authorities are buying time to contain the COVID-19 and restore the economy, and 2Q20 is a critical window for such implementations.
Figure 11: M2 supply growth by major countries (%)
Source: CEIC, KGI Research
Figure 12: Total debt-to-GDP (%)
Source: BIS, KGI Research
Figure 13: Debt servicing ratio of private non-financial sector by countries
Source: BIS, KGI Research
Figure 14: Stimulus packages announced by various countries
US Funding facilitates, Unlimited QE and Coronavirus stimulus bill: around US$8.3tn
39
17th March France Business support measures: EUR345bn (US$377)
15
18th March EU Pandemic Emergency Purchase Programme: EUR750bn (USD820bn)
4
20th March UK Coronavirus business support: GBP350bn (USD430bn)
15
23rd March Germany Stimulus package: EUR356bn (USD437bn) (Preliminary estimated)
10
7th April Japan Stimulus package: JPY108tn (USD990bn)
20
Source: KGI Research
Figure 15: Analysing the effectiveness and sustainability of the stimulus
measures
Stimulus dissection
Effectiveness Sustainability Impact
Stabilise financial markets by upholding asset prices via direct purchase
Immediate. Equity and bond prices bottomed out within one or two weeks. Fear and bearish sentiments are reversed to some extent
Medium to long term, depending on the discretion of the central banks
The deviation between prices and fundamentals widens. Volatility increases due to more speculations on the distortion of asset valuation.
Avoid corporate failures by extending loans, offering tax refunds, and granting extra subsidies
Short-lived. Corporates have some reliefs over some fixed-cost expenditures during the lockdown period.
Short-lived. The aids are structured to enable corporates to get through the pandemic period which is estimated to be one quarter.
The short-term pain is mitigated but corporates could bear more debt burden onwards.
Support individuals by providing direct compensation
Immediate. The compensation is equivalent to offering discounts for some bills like mortgage, rentals, utilities, and food and so forth.
Short-lived. The compensation are only enough to cover the expenditure of low-income individuals for a few weeks.
It temporarily relieves the pressure of potential social unrest.
Source: KGI Research
9M 2020 Outlook: Bottom for Singapore equities Singapore
April 13, 2020 KGI Securities (Singapore) Pte. Ltd. 6
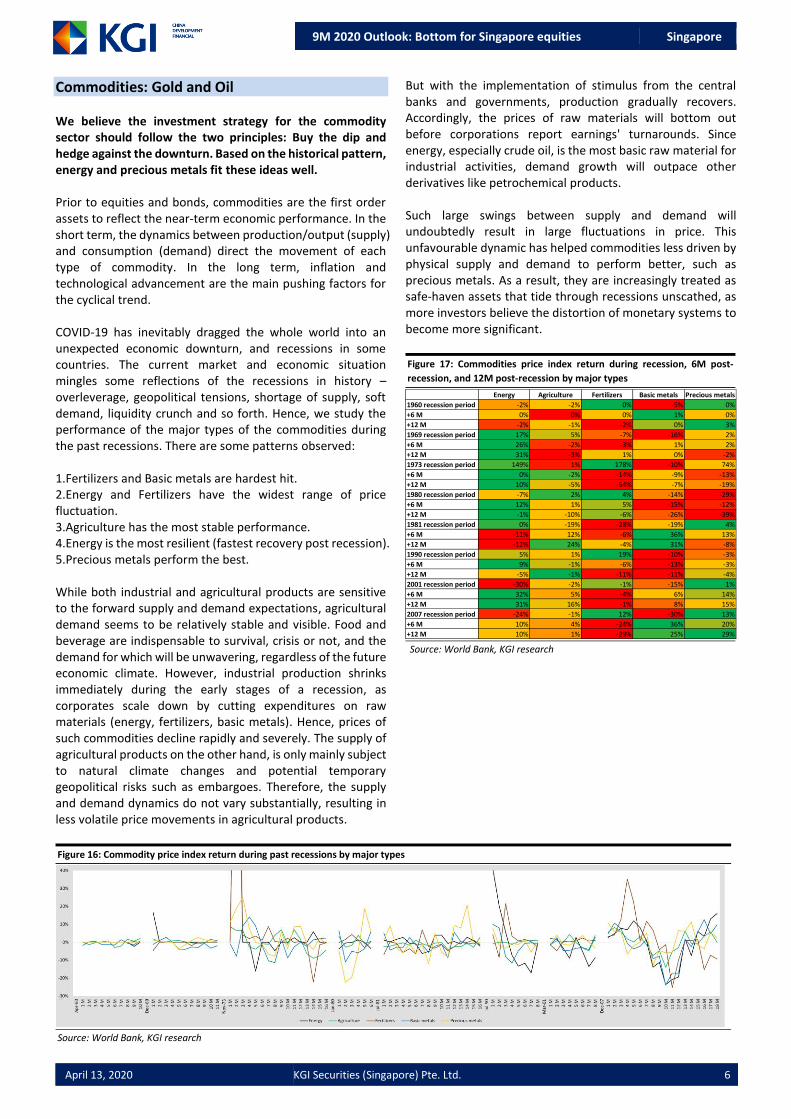
Commodities: Gold and Oil We believe the investment strategy for the commodity sector should follow the two principles: Buy the dip and hedge against the downturn. Based on the historical pattern, energy and precious metals fit these ideas well. Prior to equities and bonds, commodities are the first order assets to reflect the near-term economic performance. In the short term, the dynamics between production/output (supply) and consumption (demand) direct the movement of each type of commodity. In the long term, inflation and technological advancement are the main pushing factors for the cyclical trend. COVID-19 has inevitably dragged the whole world into an unexpected economic downturn, and recessions in some countries. The current market and economic situation mingles some reflections of the recessions in history – overleverage, geopolitical tensions, shortage of supply, soft demand, liquidity crunch and so forth. Hence, we study the performance of the major types of the commodities during the past recessions. There are some patterns observed: 1.Fertilizers and Basic metals are hardest hit. 2.Energy and Fertilizers have the widest range of price fluctuation. 3.Agriculture has the most stable performance. 4.Energy is the most resilient (fastest recovery post recession). 5.Precious metals perform the best. While both industrial and agricultural products are sensitive to the forward supply and demand expectations, agricultural demand seems to be relatively stable and visible. Food and beverage are indispensable to survival, crisis or not, and the demand for which will be unwavering, regardless of the future economic climate. However, industrial production shrinks immediately during the early stages of a recession, as corporates scale down by cutting expenditures on raw materials (energy, fertilizers, basic metals). Hence, prices of such commodities decline rapidly and severely. The supply of agricultural products on the other hand, is only mainly subject to natural climate changes and potential temporary geopolitical risks such as embargoes. Therefore, the supply and demand dynamics do not vary substantially, resulting in less volatile price movements in agricultural products.
Figure 16: Commodity price index return during past recessions by major types
Source: World Bank, KGI research
But with the implementation of stimulus from the central banks and governments, production gradually recovers. Accordingly, the prices of raw materials will bottom out before corporations report earnings' turnarounds. Since energy, especially crude oil, is the most basic raw material for industrial activities, demand growth will outpace other derivatives like petrochemical products. Such large swings between supply and demand will undoubtedly result in large fluctuations in price. This unfavourable dynamic has helped commodities less driven by physical supply and demand to perform better, such as precious metals. As a result, they are increasingly treated as safe-haven assets that tide through recessions unscathed, as more investors believe the distortion of monetary systems to become more significant.
Figure 17: Commodities price index return during recession, 6M post-
recession, and 12M post-recession by major types
Source: World Bank, KGI research
Energy Agriculture Fertilizers Basic metals Precious metals
1960 recession period -2% -2% 0% -5% 0%
+6 M 0% 0% 0% 1% 0%
+12 M -2% -1% -2% 0% 3%
1969 recession period 17% 5% -7% -16% 2%
+6 M 26% -2% -3% 1% 2%
+12 M 31% -3% 1% 0% -2%
1973 recession period 149% 1% 178% -10% 74%
+6 M 0% -2% -14% -9% -13%
+12 M 10% -5% -54% -7% -19%
1980 recession period -7% 2% 4% -14% -29%
+6 M 12% 1% 5% -15% -12%
+12 M -1% -10% -6% -26% -39%
1981 recession period 0% -19% -28% -19% 4%
+6 M -11% 12% -6% 36% 13%
+12 M -12% 24% -4% 31% -8%
1990 recession period 5% 1% 19% -10% -3%
+6 M 9% -1% -6% -13% -3%
+12 M -5% -1% -11% -11% -4%
2001 recession period -30% -2% -1% -15% 1%
+6 M 32% 5% -4% 6% 14%
+12 M 31% 16% -1% 8% 15%
2007 recession period -24% -1% 12% -30% 13%
+6 M 10% 4% -24% 36% 20%
+12 M 10% 1% -29% 25% 29%
9M 2020 Outlook: Bottom for Singapore equities Singapore
April 13, 2020 KGI Securities (Singapore) Pte. Ltd. 7
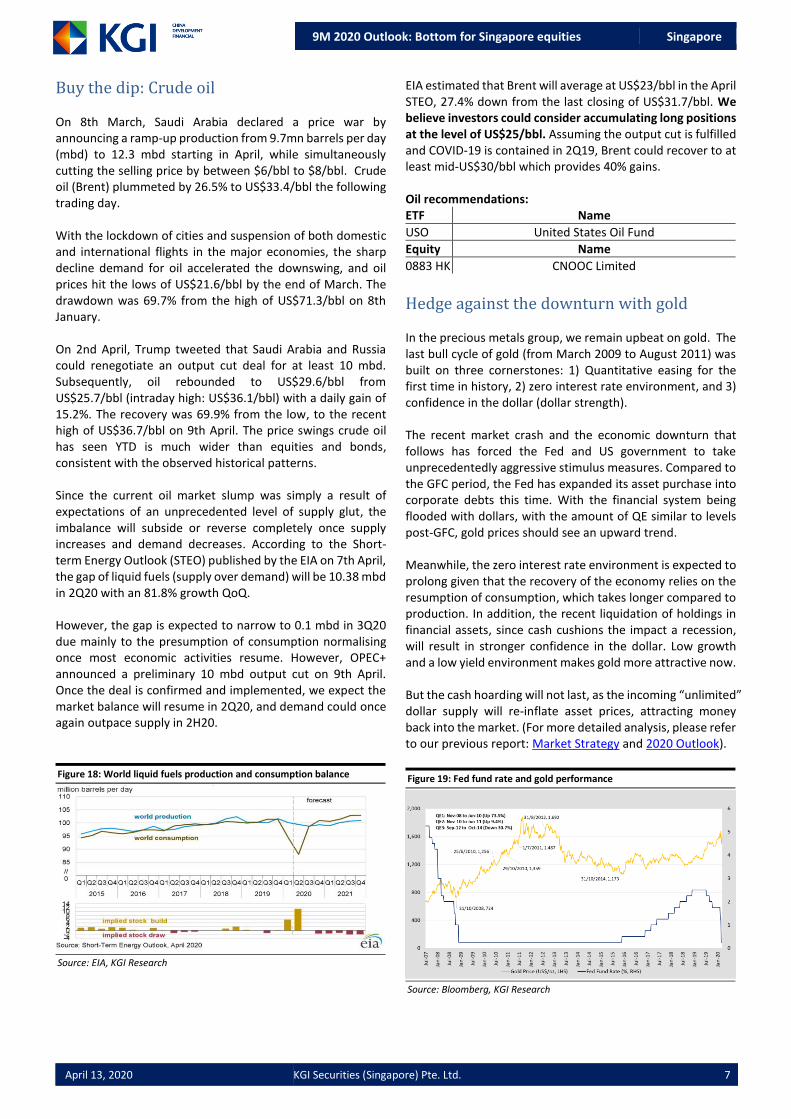
Buy the dip: Crude oil On 8th March, Saudi Arabia declared a price war by announcing a ramp-up production from 9.7mn barrels per day (mbd) to 12.3 mbd starting in April, while simultaneously cutting the selling price by between $6/bbl to $8/bbl. Crude oil (Brent) plummeted by 26.5% to US$33.4/bbl the following trading day. With the lockdown of cities and suspension of both domestic and international flights in the major economies, the sharp decline demand for oil accelerated the downswing, and oil prices hit the lows of US$21.6/bbl by the end of March. The drawdown was 69.7% from the high of US$71.3/bbl on 8th January. On 2nd April, Trump tweeted that Saudi Arabia and Russia could renegotiate an output cut deal for at least 10 mbd. Subsequently, oil rebounded to US$29.6/bbl from US$25.7/bbl (intraday high: US$36.1/bbl) with a daily gain of 15.2%. The recovery was 69.9% from the low, to the recent high of US$36.7/bbl on 9th April. The price swings crude oil has seen YTD is much wider than equities and bonds, consistent with the observed historical patterns. Since the current oil market slump was simply a result of expectations of an unprecedented level of supply glut, the imbalance will subside or reverse completely once supply increases and demand decreases. According to the Short-term Energy Outlook (STEO) published by the EIA on 7th April, the gap of liquid fuels (supply over demand) will be 10.38 mbd in 2Q20 with an 81.8% growth QoQ. However, the gap is expected to narrow to 0.1 mbd in 3Q20 due mainly to the presumption of consumption normalising once most economic activities resume. However, OPEC+ announced a preliminary 10 mbd output cut on 9th April. Once the deal is confirmed and implemented, we expect the market balance will resume in 2Q20, and demand could once again outpace supply in 2H20.
Figure 18: World liquid fuels production and consumption balance
Source: EIA, KGI Research
EIA estimated that Brent will average at US$23/bbl in the April STEO, 27.4% down from the last closing of US$31.7/bbl. We believe investors could consider accumulating long positions at the level of US$25/bbl. Assuming the output cut is fulfilled and COVID-19 is contained in 2Q19, Brent could recover to at least mid-US$30/bbl which provides 40% gains. Oil recommendations: ETF Name
USO United States Oil Fund
Equity Name
0883 HK CNOOC Limited
Hedge against the downturn with gold In the precious metals group, we remain upbeat on gold. The last bull cycle of gold (from March 2009 to August 2011) was built on three cornerstones: 1) Quantitative easing for the first time in history, 2) zero interest rate environment, and 3) confidence in the dollar (dollar strength). The recent market crash and the economic downturn that follows has forced the Fed and US government to take unprecedentedly aggressive stimulus measures. Compared to the GFC period, the Fed has expanded its asset purchase into corporate debts this time. With the financial system being flooded with dollars, with the amount of QE similar to levels post-GFC, gold prices should see an upward trend. Meanwhile, the zero interest rate environment is expected to prolong given that the recovery of the economy relies on the resumption of consumption, which takes longer compared to production. In addition, the recent liquidation of holdings in financial assets, since cash cushions the impact a recession, will result in stronger confidence in the dollar. Low growth and a low yield environment makes gold more attractive now. But the cash hoarding will not last, as the incoming “unlimited” dollar supply will re-inflate asset prices, attracting money back into the market. (For more detailed analysis, please refer to our previous report: Market Strategy and 2020 Outlook).
9M 2020 Outlook: Bottom for Singapore equities Singapore
April 13, 2020 KGI Securities (Singapore) Pte. Ltd. 8
Figure 20: Fed asset expansion and gold performance
Source: Bloomberg, KGI Research
Gold is currently trading at around US$1,680/oz. The resistance level seems to be US$1,700/oz and US$1,800/oz on its way back to historical high of US$1,900/oz, while the support level is US$1,475/oz. Our target price for gold is an all-time high of US1,900/oz. Gold recommendations:
ETF Name
GLD SPDR® Gold Shares
GDX VanEck Vectors Gold Miners ETF
GDXJ VanEck Vectors Junior Gold Miners
Equity Name
1787 HK Shandong Gold Mining Co Ltd
9M 2020 Outlook: Bottom for Singapore equities Singapore
April 13, 2020 KGI Securities (Singapore) Pte. Ltd. 9
Technology: The ultimate winner post COVID-19 While COVID-19 has had the biggest impact on transport, hospitality and tourism related stocks, tech and semiconductors companies were not spared from the sell-off. While NASDAQ and SOX fell the most during the 3-4 week sell-off, they have recovered much more quickly as well. NASDAQ is 11% off the peak while SOX is now down about 19% from its peak. We note that during the 07-08 GFC, SOX declined faster and further than other major US indices, similar to the initial sell-off wave of this COVID-19 correction.
Figure 21: Peak to Trough comparison between previous sell-down periods
against Semi and Semi Cap sales contraction
Source: Bloomberg, KGI Research
Fundamentally, the impact of COVID-19 is now estimated to extend beyond supply chain delays. IDC reduced 2020 IT spending forecast by 7%, from +4.3% to -2.9% YoY, as companies are likely to tighten their purses and push back non-essential spending and upgrades. This is despite increased sales of monitors and laptops to facilitate ‘Work from Home’ initiatives, and strong demand for cloud computing and data centre related semiconductors. The supply chain delays have also created a price distortion in the market – unit shipments are down 20% while prices are up more than 20% over the past 8 weeks, according to VLSI’s Coronavirus Semiconductor Market Watch. The confluence of events has created pessimism in semiconductors’ intended sales recovery in 2020. Gartner and IDC have both reduced their 2020 semiconductor sales estimate, and expect semi revenue to drop by 4% and 6% YoY respectively in 2020. VLSI’s latest semiconductor forecast update includes a worst-case scenario of a -20% yoy drop in worldwide semiconductor revenue. However, mixed signals continue to be sent, as China’s economy recovers. Qualcomm CEO commented that China’s demand has returned to normal and they are able to commit to their dividend, while Western Digital’s CEO echoed similar sentiments. Micron has also provided strong forward quarterly guidance in spite of the current coronavirus situation, and Samsung reported early 1Q20 guidance with better-than-expected results, hinting towards strong semiconductor sales that propped up weakness in their consumer division.
In the current economic climate, we recommend data centric plays that will see boons from the current crisis. We think companies within these thematics will have the best revenue visibility and outlook, amidst the poor economic backdrop.
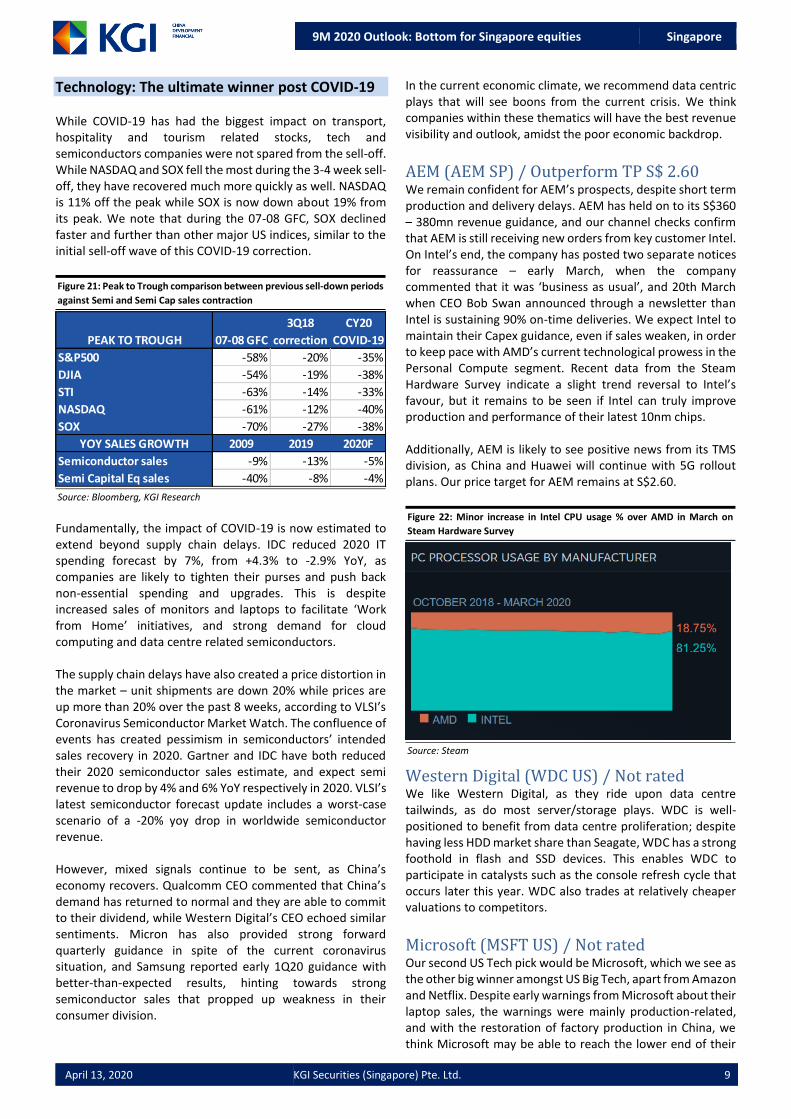
AEM (AEM SP) / Outperform TP S$ 2.60 We remain confident for AEM’s prospects, despite short term production and delivery delays. AEM has held on to its S$360 – 380mn revenue guidance, and our channel checks confirm that AEM is still receiving new orders from key customer Intel. On Intel’s end, the company has posted two separate notices for reassurance – early March, when the company commented that it was ‘business as usual’, and 20th March when CEO Bob Swan announced through a newsletter than Intel is sustaining 90% on-time deliveries. We expect Intel to maintain their Capex guidance, even if sales weaken, in order to keep pace with AMD’s current technological prowess in the Personal Compute segment. Recent data from the Steam Hardware Survey indicate a slight trend reversal to Intel’s favour, but it remains to be seen if Intel can truly improve production and performance of their latest 10nm chips. Additionally, AEM is likely to see positive news from its TMS division, as China and Huawei will continue with 5G rollout plans. Our price target for AEM remains at S$2.60.
Figure 22: Minor increase in Intel CPU usage % over AMD in March on
Steam Hardware Survey
Source: Steam
Western Digital (WDC US) / Not rated We like Western Digital, as they ride upon data centre tailwinds, as do most server/storage plays. WDC is well-positioned to benefit from data centre proliferation; despite having less HDD market share than Seagate, WDC has a strong foothold in flash and SSD devices. This enables WDC to participate in catalysts such as the console refresh cycle that occurs later this year. WDC also trades at relatively cheaper valuations to competitors.
Microsoft (MSFT US) / Not rated Our second US Tech pick would be Microsoft, which we see as the other big winner amongst US Big Tech, apart from Amazon and Netflix. Despite early warnings from Microsoft about their laptop sales, the warnings were mainly production-related, and with the restoration of factory production in China, we think Microsoft may be able to reach the lower end of their
PEAK TO TROUGH 07-08 GFC
3Q18
correction
CY20
COVID-19
S&P500 -58% -20% -35%
DJIA -54% -19% -38%
STI -63% -14% -33%
NASDAQ -61% -12% -40%
SOX -70% -27% -38%
YOY SALES GROWTH 2009 2019 2020F
Semiconductor sales -9% -13% -5%
Semi Capital Eq sales -40% -8% -4%
9M 2020 Outlook: Bottom for Singapore equities Singapore
April 13, 2020 KGI Securities (Singapore) Pte. Ltd. 10
quarterly guidance. Additionally, we see Microsoft’s software suite, specifically Microsoft Mixer and Microsoft Teams, to see increased usage in the current lockdown situation. In the longer term, we think COVID-19 could catalyse the shift of companies towards Microsoft Azure and other portions of Microsoft’s cloud computing suite. Our only gripe is that recent price recoveries have brought MSFT above 30x P/E, which is above their +1 S.D. MSFT’s shares have found a support around 25x P/E, which was the trough during the February/March sell-off period and also during the 4Q18 contraction period.
Figure 23: MSFT 5-year P/E valuation chart
Source: Bloomberg, KGI Research
Figure 24: MSFT 10-year P/E valuation chart
Source: Bloomberg, KGI Research
Figure 25: AEM and back-end test equipment makers’ peer comparison
9M 2020 Outlook: Bottom for Singapore equities Singapore
April 13, 2020 KGI Securities (Singapore) Pte. Ltd. 11
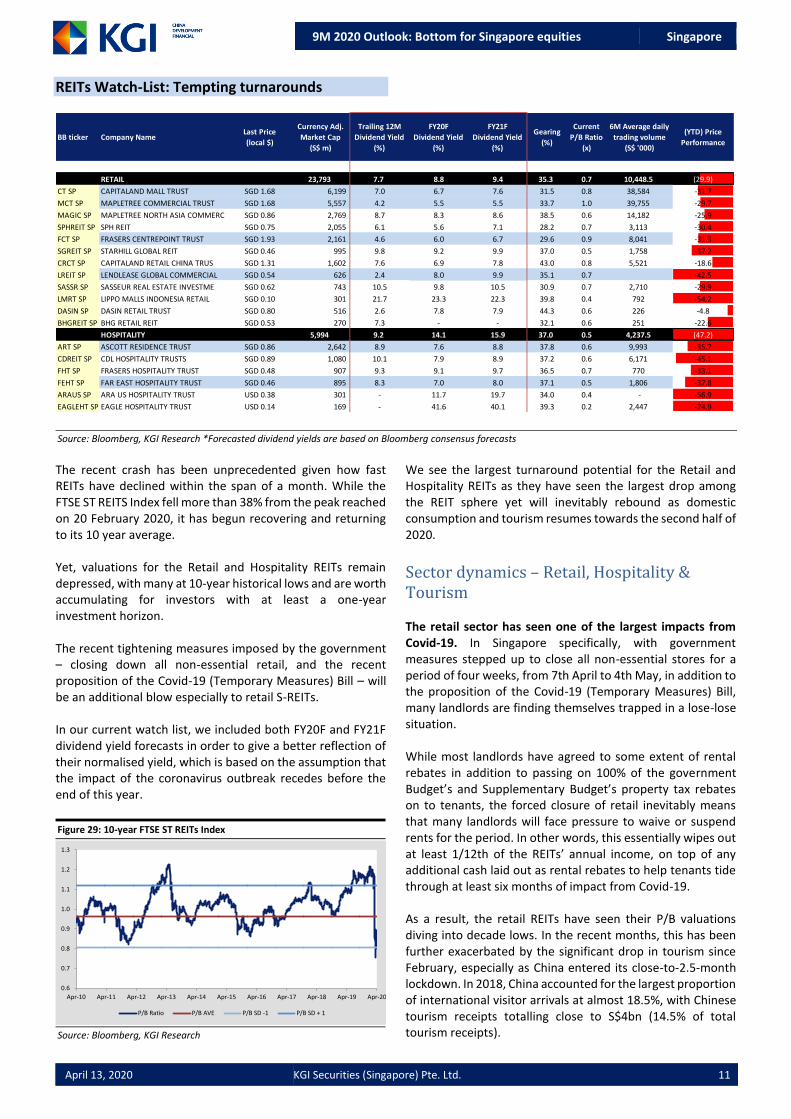
REITs Watch-List: Tempting turnarounds
The recent crash has been unprecedented given how fast REITs have declined within the span of a month. While the FTSE ST REITS Index fell more than 38% from the peak reached on 20 February 2020, it has begun recovering and returning to its 10 year average. Yet, valuations for the Retail and Hospitality REITs remain depressed, with many at 10-year historical lows and are worth accumulating for investors with at least a one-year investment horizon. The recent tightening measures imposed by the government – closing down all non-essential retail, and the recent proposition of the Covid-19 (Temporary Measures) Bill – will be an additional blow especially to retail S-REITs. In our current watch list, we included both FY20F and FY21F dividend yield forecasts in order to give a better reflection of their normalised yield, which is based on the assumption that the impact of the coronavirus outbreak recedes before the end of this year.
Figure 29: 10-year FTSE ST REITs Index
Source: Bloomberg, KGI Research
We see the largest turnaround potential for the Retail and Hospitality REITs as they have seen the largest drop among the REIT sphere yet will inevitably rebound as domestic consumption and tourism resumes towards the second half of 2020.
Sector dynamics – Retail, Hospitality & Tourism The retail sector has seen one of the largest impacts from Covid-19. In Singapore specifically, with government measures stepped up to close all non-essential stores for a period of four weeks, from 7th April to 4th May, in addition to the proposition of the Covid-19 (Temporary Measures) Bill, many landlords are finding themselves trapped in a lose-lose situation. While most landlords have agreed to some extent of rental rebates in addition to passing on 100% of the government Budget’s and Supplementary Budget’s property tax rebates on to tenants, the forced closure of retail inevitably means that many landlords will face pressure to waive or suspend rents for the period. In other words, this essentially wipes out at least 1/12th of the REITs’ annual income, on top of any additional cash laid out as rental rebates to help tenants tide through at least six months of impact from Covid-19. As a result, the retail REITs have seen their P/B valuations diving into decade lows. In the recent months, this has been further exacerbated by the significant drop in tourism since February, especially as China entered its close-to-2.5-month lockdown. In 2018, China accounted for the largest proportion of international visitor arrivals at almost 18.5%, with Chinese tourism receipts totalling close to S$4bn (14.5% of total tourism receipts).
9M 2020 Outlook: Bottom for Singapore equities Singapore
April 13, 2020 KGI Securities (Singapore) Pte. Ltd. 12
Tourism to take a hit. On March 24th 2020, Singapore dealt another blow to its hospitality and tourism industry – it closed its borders to all tourists and short-term visitors, and there has been no end-date to the closure announced or proposed as of yet.
Figure 30: Singapore 2018 tourism receipts, by country
Source: Singapore Tourism Board, SingStat, KGI Research
Tourism receipts in 2018 totalled close to S$27bn, and we expect a significant proportion of that to be wiped out in 2020, at least a 70% drop, assuming borders are closed for three months – from March 24th to earliest in June – as Singapore stabilises and contains the Covid-19 spread. Even then, many countries may still be reeling from the economic, financial, and psychological impacts of the virus, and we may not see as quick a resumption in tourism as we did back in 2003 during the SARS outbreak.
Figure 31: Singapore international visitor arrivals (Jun ’02 to Jul ’04)
Source: Singapore Tourism Board, SingStat, KGI Research
International visitor arrivals dipped 70% from March 2003 to May 2003 (the peak of SARS), but recovered in a V-shape by July 2003. However, despite SARS’s higher mortality rate, the higher transmission rate of Covid-19 may prove to be ‘deadlier’ to the economy and financial markets, as governments around the world essentially shut down everything. Post Covid-19, many may also find themselves not in a financial position to spend on overseas travel, or may still be hesitant about (if governments are not still discouraging) air travel in fear of recurrence of the virus, for an additional three to six months. Even then, we do not expect tourism to return fully to normalcy till mid-2021.
But hospitality not directly correlated to tourism. The hospitality sector however, may see a slightly brighter horizon than tourism. For smaller chains or boutique hotels, they may have received lodging requests from Malaysians working in Singapore, as Malaysia is undergoing strict lockdowns. On the other end of the spectrum, the Singapore government has apparently booked more than 7,500 hotel rooms and serviced apartments, mostly located in the central region, as dedicated facilities for returning Singaporeans and Long-Term Visit Pass (LTVP) holders to serve their immediate 14-day Stay-at-Home Notice (SHN), according to SRX. Similarly across the world, from Spain to Australia to the Unites States, many empty hotels are being converted into ‘hospitals’ for coronavirus patients with mild symptoms, others into safe houses for those in isolation or quarantine. While it is unknown whether average daily rates at these hotels have been discounted, and to what extent, for government bookings and Covid-19 self-quarantine patients, they do inevitably help bolster the impact of zero tourism. In addition, full-service hotels with room service may also receive additional income from providing ‘guests’ with three meals a day. All in all, we find the hospitality and tourism stocks to be a more suited to investors with a longer term horizon, of at least 1 year. Singapore is and has been a top tourist destination, especially in Southeast Asia, well-known for our first-class amenities, transport systems, airlines, food and hawker centres, and unique attractions (i.e. MBS, Esplanade, Gardens by the Bay). Once travel restrictions are lifted and people re-gain the confidence to travel, the hospitality and tourism sectors are bound to benefit from pent-up demand. Retail to be revived by domestic demand. Accordingly, we find that the retail REITs should turnaround much quicker in comparison to hospitality/tourism, as they may be revived by a resumption in domestic demand that may reach multi-year peaks especially with much pent-up demand from retail closures and circuit-breaker measures that are in place for at least four weeks. In both sectors, we expect P/B valuations to return to 10-year averages once life begins to resemble normalcy again, post Covid-19. We also prefer companies with quality assets, strong balance sheets and/or sponsor support, to ensure minimal impact on shareholder values. There is also a need to watch out for falling property prices, due to the declines in net operating income (NOI), as they may result in undesirable increases in gearing above MAS’s limit of 45%. However, at the same time, we are expecting a slight decrease in capitalisation rates due to falling interest rates, and this could potentially offset any declines in NOI in the calculation of property values.
14.5%
10.6%
6.5%
4.8%
4.1%3.1
%
2.7
%
2.5
%
2.5
%
2.5
%
46.2%China
Indonesia
India
Australia
Japan
Malaysia
USA
Philippines
Vietnam
South Korea
Others
0.00
0.20
0.40
0.60
0.80
Jul-0
2
Aug-
02
Sep-
02
Oct
-02
Nov
-02
Dec
-02
Jan-
03
Feb-
03
Mar
-03
Apr-
03
May
-03
Jun-
03
Jul-0
3
Aug-
03
Sep-
03
Oct
-03
Nov
-03
Dec
-03
Jan-
04
Feb-
04
Mar
-04
Apr-
04
May
-04
Jun-
04
Inte
rnat
iona
l Vis
itor A
rriv
als
('mn)
9M 2020 Outlook: Bottom for Singapore equities Singapore
April 13, 2020 KGI Securities (Singapore) Pte. Ltd. 13
Figure 32: Effect of NOI and cap rate on property values
Source: KGI Research
Figure 33: 10-year US Treasury yield & cap rates by property type
Source: Schroders, Bloomberg, KGI Research
Base case scenario. We are expecting a 30-50% cut across the board in distributions. This is supported by the mounting additional cash outlay required for rental reliefs, waivers and suspensions in Retail, while Hospitality will see an overall plunge in revenues. Along with a probable want to keep cash on hand for unforeseen working capital requirements, we think that payout ratios will drop from 100% to 90%. However, we believe that DPUs should revert by 2021-2022.
Retail REITs picks
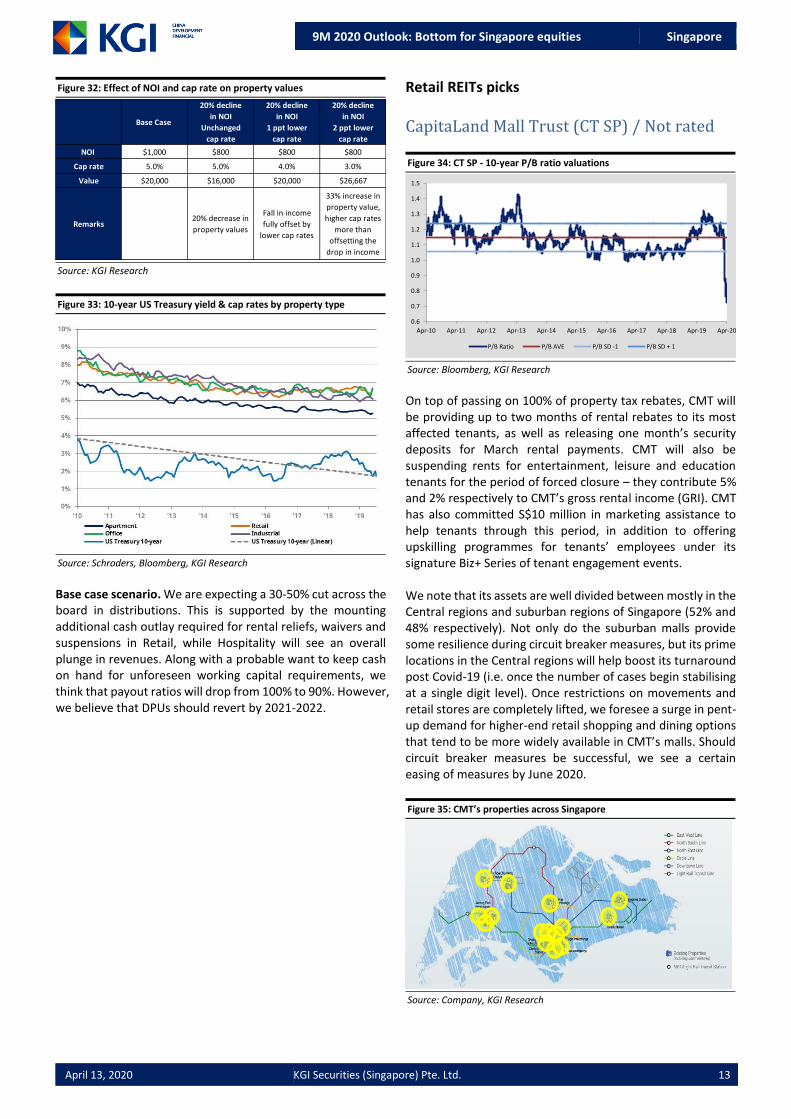
CapitaLand Mall Trust (CT SP) / Not rated
Figure 34: CT SP - 10-year P/B ratio valuations
Source: Bloomberg, KGI Research
On top of passing on 100% of property tax rebates, CMT will be providing up to two months of rental rebates to its most affected tenants, as well as releasing one month’s security deposits for March rental payments. CMT will also be suspending rents for entertainment, leisure and education tenants for the period of forced closure – they contribute 5% and 2% respectively to CMT’s gross rental income (GRI). CMT has also committed S$10 million in marketing assistance to help tenants through this period, in addition to offering upskilling programmes for tenants’ employees under its signature Biz+ Series of tenant engagement events. We note that its assets are well divided between mostly in the Central regions and suburban regions of Singapore (52% and 48% respectively). Not only do the suburban malls provide some resilience during circuit breaker measures, but its prime locations in the Central regions will help boost its turnaround post Covid-19 (i.e. once the number of cases begin stabilising at a single digit level). Once restrictions on movements and retail stores are completely lifted, we foresee a surge in pent-up demand for higher-end retail shopping and dining options that tend to be more widely available in CMT’s malls. Should circuit breaker measures be successful, we see a certain easing of measures by June 2020.
9M 2020 Outlook: Bottom for Singapore equities Singapore
April 13, 2020 KGI Securities (Singapore) Pte. Ltd. 14
Further, we note that should the proposed merger with CapitaLand Commercial Trust go through succeed, CapitaLand Integrated Commercial Trust (CICT) will be the largest REIT in Singapore, and the third-largest in Asia-Pacific. Higher trading liquidity and a potential for positive re-rating could also bring a more competitive cost of capital for CICT.
Mapletree Commercial Trust (MCT SP) / Not rated
Figure 36: MCT SP – Historical P/B ratio valuations
Source: Bloomberg, KGI Research
MCT has provided for S$29 million in cash as rental rebates for all its retail partners, in addition to the 100% of the government property tax rebates. In total, it should offset up to 2 months of rent for its worst-hit tenants, including those in other properties (besides VivoCity) that have not qualified for property tax rebates. Essentially, MCT’s aid reaches out to all its retail tenants, not just those in VivoCity. As of 4Q19/20, S$8 million has been granted to VivoCity, and will be reflected in its upcoming 4Q/full year results. We note that MCT seems to be undervalued at current prices, as we see significant upsides in the coming years due to the development of the Greater Southern Waterfront (GSW) that has been announced and proposed in 2019. Not only will Keppel Golf Club be redeveloped into 9,000 public and private homes with new MRT lines serving the GSW, but there are plans for Brani Terminal to be converted into a ‘second Sentosa’, with confirmed leisure attractions, nature parks and trails that will link multiple other parks, trails and reserves. The most noteworthy planned trail is Pasir Panjang Linear Park, a coastal trail linking Labrador Nature Reserve and West Coast Park – potentially mimicking the likes of East Coast Park. With a strong fundamental foothold in the GSW area, MCT’s Mapletree Business City, PSA Building, Bank of America Merrill Lunch HarbourFront and Vivocity, are poised to benefit from the developments bringing a new surge in residential population and vibrancy in just a few years. Whille DPU and revenues may temporarily be dislodged for 2020, we believe there may be significant upsides from 2021 post Covid-19.
Figure 37: MCT’s properties in the GSW area
Source: Company, KGI Research
Bonus pick: Frasers Centrepoint Trust (FCT SP) / Not rated
Figure 38: FCT SP – 10-year P/B ratio valuations
Source: Bloomberg, KGI Research
In addition to rental rebates amounting to S$45 million, FCT (in conjunction with Frasers Property Retail) tenants will receive 100% of property tax rebates, and cash security deposits will also be released to offset one month’s worth of rental payments. In essence, tenants who are most impacted will have their rents fully offset for the months of April and May. Those affected by Government-imposed closures will receive a one-month rental waiver. We note that its Tenant Support Package covers 14 malls – all 12 held under FCT, Eastpoint Mall and The Centrepoint. All of FCT’s properties are located in the suburban regions, on or near MRT stations and/or bus interchanges. This provides much needed defensiveness especially in times where movements are restricted or minimised, as those in the surrounding residential areas will favour malls that are nearby for their daily essentials – food, groceries, essential services from banking to haircuts, and small discretionary shopping. Most of its properties are also concentrated in the north and north-east regions, where retail space per capita is below the national average. This implies a greater opportunity for increased footfall, especially with the numerous developments that have been penned for the regions – from growth of HDB towns in Punggol to the new Thomson-East Coast line terminating in Woodlands and Woodlands North.
9M 2020 Outlook: Bottom for Singapore equities Singapore
April 13, 2020 KGI Securities (Singapore) Pte. Ltd. 15
Figure 39: FCT’s properties across Singapore
Source: Company, KGI Research
*Map does not include The Centrepoint or Eastpoint Mall, which are retail properties owned by Frasers Property Limited.
Hospitality REIT Picks
Ascott Residence Trust (ART SP) / Not rated
Figure 40: 11: ART SP – 10-year P/B ratio valuations
Source: Bloomberg, KGI Research
A member of CapitaLand, ART’s portfolio of 87 properties and over 16,000 apartment units, spans across 15 countries. Its properties consists of serviced residences (SRs), hotels, rental housing and co-living properties, all operating under established brands such as Citadines, Somerset Serviced Residence, and Quest Apartment Hotel. More than 50% of their assets are freehold, with excellent geographical and income diversification.
ART’s positioning in the SRs space attracting largely corporate guests, provides some defensiveness during a time where leisure travel, domestic or international, has come to a screeching halt. While movements may be restricted with many countries currently on partial to full lockdowns, we think that business travel will be first to rebound as soon as restrictions see some easing. The Singapore government has also provided for 30% property tax rebates for the accommodation and function room components of licensed hotels and serviced apartments. Singapore accounts for 10% of ART’s total gross profit, while Australia (7%), China (8%), France (12%), Japan (11%), UK (11%), US (16%) and Vietnam (9%) make up for a total of 74% of total gross profits.
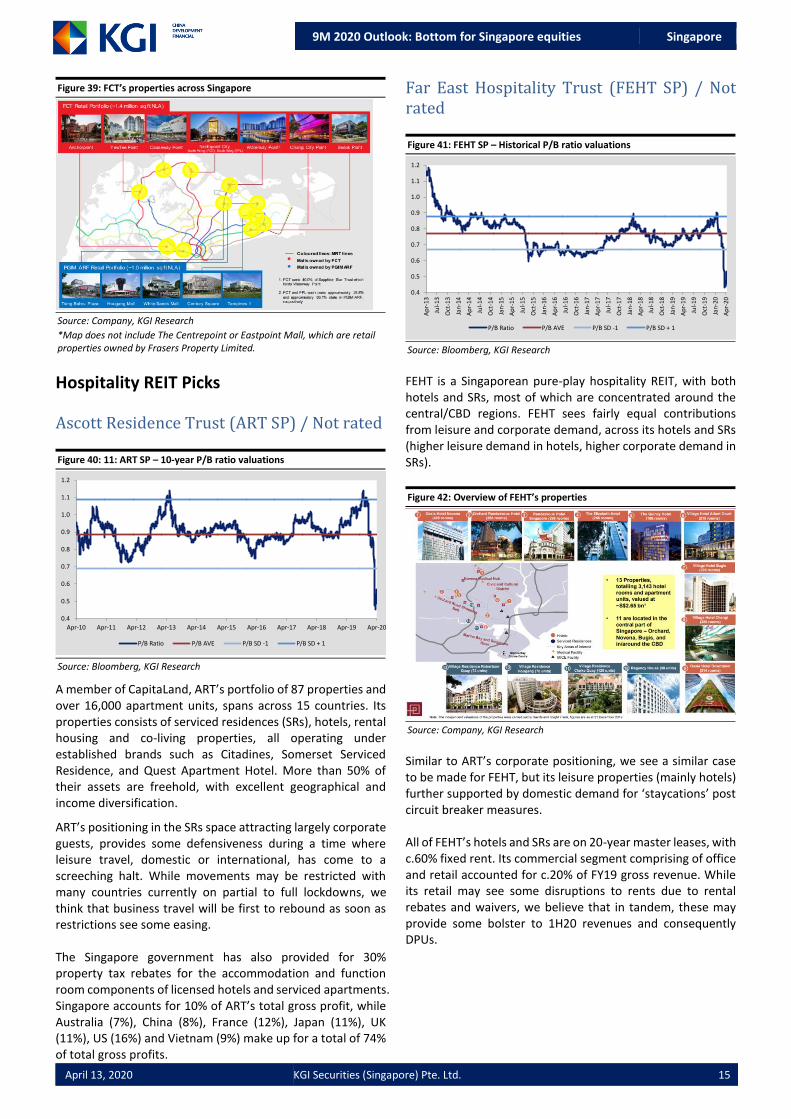
Far East Hospitality Trust (FEHT SP) / Not rated
Figure 41: FEHT SP – Historical P/B ratio valuations
Source: Bloomberg, KGI Research
FEHT is a Singaporean pure-play hospitality REIT, with both hotels and SRs, most of which are concentrated around the central/CBD regions. FEHT sees fairly equal contributions from leisure and corporate demand, across its hotels and SRs (higher leisure demand in hotels, higher corporate demand in SRs).
Figure 42: Overview of FEHT’s properties
Source: Company, KGI Research
Similar to ART’s corporate positioning, we see a similar case to be made for FEHT, but its leisure properties (mainly hotels) further supported by domestic demand for ‘staycations’ post circuit breaker measures. All of FEHT’s hotels and SRs are on 20-year master leases, with c.60% fixed rent. Its commercial segment comprising of office and retail accounted for c.20% of FY19 gross revenue. While its retail may see some disruptions to rents due to rental rebates and waivers, we believe that in tandem, these may provide some bolster to 1H20 revenues and consequently DPUs.
9M 2020 Outlook: Bottom for Singapore equities Singapore
April 13, 2020 KGI Securities (Singapore) Pte. Ltd. 16
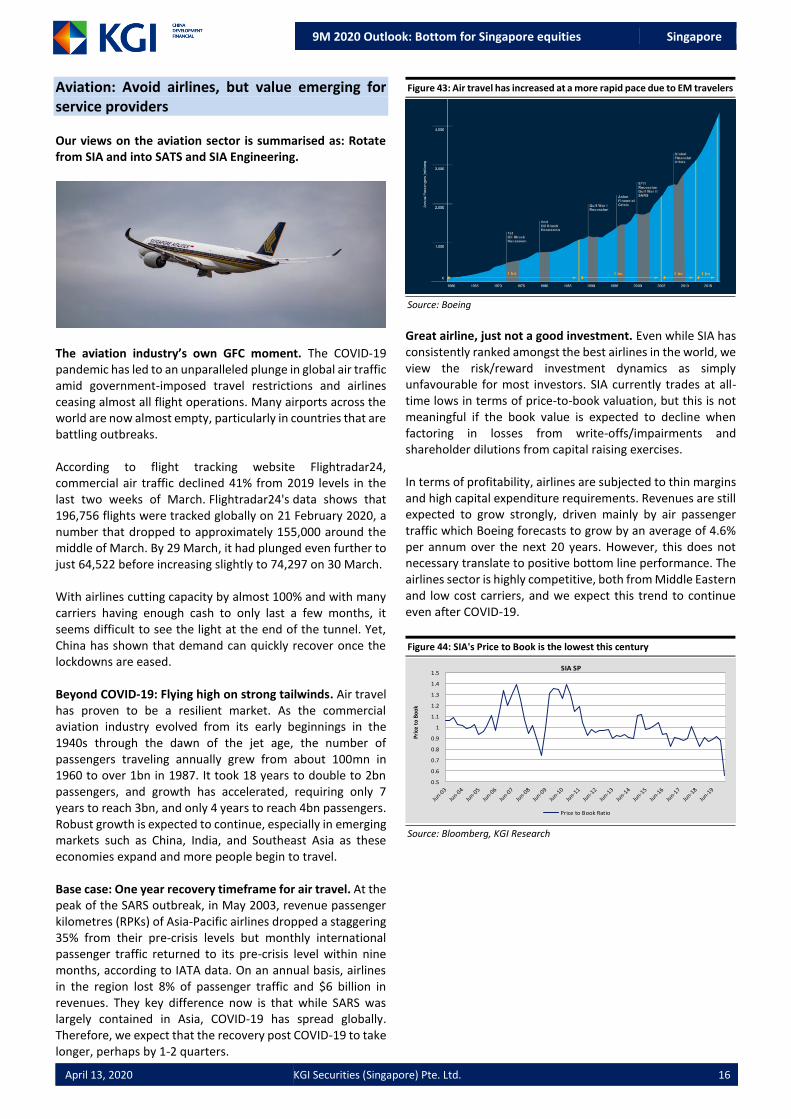
Aviation: Avoid airlines, but value emerging for service providers Our views on the aviation sector is summarised as: Rotate from SIA and into SATS and SIA Engineering.
The aviation industry’s own GFC moment. The COVID-19 pandemic has led to an unparalleled plunge in global air traffic amid government-imposed travel restrictions and airlines ceasing almost all flight operations. Many airports across the world are now almost empty, particularly in countries that are battling outbreaks. According to flight tracking website Flightradar24, commercial air traffic declined 41% from 2019 levels in the last two weeks of March. Flightradar24's data shows that 196,756 flights were tracked globally on 21 February 2020, a number that dropped to approximately 155,000 around the middle of March. By 29 March, it had plunged even further to just 64,522 before increasing slightly to 74,297 on 30 March. With airlines cutting capacity by almost 100% and with many carriers having enough cash to only last a few months, it seems difficult to see the light at the end of the tunnel. Yet, China has shown that demand can quickly recover once the lockdowns are eased. Beyond COVID-19: Flying high on strong tailwinds. Air travel has proven to be a resilient market. As the commercial aviation industry evolved from its early beginnings in the 1940s through the dawn of the jet age, the number of passengers traveling annually grew from about 100mn in 1960 to over 1bn in 1987. It took 18 years to double to 2bn passengers, and growth has accelerated, requiring only 7 years to reach 3bn, and only 4 years to reach 4bn passengers. Robust growth is expected to continue, especially in emerging markets such as China, India, and Southeast Asia as these economies expand and more people begin to travel. Base case: One year recovery timeframe for air travel. At the peak of the SARS outbreak, in May 2003, revenue passenger kilometres (RPKs) of Asia-Pacific airlines dropped a staggering 35% from their pre-crisis levels but monthly international passenger traffic returned to its pre-crisis level within nine months, according to IATA data. On an annual basis, airlines in the region lost 8% of passenger traffic and $6 billion in revenues. They key difference now is that while SARS was largely contained in Asia, COVID-19 has spread globally. Therefore, we expect that the recovery post COVID-19 to take longer, perhaps by 1-2 quarters.
Figure 43: Air travel has increased at a more rapid pace due to EM travelers
Source: Boeing
Great airline, just not a good investment. Even while SIA has consistently ranked amongst the best airlines in the world, we view the risk/reward investment dynamics as simply unfavourable for most investors. SIA currently trades at all-time lows in terms of price-to-book valuation, but this is not meaningful if the book value is expected to decline when factoring in losses from write-offs/impairments and shareholder dilutions from capital raising exercises. In terms of profitability, airlines are subjected to thin margins and high capital expenditure requirements. Revenues are still expected to grow strongly, driven mainly by air passenger traffic which Boeing forecasts to grow by an average of 4.6% per annum over the next 20 years. However, this does not necessary translate to positive bottom line performance. The airlines sector is highly competitive, both from Middle Eastern and low cost carriers, and we expect this trend to continue even after COVID-19.
Figure 44: SIA's Price to Book is the lowest this century
Source: Bloomberg, KGI Research
0.5
0.6
0.7
0.8
0.9
1
1.1
1.2
1.3
1.4
1.5
Pri
ce t
o B
oo
k
SIA SP
Price to Book Ratio
9M 2020 Outlook: Bottom for Singapore equities Singapore
April 13, 2020 KGI Securities (Singapore) Pte. Ltd. 17
Singapore aviation service providers
SIA Engineering (SIE SP) / Not rated
HEARD ON THE STREET
With Covid-19 affecting the freight and travel industries, and to combat the severe downturn in business, FedEx, UPS and SIA are going to merge
into a single company.
It will be called FED-UP-SIA.
The great shake-up. Just as how the Global Financial Crisis in 2008 led to the shakeup of Wall Street’s investment banking giants, the dominant theme in the aviation sector following the current crisis will be that of widespread bailouts and quasi-nationalisation of airlines, as well accelerating the consolidation of aviation service providers. And even if airlines were to avoid the fate of quasi-nationalisation, many of them will emerge with more debt on their balance sheets than ever before. SIA Engineering (SIE) + ST Engineering (STE) = Value We believe the current crisis is the best opportunity to consolidate Singapore’s maintenance, repair and overhaul (MRO) players SIE and STE. The economies of scale, coupled with a more diversified customer base, will put the combined entity to better compete against new entrants, as well as form new partnerships with the increased presence of the original equipment manufacturers (OEM) in the aftermarket sector. It is a win-win proposition for the OEMs as they would benefit from SIE/STE’s regional infrastructure with minimal capital outlay. The consolidation theme is not something new and is a view shared by industry insiders. In Oliver Wyman 2019 MRO Survey’s survey of 125 global aviation professionals, participants were asked how the next economic recession might impact the MRO Industry. 67% of participants selected “Faster consolidation” and “Changes in business models”.
Figure 45: Potential impacts on the MRO industry of an economic
downturn
Source: Oliver Wyman 2019 MRO Survey
Even if consolidation does not go through, SIE was already on the path to recovery. Prior the outbreak of COVID-19, SIE was already on a path to recovery, driven by years of transformational efforts. With the current downturn, FY21F EPS (March YE) is likely to decline by between 17-42% YoY, but will remain profitable, according to Bloomberg consensus estimates. While short-term outlook is challenging, SIE is well prepared with a strong net cash of S$373mn as at end December 2019. Its FY20F (final) and FY21F dividends will likely be slashed when we factor in lower profits, even as SIE would have the ability to do so with its strong cash balance. We think this would be the hprudent step in the event the travel restrictions are extended beyond 2Q20.
Figure 46: SIE quarterly income on the upswing prior to COVID-19
Source: Bloomberg, KGI Research
Attractive entry point as valuations are at 20-year lows. We are confident in utilising P/B valuation to identify a buying opportunity for SIE. SIE’s P/B is now at the lowest level as seen in the 20-year historical P/B chart below. Unlike its parent company, SIA, which will likely recognise losses this year, SIE is still forecasted to remain profitable this year.
9M 2020 Outlook: Bottom for Singapore equities Singapore
April 13, 2020 KGI Securities (Singapore) Pte. Ltd. 18
SATS (SATS SP) / Not rated Top dog in Asia. As one of the world’s top 10 ground handlers and inflight meals caterers, SATS enjoys an enviable position and a major beneficiary of Changi Airport’s (Changi) sizable expansion in the next decade, given that it controls 80% of Changi’s ground-handling and catering business. Changi’s Terminal 5 will cement Singapore’s position as a key aviation hub by adding 50mn passenger capacity per annum. After completion, Changi will be able to handle more than 135mn passengers per annum.
Figure 48: SAT’s 5-year prospects will be largely driven by Changi
Airport’s Terminal 5/
Source: SATS
Figure 49: SATS' solid customer base of the world's established airlines
Source: Company presentation
Still likely to be profitable this year. We expect that the peak of travel restrictions to occur in 2Q20, and gradually improve. When combined with the measures rolled out by the government to support employment (75% wage support for up to S$4,600 per month until December 2020), SATS should be able to tide through the current downturn, especially as its balance sheet remains in a strong position. A key concern last month was with its key customer, SIA, which accounts for 30% of its revenues. However, with the recent fund raising and strong support by SIA’s major shareholder, SATS’ key customer is well-positioned to emerge stronger when the industry recovers.
Valuations are not that cheap compared to SIE or SIA, but this is due to its dominant position. SATS’ current 2.2x P/B valuations are not as cheap when analysed from a 20-year perspective, placing it just slightly below its 20-year average of 2.3x P/B. However, we believe this is justified by its dominant position at Changi, as well as its investments in overseas partnerships in Asia, which places it in a sweet spot as it enables it to ride on the world’s fastest growing aviation market.
Figure 50: SATS is trading at its 20-year P/B average
Source: Bloomberg, KGI Research
Figure 51: SATS is in a sweet spot with its regional associates and JVs
Source: Company presentation
Entry point. At its current share price of S$3.00-S$3.20, we believe that the 60-80% consensus forecasted earnings decline in FY21 (March YE) are already priced in by the markets. A key upside catalyst therefore is the earlier-than-expected lifting of travel restrictions.
0.5
1.0
1.5
2.0
2.5
3.0
3.5
4.0
Pri
ce t
o B
oo
k
SATS SP
Price to Book Ratio Average
9M 2020 Outlook: Bottom for Singapore equities Singapore
April 13, 2020 KGI Securities (Singapore) Pte. Ltd. 19
KGI’s Ratings Rating Definition
Outperform (OP) We take a positive view on the stock. The stock is expected to outperform the expected total return of the KGI coverage universe in the related market over a 12-month investment horizon.
Neutral (N) We take a neutral view on the stock. The stock is expected to perform in line with the expected total return of the KGI coverage universe in the related market over a 12-month investment horizon.
Underperform (U) We take a negative view on the stock. The stock is expected to underperform the expected total return of the KGI coverage universe in the related market over a 12-month investment horizon
Not Rated (NR) The stock is not rated by KGI Securities.
Restricted (R) KGI policy and/or applicable law regulations preclude certain types of communications, including an investment recommendation, during the course of KGI's engagement in an investment banking transaction and in certain other circumstances.
Disclaimer This report is provided for information only and is not an offer or a solicitation to deal in securities or to enter into any legal relations, nor an advice or a recommendation with respect to such securities. This report is prepared for general circulation. It does not have regard to the specific investment objectives, financial situation and the particular needs of any recipient hereof. You should independently evaluate particular investments and consult an independent financial adviser before dealing in any securities mentioned in this report. This report is confidential. This report may not be published, circulated, reproduced or distributed and/or redistributed in whole or in part by any recipient of this report to any other person without the prior written consent of KGI Securities. This report is not intended for distribution and/or redistribution, publication to or use by any person in any jurisdiction outside Singapore or any other jurisdiction as KGI Securities may determine in its absolute discretion, where the distribution, publication or use of this report would be contrary to applicable law or would subject KGI Securities and its connected persons (as defined in the Financial Advisers Act, Chapter 110 of Singapore) to any registration, licensing or other requirements within such jurisdiction. The information or views in the report (“Information”) has been obtained or derived from sources believed by KGI Securities to be reliable. However, KGI Securities makes no representation as to the accuracy or completeness of such sources or the Information and KGI Securities accepts no liability whatsoever for any loss or damage arising from the use of or reliance on the Information. KGI Securities and its connected persons may have issued other reports expressing views different from the Information and all views expressed in all reports of KGI Securities and its connected persons are subject to change without notice. KGI Securities reserves the right to act upon or use the Information at any time, including before its publication herein. Except as otherwise indicated below, (1) KGI Securities, its connected persons and its officers, employees and representatives may, to the extent permitted by law, transact with, perform or provide broking, underwriting, corporate finance-related or other services for or solicit business from, the subject corporation(s) referred to in this report; (2) KGI Securities, its connected persons and its officers, employees and representatives may also, to the extent permitted by law, transact with, perform or provide broking or other services for or solicit business from, other persons in respect of dealings in the securities referred to in this report or other investments related thereto; and (3) the officers, employees and representatives of KGI Securities may also serve on the board of directors or in trustee positions with the subject corporation(s) referred to in this report. (All of the foregoing is hereafter referred to as the “Subject Business”.) However, as of the date of this report, neither KGI Securities nor its representative(s) who produced this report (each a “research analyst”), has any proprietary position or material interest in, and KGI Securities does not make any market in, the securities which are recommended in this report. Each research analyst of KGI Securities who produced this report hereby certifies that (1) the views expressed in this report accurately reflect his/her personal views about all of the subject corporation(s) and securities in this report; (2) the report was produced independently by him/her; (3) he/she does not carry out, whether for himself/herself or on behalf of KGI Securities or any other person, any of the Subject Business involving any of the subject corporation(s) or securities referred to in this report; and (4) he/she has not received and will not receive any compensation that is directly or indirectly related or linked to the recommendations or views expressed in this report or to any sales, trading, dealing or corporate finance advisory services or transaction in respect of the securities in this report. However, the compensation received by each such research analyst is based upon various factors, including KGI Securities’ total revenues, a portion of which are generated from KGI Securities’ business of dealing in securities. Copyright 2020. KGI Securities (Singapore) Pte. Ltd. All rights reserved.