Page 1
1
A 14-year depositional ice record of perfluoroalkyl
acids in the High Arctic
John J. MacInnis†, Katherine French‡, Derek C.G. Muir‡, Christine Spencer‡, Alison
Criscitiello, Amila O. De Silva‡*, Cora J. Young†*
†Department of Chemistry, Memorial University, St. John’s, NL, Canada A1B 3X7 ‡Aquatic Contaminants Research Division, Environment and Climate Change Canada, Burlington, ON, Canada L7S 1A1 Department of Geography, University of Calgary, Calgary AB, Canada T2N 1N4
*Corresponding Authors [email protected] , [email protected]
Text .......................................................................................................................... 3
S1.1. Sample preparation and analysis ................................................................................3
S1.2. Data analysis ...............................................................................................................4
S1.3. Even-even PFCA homologue trends ..........................................................................3
Tables ....................................................................................................................... 5
Table S1. Comparison of PFAA concentration in field, stay, and method blanks..............5
Table S2. Analyte and internal standards used for PFAA analysis .....................................6
Table S3. Recovery of internal standard in sample extracts ...............................................7
Table S4. Recovery of instrument performance standard ...................................................7
Electronic Supplementary Material (ESI) for Environmental Science: Processes & Impacts.This journal is © The Royal Society of Chemistry 2017
Page 2
2
Table S5. Summary of chromatographic conditions ...........................................................8
Table S6. Summary of inlet and mass spectrometric conditions ........................................8
Table S7. Summary of PFAA elution order, retention time, and ion transitions ................9
Table S8. Instrument limit of detection and quantification for PFAAs ..............................9
Table S9. PFAA concentrations on the Devon Ice Cap ...................................................10
Table S10. PFAA fluxes to the Devon Ice Cap .................................................................11
Table S11. Coefficients of determination and statistical significance of PFAA homologues ........................................................................................................................12
Table S12. First order elimination kinetics for PFOS flux, 1998-2004 using 2006 and 2008 data sets .....................................................................................................................13
Figures ........................................................................................................................................ 14
Figure S1. Depth profile of inorganic ions on the Devon Ice Cap ....................................14
Figure S2. Chromatogram of PFAAs in a low-level standard ..........................................15
Figure S3. Chromatogram of PFAAs in an extracted blank .............................................16
Figure S4. Chromatogram of PFSAs and internal standards in Devon Ice Cap extract ...17
Figure S5. Chromatogram of PFCAs and internal standards in Devon Ice Cap extract ...18
Figure S6. Comparison of PFCA concentrations from sampling campaigns at the Devon Ice Cap in 2006 and 2008 ..................................................................................................19
Figure S7. Relationship between PFDA and PFUnDA concentrations ............................20
Figure S8. Comparison of PFOS concentrations from sampling campaigns at the Devon Ice Cap in 2006 and 2008 ..................................................................................................21
Figure S9. Temporal flux trend for PFOA, PFNA, PFDA, PFUnDA, and PFOS calculated from samples collected in 2006 and 2008 ........................................................22
Figure S10. Comparison of PFOS flux using 2006 and 2008 sampling and first order elimination kinetics for PFOS flux from 1998-2004 using 2006 and 2008 data ...............23
Figure S11. Comparison of chloride-sodium molar ratios on the Devon Ice Cap to expected ocean ratios .........................................................................................................24
References .......................................................................................................................24
Page 3
3
S1.1 Sample preparation and analysis
Samples were defrosted the night before extraction, and 500 mL of melted sample was
used. Melted samples were spiked with 30 μL of a surrogate mixture (Table S2), which acted as
the internal standard to monitor recovery. Covered samples were shaken and sonicated for ten
minutes and were placed in the lab for 30 minutes to equilibrate at room temperature. Samples
were concentrated using an OASIS® weak anion exchange (WAX) solid phase extraction (SPE)
cartridge (6 cm3, 150 mg, 30 µm). Two elution fractions were collected: the first fraction was
eluted with 6 mL of methanol for FOSA, while the second fraction was eluted with 8 mL of
0.1% ammonia in methanol for PFAAs. Both fractions were evaporated to dryness using
nitrogen and reconstituted in 0.25 mL of water pre-cleaned using SPE and 0.25 mL methanol
(Fisher Brand HPLC Grade, ThermoFisher). Contamination was rarely observed in cartridge
blanks; however, where contamination was observed, it was generally lower than the LOQ.
Method recoveries for PFAAs ranged from 95 - 113 %, with the exception of PFOcDA ranging
from 35 - 70 %. Method recoveries demonstrate negative biases resulting from subsampling and
storage were not significant in this study. Recoveries for PFOcDA are reflective of the analytical
limitations of the method. Recovery of internal standards and instrument performance standards
in sample extracts are listed below (Tables S3 – S4). Due to the common presence of trace
PFAAs in purchased reagent water, water (Fisher Brand HPLC Grade, ThermoFisher) used in
the mobile phase was subjected to additional cleaning through OASIS WAX SPE.
Page 4
4
S1.2 Data Analysis
Years of deposition were based on snow density, ion chemistry, and annual snow
accumulation data as described in detail by Meyer et al.1 Net deposition fluxes for each analyte
were calculated by multiplying the ng L-1 concentration by the annual accumulation of water
equivalent (L cm-2 yr-1):
ngPFAALH2O
xLH2O
1000cmx
cmcm3
snowx25cmsnow
yearx10,000cm
m ngPFAAm year
S1.3 Even-even PFCA homologue trends
To further validate fluorotelomer precursor oxidation as a major source of PFCA
deposition at the Devon Ice Cap, even-even homologue relationships were determined for PFBA
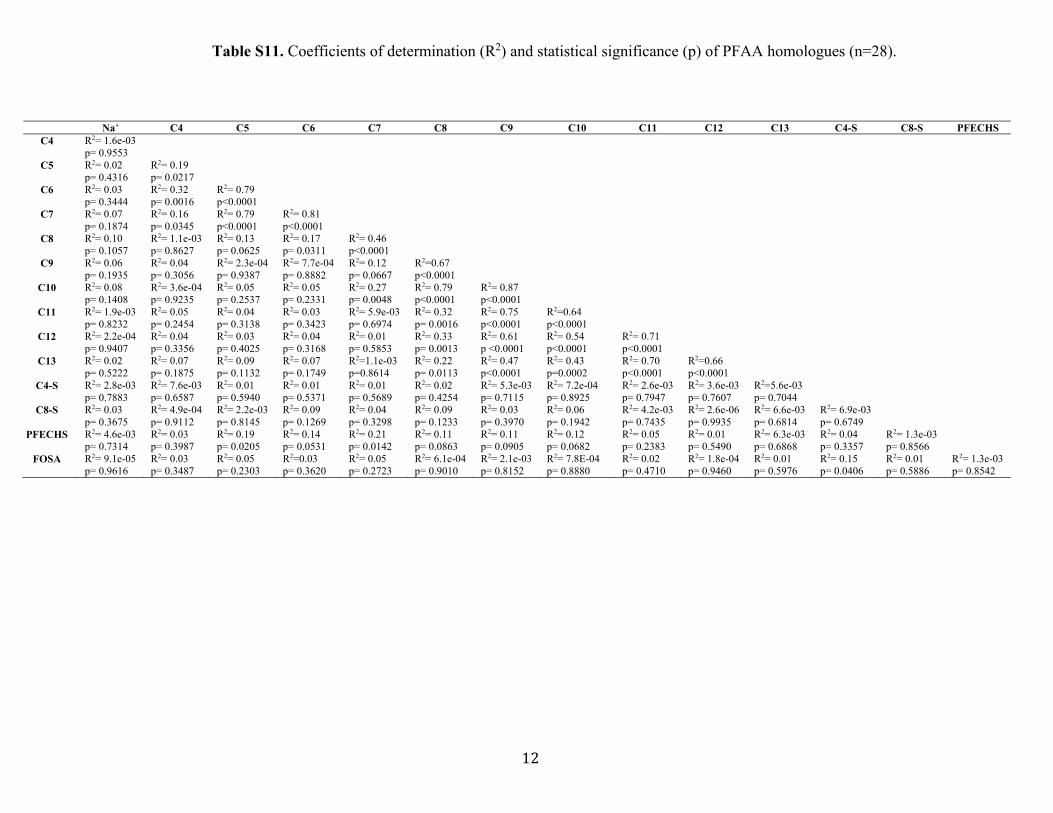
to PFDoDA. A correlation between PFHxA and PFOA (R2 = 0.17, p = 0.0311) concentrations
was weak, moderate among PFHxA and PFBA (R2 = 0.32, p = 0.0016) and PFDA and PFDoDA
(R2 = 0.54, p<0.0001), and strong between PFOA and PFDA (R2 = 0.79, p<0.0001). Molar
PFCA flux ratios for even-even homologues were determined (Figure 2b). Unlike the even-odd
flux ratios, only 17% of the measurements were within a factor of two and only 56% of the
measurements were within a factor of 5. It is interesting that most flux ratios of PFOA: PFHxA,
and PFDA: PFOA, are within factors of 2 and 5, respectively. These observations are consistent
with our knowledge of the fugitive emissions of different FTOHs from fluoropolymer products.3
In the work of Dinglasan-Panlilio and Mabury, 8:2 FTOH was the dominant residual impurity in
marketed fluorinated products, followed by 6:2 and 10:2 FTOH.3 Elevated proportions of
residual volatile precursors in fluoropolymer products may suggest the presence of PFHxA,
PFOA, and PFDA on the Devon Ice Cap are partially derived from common fugitive emission
sources.
Page 5
5
Table S1. Comparison of PFAA concentration (ng L-1) in field, stay, and method blanks.
Perfluoroalkyl Substance
Stay Blank (500 mL HPLC grade water)
Field Blank A (500 mL HPLC grade water)
Field Blank B (500 mL HPLC grade water)
Method Blanks
PFBA <LOD <LOD <LOD 0.042-0.058 PFPeA <LOD <LOD <LOD <LOD PFHxA 0.476 0.265 0.255 <LOD PFHpA 0.037 0.046 0.045 <LOD PFOA 0.332 0.36 0.342 0.002-0.005 PFNA 0.061 0.063 0.061 <LOD PFDA 0.158 0.151 0.157 <LOD
PFUnDA 0.016 0.012 0.019 <LOD PFDoDA 0.028 0.026 0.030 <LOD PFTrDA <LOD <LOD <LOD <LOD PFTeDA <LOD <LOD <LOD <LOD PFHxDA <LOD <LOD <LOD <LOD PFOcDA <LOD <LOD <LOD <LOD PFECHS <LOD <LOD <LOD <LOD
PFBS 0.002 0.003 0.002 <LOD PFHxS <LOD <LOD <LOD <LOD PFHpS <LOD <LOD <LOD <LOD PFOS 0.018 0.014 0.018 <LOD PFDS <LOD <LOD <LOD <LOD FOSA <LOD <LOD <LOD 0.022-0.025
Page 6
6
Table S2. Analyte and internal standards used for PFAA analysis. Internal standards (IS) were used to evaluate recovery and matrix effects, while instrument performance (IP) standards were used to evaluate matrix effects only. Precursor ion/product ion transitions (m/z) are indicated in brackets.
Analyte Internal
Standard Instrument Performance
Standard PFBA 13C4 PFBA (217/172) 13C3 PFBA (216/172) PFPeA 13C5 PFPeA (268/223) 13C3 PFPeA (266/222) PFHxA 13C2 PFHxA (315/270) 13C5 PFHxA (318/273) PFHpA 13C4 PFHpA (367/322) PFOA 13C4 PFOA (417/372) 13C2 PFOA (415/370) PFNA 13C5 PFNA (468/423) 13C9 PFNA (472/427) PFDA 13C2 PFDA (515/470) 13C6 PFDA (519/474) PFUnDA 13C2 PFUnDA (565/520) 13C7 PFUnDA (570/525) PFDoDA 13C2 PFDoDA (615/570) PFTrDA 13C2 PFDoDA (615/570) PFTeDA 13C2 PFTeDA (715/670) PFHxDA 13C2 PFHxDA (815/770) PFOcDA 13C2 PFHxDA (815/770) PFBS 18O2 PFHxS (403/84) PFHxS 18O2 PFHxS (403/103) 13C3 PFHxS (402/99) PFHpS 18O2 PFHxS (403/84) PFOS 13C4 PFOS (503/80) 13C8 PFOS (507/99) PFDS 13C4 PFOS (503/80) PFECHS 18O2 PFHxS (403/84) FOSA 13C8 FOSA (506/78)
Page 7
7
Table S3. Recovery of IS in sample extracts. 500 mL of sample was spiked with 0.125 ng of internal standard prior to extraction. Recovery is based on peak area comparison to solvent standard. Mean (standard error) recovery reported for n=18 samples from the Devon Ice Cap.
IS Recovery (%) 13C4 PFBA 64 (3) 13C5 PFPeA 71 (4) 13C2 PFHxA 73 (3) 13C4 PFHpA 74 (3) 13C4 PFOA 89 (3) 13C5 PFNA 86 (3) 13C2 PFDA 83 (2) 13C7 PFUnDA 99 (1) 13C2 PFDoDA 74 (1) 13C2 PFTeDA 50 (3) 13C2 PFHxDA 98 (9) 13C4 PFOS 99 98 (1) 13C4 PFOS 80 97 (1) 18O2 PFHxS 103 102 (1) 18O2 PFHxS 84 103 (1)
Table S4. Recovery of IP standard in sample extracts. 500 mL of sample was spiked with 0.125 ng of performance standard after extraction. Recovery is based on peak area comparison to solvent standard. Mean (standard error) recovery reported for n=18 samples from the Devon Ice Cap.
IP Recovery (%)13C3 PFBA 98 (3) 13C3 PFPeA 98 (1) 13C5 PFHxA 100 (1) 13C2 PFOA 105 (1) 13C9 PFNA 97 (1) 13C6 PFDA 95 (1) 13C2 PFUnDA 86 (1) 13C8 PFOS 99 100 (1) 13C8 PFOS 80 101 (1) 13C3 PFHxS 99 104 (1)
Page 8
8
Table S5. Summary of chromatographic conditions.
Time (minutes)
Flow rate (mL min-1)
% H2O % MeOH
0 0.400 75 25
0.5 0.400 75 25
5.0 0.400 15 85
5.1 0.400 0 100
5.6 0.400 0 100
7.0 0.550 0 100
9.0 0.400 75 25
12.0 0.000 75 25
*Mobile phases buffered with 0.1 mM ammonium acetate.
Table S6. Summary of inlet and mass spectrometric conditions.
Capillary Voltage (kV) 0.5
Source Temperature (°C)
150
Desolvation Gas Temperature (°C)
450
Cone Gas Flow (L hr-1) 150
Desolvation Gas Flow (L hr-1)
650
Collision Gas Flow (mL min-1)
0.15
Nebulizer Pressure (bar) 7
Column Temperature (°C)
50
Injection Volume (μL) 9
Table S7. Summary of PFAA elution order, retention time, and ion transitions.
Page 9
9
Elution Order
PFAA Retention Time (min)
Quantifier Ion Transition (m/z)
Qualifier Ion Transition (m/z)
1 PFBA 0.91 213 > 169 2 PFPeA 2.11 263 > 219 3 PFBS 2.38 299 > 80 299 > 99 4 PFHxA 3.07 313 > 269 313 > 119 5 PFHpA 3.68 363 > 319 363 > 119,169 6 PFHxS 3.74 399 > 80 399 > 99 7 PFECHS 4.08 461 > 381 461 > 99 8 PFOA 4.12 413 > 369 413 > 169 9 PFHpS 4.16 449 > 80 449 > 99 10 PFNA 4.48 463 > 419 463 > 219 11 PFOS 4.50 499 > 80 499 > 99 12 PFDA 4.78 513 > 469 513 > 219 13 PFUnDA 5.03 563 > 519 563 > 319,269 14 PFDS 5.03 599 > 80 599 > 99 15 FOSA 5.13 498 > 78 16 PFDoDA 5.24 613 > 569 613 > 169 17 PFTrDA 5.42 663 > 619 663 > 169 18 PFTeDA 5.58 713 > 669 713 > 169 19 PFHxDA 5.82 813 > 769 813 > 169 20 PFOcDA 5.95 913 > 869 913 > 169 Table S8. Instrument limit of detection and quantitation for PFAAs.
Perfluoroalkyl Substance
LOD (pg L-1) LOQ (pg L-1)
PFBA 10 50 PFPeA 7 20 PFHxA 1 4 PFHpA 2 5 PFOA 2 6 PFNA 2 6 PFDA 1 4
PFUnDA 1 5 PFDoDA 1 4 PFTrDA 1 4 PFTeDA 2 5 PFHxDA 6 20 PFOcDA 10 40 PFECHS 0.3 1
PFBS 4 10 PFHxS 1 4 PFHpS 1 4 PFOS 1 4 PFDS 2 7 FOSA 1 3
Page 10
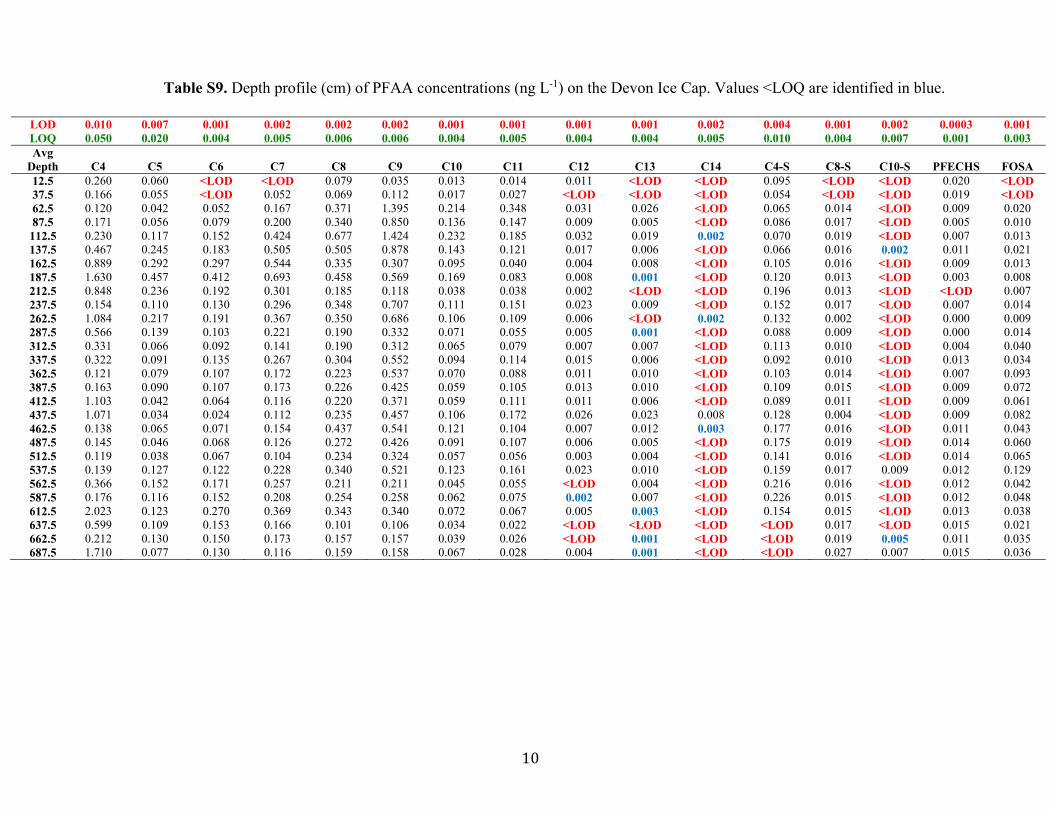
10
Table S9. Depth profile (cm) of PFAA concentrations (ng L-1) on the Devon Ice Cap. Values <LOQ are identified in blue.
LOD 0.010 0.007 0.001 0.002 0.002 0.002 0.001 0.001 0.001 0.001 0.002 0.004 0.001 0.002 0.0003 0.001 LOQ 0.050 0.020 0.004 0.005 0.006 0.006 0.004 0.005 0.004 0.004 0.005 0.010 0.004 0.007 0.001 0.003 Avg
Depth C4 C5 C6 C7 C8 C9 C10 C11 C12 C13 C14 C4-S C8-S C10-S PFECHS FOSA 12.5 0.260 0.060 <LOD <LOD 0.079 0.035 0.013 0.014 0.011 <LOD <LOD 0.095 <LOD <LOD 0.020 <LOD 37.5 0.166 0.055 <LOD 0.052 0.069 0.112 0.017 0.027 <LOD <LOD <LOD 0.054 <LOD <LOD 0.019 <LOD 62.5 0.120 0.042 0.052 0.167 0.371 1.395 0.214 0.348 0.031 0.026 <LOD 0.065 0.014 <LOD 0.009 0.020 87.5 0.171 0.056 0.079 0.200 0.340 0.850 0.136 0.147 0.009 0.005 <LOD 0.086 0.017 <LOD 0.005 0.010 112.5 0.230 0.117 0.152 0.424 0.677 1.424 0.232 0.185 0.032 0.019 0.002 0.070 0.019 <LOD 0.007 0.013 137.5 0.467 0.245 0.183 0.505 0.505 0.878 0.143 0.121 0.017 0.006 <LOD 0.066 0.016 0.002 0.011 0.021 162.5 0.889 0.292 0.297 0.544 0.335 0.307 0.095 0.040 0.004 0.008 <LOD 0.105 0.016 <LOD 0.009 0.013 187.5 1.630 0.457 0.412 0.693 0.458 0.569 0.169 0.083 0.008 0.001 <LOD 0.120 0.013 <LOD 0.003 0.008 212.5 0.848 0.236 0.192 0.301 0.185 0.118 0.038 0.038 0.002 <LOD <LOD 0.196 0.013 <LOD <LOD 0.007 237.5 0.154 0.110 0.130 0.296 0.348 0.707 0.111 0.151 0.023 0.009 <LOD 0.152 0.017 <LOD 0.007 0.014 262.5 1.084 0.217 0.191 0.367 0.350 0.686 0.106 0.109 0.006 <LOD 0.002 0.132 0.002 <LOD 0.000 0.009 287.5 0.566 0.139 0.103 0.221 0.190 0.332 0.071 0.055 0.005 0.001 <LOD 0.088 0.009 <LOD 0.000 0.014 312.5 0.331 0.066 0.092 0.141 0.190 0.312 0.065 0.079 0.007 0.007 <LOD 0.113 0.010 <LOD 0.004 0.040 337.5 0.322 0.091 0.135 0.267 0.304 0.552 0.094 0.114 0.015 0.006 <LOD 0.092 0.010 <LOD 0.013 0.034 362.5 0.121 0.079 0.107 0.172 0.223 0.537 0.070 0.088 0.011 0.010 <LOD 0.103 0.014 <LOD 0.007 0.093 387.5 0.163 0.090 0.107 0.173 0.226 0.425 0.059 0.105 0.013 0.010 <LOD 0.109 0.015 <LOD 0.009 0.072 412.5 1.103 0.042 0.064 0.116 0.220 0.371 0.059 0.111 0.011 0.006 <LOD 0.089 0.011 <LOD 0.009 0.061 437.5 1.071 0.034 0.024 0.112 0.235 0.457 0.106 0.172 0.026 0.023 0.008 0.128 0.004 <LOD 0.009 0.082 462.5 0.138 0.065 0.071 0.154 0.437 0.541 0.121 0.104 0.007 0.012 0.003 0.177 0.016 <LOD 0.011 0.043 487.5 0.145 0.046 0.068 0.126 0.272 0.426 0.091 0.107 0.006 0.005 <LOD 0.175 0.019 <LOD 0.014 0.060 512.5 0.119 0.038 0.067 0.104 0.234 0.324 0.057 0.056 0.003 0.004 <LOD 0.141 0.016 <LOD 0.014 0.065 537.5 0.139 0.127 0.122 0.228 0.340 0.521 0.123 0.161 0.023 0.010 <LOD 0.159 0.017 0.009 0.012 0.129 562.5 0.366 0.152 0.171 0.257 0.211 0.211 0.045 0.055 <LOD 0.004 <LOD 0.216 0.016 <LOD 0.012 0.042 587.5 0.176 0.116 0.152 0.208 0.254 0.258 0.062 0.075 0.002 0.007 <LOD 0.226 0.015 <LOD 0.012 0.048 612.5 2.023 0.123 0.270 0.369 0.343 0.340 0.072 0.067 0.005 0.003 <LOD 0.154 0.015 <LOD 0.013 0.038 637.5 0.599 0.109 0.153 0.166 0.101 0.106 0.034 0.022 <LOD <LOD <LOD <LOD 0.017 <LOD 0.015 0.021 662.5 0.212 0.130 0.150 0.173 0.157 0.157 0.039 0.026 <LOD 0.001 <LOD <LOD 0.019 0.005 0.011 0.035 687.5 1.710 0.077 0.130 0.116 0.159 0.158 0.067 0.028 0.004 0.001 <LOD <LOD 0.027 0.007 0.015 0.036
Page 11
11
Table S10. PFAA flux to the Devon Ice Cap expressed in ng m-2 yr-1. Estimated PFAA flux (red) is calculated from homologue LOD.
Year C4 C5 C6 C7 C8 C9 C10 C11 C12 C13 C14 C16 C18 C4-S C6-S C7-S C8-S C10-S PFECHS FOSA 2007 43.66 12.70 5.40 20.97 48.72 152.65 23.98 38.49 3.98 2.82 <0.50 <1.50 <2.49 17.57 <0.25 <0.25 1.53 <0.50 3.76 2.07 2006 38.97 16.61 22.22 59.77 97.66 219.58 35.57 32.37 3.86 2.20 0.39 <1.18 <1.97 15.39 <0.20 <0.20 3.53 <0.39 1.13 2.19 2005 127.91 50.19 45.13 97.82 77.56 108.23 21.98 14.72 1.92 1.33 <0.37 <1.12 <1.86 16.08 <0.19 <0.19 2.92 0.37 1.82 3.09 2004 243.87 68.28 59.87 98.89 64.15 70.48 21.18 11.93 0.98 0.19 <0.38 <1.13 <1.89 28.92 <0.19 <0.19 2.43 <0.38 0.39 1.42 2003 136.34 35.09 34.22 70.29 73.51 146.45 22.84 27.05 2.89 0.98 0.42 <1.26 <2.11 29.78 <0.21 <0.21 1.85 <0.42 0.73 2.45 2002 97.41 22.15 21.21 39.31 41.50 70.36 14.83 14.81 1.34 0.89 <0.44 <1.31 <2.19 22.07 <0.22 <0.22 2.06 <0.44 0.53 5.99 2001 48.37 19.63 27.69 49.46 60.02 126.72 18.71 23.14 2.98 1.89 <0.47 <1.40 <2.33 22.88 <0.23 <0.23 2.83 <0.47 2.24 15.74 2000 110.05 13.68 17.44 29.14 43.91 78.91 11.60 21.10 2.34 1.60 <0.39 <1.18 <1.96 19.69 <0.20 <0.20 2.67 <0.39 1.78 13.27 1999 139.81 11.13 10.74 30.14 75.87 113.28 25.71 31.58 3.84 4.07 1.23 <1.36 <2.27 34.61 <0.23 <0.23 2.19 <0.45 2.27 14.37 1998 29.49 9.34 15.05 25.59 56.56 83.73 16.55 18.30 1.03 1.07 <0.45 <1.34 <2.23 35.24 <0.22 <0.22 3.94 <0.45 3.11 13.94 1997 51.03 29.20 30.42 50.85 59.38 80.33 18.50 23.78 2.70 1.62 <0.42 <1.27 <2.11 38.98 <0.21 <0.21 3.47 1.19 2.58 18.86 1996 204.97 22.36 39.38 53.91 55.74 55.94 12.49 13.34 0.61 0.90 <0.37 <1.12 <1.87 35.58 <0.19 <0.19 2.77 <0.37 2.37 8.06 1995 42.66 7.79 10.89 11.84 7.22 7.53 2.44 1.58 <0.07 <0.07 <0.14 <0.43 <0.71 <0.28 <0.07 <0.07 1.23 <0.14 1.04 1.51 1994 14.71 9.01 10.41 12.04 10.93 10.93 2.73 1.80 <0.07 0.06 <0.14 <0.42 <0.69 <0.28 <0.07 <0.07 1.34 0.35 0.76 2.45 1993 153.28 6.93 11.63 10.39 14.25 14.13 6.01 2.55 0.32 0.08 <0.18 <0.54 <0.90 <0.36 <0.09 <0.09 2.39 0.64 1.31 3.19
Page 12
12
Table S11. Coefficients of determination (R2) and statistical significance (p) of PFAA homologues (n=28).
Na+ C4 C5 C6 C7 C8 C9 C10 C11 C12 C13 C4-S C8-S PFECHS C4 R2= 1.6e-03
p= 0.9553
C5 R2= 0.02 p= 0.4316
R2= 0.19 p= 0.0217
C6 R2= 0.03 p= 0.3444
R2= 0.32 p= 0.0016
R2= 0.79 p<0.0001
C7 R2= 0.07 p= 0.1874
R2= 0.16 p= 0.0345
R2= 0.79 p<0.0001
R2= 0.81 p<0.0001
C8 R2= 0.10 p= 0.1057
R2= 1.1e-03 p= 0.8627
R2= 0.13 p= 0.0625
R2= 0.17 p= 0.0311
R2= 0.46 p<0.0001
C9 R2= 0.06 p= 0.1935
R2= 0.04 p= 0.3056
R2= 2.3e-04 p= 0.9387
R2= 7.7e-04 p= 0.8882
R2= 0.12 p= 0.0667
R2=0.67 p<0.0001
C10 R2= 0.08 p= 0.1408
R2= 3.6e-04 p= 0.9235
R2= 0.05 p= 0.2537
R2= 0.05 p= 0.2331
R2= 0.27 p= 0.0048
R2= 0.79 p<0.0001
R2= 0.87 p<0.0001
C11 R2= 1.9e-03 p= 0.8232
R2= 0.05 p= 0.2454
R2= 0.04 p= 0.3138
R2= 0.03 p= 0.3423
R2= 5.9e-03 p= 0.6974
R2= 0.32 p= 0.0016
R2= 0.75 p<0.0001
R2=0.64 p<0.0001
C12 R2= 2.2e-04 p= 0.9407
R2= 0.04 p= 0.3356
R2= 0.03 p= 0.4025
R2= 0.04 p= 0.3168
R2= 0.01 p= 0.5853
R2= 0.33 p= 0.0013
R2= 0.61 p <0.0001
R2= 0.54 p<0.0001
R2= 0.71 p<0.0001
C13 R2= 0.02 p= 0.5222
R2= 0.07 p= 0.1875
R2= 0.09 p= 0.1132
R2= 0.07 p= 0.1749
R2=1.1e-03 p=0.8614
R2= 0.22 p= 0.0113
R2= 0.47 p<0.0001
R2= 0.43 p=0.0002
R2= 0.70 p<0.0001
R2=0.66 p<0.0001
C4-S R2= 2.8e-03 p= 0.7883
R2= 7.6e-03 p= 0.6587
R2= 0.01 p= 0.5940
R2= 0.01 p= 0.5371
R2= 0.01 p= 0.5689
R2= 0.02 p= 0.4254
R2= 5.3e-03 p= 0.7115
R2= 7.2e-04 p= 0.8925
R2= 2.6e-03 p= 0.7947
R2= 3.6e-03 p= 0.7607
R2=5.6e-03 p= 0.7044
C8-S R2= 0.03 p= 0.3675
R2= 4.9e-04 p= 0.9112
R2= 2.2e-03 p= 0.8145
R2= 0.09 p= 0.1269
R2= 0.04 p= 0.3298
R2= 0.09 p= 0.1233
R2= 0.03 p= 0.3970
R2= 0.06 p= 0.1942
R2= 4.2e-03 p= 0.7435
R2= 2.6e-06 p= 0.9935
R2= 6.6e-03 p= 0.6814
R2= 6.9e-03 p= 0.6749
PFECHS R2= 4.6e-03 p= 0.7314
R2= 0.03 p= 0.3987
R2= 0.19 p= 0.0205
R2= 0.14 p= 0.0531
R2= 0.21 p= 0.0142
R2= 0.11 p= 0.0863
R2= 0.11 p= 0.0905
R2= 0.12 p= 0.0682
R2= 0.05 p= 0.2383
R2= 0.01 p= 0.5490
R2= 6.3e-03 p= 0.6868
R2= 0.04 p= 0.3357
R2= 1.3e-03 p= 0.8566
FOSA R2= 9.1e-05 p= 0.9616
R2= 0.03 p= 0.3487
R2= 0.05 p= 0.2303
R2=0.03 p= 0.3620
R2= 0.05 p= 0.2723
R2= 6.1e-04 p= 0.9010
R2= 2.1e-03 p= 0.8152
R2= 7.8E-04 p= 0.8880
R2= 0.02 p= 0.4710
R2= 1.8e-04 p= 0.9460
R2= 0.01 p= 0.5976
R2= 0.15 p= 0.0406
R2= 0.01 p= 0.5886
R2= 1.3e-03 p= 0.8542
Page 13
13
Table S12. First order elimination kinetics for PFOS flux, 1998-2004 using 2006 and 2008 data sets (corresponds to Fig S10)
2006 data 2008 data First order elimination rate, Ke (y-1) 0.3197±0.1333 0.0731±0.0400
p-value 0.0617 0.127 R2 on ln flux versus year regression 0.535 0.401
Degrees of freedom 5 5 Half life, T1/2 (y) based on ln2/ke 2.2 ± 5.2 9.5 ± 17
Page 14
14
Figure S1. Depth profile of inorganic ions on the Devon Ice Cap.
Page 15
15
Figure S2. Chromatogram of PFAAs in a low-level (~ 0.1 ng mL-1) standard. Chromatograms have not been smoothed. Precursor-product ion transition is shown in red for analytes. Peaks are annotated with retention time and standard concentration.
apr28 pfa L1
Time0.60 0.70 0.80 0.90 1.00 1.10 1.20 1.30 1.40 1.50 1.60 1.70 1.80 1.90 2.00 2.10 2.20 2.30 2.40 2.50 2.60 2.70 2.80 2.90 3.00 3.10 3.20 3.30 3.40 3.50 3.60 3.70 3.80 3.90 4.00 4.10 4.20 4.30 4.40 4.50 4.60 4.70 4.80 4.90 5.00 5.10 5.20 5.30 5.40 5.50 5.60
%
0
100
0.60 0.70 0.80 0.90 1.00 1.10 1.20 1.30 1.40 1.50 1.60 1.70 1.80 1.90 2.00 2.10 2.20 2.30 2.40 2.50 2.60 2.70 2.80 2.90 3.00 3.10 3.20 3.30 3.40 3.50 3.60 3.70 3.80 3.90 4.00 4.10 4.20 4.30 4.40 4.50 4.60 4.70 4.80 4.90 5.00 5.10 5.20 5.30 5.40 5.50 5.60
%
0
100
0.60 0.70 0.80 0.90 1.00 1.10 1.20 1.30 1.40 1.50 1.60 1.70 1.80 1.90 2.00 2.10 2.20 2.30 2.40 2.50 2.60 2.70 2.80 2.90 3.00 3.10 3.20 3.30 3.40 3.50 3.60 3.70 3.80 3.90 4.00 4.10 4.20 4.30 4.40 4.50 4.60 4.70 4.80 4.90 5.00 5.10 5.20 5.30 5.40 5.50 5.60
%
0
100
0.60 0.70 0.80 0.90 1.00 1.10 1.20 1.30 1.40 1.50 1.60 1.70 1.80 1.90 2.00 2.10 2.20 2.30 2.40 2.50 2.60 2.70 2.80 2.90 3.00 3.10 3.20 3.30 3.40 3.50 3.60 3.70 3.80 3.90 4.00 4.10 4.20 4.30 4.40 4.50 4.60 4.70 4.80 4.90 5.00 5.10 5.20 5.30 5.40 5.50 5.60
%
0
100
0.60 0.70 0.80 0.90 1.00 1.10 1.20 1.30 1.40 1.50 1.60 1.70 1.80 1.90 2.00 2.10 2.20 2.30 2.40 2.50 2.60 2.70 2.80 2.90 3.00 3.10 3.20 3.30 3.40 3.50 3.60 3.70 3.80 3.90 4.00 4.10 4.20 4.30 4.40 4.50 4.60 4.70 4.80 4.90 5.00 5.10 5.20 5.30 5.40 5.50 5.60
%
0
100
0.60 0.70 0.80 0.90 1.00 1.10 1.20 1.30 1.40 1.50 1.60 1.70 1.80 1.90 2.00 2.10 2.20 2.30 2.40 2.50 2.60 2.70 2.80 2.90 3.00 3.10 3.20 3.30 3.40 3.50 3.60 3.70 3.80 3.90 4.00 4.10 4.20 4.30 4.40 4.50 4.60 4.70 4.80 4.90 5.00 5.10 5.20 5.30 5.40 5.50 5.60
%
0
100
0.60 0.70 0.80 0.90 1.00 1.10 1.20 1.30 1.40 1.50 1.60 1.70 1.80 1.90 2.00 2.10 2.20 2.30 2.40 2.50 2.60 2.70 2.80 2.90 3.00 3.10 3.20 3.30 3.40 3.50 3.60 3.70 3.80 3.90 4.00 4.10 4.20 4.30 4.40 4.50 4.60 4.70 4.80 4.90 5.00 5.10 5.20 5.30 5.40 5.50 5.60
%
0
100
0.60 0.70 0.80 0.90 1.00 1.10 1.20 1.30 1.40 1.50 1.60 1.70 1.80 1.90 2.00 2.10 2.20 2.30 2.40 2.50 2.60 2.70 2.80 2.90 3.00 3.10 3.20 3.30 3.40 3.50 3.60 3.70 3.80 3.90 4.00 4.10 4.20 4.30 4.40 4.50 4.60 4.70 4.80 4.90 5.00 5.10 5.20 5.30 5.40 5.50 5.60
%
0
100
0.60 0.70 0.80 0.90 1.00 1.10 1.20 1.30 1.40 1.50 1.60 1.70 1.80 1.90 2.00 2.10 2.20 2.30 2.40 2.50 2.60 2.70 2.80 2.90 3.00 3.10 3.20 3.30 3.40 3.50 3.60 3.70 3.80 3.90 4.00 4.10 4.20 4.30 4.40 4.50 4.60 4.70 4.80 4.90 5.00 5.10 5.20 5.30 5.40 5.50 5.60
%
0
100
0.60 0.70 0.80 0.90 1.00 1.10 1.20 1.30 1.40 1.50 1.60 1.70 1.80 1.90 2.00 2.10 2.20 2.30 2.40 2.50 2.60 2.70 2.80 2.90 3.00 3.10 3.20 3.30 3.40 3.50 3.60 3.70 3.80 3.90 4.00 4.10 4.20 4.30 4.40 4.50 4.60 4.70 4.80 4.90 5.00 5.10 5.20 5.30 5.40 5.50 5.60
%
0
100
0.60 0.70 0.80 0.90 1.00 1.10 1.20 1.30 1.40 1.50 1.60 1.70 1.80 1.90 2.00 2.10 2.20 2.30 2.40 2.50 2.60 2.70 2.80 2.90 3.00 3.10 3.20 3.30 3.40 3.50 3.60 3.70 3.80 3.90 4.00 4.10 4.20 4.30 4.40 4.50 4.60 4.70 4.80 4.90 5.00 5.10 5.20 5.30 5.40 5.50 5.60
%
0
100
May21_devon_PFA-4 22: MRM of 3 Channels ES-
713> 169 (PFTeDA) 2.14e4
5.57May21_devon_PFA-4 21: MRM of 2 Channels ES-
663 > 169 (PFTriDA) 1.55e45.42
May21_devon_PFA-4 20: MRM of 3 Channels ES-
613 > 169 (PFDoDA) 6.29e4
5.25May21_devon_PFA-4 18: MRM of 4 Channels ES-
563 > 319 (PFUnDA)4.36e45.03
May21_devon_PFA-4 16: MRM of 4 Channels ES-
513 > 219 (PFDA) 9.25e4
4.78May21_devon_PFA-4 13: MRM of 4 Channels ES-
463 > 219 (PFNA)1.02e54.48
May21_devon_PFA-4 9: MRM of 4 Channels ES-
413 > 169 (PFOA)1.63e54.12
May21_devon_PFA-4 6: MRM of 3 Channels ES-
363 > 119 (PFHpA)1.93e43.67
3.80
May21_devon_PFA-4 4: MRM of 4 Channels ES-
313 > 119 (PFHxA)1.00e43.07
May21_devon_PFA-4 2: MRM of 3 Channels ES-
263 > 219 (PFPeA)7.75e42.11
May21_devon_PFA-4 1: MRM of 3 Channels ES-
213 > 169 (PFBA)5.26e4
0.910.093 ng/ml
0.093 ng/ml
0.093 ng/ml
0.093 ng/ml
0.093 ng/ml
0.093 ng/ml
0.093 ng/ml
0.093 ng/ml
0.093 ng/ml
0.093 ng/ml
0.093 ng/ml
apr28 pfa L1
Time (min)0.60 1.00 1.40 1.80 2.20 2.60 3.00 3.40 3.80 4.20 4.60 5.00 5.40
%
0
100
0.60 0.70 0.80 0.90 1.00 1.10 1.20 1.30 1.40 1.50 1.60 1.70 1.80 1.90 2.00 2.10 2.20 2.30 2.40 2.50 2.60 2.70 2.80 2.90 3.00 3.10 3.20 3.30 3.40 3.50 3.60 3.70 3.80 3.90 4.00 4.10 4.20 4.30 4.40 4.50 4.60 4.70 4.80 4.90 5.00 5.10 5.20 5.30 5.40 5.50 5.60
%
0
100
0.60 0.70 0.80 0.90 1.00 1.10 1.20 1.30 1.40 1.50 1.60 1.70 1.80 1.90 2.00 2.10 2.20 2.30 2.40 2.50 2.60 2.70 2.80 2.90 3.00 3.10 3.20 3.30 3.40 3.50 3.60 3.70 3.80 3.90 4.00 4.10 4.20 4.30 4.40 4.50 4.60 4.70 4.80 4.90 5.00 5.10 5.20 5.30 5.40 5.50 5.60
%
0
100
0.60 0.70 0.80 0.90 1.00 1.10 1.20 1.30 1.40 1.50 1.60 1.70 1.80 1.90 2.00 2.10 2.20 2.30 2.40 2.50 2.60 2.70 2.80 2.90 3.00 3.10 3.20 3.30 3.40 3.50 3.60 3.70 3.80 3.90 4.00 4.10 4.20 4.30 4.40 4.50 4.60 4.70 4.80 4.90 5.00 5.10 5.20 5.30 5.40 5.50 5.60
%
0
100
0.60 0.70 0.80 0.90 1.00 1.10 1.20 1.30 1.40 1.50 1.60 1.70 1.80 1.90 2.00 2.10 2.20 2.30 2.40 2.50 2.60 2.70 2.80 2.90 3.00 3.10 3.20 3.30 3.40 3.50 3.60 3.70 3.80 3.90 4.00 4.10 4.20 4.30 4.40 4.50 4.60 4.70 4.80 4.90 5.00 5.10 5.20 5.30 5.40 5.50 5.60
%
0
100
0.60 0.70 0.80 0.90 1.00 1.10 1.20 1.30 1.40 1.50 1.60 1.70 1.80 1.90 2.00 2.10 2.20 2.30 2.40 2.50 2.60 2.70 2.80 2.90 3.00 3.10 3.20 3.30 3.40 3.50 3.60 3.70 3.80 3.90 4.00 4.10 4.20 4.30 4.40 4.50 4.60 4.70 4.80 4.90 5.00 5.10 5.20 5.30 5.40 5.50 5.60
%
0
100
May21_devon_PFA-4 19: MRM of 2 Channels ES-
599 > 80 (PFDS)
1.19e55.03
May21_devon_PFA-4 15: MRM of 6 Channels ES-
498 > 78 (PFOS)
1.50e54.50
May21_devon_PFA-4 12: MRM of 2 Channels ES-
461> 99 (PFECHS)
1.56e54.08
May21_devon_PFA-4 11: MRM of 2 Channels ES-
449 > 80 (PFHpS)
1.01e54.16
May21_devon_PFA-4 7: MRM of 5 Channels ES-
399 > 80 (PFHxS)
1.63e53.74
May21_devon_PFA-4 3: MRM of 2 Channels ES-
299 > 80 (PFBS)
1.17e52.38
Abu
nda
nce
(%)
0.082 ng/ml
0.088 ng/ml
0.076 ng/ml
0.078 ng/ml
0.089 ng/ml
0.089 ng/ml
Page 16
16
Figure S3. Chromatogram of PFAAs in extracted blank. Chromatograms have not been smoothed. Precursor-product ion transition is shown in red for analytes. Retention times are annotated for detected peaks.
may15 CB F2
Time0.60 0.70 0.80 0.90 1.00 1.10 1.20 1.30 1.40 1.50 1.60 1.70 1.80 1.90 2.00 2.10 2.20 2.30 2.40 2.50 2.60 2.70 2.80 2.90 3.00 3.10 3.20 3.30 3.40 3.50 3.60 3.70 3.80 3.90 4.00 4.10 4.20 4.30 4.40 4.50 4.60 4.70 4.80 4.90 5.00 5.10 5.20 5.30 5.40 5.50 5.60
%
0
100
0.60 0.70 0.80 0.90 1.00 1.10 1.20 1.30 1.40 1.50 1.60 1.70 1.80 1.90 2.00 2.10 2.20 2.30 2.40 2.50 2.60 2.70 2.80 2.90 3.00 3.10 3.20 3.30 3.40 3.50 3.60 3.70 3.80 3.90 4.00 4.10 4.20 4.30 4.40 4.50 4.60 4.70 4.80 4.90 5.00 5.10 5.20 5.30 5.40 5.50 5.60
%
0
100
0.60 0.70 0.80 0.90 1.00 1.10 1.20 1.30 1.40 1.50 1.60 1.70 1.80 1.90 2.00 2.10 2.20 2.30 2.40 2.50 2.60 2.70 2.80 2.90 3.00 3.10 3.20 3.30 3.40 3.50 3.60 3.70 3.80 3.90 4.00 4.10 4.20 4.30 4.40 4.50 4.60 4.70 4.80 4.90 5.00 5.10 5.20 5.30 5.40 5.50 5.60
%
0
100
0.60 0.70 0.80 0.90 1.00 1.10 1.20 1.30 1.40 1.50 1.60 1.70 1.80 1.90 2.00 2.10 2.20 2.30 2.40 2.50 2.60 2.70 2.80 2.90 3.00 3.10 3.20 3.30 3.40 3.50 3.60 3.70 3.80 3.90 4.00 4.10 4.20 4.30 4.40 4.50 4.60 4.70 4.80 4.90 5.00 5.10 5.20 5.30 5.40 5.50 5.60
%
0
100
0.60 0.70 0.80 0.90 1.00 1.10 1.20 1.30 1.40 1.50 1.60 1.70 1.80 1.90 2.00 2.10 2.20 2.30 2.40 2.50 2.60 2.70 2.80 2.90 3.00 3.10 3.20 3.30 3.40 3.50 3.60 3.70 3.80 3.90 4.00 4.10 4.20 4.30 4.40 4.50 4.60 4.70 4.80 4.90 5.00 5.10 5.20 5.30 5.40 5.50 5.60
%
0
100
0.60 0.70 0.80 0.90 1.00 1.10 1.20 1.30 1.40 1.50 1.60 1.70 1.80 1.90 2.00 2.10 2.20 2.30 2.40 2.50 2.60 2.70 2.80 2.90 3.00 3.10 3.20 3.30 3.40 3.50 3.60 3.70 3.80 3.90 4.00 4.10 4.20 4.30 4.40 4.50 4.60 4.70 4.80 4.90 5.00 5.10 5.20 5.30 5.40 5.50 5.60
%
0
100
0.60 0.70 0.80 0.90 1.00 1.10 1.20 1.30 1.40 1.50 1.60 1.70 1.80 1.90 2.00 2.10 2.20 2.30 2.40 2.50 2.60 2.70 2.80 2.90 3.00 3.10 3.20 3.30 3.40 3.50 3.60 3.70 3.80 3.90 4.00 4.10 4.20 4.30 4.40 4.50 4.60 4.70 4.80 4.90 5.00 5.10 5.20 5.30 5.40 5.50 5.60
%
0
100
0.60 0.70 0.80 0.90 1.00 1.10 1.20 1.30 1.40 1.50 1.60 1.70 1.80 1.90 2.00 2.10 2.20 2.30 2.40 2.50 2.60 2.70 2.80 2.90 3.00 3.10 3.20 3.30 3.40 3.50 3.60 3.70 3.80 3.90 4.00 4.10 4.20 4.30 4.40 4.50 4.60 4.70 4.80 4.90 5.00 5.10 5.20 5.30 5.40 5.50 5.60
%
0
100
0.60 0.70 0.80 0.90 1.00 1.10 1.20 1.30 1.40 1.50 1.60 1.70 1.80 1.90 2.00 2.10 2.20 2.30 2.40 2.50 2.60 2.70 2.80 2.90 3.00 3.10 3.20 3.30 3.40 3.50 3.60 3.70 3.80 3.90 4.00 4.10 4.20 4.30 4.40 4.50 4.60 4.70 4.80 4.90 5.00 5.10 5.20 5.30 5.40 5.50 5.60
%
0
100
0.60 0.70 0.80 0.90 1.00 1.10 1.20 1.30 1.40 1.50 1.60 1.70 1.80 1.90 2.00 2.10 2.20 2.30 2.40 2.50 2.60 2.70 2.80 2.90 3.00 3.10 3.20 3.30 3.40 3.50 3.60 3.70 3.80 3.90 4.00 4.10 4.20 4.30 4.40 4.50 4.60 4.70 4.80 4.90 5.00 5.10 5.20 5.30 5.40 5.50 5.60
%
0
100
0.60 0.70 0.80 0.90 1.00 1.10 1.20 1.30 1.40 1.50 1.60 1.70 1.80 1.90 2.00 2.10 2.20 2.30 2.40 2.50 2.60 2.70 2.80 2.90 3.00 3.10 3.20 3.30 3.40 3.50 3.60 3.70 3.80 3.90 4.00 4.10 4.20 4.30 4.40 4.50 4.60 4.70 4.80 4.90 5.00 5.10 5.20 5.30 5.40 5.50 5.60
%
0
100
May21_devon_PFA-24 22: MRM of 3 Channels ES-
713 > 169 (PFTeDA)8955.56
5.56
5.525.49
5.59
5.675.64
5.67
May21_devon_PFA-24 21: MRM of 2 Channels ES-
663 > 169 (PFTriDA)738
5.43
5.425.375.28
5.265.36
5.34
5.46
5.50
5.54
May21_devon_PFA-24 20: MRM of 3 Channels ES-
613 > 169 (PFDoDA)1.12e3
5.155.23
5.20
5.335.245.31
May21_devon_PFA-24 18: MRM of 4 Channels ES-
563 > 319 (PFUnDA)1.19e3
4.98
4.944.93
5.03
5.05
5.09 5.11
May21_devon_PFA-24 16: MRM of 4 Channels ES-
513 > 219 (PFDA)1.79e3
4.79
4.77
4.71
4.80
4.844.86
May21_devon_PFA-24 13: MRM of 4 Channels ES-
463 > 219 (PFNA)5.63e3
4.48
4.40
4.50
4.524.56
May21_devon_PFA-24 9: MRM of 4 Channels ES-
413 > 169 (PFOA)1.33e44.12
May21_devon_PFA-24 6: MRM of 3 Channels ES-
363 > 119 (PFHpA)4.91e3
3.643.63
3.593.57
3.56
3.733.643.79
3.83
May21_devon_PFA-24 4: MRM of 4 Channels ES-
313 > 119 (PFHxA)2.86e3
2.972.91 3.072.99
3.05
3.183.17
3.213.24
May21_devon_PFA-24 2: MRM of 3 Channels ES-
263 > 219 (PFPeA)1.28e4
1.86 2.041.93 2.03 2.242.10 2.17 2.30
2.33
May21_devon_PFA-24 1: MRM of 3 Channels ES-
213 > 169 (PFBA)4.32e40.90
may15 CB F2
Time (min)
2.40 2.60 2.80 3.00 3.20 3.40 3.60 3.80 4.00 4.20 4.40 4.60 4.80 5.00
%
0
100
2.25 2.30 2.35 2.40 2.45 2.50 2.55 2.60 2.65 2.70 2.75 2.80 2.85 2.90 2.95 3.00 3.05 3.10 3.15 3.20 3.25 3.30 3.35 3.40 3.45 3.50 3.55 3.60 3.65 3.70 3.75 3.80 3.85 3.90 3.95 4.00 4.05 4.10 4.15 4.20 4.25 4.30 4.35 4.40 4.45 4.50 4.55 4.60 4.65 4.70 4.75 4.80 4.85 4.90 4.95 5.00 5.05 5.10
%
0
100
2.25 2.30 2.35 2.40 2.45 2.50 2.55 2.60 2.65 2.70 2.75 2.80 2.85 2.90 2.95 3.00 3.05 3.10 3.15 3.20 3.25 3.30 3.35 3.40 3.45 3.50 3.55 3.60 3.65 3.70 3.75 3.80 3.85 3.90 3.95 4.00 4.05 4.10 4.15 4.20 4.25 4.30 4.35 4.40 4.45 4.50 4.55 4.60 4.65 4.70 4.75 4.80 4.85 4.90 4.95 5.00 5.05 5.10
%
0
100
2.25 2.30 2.35 2.40 2.45 2.50 2.55 2.60 2.65 2.70 2.75 2.80 2.85 2.90 2.95 3.00 3.05 3.10 3.15 3.20 3.25 3.30 3.35 3.40 3.45 3.50 3.55 3.60 3.65 3.70 3.75 3.80 3.85 3.90 3.95 4.00 4.05 4.10 4.15 4.20 4.25 4.30 4.35 4.40 4.45 4.50 4.55 4.60 4.65 4.70 4.75 4.80 4.85 4.90 4.95 5.00 5.05 5.10
%
0
100
2.25 2.30 2.35 2.40 2.45 2.50 2.55 2.60 2.65 2.70 2.75 2.80 2.85 2.90 2.95 3.00 3.05 3.10 3.15 3.20 3.25 3.30 3.35 3.40 3.45 3.50 3.55 3.60 3.65 3.70 3.75 3.80 3.85 3.90 3.95 4.00 4.05 4.10 4.15 4.20 4.25 4.30 4.35 4.40 4.45 4.50 4.55 4.60 4.65 4.70 4.75 4.80 4.85 4.90 4.95 5.00 5.05 5.10
%
0
100
2.25 2.30 2.35 2.40 2.45 2.50 2.55 2.60 2.65 2.70 2.75 2.80 2.85 2.90 2.95 3.00 3.05 3.10 3.15 3.20 3.25 3.30 3.35 3.40 3.45 3.50 3.55 3.60 3.65 3.70 3.75 3.80 3.85 3.90 3.95 4.00 4.05 4.10 4.15 4.20 4.25 4.30 4.35 4.40 4.45 4.50 4.55 4.60 4.65 4.70 4.75 4.80 4.85 4.90 4.95 5.00 5.05 5.10
%
0
100
May21_devon_PFA-24 19: MRM of 2 Channels ES-
599 > 80 (PFDS)1.06e3
5.045.03
4.93
4.97 5.025.01 5.125.08
5.10
May21_devon_PFA-24 15: MRM of 6 Channels ES-
499 > 80 (PFOS)2.28e3
4.504.41
4.38
4.374.39 4.47
4.44
4.51
4.644.60
4.564.55
4.58
4.61
May21_devon_PFA-24 12: MRM of 2 Channels ES-
461 > 99 (PFECHS)3.55e3
4.08
3.96
3.94
3.92
3.88 3.90
3.96
4.043.97
4.024.00
4.09
4.104.14
4.124.20 4.27
4.224.27 4.28
May21_devon_PFA-24 11: MRM of 2 Channels ES-
449 > 80 (PFHpS)545
4.12
4.09
4.08
4.19
4.14
4.20
4.264.26
4.23
May21_devon_PFA-24 7: MRM of 5 Channels ES-
399 > 80 (PFHxS)2.70e3
3.66
3.68 3.75
3.73
3.71
3.76
3.773.78
3.85
3.83
3.87
May21_devon_PFA-24 3: MRM of 2 Channels ES-
299 > 80 (PFBS)1.87e3
2.38
2.372.21
2.222.25
2.302.28
2.35
2.38
2.39
2.412.592.492.42
2.46
2.462.47
2.52
2.562.54
0.059 ng/ml PFBA
0.005 ng/ml PFOA
Abu
ndan
ce (
%)
Page 17
17
Figure S4. Chromatogram of PFSAs and internal standards in Devon Ice Cap extract. Chromatograms have not been smoothed. Precursor-product ion transition is shown in red for analytes and blue for internal standards. Retention times for detected peaks are in purple. This sample contained 0.105 ng L-1 PFBS, 0.016 ng L-1 PFOS, and 0.0088 ng L-1 PFECHS. PFHxS, PFHpS, PFDS, were < LOD.
May15-5 DEVON 150-175 F2
Time (min)0.60 1.00 1.40 1.80 2.20 2.60 3.00 3.40 3.80 4.20 4.60 5.00 5.40
%
0
100
0.60 0.70 0.80 0.90 1.00 1.10 1.20 1.30 1.40 1.50 1.60 1.70 1.80 1.90 2.00 2.10 2.20 2.30 2.40 2.50 2.60 2.70 2.80 2.90 3.00 3.10 3.20 3.30 3.40 3.50 3.60 3.70 3.80 3.90 4.00 4.10 4.20 4.30 4.40 4.50 4.60 4.70 4.80 4.90 5.00 5.10 5.20 5.30 5.40 5.50 5.60
%
0
100
0.60 0.70 0.80 0.90 1.00 1.10 1.20 1.30 1.40 1.50 1.60 1.70 1.80 1.90 2.00 2.10 2.20 2.30 2.40 2.50 2.60 2.70 2.80 2.90 3.00 3.10 3.20 3.30 3.40 3.50 3.60 3.70 3.80 3.90 4.00 4.10 4.20 4.30 4.40 4.50 4.60 4.70 4.80 4.90 5.00 5.10 5.20 5.30 5.40 5.50 5.60
%
0
100
0.60 0.70 0.80 0.90 1.00 1.10 1.20 1.30 1.40 1.50 1.60 1.70 1.80 1.90 2.00 2.10 2.20 2.30 2.40 2.50 2.60 2.70 2.80 2.90 3.00 3.10 3.20 3.30 3.40 3.50 3.60 3.70 3.80 3.90 4.00 4.10 4.20 4.30 4.40 4.50 4.60 4.70 4.80 4.90 5.00 5.10 5.20 5.30 5.40 5.50 5.60
%
0
100
0.60 0.70 0.80 0.90 1.00 1.10 1.20 1.30 1.40 1.50 1.60 1.70 1.80 1.90 2.00 2.10 2.20 2.30 2.40 2.50 2.60 2.70 2.80 2.90 3.00 3.10 3.20 3.30 3.40 3.50 3.60 3.70 3.80 3.90 4.00 4.10 4.20 4.30 4.40 4.50 4.60 4.70 4.80 4.90 5.00 5.10 5.20 5.30 5.40 5.50 5.60
%
0
100
0.60 0.70 0.80 0.90 1.00 1.10 1.20 1.30 1.40 1.50 1.60 1.70 1.80 1.90 2.00 2.10 2.20 2.30 2.40 2.50 2.60 2.70 2.80 2.90 3.00 3.10 3.20 3.30 3.40 3.50 3.60 3.70 3.80 3.90 4.00 4.10 4.20 4.30 4.40 4.50 4.60 4.70 4.80 4.90 5.00 5.10 5.20 5.30 5.40 5.50 5.60
%
0
100
0.60 0.70 0.80 0.90 1.00 1.10 1.20 1.30 1.40 1.50 1.60 1.70 1.80 1.90 2.00 2.10 2.20 2.30 2.40 2.50 2.60 2.70 2.80 2.90 3.00 3.10 3.20 3.30 3.40 3.50 3.60 3.70 3.80 3.90 4.00 4.10 4.20 4.30 4.40 4.50 4.60 4.70 4.80 4.90 5.00 5.10 5.20 5.30 5.40 5.50 5.60
%
0
100
0.60 0.70 0.80 0.90 1.00 1.10 1.20 1.30 1.40 1.50 1.60 1.70 1.80 1.90 2.00 2.10 2.20 2.30 2.40 2.50 2.60 2.70 2.80 2.90 3.00 3.10 3.20 3.30 3.40 3.50 3.60 3.70 3.80 3.90 4.00 4.10 4.20 4.30 4.40 4.50 4.60 4.70 4.80 4.90 5.00 5.10 5.20 5.30 5.40 5.50 5.60
%
0
100
May21_devon_PFA-55 19: MRM of 2 Channels ES-
599 > 80 (PFDS)
1.72e3
May21_devon_PFA-55 15: MRM of 6 Channels ES-
503 > 80 (13C PFOS)
3.33e54.50
May21_devon_PFA-55 15: MRM of 6 Channels ES-
499 > 80 (PFOS)
2.20e44.50
May21_devon_PFA-55 12: MRM of 2 Channels ES-
461 > 99 (PFECHS)
1.86e44.09
May21_devon_PFA-55 11: MRM of 2 Channels ES-
449 > 80 (PFHpS)
4.02e3
May21_devon_PFA-55 7: MRM of 5 Channels ES-
403 > 84 (18O2 PFHxS)
3.98e53.73
May21_devon_PFA-55 7: MRM of 5 Channels ES-
399 > 80 (PFHxS)
4.97e3
May21_devon_PFA-55 3: MRM of 2 Channels ES-
299 > 80 (PFBS)
8.20e32.39
Abu
ndan
ce(%
)
Page 18
18
Figure S5. Chromatogram of PFCAs and internal standards in Devon Ice Cap extract. Chromatograms have not been smoothed. Precursor-product ion transition is shown in red for analytes and blue for internal standards. Retention times for detected peaks are in purple. This sample contained 0.89 ng L-1 PFBA, 0.29 ng L-1 PFPeA, 0.30 ng L-1 PFHxA, 0.54 ng L-1 PFHpA, 0.34 ng L-1 PFOA, 0.31 ng L-1 PFNA, 0.095 ng L-1 PFDA, 0.040 ng L-1 PFUnDA, 0.044 ng L-1 PFDoDA, 0.0083 ng L-1 PFTrDA. PFTeDA was <LOD.
Time (min)
0.60 1.00 1.40 1.80 2.20 2.60 3.00 3.40 3.80 4.20 4.60 5.00 5.40
%
0
100
0.60 0.70 0.80 0.90 1.00 1.10 1.20 1.30 1.40 1.50 1.60 1.70 1.80 1.90 2.00 2.10 2.20 2.30 2.40 2.50 2.60 2.70 2.80 2.90 3.00 3.10 3.20 3.30 3.40 3.50 3.60 3.70 3.80 3.90 4.00 4.10 4.20 4.30 4.40 4.50 4.60 4.70 4.80 4.90 5.00 5.10 5.20 5.30 5.40 5.50 5.60
%
0
100
0.60 0.70 0.80 0.90 1.00 1.10 1.20 1.30 1.40 1.50 1.60 1.70 1.80 1.90 2.00 2.10 2.20 2.30 2.40 2.50 2.60 2.70 2.80 2.90 3.00 3.10 3.20 3.30 3.40 3.50 3.60 3.70 3.80 3.90 4.00 4.10 4.20 4.30 4.40 4.50 4.60 4.70 4.80 4.90 5.00 5.10 5.20 5.30 5.40 5.50 5.60
%
0
100
0.60 0.70 0.80 0.90 1.00 1.10 1.20 1.30 1.40 1.50 1.60 1.70 1.80 1.90 2.00 2.10 2.20 2.30 2.40 2.50 2.60 2.70 2.80 2.90 3.00 3.10 3.20 3.30 3.40 3.50 3.60 3.70 3.80 3.90 4.00 4.10 4.20 4.30 4.40 4.50 4.60 4.70 4.80 4.90 5.00 5.10 5.20 5.30 5.40 5.50 5.60
%
0
100
0.60 0.70 0.80 0.90 1.00 1.10 1.20 1.30 1.40 1.50 1.60 1.70 1.80 1.90 2.00 2.10 2.20 2.30 2.40 2.50 2.60 2.70 2.80 2.90 3.00 3.10 3.20 3.30 3.40 3.50 3.60 3.70 3.80 3.90 4.00 4.10 4.20 4.30 4.40 4.50 4.60 4.70 4.80 4.90 5.00 5.10 5.20 5.30 5.40 5.50 5.60
%
0
100
0.60 0.70 0.80 0.90 1.00 1.10 1.20 1.30 1.40 1.50 1.60 1.70 1.80 1.90 2.00 2.10 2.20 2.30 2.40 2.50 2.60 2.70 2.80 2.90 3.00 3.10 3.20 3.30 3.40 3.50 3.60 3.70 3.80 3.90 4.00 4.10 4.20 4.30 4.40 4.50 4.60 4.70 4.80 4.90 5.00 5.10 5.20 5.30 5.40 5.50 5.60
%
0
100
0.60 0.70 0.80 0.90 1.00 1.10 1.20 1.30 1.40 1.50 1.60 1.70 1.80 1.90 2.00 2.10 2.20 2.30 2.40 2.50 2.60 2.70 2.80 2.90 3.00 3.10 3.20 3.30 3.40 3.50 3.60 3.70 3.80 3.90 4.00 4.10 4.20 4.30 4.40 4.50 4.60 4.70 4.80 4.90 5.00 5.10 5.20 5.30 5.40 5.50 5.60
%
0
100
0.60 0.70 0.80 0.90 1.00 1.10 1.20 1.30 1.40 1.50 1.60 1.70 1.80 1.90 2.00 2.10 2.20 2.30 2.40 2.50 2.60 2.70 2.80 2.90 3.00 3.10 3.20 3.30 3.40 3.50 3.60 3.70 3.80 3.90 4.00 4.10 4.20 4.30 4.40 4.50 4.60 4.70 4.80 4.90 5.00 5.10 5.20 5.30 5.40 5.50 5.60
%
0
100
0.60 0.70 0.80 0.90 1.00 1.10 1.20 1.30 1.40 1.50 1.60 1.70 1.80 1.90 2.00 2.10 2.20 2.30 2.40 2.50 2.60 2.70 2.80 2.90 3.00 3.10 3.20 3.30 3.40 3.50 3.60 3.70 3.80 3.90 4.00 4.10 4.20 4.30 4.40 4.50 4.60 4.70 4.80 4.90 5.00 5.10 5.20 5.30 5.40 5.50 5.60
%
0
100
0.60 0.70 0.80 0.90 1.00 1.10 1.20 1.30 1.40 1.50 1.60 1.70 1.80 1.90 2.00 2.10 2.20 2.30 2.40 2.50 2.60 2.70 2.80 2.90 3.00 3.10 3.20 3.30 3.40 3.50 3.60 3.70 3.80 3.90 4.00 4.10 4.20 4.30 4.40 4.50 4.60 4.70 4.80 4.90 5.00 5.10 5.20 5.30 5.40 5.50 5.60
%
0
100
0.60 0.70 0.80 0.90 1.00 1.10 1.20 1.30 1.40 1.50 1.60 1.70 1.80 1.90 2.00 2.10 2.20 2.30 2.40 2.50 2.60 2.70 2.80 2.90 3.00 3.10 3.20 3.30 3.40 3.50 3.60 3.70 3.80 3.90 4.00 4.10 4.20 4.30 4.40 4.50 4.60 4.70 4.80 4.90 5.00 5.10 5.20 5.30 5.40 5.50 5.60
%
0
100
0.60 0.70 0.80 0.90 1.00 1.10 1.20 1.30 1.40 1.50 1.60 1.70 1.80 1.90 2.00 2.10 2.20 2.30 2.40 2.50 2.60 2.70 2.80 2.90 3.00 3.10 3.20 3.30 3.40 3.50 3.60 3.70 3.80 3.90 4.00 4.10 4.20 4.30 4.40 4.50 4.60 4.70 4.80 4.90 5.00 5.10 5.20 5.30 5.40 5.50 5.60
%
0
100
May21_devon_PFA-55 13: MRM of 4 Channels ES-
468 > 423 (13C PFNA)1.01e64.48
May21_devon_PFA-55 13: MRM of 4 Channels ES-
463 > 219 (PFNA) 3.29e54.48
May21_devon_PFA-55 9: MRM of 4 Channels ES-
417 > 372 (13C-PFOA)7.63e54.12
May21_devon_PFA-55 9: MRM of 4 Channels ES-
413 > 169 (PFOA)4.92e54.12
4.00
May21_devon_PFA-55 6: MRM of 3 Channels ES-
367 > 322 (13 C PFHpA)8.68e53.68
May21_devon_PFA-55 6: MRM of 3 Channels ES-
363 > 119 (PFHpA)8.59e43.68
May21_devon_PFA-55 4: MRM of 4 Channels ES-
315 > 270 (13C2 PFHxA)7.15e53.07
May21_devon_PFA-55 4: MRM of 4 Channels ES-
313 > 119 (PFHxA)2.44e43.06
May21_devon_PFA-55 2: MRM of 3 Channels ES-
268 > 223 (M5PFPeA)2.63e52.10
May21_devon_PFA-55 2: MRM of 3 Channels ES-
263 > 219 (PFPeA) 2.40e52.09
May21_devon_PFA-55 1: MRM of 3 Channels ES-
217 > 172 (13C4 PFBA) 1.38e50.87
May21_devon_PFA-55 1: MRM of 3 Channels ES-
213 > 169 (PFBA) 5.68e50.89
May15-5 DEVON 150-175 F2
Time0.60 0.70 0.80 0.90 1.00 1.10 1.20 1.30 1.40 1.50 1.60 1.70 1.80 1.90 2.00 2.10 2.20 2.30 2.40 2.50 2.60 2.70 2.80 2.90 3.00 3.10 3.20 3.30 3.40 3.50 3.60 3.70 3.80 3.90 4.00 4.10 4.20 4.30 4.40 4.50 4.60 4.70 4.80 4.90 5.00 5.10 5.20 5.30 5.40 5.50 5.60
%
0
100
0.60 0.70 0.80 0.90 1.00 1.10 1.20 1.30 1.40 1.50 1.60 1.70 1.80 1.90 2.00 2.10 2.20 2.30 2.40 2.50 2.60 2.70 2.80 2.90 3.00 3.10 3.20 3.30 3.40 3.50 3.60 3.70 3.80 3.90 4.00 4.10 4.20 4.30 4.40 4.50 4.60 4.70 4.80 4.90 5.00 5.10 5.20 5.30 5.40 5.50 5.60
%
0
100
0.60 0.70 0.80 0.90 1.00 1.10 1.20 1.30 1.40 1.50 1.60 1.70 1.80 1.90 2.00 2.10 2.20 2.30 2.40 2.50 2.60 2.70 2.80 2.90 3.00 3.10 3.20 3.30 3.40 3.50 3.60 3.70 3.80 3.90 4.00 4.10 4.20 4.30 4.40 4.50 4.60 4.70 4.80 4.90 5.00 5.10 5.20 5.30 5.40 5.50 5.60
%
0
100
0.60 0.70 0.80 0.90 1.00 1.10 1.20 1.30 1.40 1.50 1.60 1.70 1.80 1.90 2.00 2.10 2.20 2.30 2.40 2.50 2.60 2.70 2.80 2.90 3.00 3.10 3.20 3.30 3.40 3.50 3.60 3.70 3.80 3.90 4.00 4.10 4.20 4.30 4.40 4.50 4.60 4.70 4.80 4.90 5.00 5.10 5.20 5.30 5.40 5.50 5.60
%
0
100
0.60 0.70 0.80 0.90 1.00 1.10 1.20 1.30 1.40 1.50 1.60 1.70 1.80 1.90 2.00 2.10 2.20 2.30 2.40 2.50 2.60 2.70 2.80 2.90 3.00 3.10 3.20 3.30 3.40 3.50 3.60 3.70 3.80 3.90 4.00 4.10 4.20 4.30 4.40 4.50 4.60 4.70 4.80 4.90 5.00 5.10 5.20 5.30 5.40 5.50 5.60
%
0
100
0.60 0.70 0.80 0.90 1.00 1.10 1.20 1.30 1.40 1.50 1.60 1.70 1.80 1.90 2.00 2.10 2.20 2.30 2.40 2.50 2.60 2.70 2.80 2.90 3.00 3.10 3.20 3.30 3.40 3.50 3.60 3.70 3.80 3.90 4.00 4.10 4.20 4.30 4.40 4.50 4.60 4.70 4.80 4.90 5.00 5.10 5.20 5.30 5.40 5.50 5.60
%
0
100
0.60 0.70 0.80 0.90 1.00 1.10 1.20 1.30 1.40 1.50 1.60 1.70 1.80 1.90 2.00 2.10 2.20 2.30 2.40 2.50 2.60 2.70 2.80 2.90 3.00 3.10 3.20 3.30 3.40 3.50 3.60 3.70 3.80 3.90 4.00 4.10 4.20 4.30 4.40 4.50 4.60 4.70 4.80 4.90 5.00 5.10 5.20 5.30 5.40 5.50 5.60
%
0
100
0.60 0.70 0.80 0.90 1.00 1.10 1.20 1.30 1.40 1.50 1.60 1.70 1.80 1.90 2.00 2.10 2.20 2.30 2.40 2.50 2.60 2.70 2.80 2.90 3.00 3.10 3.20 3.30 3.40 3.50 3.60 3.70 3.80 3.90 4.00 4.10 4.20 4.30 4.40 4.50 4.60 4.70 4.80 4.90 5.00 5.10 5.20 5.30 5.40 5.50 5.60
%
0
100
0.60 0.70 0.80 0.90 1.00 1.10 1.20 1.30 1.40 1.50 1.60 1.70 1.80 1.90 2.00 2.10 2.20 2.30 2.40 2.50 2.60 2.70 2.80 2.90 3.00 3.10 3.20 3.30 3.40 3.50 3.60 3.70 3.80 3.90 4.00 4.10 4.20 4.30 4.40 4.50 4.60 4.70 4.80 4.90 5.00 5.10 5.20 5.30 5.40 5.50 5.60%
0
100
May21_devon_PFA-55 22: MRM of 3 Channels ES-
715 > 670 (MPFTEDA)4.67e5
May21_devon_PFA-55 22: MRM of 3 Channels ES-
713 > 169 (PFTeDA)1.42e3
May21_devon_PFA-55 21: MRM of 2 Channels ES-
663 > 169 (PFTriDA)2.59e3
May21_devon_PFA-55 20: MRM of 3 Channels ES-
615 > 570 (13C2 PFDoDA)2.86e5
5.24
May21_devon_PFA-55 20: MRM of 3 Channels ES-
613 > 169 (PFDoDA)1.00e4
5.25
May21_devon_PFA-55 18: MRM of 4 Channels ES-
565 > 520 (13C2 PFUnDA)7.89e5
5.03
May21_devon_PFA-55 18: MRM of 4 Channels ES-
563 > 319 (PFUnDA)1.99e4
5.03
May21_devon_PFA-55 16: MRM of 4 Channels ES-
515 > 470 (13C2 PFDA) 6.54e54.77
May21_devon_PFA-55 16: MRM of 4 Channels ES-
513 > 219 (PFDA) 9.11e44.77
Abu
ndan
ce(%
)
Page 19
19
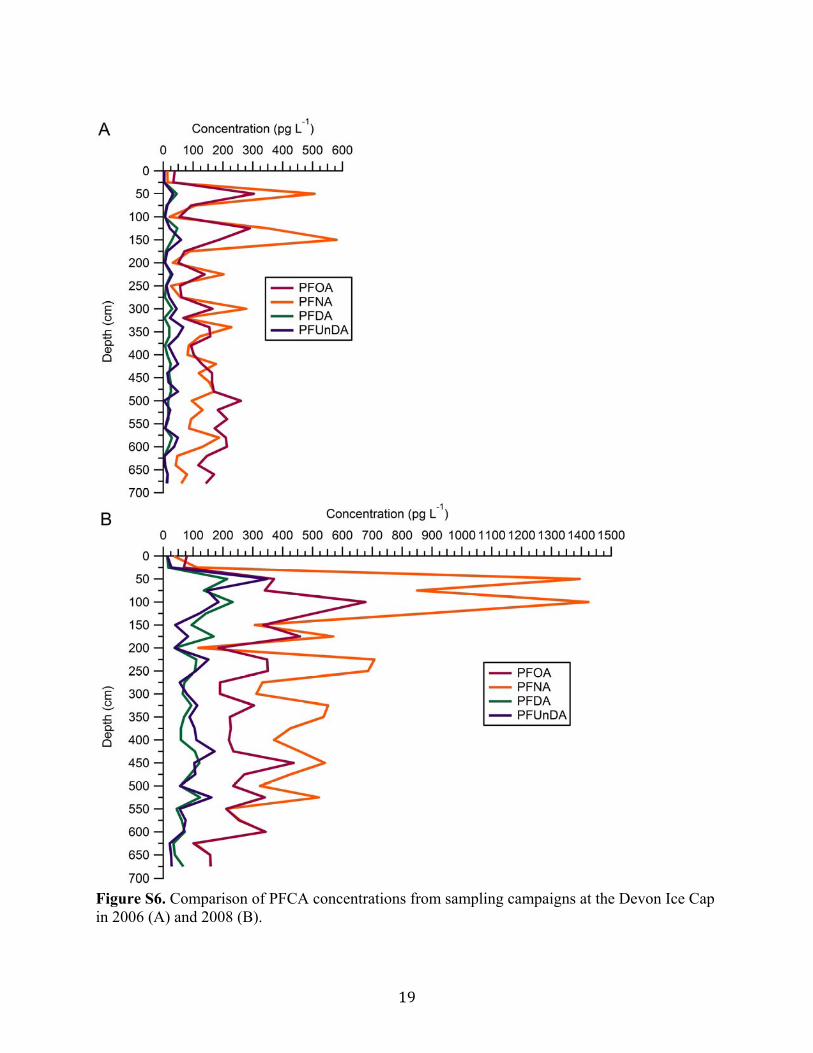
Figure S6. Comparison of PFCA concentrations from sampling campaigns at the Devon Ice Cap in 2006 (A) and 2008 (B).
Page 20
20
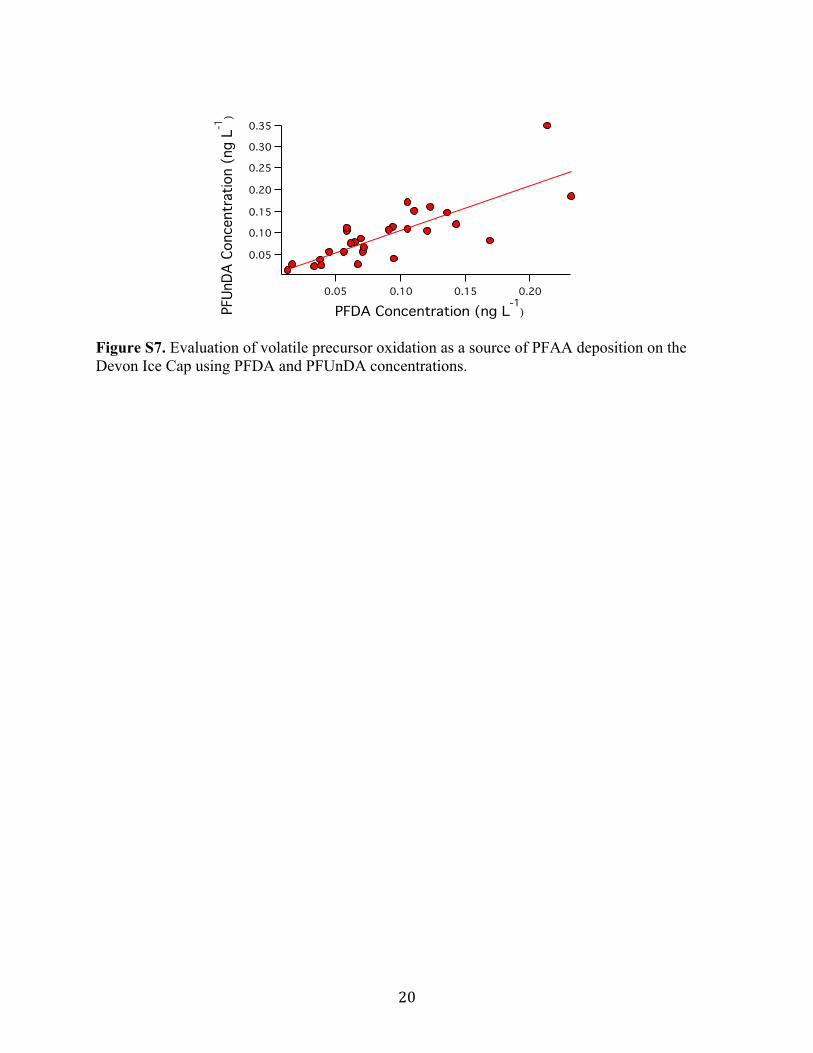
Figure S7. Evaluation of volatile precursor oxidation as a source of PFAA deposition on the Devon Ice Cap using PFDA and PFUnDA concentrations.
Page 21
21
Figure S8. Comparison of PFOS concentrations from sampling campaigns at the Devon Ice Cap in 2006 (A) and 2008 (B).
Page 22
22
Figure S9. Temporal flux trend for PFOA (a), PFNA (b), PFDA (c), PFUnDA (d), and PFOS (e) calculated from samples collected in 2006 (blue) and 2008 (purple), along with three-year moving averages.
Page 23
23
Figure S10. Comparison of a) PFOS flux using 2006 and 2008 sampling and b) first order elimination kinetics for PFOS flux from 1998-2004 using 2006 and 2008 data.
1998 1999 2000 2001 2002 2003 2004
-3.0
-2.5
-2.0
-1.5
-1.0
-0.5
0.0
ln P
FO
S f
lux
ln PFOS 2006 fluxln PFOS 2008 flux
1992 1994 1996 1998 2000 2002 2004 2006 2008
0
5
10
15
20
25
30
2006 sampling2008 sampling
year
PF
OS
flu
x (2
006)
ng
/m2
/y
1.0
1.5
2.0
2.5
3.0
3.5
4.0
PF
OS
flu
x (2
008)
ng
/m2/y
year
a)
b)
Page 24
24
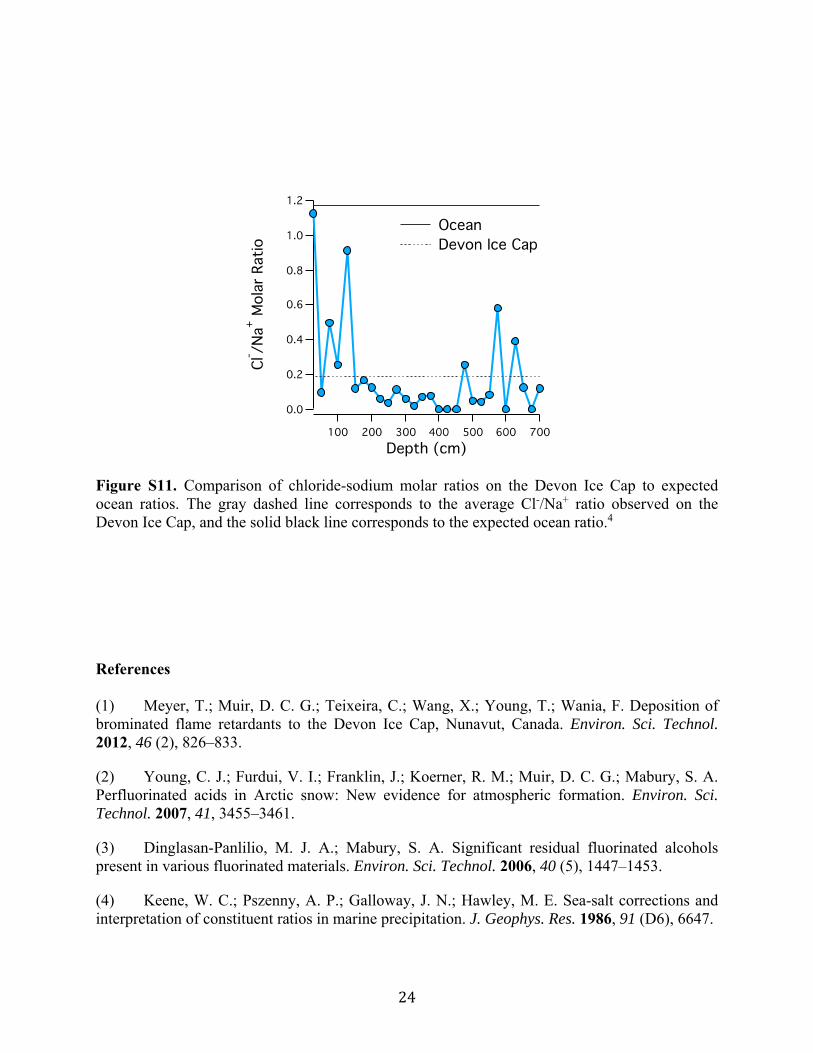
Figure S11. Comparison of chloride-sodium molar ratios on the Devon Ice Cap to expected ocean ratios. The gray dashed line corresponds to the average Cl-/Na+ ratio observed on the Devon Ice Cap, and the solid black line corresponds to the expected ocean ratio.4
References
(1) Meyer, T.; Muir, D. C. G.; Teixeira, C.; Wang, X.; Young, T.; Wania, F. Deposition of brominated flame retardants to the Devon Ice Cap, Nunavut, Canada. Environ. Sci. Technol. 2012, 46 (2), 826–833.
(2) Young, C. J.; Furdui, V. I.; Franklin, J.; Koerner, R. M.; Muir, D. C. G.; Mabury, S. A. Perfluorinated acids in Arctic snow: New evidence for atmospheric formation. Environ. Sci. Technol. 2007, 41, 3455–3461.
(3) Dinglasan-Panlilio, M. J. A.; Mabury, S. A. Significant residual fluorinated alcohols present in various fluorinated materials. Environ. Sci. Technol. 2006, 40 (5), 1447–1453.
(4) Keene, W. C.; Pszenny, A. P.; Galloway, J. N.; Hawley, M. E. Sea-salt corrections and interpretation of constituent ratios in marine precipitation. J. Geophys. Res. 1986, 91 (D6), 6647.