KEIO UNIVERSITY MARKET QUALITY RESEARCH PROJECT (A 21 st Century Center of Excellence Project) KUMQRP DISCUSSION PAPER SERIES DP2004-27 Trade Policy Formation in Latin America and Asia : A Comparative Analysis Mitsuyo Ando * Antoni Estevadeordal ** Abstract The 1990s witnessed a process of major trade liberalization around the world. This process has been particularly important in developing countries where a combination of unilateral trade reforms, multilateral liberalization, and a resurgence of regional integration has changed the structure of trade protection. As one of the projects of our group, “International issues and Asia”, this paper analyzes the trade policy formation in East Asia and Latin America. This paper makes a detailed analysis of trade liberalization in the two regions by exploring traditional tariff-barrier measures and non-tariff measures as well as discriminatory trade practices under free trade agreements, and addresses the similarities and differences. The differences in the trade policy formation between the two regions seem to significantly influence the development of international production networks in these regions. The paper also explores trade policy formation in both regions, using a factor analysis approach to understand the underlying factors behind the use of a given set of trade policy instruments. This analysis allows us to draw certain inferences regarding similarities and differences in the use of instruments by country and by sector. * Research Associate, 21 st century COE program, Faculty of Economics, Keio University ** Principal Trade Economist, Integration, Trade and Hemispheric Issues Division, Integration and Regional Programs Department, Inter-American Development Bank Graduate School of Economics and Graduate School of Business and Commerce, Keio University 2-15-45 Mita, Minato-ku, Tokyo 108-8345, Japan
Transcript
KEIO UNIVERSITY MARKET QUALITY RESEARCH PROJECT (A 21st Century Center of Excellence Project)
KUMQRP DISCUSSION PAPER SERIES
DP2004-27
Trade Policy Formation in Latin America and Asia : A Comparative Analysis
Mitsuyo Ando* Antoni Estevadeordal **
Abstract
The 1990s witnessed a process of major trade liberalization around the world.
This process has been particularly important in developing countries where a combination of
unilateral trade reforms, multilateral liberalization, and a resurgence of regional integration has
changed the structure of trade protection. As one of the projects of our group, “International issues
and Asia”, this paper analyzes the trade policy formation in East Asia and Latin America. This
paper makes a detailed analysis of trade liberalization in the two regions by exploring traditional
tariff-barrier measures and non-tariff measures as well as discriminatory trade practices under free
trade agreements, and addresses the similarities and differences. The differences in the trade policy
formation between the two regions seem to significantly influence the development of international
production networks in these regions. The paper also explores trade policy formation in both
regions, using a factor analysis approach to understand the underlying factors behind the use of a
given set of trade policy instruments. This analysis allows us to draw certain inferences regarding
similarities and differences in the use of instruments by country and by sector.
* Research Associate, 21st century COE program, Faculty of Economics, Keio University
** Principal Trade Economist, Integration, Trade and Hemispheric Issues Division, Integration
and Regional Programs Department, Inter-American Development Bank
Graduate School of Economics and Graduate School of Business and Commerce,
Keio University 2-15-45 Mita, Minato-ku, Tokyo 108-8345, Japan
Trade Policy Formation in Latin America and Asia:
A Comparative Analysis®
Mitsuyo Ando*
Antoni Estevadeordal**
® The previous version of this paper was presented at the LAEBA Panel at the FIEALC Meeting“Globalization in Asia and Latin America: Trade, Investment and Finance” on September 24, 2003 inOsaka, Japan.* Keio University. Email: [email protected]** Integration and Regional Programs Department. Inter-American Development Bank. Email:[email protected]
2
Abstract
The 1990s witnessed a process of major trade liberalization around the world. This
process has been particularly important in developing countries where a combination of
unilateral trade reforms, multilateral liberalization, and a resurgence of regional
integration has changed the structure of trade protection. This paper makes a detailed
analysis of trade liberalization in Latin America and Asia by exploring traditional tariff-
barrier measures and non-tariff measures as well as discriminatory trade practices under
free trade agreements. The paper first highlights similarities and differences in the
overall structure of protective measures among countries in the two regions, once all
trade measures are accounted for. The differences significantly influence the
development of international production networks in the two regions. Next, the paper
explores trade policy formation in both regions, using a factor analysis approach to
understand the underlying factors behind the use of a given set of trade policy
instruments. This analysis allows us to draw certain inferences regarding similarities
and differences in the use of instruments by country and by sector.
Contents
I. Introduction
II. Trade Policy Regimes in Latin America and Asia
Overview of Trade Protection
Regional Integration
III. Explaining Trade Policy Formation: A Factor Analysis Approach
Data
Analysis
IV. Conclusion
3
I. Introduction
Trade policy will surely form a prominent chapter in any account of the economic
history of Latin America and/or Asia in the XX century. Throughout that period,
external events played a key role in determining the path of development for most
countries in those regions. Decades from now, when economic historians look back at
the turn of the millennium, they will unquestionably remark on the role played by
external trade policies reformulated by most countries during the 1990s. Among all
structural reforms implemented in recent times, trade liberalization stands out as the
strategy most consistently advocated worldwide throughout the period. Although the
extent of liberalization has varied from country to country, this period will clearly be
seen as the most open era since the years immediately preceding the Great Depression
of the 1930s. Latin America and Asia differ in the way trade liberalization has been
implemented. Nonetheless, in both these regions, a complex web of simultaneous
unilateral, multilateral, and preferential (bilateral or regional) liberalization, involving
tariff and non-tariff measures, has characterized the structure of the liberalization
process.
These intermeshed policy efforts have defined a new paradigm in both regions for the
design and implementation of trade policy. This new paradigm was first given the name
“Open Regionalism” by the Economic Commission for Latin America and the
Caribbean (ECLAC). More recently, in a similar but more theoretical fashion, Ethier
(1998) analyzed this same phenomenon, referring to it as “New Regionalism.” Ethier’s
analysis first notes that most countries (particularly the smaller ones) implemented
extensive unilateral reforms and liberalized trade on a multilateral basis either prior to
or at the same time as they negotiated new preferential trade agreements. He then points
out that when countries of different relative sizes are involved, the burden of
liberalization has often been on the smaller country. Next, he explains that trade policy
reforms have usually involved far-reaching objectives, beyond a traditional opening of
the market. Finally, he notes a dominant regional bias, in a geographical sense, in most
preferential trade agreements.
4
One of the main contributions of introducing the concept of “New Regionalism” is to
refocus the analysis of trade liberalization and regional integration policies beyond
traditional static analysis. The research now analyzes strategic, institutional, and
political considerations in the design of trade policies at the country and sub-regional
levels; the combined working of the various liberalization policies or instruments; and
the impact of these policies in the medium term, not only on trade flows but also on
investment decisions, productivity levels, and growth performance. The goal of this
paper is to provide an exploratory analysis of the components of this complex mosaic of
trade policies in Latin America and Asia, and some of the interactions among the
various approaches. First, the paper provides an overview of trade policy paradigms in
Latin America and Asia in recent years. Second, it quantifies the scope and degree of
liberalization achieved on several fronts through various trade-related measures. Finally,
with a statistical tool, a factor analysis, interactions between the different measures and
levels of liberalization are reviewed, in order to understand the process of trade policy
formation in these two regions. Due to the limited data availability, our analysis is
restricted to seven countries in each region: Argentina, Brazil, Chile, Colombia, Mexico,
Peru, and Venezuela in Latin America; and China, Indonesia, Korea, Malaysia,
Philippines, Singapore, and Thailand in Asia.
II. Trade Policy Regimes in Latin America and Asia
During the 1990s, tariffs were reduced through multilateral trade negotiations in both
developed and developing countries. In particular, the Uruguay Round Agreements in
1994 and the establishment of the World Trade Organization (WTO) in 1995 promoted
further trade liberalization on a multilateral basis through tariff reduction as well as an
increase in the number of tariff bindings.1 The Uruguay Round also made important
progress in reducing some cross-border types of measures other than tariffs, or non-
1 Through the Uruguay Round negotiations (1986-1994), the percentage of bound tariff lines, for instance,increased from 78 percent to 99 percent for developed countries, from 21 percent to 73 percent fordeveloping countries, and from 73 percent to 98 percent for transition economies (WTO website,http://www.wto.org/english/tratop_e/schedules_e/goods_schedules_e.htm).
5
tariff measures (NTMs), though governments have tended to implement more subtle
forms of protection through other instruments such as technical standards.2 On the other
hand, the last decade also witnessed a movement toward regional integration and the
development of free trade agreements (FTAs), regional trade agreements (RTAs), or
preferential trade agreements (PTAs), which allow their member countries to enjoy
preferential tariffs that are even lower than Most Favored Nation (MFN) tariffs. In other
words, trade liberalization during the last decade proceeded on a bilateral or regional
basis as well. In this section, we provide a comparative overview of trade policies and
measures in Latin America and Asia, as well as a comparative assessment of the level of
regional integration achieved by countries in the region through FTAs or PTAs.
Overview of Trade Protection
Latin America and Asia are not exceptions to the above-described global trend, and
have remarkably reduced tariffs since the late 1980s, especially during the mid-1990s
(Table 1). Nonetheless, the two regions’ trade-policy strategies are far from identical.
First, the strategy for tariff binding and establishing tariff rates is different; wider
coverage of tariff bindings and higher MFN tariffs in Latin America and narrower
coverage of tariff bindings and lower MFN tariffs in Asia. In Latin America, the
percentage of bound tariff lines increased, from 38 percent for industrial products and
36 percent for agricultural products prior to the Uruguay Round, to 100 percent for both
sectors thereafter.3 In other words, tariff ceilings now exist on all products in this region
at the WTO bound rates: on average 35 percent for Argentina, 32 percent for Brazil, 25
percent for Chile, 52 percent for Colombia, 49 percent for Mexico, 32 percent for Peru,
and 39 percent for Venezuela in 1999-2000 (Table 2). Although MFN applied tariff
rates are lower than these bound rates, none of the countries still has tariffs below 10
percent on average: 16 percent for Argentina, 16 percent for Brazil, 10 percent for Chile,
2 See, for instance, Inter-American Development Bank (2002, Figure 3.7) for the coverage of NTMs(overall NTMs, quantitative measures, technical measures) among 11 Latin American countries, andAndo (2002, Table 3 and Table A-1) for the coverage of various types of NTMs by type and sector among13 APEC member economies.3 See Inter-American Development Bank (2002) and the WTO website(http://www.wto.org/english/thewto e/whatis e/eol/e/wto01/wto1 45.htm) for tariff bindings in LatinAmerica.
6
12 percent for Colombia, 18 percent for Mexico, 14 percent for Peru, and 13 percent for
Venezuela in 1999-2000.
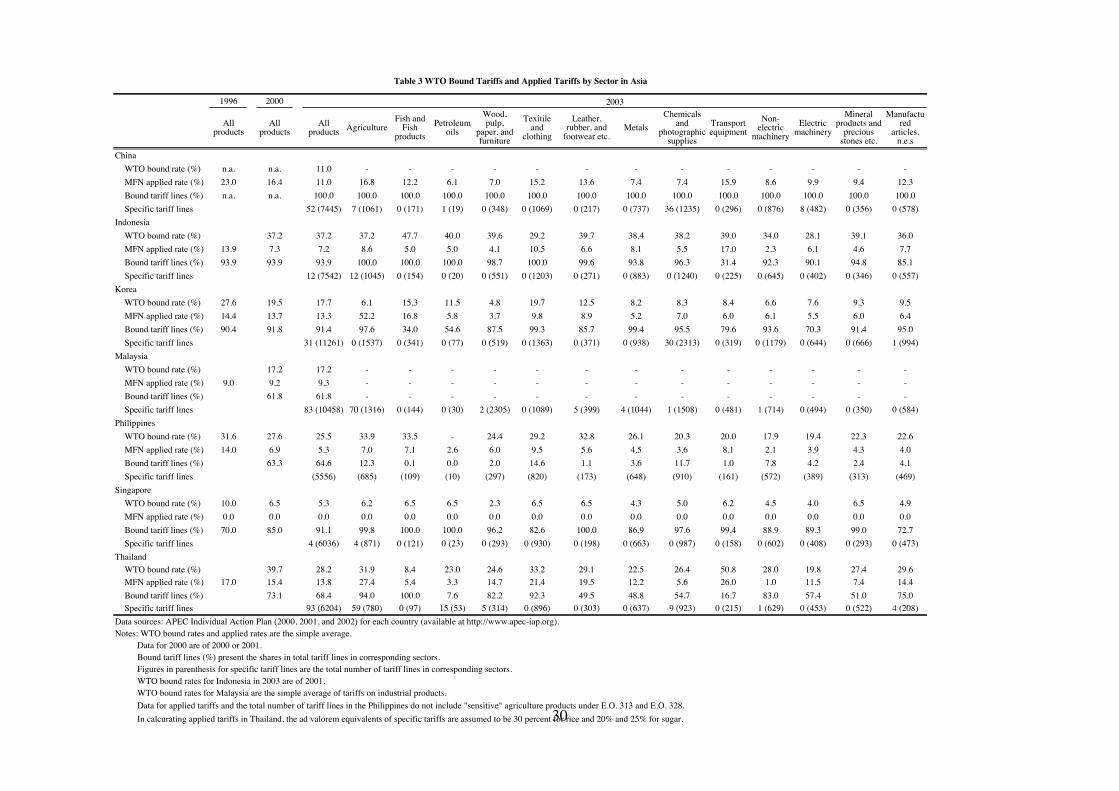
In contrast, Asian countries except China do not bind all tariff lines (Table 3). Coverage
of bound tariffs is 94 percent for Indonesia, 91 percent for Korea, 62 percent for
Malaysia, 63 percent for the Philippines, 85 percent for Singapore, and 73 percent for
Thailand in 2000 and 100 percent for China in 2003; some of them are quite far from
100 percent, which has been achieved by all the countries in Latin America.4 Average
tariffs per se, however, are lower in Asia; the WTO bound rates and MFN applied rates
are 37 percent and 7 percent for Indonesia, 20 percent and 14 percent for Korea, 17
percent and 9 percent for Malaysia, 28 percent and 7 percent for the Philippines, and 7
percent and 0 percent for Singapore, and 40 percent and 15 percent for Thailand,
respectively, and 16 percent (applied rate) for China in 2000.5 Although China and
Thailand have relatively high tariffs, compared with other Asian countries, average
MFN tariff rate in the region is approximately seven percent, which is much lower than
the rate exceeding 10 percent in Latin America (Figures 1 and 2).6 These indicate that
although some tariffs could theoretically be raised without a ceiling since they are not
bounded, contrary to Latin America, overall tariff rates in terms of ad valorem tariffs are
actually lower in Asia.
Second, the two regions take different approaches to import substitution and export
promotion. In East Asia, “the dual-track approach” has been kept since the 1970s; i.e.,
both import-substituting industries and export-oriented industries have been promoted at
the same time. East Asian countries, however, have gradually shifted their focus on
export orientation from import substitution.7 Particularly since the mid 1980s or the
4 China bound all tariffs at the accession of WTO.5 Korea’s simple average of MFN applied tariffs also exceeds 10 percent as China and Thailand do.However, average MFN tariffs for all the manufacturing sectors are less than 10 percent in 2003 as Table3 presents. The high simple average tariff rate is due to much higher tariffs imposed on agriculture andfishery sectors than those on manufacturing sectors, particularly high out-quota tariffs on them. Theimport weighted applied rate in 2001 lowers to the level of 8 percent.6 The bar-graph in Figures 1 and 2 show median levels. Data used for these figures are at the StandardInternational Trade Classification (SITC) three-digit level. A more detailed explanation of the source-datafor these figures is provided in Section IV.7 From the 1970s to the mid-1980s, East Asian countries applied selective introduction of FDI primarily
7
early 1990s, while keeping trade protection for limited import-substituting industries,
they have implemented various types of trade and FDI facilitation measures including
policies for export promotion, which help reduce service link costs, to aggressively
attract incoming FDI, formulate industrial clusters, and develop international
production/distribution networks.8
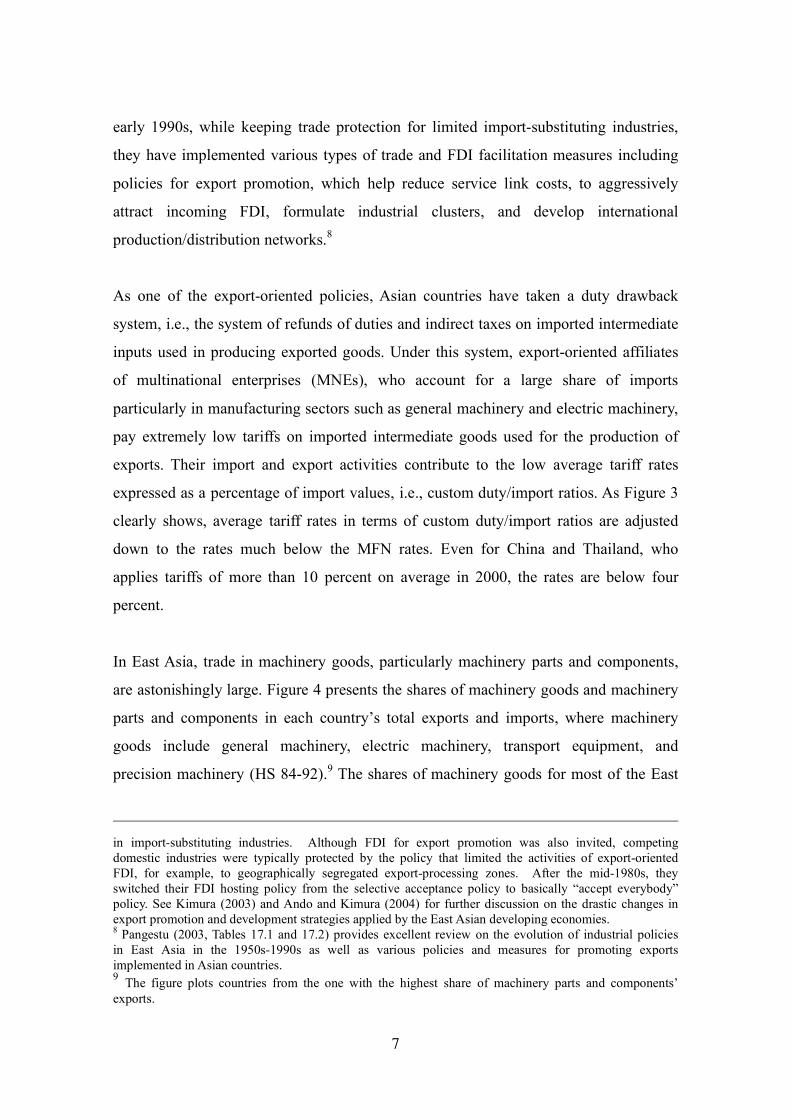
As one of the export-oriented policies, Asian countries have taken a duty drawback
system, i.e., the system of refunds of duties and indirect taxes on imported intermediate
inputs used in producing exported goods. Under this system, export-oriented affiliates
of multinational enterprises (MNEs), who account for a large share of imports
particularly in manufacturing sectors such as general machinery and electric machinery,
pay extremely low tariffs on imported intermediate goods used for the production of
exports. Their import and export activities contribute to the low average tariff rates
expressed as a percentage of import values, i.e., custom duty/import ratios. As Figure 3
clearly shows, average tariff rates in terms of custom duty/import ratios are adjusted
down to the rates much below the MFN rates. Even for China and Thailand, who
applies tariffs of more than 10 percent on average in 2000, the rates are below four
percent.
In East Asia, trade in machinery goods, particularly machinery parts and components,
are astonishingly large. Figure 4 presents the shares of machinery goods and machinery
parts and components in each country’s total exports and imports, where machinery
goods include general machinery, electric machinery, transport equipment, and
precision machinery (HS 84-92).9 The shares of machinery goods for most of the East
in import-substituting industries. Although FDI for export promotion was also invited, competingdomestic industries were typically protected by the policy that limited the activities of export-orientedFDI, for example, to geographically segregated export-processing zones. After the mid-1980s, theyswitched their FDI hosting policy from the selective acceptance policy to basically “accept everybody”policy. See Kimura (2003) and Ando and Kimura (2004) for further discussion on the drastic changes inexport promotion and development strategies applied by the East Asian developing economies.8 Pangestu (2003, Tables 17.1 and 17.2) provides excellent review on the evolution of industrial policiesin East Asia in the 1950s-1990s as well as various policies and measures for promoting exportsimplemented in Asian countries.9 The figure plots countries from the one with the highest share of machinery parts and components’exports.
8
Asian countries reach as high as 40 percent or even higher up to around 70 percent.
Moreover, the shares of parts and components in machinery trade are also very high:
more than half of machinery trade is of machinery parts and components. These
evidences suggest a large portion of back-and-forth transactions of parts and
components (intermediate goods) of manufactured products among countries in the
region, utilizing various types of trade facilitation measures including the duty
drawback system, and the formation of international production/distribution networks.10
In contrast, Latin America has not actively implemented those types of export-oriented
policies. Rather, the import-substituting policies seem to be reflected in their tariff rates
by sector: tariffs in manufacturing sectors are almost same or even higher than those in
agricultural sectors in some countries such as Argentina and Brazil while they are
basically much lower in Asia (Tables 2 and 3). Of course, Latin American countries
provide many member countries of FTAs/PTAs with preferential tariffs that are much
lower than MFN tariffs since they have concluded numerous FTAs/PTAs, forming an
intricate trade web among countries in the region. As Figures 1 and 2 clearly show, the
gap between MFN tariffs and preferential tariffs, or the marginal preference, is much
wider in Latin American than in Asia. These lower preferential tariffs may contribute to
an increase in exports to/imports from the member countries. However, non-members
are doubtlessly forced to bear much higher MFN tariffs when they export to Latin
America.11
In fact, Latin American countries, with Mexico as a notable exception, present by far
lower shares of machinery exports than those observed for countries in Asia (Figure 4).
10 See Ando and Kimura (2004) and Kimura and Ando (2003, 2004a, 2004b) for micro-data analysis ofMNEs (Japanese firms and U.S. firms) and discussion on the formation of internationalproduction/distribution networks in East Asia and other regions. Also, see Ando (2005) for the analysison the development of trade structure and vertical production sharing across borders in East Asia in the1990s.11 Since local supporting industries are typically immature in developing countries, MNEs must oftenimport some key parts and components from the home country. Thus, MNEs from non-member countrieswould face serious disadvantages in competition with intra-regional MNEs. This is what actuallyoccurred in Mexico, and a number of Japanese firms actually closed their operations in Mexico. SeeCasanova (2003, appendix) for a list of selected companies that have transferred operations from Mexicoto other countries.
9
In particular, the shares of machinery parts and components are pretty low: 26 percent
for Mexico, 11 percent for Brazil, and less than 5 percent for the rest of countries.
Furthermore, the shares of machinery imports are much higher than the shares of
exports. These indicate that manufacturing production activities in Latin America are of
import-substituting type, and that Latin America is not forming international
production/distribution networks yet except the networks between the United States and
Mexico.
Third, the types of tariffs implemented are different. Latin America imposes only ad
valorem tariffs on imports. Chile, a typical country, has applied uniform tariffs since
trade liberalization started in the late 1980s. In contrast, Asia still implements not only
ad valorem tariffs but also specific tariffs or a combination of the two.12 In 2003, for
instance, China has 52 specific tariff lines out of 7,445 tariff lines, Indonesia 12 out of
7,542, Korea 31 out of 11,261, Malaysia 83 out of 10,458, Singapore 4 out of 6,036, and
Thailand 93 out of 6,204 (Table 3). The sectors in which specific tariffs are
implemented vary among countries, but many of the tariff lines with specific tariffs are
commonly found in sectors such as agriculture and chemicals. Since specific tariffs
cannot automatically converted into ad valorem rates, analyses based on ad valorem
tariffs may in some cases underestimate the degree of trade protection created by tariffs
as a whole in Asia.
Fourth, methods for protecting specific products are different. In Latin America,
standard deviations of MFN tariffs are small (less than 10 percent), except for
agricultural sector in Mexico, indicating that MFN tariffs are relatively uniform across
products (Table 2). In addition, when dispersion (standard deviation) among MFN
tariffs is compared to dispersion among preferential tariffs, Latin America shows greater
spreads among preferential tariffs (Figures 1 and 2). These suggest that Latin America is
perhaps protecting specific products by imposing differentiated levels of preferential
12 See Trade Analysis and Information System (TRAINS) database, the ASEAN secretariat website(http://www.aseansec.org/menu.asp?action=4&content=16), and the WTO website(http://www.wto.org/english/tratop_e/schedules_e/goods_schedules_e.htm) for detailed information ontariffs, including specific tariffs in Asia.
10
tariffs in addition to higher MFN tariffs that are relatively uniform across products. In
contrast, Asia shows greater spreads among MFN tariffs than those among preferential
tariffs (Figures 1 and 2). Moreover, Asian countries present variation across sectors in
MFN tariff rates, the percentage of bound tariff lines, and application of specific tariffs
(Table 3). These facts imply that Asia seems to favor the use of MFN tariffs over
preferential tariffs as methods for effectively protecting specific products.
So far, we have discussed tariff policies in the two regions, focusing on their differences.
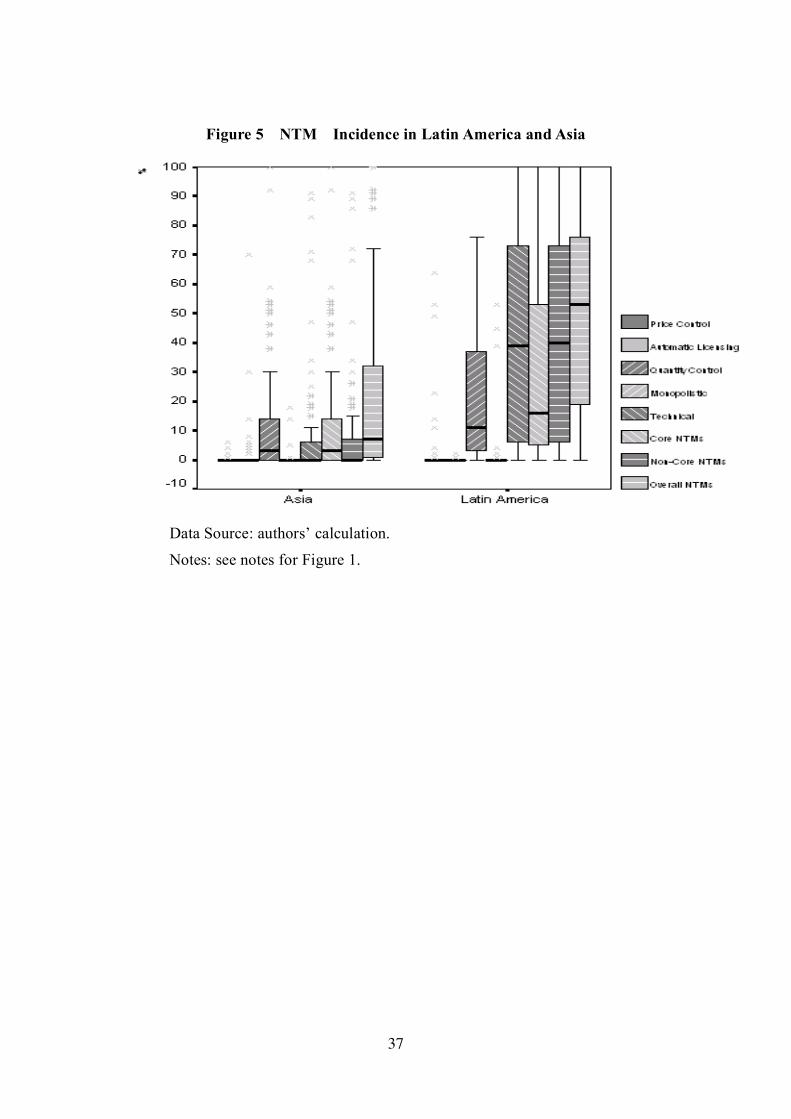
Yet differences are also reflected in NTM policies. Figures 5 and 6 present the incidence
of NTMs in terms of the percentage of tariff lines subject to NTMs, i.e., frequency ratio,
by the type of NTMs.13 The NTMs examined here include price-control measures,
automatic licensing measures, quantity control measures, monopolistic measures, and
technical measures. In addition to data on frequency ratios of by-type measures, the
figures also provide data on frequency ratios of core NTMs, non-core NTMs, and
overall NTMs.14 Core NTMs consist of price control measures and quantity control
measures. All other measures are considered non-core NTMs. The figures illustrate that
both Latin America and Asia implement NTMs, in particular quantity-control and
technical measures.
Two significant differences are observed in the figures. First, the scope of NTM
application considerably varies. The incidence of NTMs overall is more than 50 percent
in Latin America, but is less than 10 percent in Asia. It should be borne in mind,
however, that the UNCTAD database, Trade Analysis and Information System
(TRAINS), used for frequency-ratio calculations, are provided on a reporting base. Data
for Lain America have been firmly corrected with additional data collection in the Inter-
American Development Bank, while data for Asia have not. Even so, a difference in the
range of products subject to NTMs is clearly apparent. Second, the principal measures
implemented in the two regions are dissimilar. Latin America as a whole generally
depends upon technical measures while Asia mainly employs quantity control measures.
13 See the data description in the Appendix for how these frequency ratios are formulated.14 The classification of NTMs basically follows the United Nations Conference on Trade andDevelopment (UNCTAD) classification. Data used for these figures are at the SITC one-digit level.
11
Regional Integration
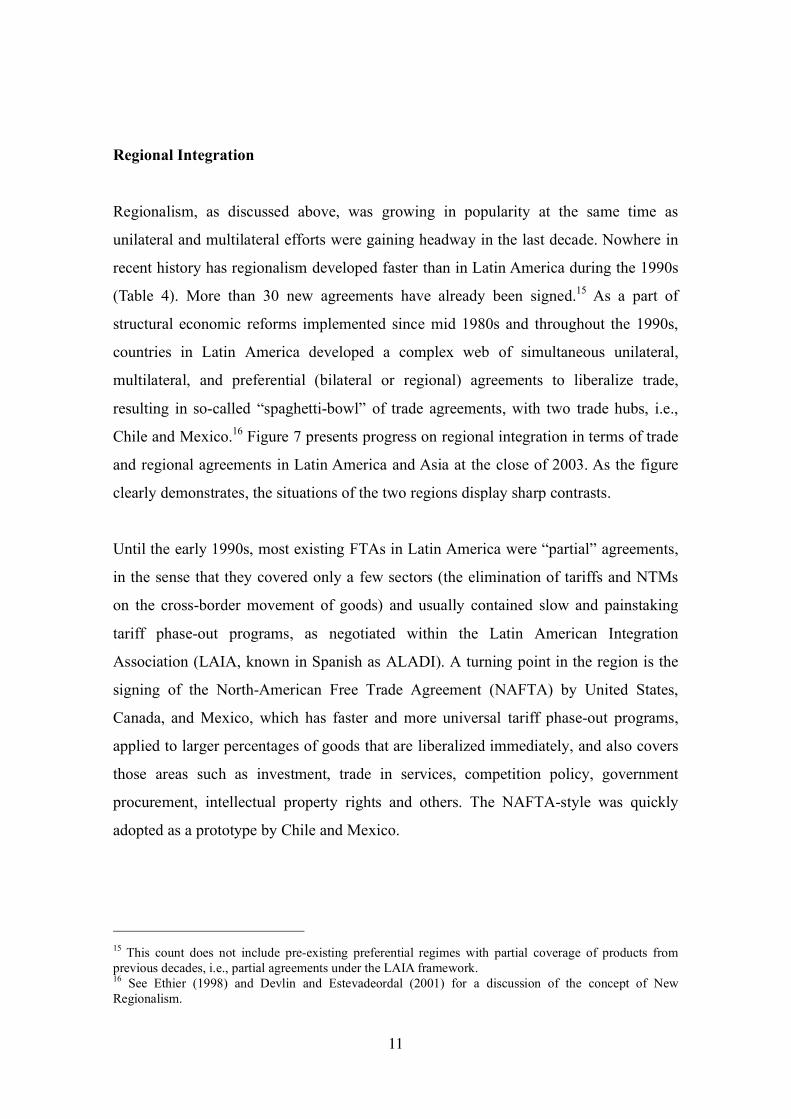
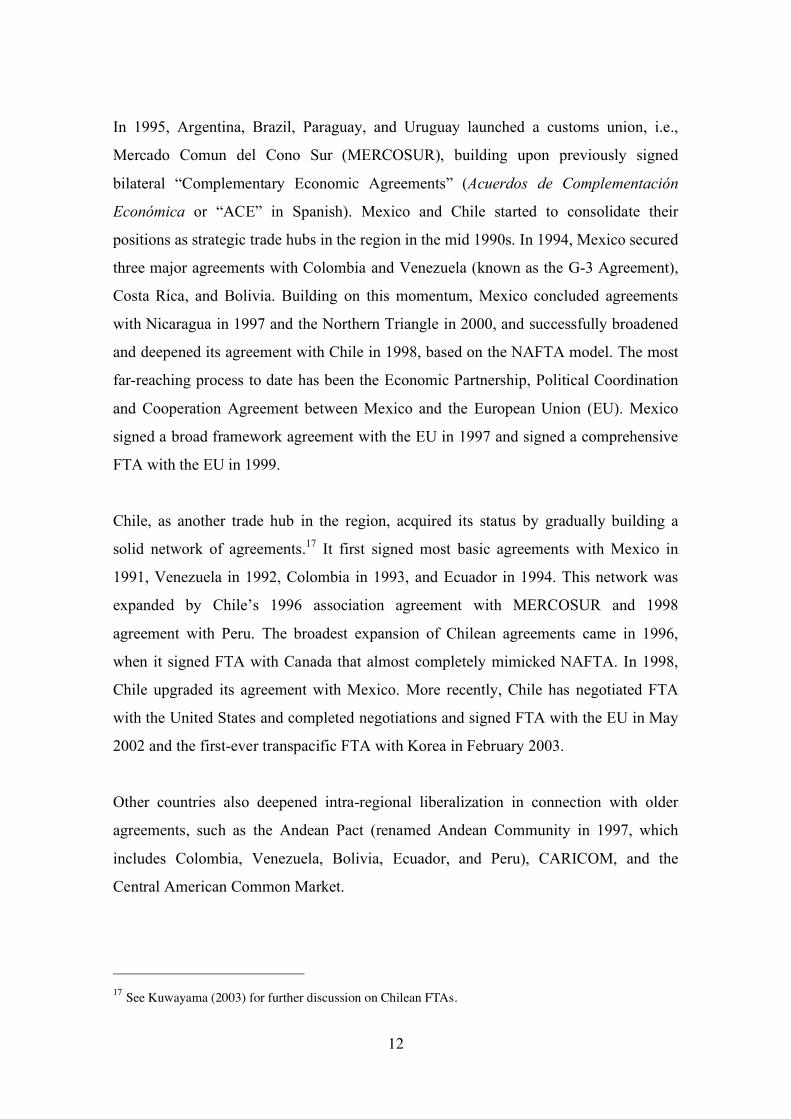
Regionalism, as discussed above, was growing in popularity at the same time as
unilateral and multilateral efforts were gaining headway in the last decade. Nowhere in
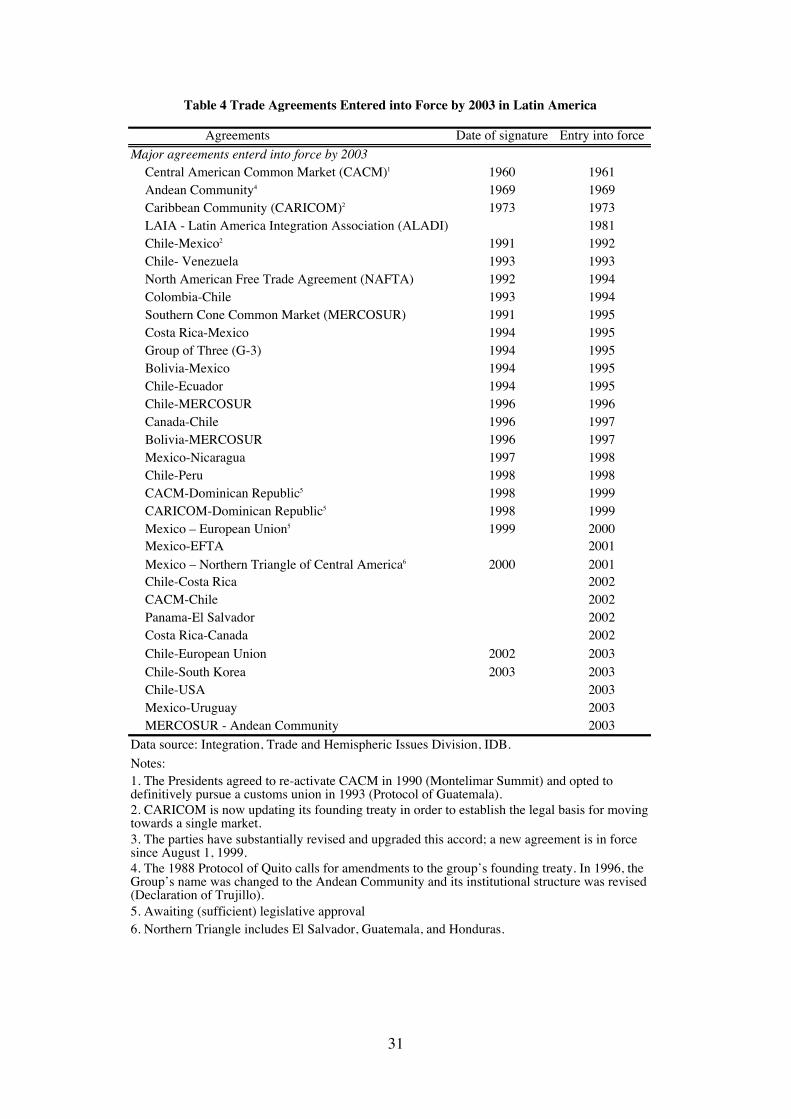
recent history has regionalism developed faster than in Latin America during the 1990s
(Table 4). More than 30 new agreements have already been signed.15 As a part of
structural economic reforms implemented since mid 1980s and throughout the 1990s,
countries in Latin America developed a complex web of simultaneous unilateral,
multilateral, and preferential (bilateral or regional) agreements to liberalize trade,
resulting in so-called “spaghetti-bowl” of trade agreements, with two trade hubs, i.e.,
Chile and Mexico.16 Figure 7 presents progress on regional integration in terms of trade
and regional agreements in Latin America and Asia at the close of 2003. As the figure
clearly demonstrates, the situations of the two regions display sharp contrasts.
Until the early 1990s, most existing FTAs in Latin America were “partial” agreements,
in the sense that they covered only a few sectors (the elimination of tariffs and NTMs
on the cross-border movement of goods) and usually contained slow and painstaking
tariff phase-out programs, as negotiated within the Latin American Integration
Association (LAIA, known in Spanish as ALADI). A turning point in the region is the
signing of the North-American Free Trade Agreement (NAFTA) by United States,
Canada, and Mexico, which has faster and more universal tariff phase-out programs,
applied to larger percentages of goods that are liberalized immediately, and also covers
those areas such as investment, trade in services, competition policy, government
procurement, intellectual property rights and others. The NAFTA-style was quickly
adopted as a prototype by Chile and Mexico.
15 This count does not include pre-existing preferential regimes with partial coverage of products fromprevious decades, i.e., partial agreements under the LAIA framework.16 See Ethier (1998) and Devlin and Estevadeordal (2001) for a discussion of the concept of NewRegionalism.
12
In 1995, Argentina, Brazil, Paraguay, and Uruguay launched a customs union, i.e.,
Mercado Comun del Cono Sur (MERCOSUR), building upon previously signed
bilateral “Complementary Economic Agreements” (Acuerdos de Complementación
Económica or “ACE” in Spanish). Mexico and Chile started to consolidate their
positions as strategic trade hubs in the region in the mid 1990s. In 1994, Mexico secured
three major agreements with Colombia and Venezuela (known as the G-3 Agreement),
Costa Rica, and Bolivia. Building on this momentum, Mexico concluded agreements
with Nicaragua in 1997 and the Northern Triangle in 2000, and successfully broadened
and deepened its agreement with Chile in 1998, based on the NAFTA model. The most
far-reaching process to date has been the Economic Partnership, Political Coordination
and Cooperation Agreement between Mexico and the European Union (EU). Mexico
signed a broad framework agreement with the EU in 1997 and signed a comprehensive
FTA with the EU in 1999.
Chile, as another trade hub in the region, acquired its status by gradually building a
solid network of agreements.17 It first signed most basic agreements with Mexico in
1991, Venezuela in 1992, Colombia in 1993, and Ecuador in 1994. This network was
expanded by Chile’s 1996 association agreement with MERCOSUR and 1998
agreement with Peru. The broadest expansion of Chilean agreements came in 1996,
when it signed FTA with Canada that almost completely mimicked NAFTA. In 1998,
Chile upgraded its agreement with Mexico. More recently, Chile has negotiated FTA
with the United States and completed negotiations and signed FTA with the EU in May
2002 and the first-ever transpacific FTA with Korea in February 2003.
Other countries also deepened intra-regional liberalization in connection with older
agreements, such as the Andean Pact (renamed Andean Community in 1997, which
includes Colombia, Venezuela, Bolivia, Ecuador, and Peru), CARICOM, and the
Central American Common Market.
17 See Kuwayama (2003) for further discussion on Chilean FTAs.
13
The regional momentum in Latin America is being in full force.18 Negotiations on the
most ambitious initiative for economic integration ever in the Hemisphere —the Free
Trade Area of the Americas (FTAA) agreement— are advancing as scheduled towards
the 2005 deadline. Those negotiations, however, have not stopped countries in the
region from simultaneously pursuing bilateral negotiations.19
In the Asian-Pacific region, a clear trend towards creating FTAs has just begun to be
observed very recently. In contract with Latin America, Asia has still far fewer
agreements. Major agreements with comprehensive coverage, which have gone into
effect by the close of 2002, are as follows: Australia New Zealand Close Economic
Association of South East Asian Nations (ASEAN) Free Trade Area (AFTA),
Agreement between New Zealand and Singapore on a Close Economic Partnership
(ANZSCEP), and Agreement between Japan and the Republic of Singapore for a New
Age Economic Partnership (JSEPA).2021 CER and ANZSCEP, in principle, eliminated
all tariffs upon entry into effect. JSEPA removed all tariffs on the Singapore side upon
entry into effect. On the Japanese side, tariffs were basically removed upon entry into
force, but tariffs imposed on 10 petrochemical products are supposed to gradually phase
out under the elimination schedule specified in the agreement.
18 In Latin America, several countries in the region are still beneficiaries of important non-reciprocalagreements or “one-way” preferential arrangements though most of the initiatives are reciprocal tradeagreements. These are generally preferences granted by the United States and Canada under the AndeanTrade Preferences Act, the Caribbean Basin Initiative, and the Generalized System of Preferences (GSP).Several countries are also beneficiaries of the EU GSP regime and a special agreement with theCaribbean. Yet those regimes do not provide preferential treatment to all products in all countries.19 This is especially true for the largest player in the Hemisphere: the United States. As of March 2003,the United States had FTAs with Canada, Mexico, and Israel, and had concluded negotiations withSingapore and Chile. The U.S. Congress has been notified of negotiations with Central America, Morocco,the South African Customs Union, and Australia. It is also contemplating FTA with South Korea, Taiwan,New Zealand, Egypt, and at least three members of ASEAN (Indonesia, the Philippines and Thailand)under the “Enterprise for ASEAN Initiative.”20 The years when agreements were set up are as follows: CER went into effect in 1983; APEC wasestablished in 1989; AFTA commenced in 1993; ANZSCEP went into effect in 2001; and JSEPA wentinto effect in 2002.21 In Asia-Pacific region, Other regional agreements not listed here include the India-Sri Lanka FreeTrade Agreement, the Bangkok Agreement, the South Pacific Regional Trade and Economic Co-operationAgreement (SPARTECA), the Agreement on SAARC (the South Asian Association for RegionalCooperation) Preferential Trading Agreement (SAPTA), and Melanesian Spearhead Group (MSG) TradeAgreement. These are, except India-Sri Lanka FTA, preferential agreements without comprehensivecoverage of products for trade liberalization or non-reciprocal preferential trade agreements.
14
APEC and AFTA are not FTAs as defined by the WTO and thus have a different trade
liberalization scheme. APEC does not have a specific schedule for eliminating tariffs.
APEC member economies, however, are expected to make voluntarily efforts to
liberalize trade regimes under Annual Individual Action Plans (IAPs), introduced in
1996. In the case of AFTA, the member countries have reduced preferential tariffs
pursuant to the Common Effective Preferential Tariff (CEPT) Scheme. Under this
scheme, goods are categorized into five groups: the Inclusion List’s Fast Track, the
Inclusion List’s Normal Track, the Temporary Exclusion List, the Sensitive List, and
General Exceptions, and CEPT tariffs are set for the goods in the Inclusion List (Fast
Track or Normal Track). The original six members, i.e., Brunei, Indonesia, Malaysia,
Philippines, Singapore, and Thailand, are committed to reduce these CETP tariffs to 0-5
percent by 2002, Viet Nam by 2006, Laos and Myanmar by 2008, and Cambodia by
2010. Moreover, the year for removal of tariffs on all goods is targeted as 2010 for the
original members and 2015 for the rest of the countries.
As is well known, without a certificate of origin, lower preferential tariffs cannot be
granted to products, even if those products are imported from the member countries. In
the case of AFTA, for instance, for the original six signatories, at least 85 percent of
their products were on the Inclusion List with CEPT tariffs of 0 to 5 percent in 2000. By
2001, this figure had risen to more than 90 percent.22 Nevertheless, CEPT tariffs have
been applied to only a small portion of intra-regional trade.23 One of the reasons is the
procedural difficulty in obtaining certificates of origin in terms of time and cost. In
addition, the smaller margin of preference makes CEPT tariffs, even though they are
lower, less attractive than MFN tariffs that are applied without such high service link
costs. Above all, under the duty drawback system, export-oriented foreign affiliates in
the region, which account for a large share of intra-regional trade, have no incentive to
utilize CEPT tariffs, given high service link costs.
22 See the ASEAN Secretariat website (http://www.aseansec.org/menu.asp?action=4&content=16) forinformation on CEPT tariffs.23 See Aoki (2001) for issues of utilization of CEPT scheme.
15
Asia has just been in the process of creating more FTAs, including agreements with
countries in other regions. In 2003, the Free Trade Agreement Between the Republic of
Korea and the Republic of Chile, the US-Singapore Free Trade Agreement (USSFTA),
and Mainland and Hong Kong Closer Economic Partnership Arrangement (CEPA) were
signed, and the Free Trade Agreement between the EFTA (European Free Trade
Association) States and Singapore and the Singapore-Australia Free Trade Agreement
(SAFTA) went in force.24 Furthermore, there are numerous agreements in the process of
negotiations or under discussion.25 Agreements under negotiations as of January 2004,
for instance, include FTAs between Australia and the United States, between Japan and
Mexico, between Japan and Malaysia, between Japan and Korea, between Singapore
and Canada, among Singapore, Chile, and New Zealand, between Singapore and India,
between Singapore and Korea, between Singapore and Mexico, between Thailand and
Australia, and between Thailand and India.26 In the Asian-Pacific region, Singapore is
the country that has been most aggressively developing FTAs with countries not only in
the region but also in other regions.
III. Explaining Trade Policy Formation: a Factor Analysis Approach
So far, we have examined in a descriptive manner the multiple dimensions of trade
policy, comprised as a set of independent instruments. However, political-economy
models of trade policy usually assume the existence of an implicit policy that
determines the overall protection levels for a specific country or sector. Underlying the
observable set of policy instruments, we assume that there is a reduced set of factors
that can account for the “revealed” levels of protection, reflected in a combination of
MFN tariff policies towards external partners, discriminatory tariffs towards members
of a regional agreement, and a variety of NTMs. In this section, our goal is precisely to
24 Singapore provides duty-free access for all tariff lines under these agreements.25 Agreements under discussion include those between Japan and the Philippines, between Japan andThailand, between Hong Kong and New Zealand, between New Zealand and Thailand, betweenSingapore and Sri Lanka, between ASEAN and China, between ASEAN and Japan, between ASEAN-theUnited States, among ASEAN+3, between MERCOSUR and China, and between MERCOSUR andIndia.26 The first round of negotiations just started in December 2003 or January 2004 for FTAs between Japanand Malaysia, between Japan and Korea, and between Singapore and Korea.
16
uncover the underlying common factors (the “latent” or “unobservable” level of
protection) that account for most of the “observed” or “revealed” protection that take
form through a given country’s specific measures. An analysis of common factors will
allow us to analyze trade policy formation in Latin America and Asia in a more
sophisticated manner.
We use a factor analysis approach where the observed variables, that is, the measurable
levels of protection through tariffs, NTMs, etc. (S), are assumed to result from linear
combinations of some hypothetical, unobservable factors (Q). We will interpret these
latter factors as the underlying “latent” levels of protection:
S = N {Q} [1]
We use factor analysis as an exploratory tool to unravel and understand correlations
among a specific set of trade policy measures. In particular, we hypothesize that trade
policy can be revealed through analyzing a combination of the following set of
variables: average levels of MFN tariff protection (mean MFN tariffs or t), dispersion
levels of MFN tariff protection (standard deviation of MFN tariffs or t*), average
coverage of NTMs (mean NTM coverage measure or n), dispersion levels of NTM
coverage (standard deviation of NTM measures or n*), average levels of tariff
discrimination towards regional partners (mean preferential tariffs or p) and dispersion
levels of tariff discrimination towards regional partners (standard deviation of
preferential tariffs or p*).
Data
In formally analyzing and comparing the trade protection structures of Latin America
and Asia, we considered seven countries in each region: Argentina, Brazil, Chile,
Colombia, Mexico, Peru, and Venezuela in Latin America; and China, Indonesia, Korea,
Malaysia, Philippines, Singapore, and Thailand in Asia. Measured or observed levels of
protection were computed based on the following indicators: average and standard
17
deviation of MFN tariffs, preferential tariffs, and NTMs in 2000.27 These variables were
computed at the SITC (rev. 2) three-digit level for each country, based on information at
the most disaggregated levels of the HS classification. The HS classification is
consistent across countries at the six-digit level, but inconsistent at the most detailed
level for each economy.28 Therefore, it was necessary to apply the following procedure
in order to obtain SITC three-digit-level data for MFN tariffs, preferential tariffs, and
NTM coverage: first, data at the most detailed HS classification for each country were
aggregated into those at the six-digit level by taking a simple average. Then, data at the
HS six-digit level were converted into SITC formatted data at the six-digit level, that is,
baseline data. Finally, simple averages and standard deviations of MFN tariffs,
preferential tariffs, and NTM coverage at the SITC three-digit level were calculated for
each country, using the baseline data. Note that information on tariff lines with specific
tariffs is not included in calculating average and standard deviation of MFN tariffs,
preferential tariffs for Asian countries.
Information on MFN tariffs and NTM coverage in around 2000 is available from the
UNCTAD database, TRAINS. NTM coverage at a detailed level, however, is not
directly available from TRAINS. Thus, the following steps were required to obtain such
data at the HS six-digit level: first, we categorized the various measures reported by
each country, based on the UNCTAD classification of NTMs.29 Second, we assigned 1
to tariff lines subject to NTM(s) and 0 to those not subject to NTM(s) at the most
detailed HS level for each country. For instance, in the case of overall NTM coverage,
we assigned 1 to a tariff line subject to any one or more measures. Similarly, we
assigned 1 to a particular tariff line if it was subject to any core NTM (non-core NTMs)
in obtaining core NTM coverage (non-core NTM coverage). Finally, the simple average
was calculated at the six-digit level as NTM coverage. The rest of the procedures for
obtaining the SITC three-digit level data were the same as with the other variables. A
27 The data are from approximately 2000. However, country variations exist on NTMs due to limited dataavailability.28 The most detailed classification for each country is usually at the eight, nine or ten-digit level.29 Because there is no consensus on NTMs to report, the types of measures reported are inconsistent fromone country to another. While some countries provide detailed information on NTMs, others do not. Inthe case of countries with only a few reported NTMs, the low level of reported coverage cannotnecessarily be interpreted as a low level of protection provided by NTMs.
18
more detailed explanation regarding the formulation of NTM variables can be found in
the appendix.
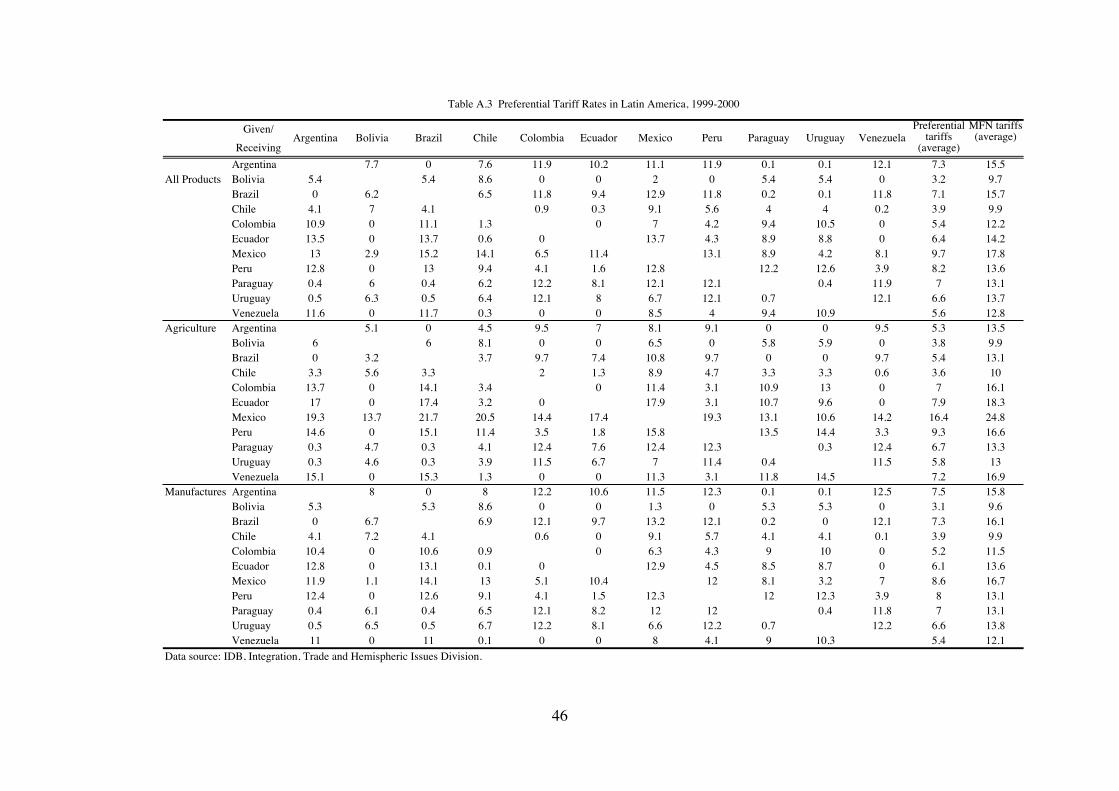
Information on preferential tariffs in Latin American comes from Estevadeordal and
Robertson (2004) and the FTAA Hemispheric Database. Compiling preferential tariffs
for Latin America at the necessary level was complicated. One of the reasons is that
information on preferential tariffs in the region is provided in terms of either an ad
valorem tariff rate or a percentage discount rate on the MFN tariff (or the “margin of
preference”), which must be converted into an ad-valorem tariff rate.30 Another reason
is that, as Figure 6 clearly shows, Latin America has various overlapping agreements
across countries. Thus, we started with the lowest tariff for each tariff line from among
the various agreements’ preferential tariffs for each partner country, as a preferential
tariff applied to the partner. Then, preferential tariffs for each partner at the most
detailed levels were aggregated into those at the six-digit level. Finally, preferential
tariffs for each partner of a country were simply averaged to obtain that country’s
preferential tariff at the six-digit level.31
On the other hand, information on Asia comes from the ASEAN secretariat for AFTA
and original copies of agreements for ANZSCEP.3233 In the case of Asia, preferential
tariffs are expressed as ad valorem tariffs, unlike to Latin America, though they include
tariffs other than ad valorem tariff rates such as specific tariffs. In compiling preferential
tariffs, MFN tariffs are substituted for preferential tariffs for products not included on
the tariff removal list, and tariff lines with specific tariffs are excluded. Note that
preferential tariffs for China and Korea are not included, since they had no FTA around
2000. Singapore, in contrast, has more than one FTA, but the preferential tariffs in each
of those agreements are all zero.
30 A margin of preference is converted into an ad-valorem tariff rate by subtracting it from one andmultiplying the remainder by the respective MFN tariff.31 See Table A3 in the Appendix for preferential tariffs for each partner of a country.32 Information on AFTA is available at http://www.aseansec.org/800x600.html(http://www.aseansec.org/menu.asp?action=4&content=16).33 Original copy of ANZSCEP is available athttp://www.mft.govt.nz/foreign/regions/sea/singcepcontent.html.
19
Analysis
Our study undertook two tasks using a factor analysis approach: one was to identify
country-specific (region-specific) common factors that could account for the observed
levels of protection provided by each country’s (each region’s) trade policies, using
each country’s (each region’s) data. The other was to uncover sector-specific common
factors underlying trade policies for a given sector at the SITC one-digit level, using
pooled data from the two regions.34 We have called the first of these processes “country
analysis” (regional analysis) and the second “sector analysis.” Figures 7 and 8 report
what are called “factor loadings” from the six “observed” trade-policy variables among
the common factors extracted from the regional and country analysis, respectively.
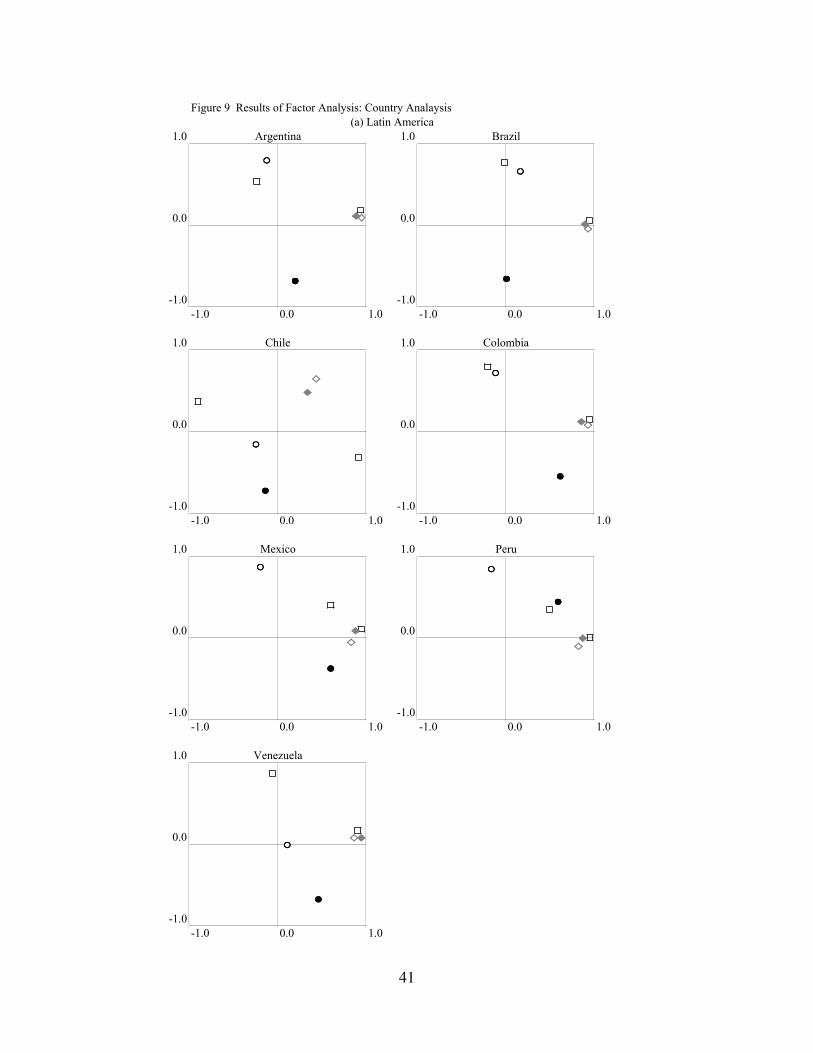
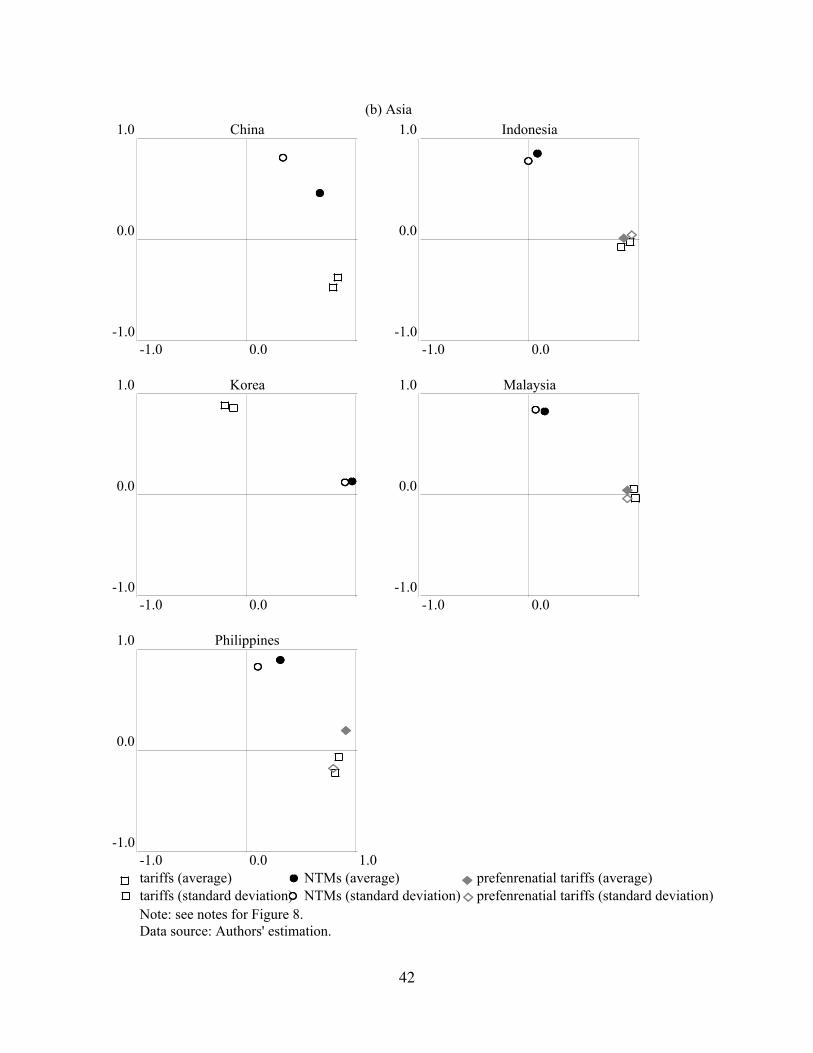
Figure 9 does the same with common factors extracted from the sector analysis. These
factor loadings suggest the correlation between each variable and the component
structures. We hoped to see clusters of variables only at the ends of the lines through
zero and at the intersection of these lines. Variables near the ends of the zero lines such
as points (+1, 0), (-1, 0), (0, +1), and (0, -1) had high loadings on only one factor.
Variables near the intersection point (0, 0) (or (0, 0, 0) in a three dimensional space)
were associated with neither factor.
Before delving into country specific strategies, it is illustrative to compare the two
regions as a whole. In Figure 7, we have pooled information for all Latin American
countries and for all Asian countries. A factor analysis indicates that the correlation
structure of the six trade policy measures considered in this study (t, t*, p, p*, t, t*) can
be roughly reduced or decomposed into two components or common factors. The results
of the factor analysis are nonetheless stronger in the case of Asia (see clustering in
Figure 7). The first component represents the underlying factors behind the use of
NTMs in each region as measured by average NTM coverage (n) and the standard
deviation within the NTM coverage measure (n*). The second component accounts for
the correlation among the rest of the trade policy variables (MFN [t, t*] and preferential
tariffs [p, p*]), although the variance of MFN tariffs (t*) in the case of Latin America
34 China and Korea are not included for sector analysis.
20
showed no correlation to any other variable, appearing as an outlier on the plot for the
region in Figure 7.
How should these results be interpreted? Our analysis suggests that NTM and tariff
policies are set independently and have different underlying domestic policy
motivations. The main difference involves the way that NTM measures are used in the
two regions. In Latin America, average NTM coverage (n) and standard deviation of
NTM coverage (n*) are negatively correlated within the same factor (opposite
extremes), indicating that sectors with high NTM coverage levels (agriculture, for
instance) display less sectoral dispersion (i.e., products in a sector highly protected by
NTMs are treated more or less equally). The reverse is true in the case of Asia, where
both these NTM measures cluster together within the same common factor, indicating a
positive correlation. In Asia, sectors that exhibit higher NTM protection overall tend to
have higher dispersion, indicating that NTM protection is more product-specific and
highly selective.
For tariff policy, the clustering is very strong in the case of Asia. Sectors with high MFN
treatment also enjoy less of a tariff preference (high bilateral tariffs). At the same time,
sectoral dispersion for those highly protected sectors (whether on an MFN or
preferential basis) tends to be higher, that is, there is more product-specific tariff
protection in a given sector. The clustering pattern is similar in Latin America, but not
as strong, partly due to the more extensive use of preferential agreements for tariff-
discrimination purposes.
Next, we applied the factor analysis approach on a country-by-country basis (Figure 8).
The individual country plots show the deviation of each country from the regional
pattern discussed above. Countries such as Argentina, Brazil, and, to a lesser extent,
Colombia exhibit a similar pattern: n, n* and t* are tied to a single component (with a
positive correlation among the dispersion measures), while the rest of variables are tied
to a second component. In those cases we cannot separate the sectoral dispersion of
MFN tariffs and NTM policies as a whole. Chile’s case is worth mentioning for several
21
reasons. First, although factor analysis preserves a breakdown into two factors, there is
no real clustering of variables. Chile’s long-standing tradition of implementing uniform
tariff policy is clearly captured by the fact that t and t* are associated under the same
component but negatively correlated (there is no tariff dispersion across products in any
sector whose tariff rate is essentially flat). However, this uniformity in tariff policy does
not extend to overall trade policy; otherwise we would observe a single component. In
fact, given how the variables cluster in the figure, sectors with high levels of NTM
coverage (n) also tend to have relatively higher levels of dispersion, as well as higher
levels of bilateral tariffs (average and dispersion), reflecting the highly preferential
discriminatory policy pursued by Chile with its hub strategy of trade agreements. The
picture for Mexico reveals a clustering of most variables around a single common factor,
separate from other factors explaining the NTM dispersion.
Most countries in our Asian sample follow the regional pattern, with the exception of
China and Thailand. In the case of Thailand, factor analysis could not reduce the
underlying trade policy factors into two components, as it could in the rest of countries.
The plot suggests the presence of three common factors and therefore indicates a more
complex setting for Trade policy formation in this particular case. In the case of China,
although clustering is still present around NTM variables and tariff policy variables, it is
much weaker than in the rest of the sample.
As mentioned above, factor analysis can be used to explore underlying rationales if
there are common factors behind sector-specific policies. That is to say, we are
interested in uncovering the correlation structure of trade policy measures in particular
sectors using pooled data, both for Latin America and Asia. This approach has allowed
us to gain insights on how trade policy is designed at the sectoral level, and to identify
particular countries that deviate from the usual pattern. We have presented sector results
in Figure 9, based on sectors defined at the 1-digit level of disaggregation. SITC 0
(foods and live animals), SITC 1 (beverages and tobacco) and SITC 4 (animal and
vegetable oils) show a similar pattern, based on two common-factor breakdowns, one
accounting for NTM policy, and the other explaining tariff policy. There is a negative
22
correlation among NTM observed measures (n, n*) and a positive correlation among
most tariff variables (t, t*, p, p*). At a risk of oversimplifying, the analysis suggests that
NTMs and tariffs implement a separate set of determinants. Higher NTM protection is
associated with lower levels of dispersion. In contrast, all tariff variables are positively
correlated among one another.
SITC 2 (Crude Materials) and SITC 5 (Chemicals) sectors need three underlying forces
to explain how trade policy is designed for those sectors, based on our six measurable
variables. This gives an indication of the complexity behind trade policy in those sectors.
(machinery and transportation equipment), and SITC 8 (other manufactured articles)
exhibit a relatively similar pattern although there is a weak level of correlation among
variables tied to a common factor. Interestingly, the tariff dispersion variable (t*), on its
own, singly determines one of the two factors (in particular for sectors SITC 6 and 8).
This reflects the importance of tariff escalation policies used to protect manufacturing.
The results described above cannot be applied in a general way to all sectors and
countries (Table 2). In fact, a useful feature of factor analysis is its ability to identify
outliers. In our framework, we can identify outlier sectors for a given country or outlier
countries for a given sector. Roughly speaking, outliers concentrate mostly among
manufacturing sectors in Latin America while in Asia most outliers can be found in the
agriculture and food processing sectors. In the agriculture and food processing sectors,
most Asian countries display many high ratios at the country-analysis level, and fewer
outliers at the sector-analysis level. A comparison of results between country analysis
for Asian countries and the respective sector analysis reveals major differences in how
NTMs are implemented, though there is no difference in the policy formulation for the
two types of tariffs (high average rates and a large standard deviation). This indicates
that Asian countries have an NTM policy where most products in the agriculture and
food processing sectors are more or less equally protected using the same devices.35 A
35 Malaysia designs trade policies for SITC 1 (beverages and tobacco) in a manner that is neither revealedby its country pattern or its sectoral pattern.
23
sectoral pattern rather than a country pattern is also seen in certain agricultural and food
processing sectors in countries outside of Asia, such as Mexico, Peru, and Venezuela.36
For manufacturing sectors, in particular SITC 7 (machinery and transportation
equipment), most of the Latin American countries have outliers under both country and
sector analysis, although the ratios are not as high. This means that these countries
might have a trade policy formation strategy that corresponds to neither pattern for this
sector.
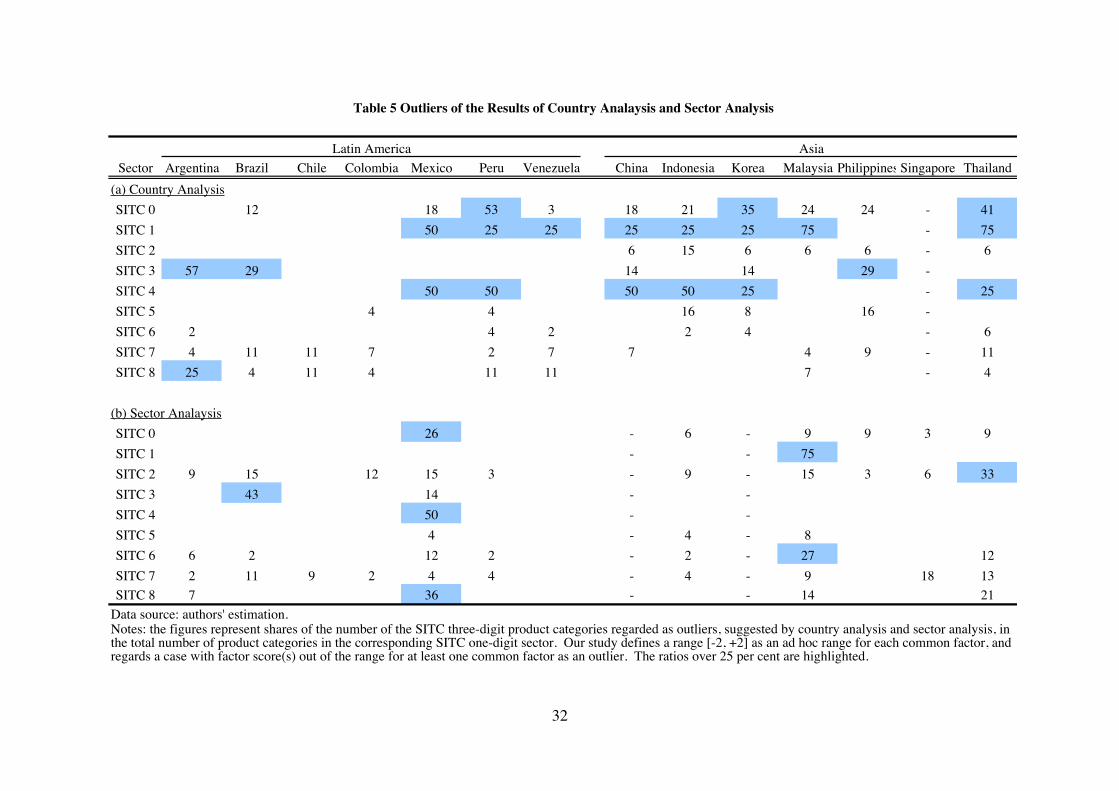
As stated above, factor analysis can be used to identify outliers and unusual cases. We
can standardize factor scores so that they have a mean of zero and a standard deviation
of one. Thus, we define a range of [-2, +2] as a defined interval for each common factor
and regard cases with factor score(s) out of this range for at least one common factor as
outliers. In the case of country analysis, we can identify sectors that do not conform to
the overall trade policy strategy observed in a given country. Similarly, in the case of
sector analysis, we could identify countries that seem to design very different trade
policy strategies as compared to the world pattern. In Table 2 we compute the
percentage of SITC three-digit product categories as compared to the total number of
categories in the corresponding SITC one-digit sector that appear to be outliers
according to the country analysis (numerator) or the sector analysis (denominator).
Ratios greater than 25 percent are highlighted. For instance, we could take the case of
Brazil. When applying factor analysis to Brazil, the outliers include 30 percent of the
cases in SITC Sector 3. This means that 30 percent of the cases in this sector deviate
from the component structure identified for this country, and a high selective trade
policy applies. In a sense, we are using an “objective” approach to identify a concept
that is difficult to operationalize in the context of trade policy discussion, that is, the so-
called “sensitive” products. On the other hand, when we apply a factor analysis on SITC
Sector 3 pooling data from all countries (Latin America and Asia), at least 43 percent of
the data points from the Brazilian sample are also outliers, meaning that Brazil’s
36 Mexico implements trade policies for SITC 4 (animal and vegetable oils) in a manner that is neitherrevealed by its country pattern or its sectoral pattern.
24
underlying policies significantly differ from the worldwide trend in this particular
sector.
IV. Conclusions
This paper has two objectives. First, we have presented a comprehensive quantitative
comparison of the trade policy structures in Latin America and Asia, highlighting
certain key differences in approaches to designing trade policies. Second, using a factor
analysis approach, we attempted to provide an understanding of the underlying forces
shaping trade policy in both regions. This approach has allowed us to make a
comparison across regions, countries, and sectors, based on the correlation patterns of a
set of “observed” trade policy variables. We have also suggested an approach aimed at
identifying the so-called sensitive sectors, which is a key concept in trade negotiations,
but somewhat difficult to operationalize.
25
References
Ando, Mitsuyo. (2002) “The pervasiveness of non tariff measures in APEC countries.”
Ando, Mitsuyo (2005) “Fragmentation and Vertical Intra-industry Trade in East Asia”COE Discussion Paper, Tokyo: Keio University. To be presented at Claremont
Regional Integration Workshop with Particular Reference to Asia, Claremont
McKenna College, U.S.A on February 25, 2005.
Ando, Mitsuyo and Kimura, Fukunari. (2004) “The Formation of International
Production and Distribution Networks in East Asia.” Forthcoming in Takatoshi Ito
and Andrew Rose, eds., International Trade (NBER-East Asia Seminar on
Economics, Volume 14), Chicago: The University of Chicago Press. The
former version was appeared in NBER Working Paper 10167.
Aoki, Ken. (2001) AFTA - the Situation and Prospect of ASEAN Economic Integration -
(AFTA - ASEAN Keiozai Tougo no Jitsujo to Tenbo -), Tokyo: JETRO. In
Japanese.
Casanova, Lourdes. (2003) “Multinational Strategies in Latin America: Comparing East
Asian, European and North American Multinationals.” Presented at the LAEBAConference, “FTAA and Transpacific Business Linkages: Implications for Japan
and East Asia” held in Tokyo, Japan on December 10, 2003.
Estevadeordal, A. and R. Robertson (2004) "Do Preferential Trade Agreements Matter
for Trade" in A. Estevadeordal, D. Rodrik, A. M. Taylor and A. Velasco
(Eds.) Integration in the Americas: FTAA and Beyond. Harvard University Press,
Cambridge, MA.
Ethier, W. (1998) "The New Regionalism". The Economic Journal 108 (449) July.
Devlin, Robert and Estevadeordal, Antoni (2002) “Market Access” in Byond Borders:
The New Regionalism in Latin America. IDB Economic and Social Progress in
Latin America Report Washington D.C.: Inter-American Development Bank.
Kimura, Fukunari. (2003) “Development Strategies for Economies under
Globalisation: Southeast Asia as a New Development Model.” in Tran Van
Hoa and Charles Harvie, eds., New Asian Regionalism: Responses to
Globalisation and Crises. London: Palgrave.
26
Kimura, Fukunari and Ando, Mitsuyo. (2003) “Fragmentation and Agglomeration
Matter: Japanese Multinationals in Latin America and East Asia.” North
American Journal of Economics and Finance, Vol. 14, Issue 3: 287-317.
Kimura, Fukunari and Ando, Mitsuyo.(2004a) “The Economic Analysis ofInternational Production/Distribution Networks in East Asia and Latin America:
The Implication of Regional Trade Arrangements.” Forthcoming in Business and
Politics, Vol.7: No.1, Article 1.
Kimura, Fukunari and Ando, Mitsuyo.(2004b) “Two-dimensional Fragmentation in East
Asia: Conceptual Framework and Empirics.” Forthcoming in the special issue,
‘Outsourcing and Fragmentation: Blessing or Threat?’, of International Review of
Economics and Finance.
Kuwahara, Mikio. (2003) “The Comprehensiveness of Chilean Free Trade
Agreements” in Jiro Okamoro ed. Whither Free Trade Agreements? Proliferation,
Evaluation and Multilateralization. Tokyo: Institute of Developing
Economies.Pangestu, Mari. (2003) “Industrial Policy and Developing Countries” in Bernard
Hoekman, Philip English and, Aaditya Matto eds., Development, Trade, and
the WTO: A Handbook. Washington D.C.: World Bank.
United Nations Conference on Trade and Development (UNCTAD) (2001), Trade
Analysis and Information System (TRAINS) (CD-ROM) 2001 spring version.
Geneva: UNCTAD.
World Bank (2002). World Development Indicators 2002 (CD-ROM). Washington
D.C.: World Bank.
27
Appendix: data description for NTMs
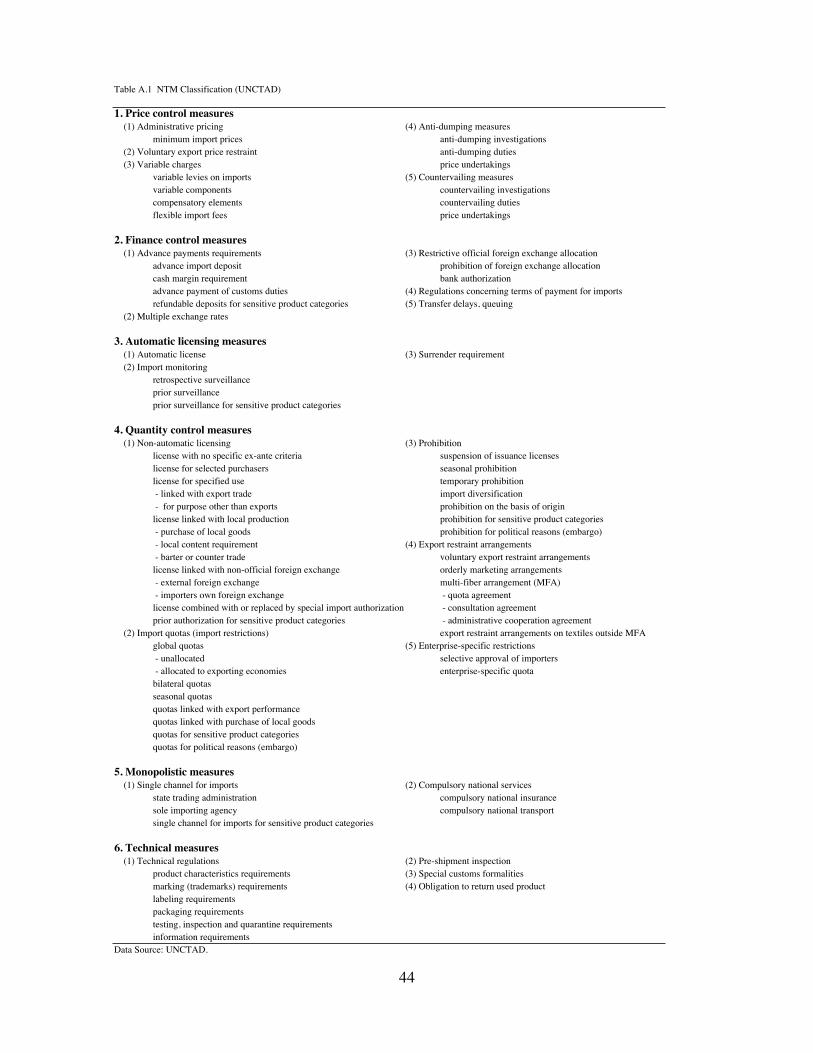
The NTM classification proposed by UNCTAD is provided in Table A.1.37 The
TRAINS database provides information on the tariff lines subject to NTMs each
country implements at the most disaggregated level. Since variable measures reported
by each country are inconsistent across countries, our paper first categorizes them into
the following types, based on the UNCTAD classification: 1. Price control measures, 1-
Single channel for imports, 6. Technical measures, 6-(1) Technical regulations, and 6-
(3) Special customs formalities.38 Table A.2 shows the case of Malaysia with
classified types of measures. Then, according to the categorization, we assign 1 to
tariff lines subject to NTM(s) and 0 to those not subject to NTM(s) at the most detailed
HS level for each country. Note that when there are several measures categorized into
one type of measures, for instance, in the case of 6-(1) technical regulations, the number
of tariff lines subject to this type is counted so as not to double count the same tariff line.
The rest of procedures to conduct a variable for NTM incidence are as explained in
section IV.
37 See Ando (2002, Table 1) for the list of NTMs and the range of NTMs identified in the major threeNTM classifications, multilateral agreement, and regional agreements in the Asia-Pacific.38 Financial measures are not included because no country in the analysis reports their use.
Note: Tariffs above are the simple average of applied tariffs.
Table 1 Trends of Tariffs Since the Late 1980s for Latin America and Asia
Data sources: Devlin and Estevadeordal (2002) for tariffs in Latin America; for Asia, ManilaAction Plan for APEC vol.1 for tariffs in 1988 and 1993 and APEC Individual Action Plan (e-IAP) for tariffs thereafter.
29
Table 2 WTO Bound Tariffs and Applied Tariffs by Sector in Latin America, 1999-2000
Data sources: APEC Individual Action Plan (2000, 2001, and 2002) for each country (available at http://www.apec-iap.org).Notes: WTO bound rates and applied rates are the simple average. Data for 2000 are of 2000 or 2001. Bound tariff lines (%) present the shares in total tariff lines in corresponding sectors. Figures in parenthesis for specific tariff lines are the total number of tariff lines in corresponding sectors. WTO bound rates for Indonesia in 2003 are of 2001. WTO bound rates for Malaysia are the simple average of tariffs on industrial products. Data for applied tariffs and the total number of tariff lines in the Philippines do not include "sensitive" agriculture products under E.O. 313 and E.O. 328. In calcurating applied tariffs in Thailand, the ad valorem equivalents of specific tariffs are assumed to be 30 percent for rice and 20% and 25% for sugar.
2003
Table 3 WTO Bound Tariffs and Applied Tariffs by Sector in Asia
31
Agreements Date of signature Entry into forceMajor agreements enterd into force by 2003
Central American Common Market (CACM)1 1960 1961Andean Community4 1969 1969Caribbean Community (CARICOM)2 1973 1973LAIA - Latin America Integration Association (ALADI) 1981Chile-Mexico2 1991 1992Chile- Venezuela 1993 1993North American Free Trade Agreement (NAFTA) 1992 1994Colombia-Chile 1993 1994Southern Cone Common Market (MERCOSUR) 1991 1995Costa Rica-Mexico 1994 1995Group of Three (G-3) 1994 1995Bolivia-Mexico 1994 1995Chile-Ecuador 1994 1995Chile-MERCOSUR 1996 1996Canada-Chile 1996 1997Bolivia-MERCOSUR 1996 1997Mexico-Nicaragua 1997 1998Chile-Peru 1998 1998CACM-Dominican Republic5 1998 1999CARICOM-Dominican Republic5 1998 1999Mexico – European Union5 1999 2000Mexico-EFTA 2001Mexico – Northern Triangle of Central America6 2000 2001Chile-Costa Rica 2002CACM-Chile 2002Panama-El Salvador 2002Costa Rica-Canada 2002Chile-European Union 2002 2003Chile-South Korea 2003 2003Chile-USA 2003Mexico-Uruguay 2003MERCOSUR - Andean Community 2003
Data source: Integration, Trade and Hemispheric Issues Division, IDB.Notes:
6. Northern Triangle includes El Salvador, Guatemala, and Honduras.
2. CARICOM is now updating its founding treaty in order to establish the legal basis for movingtowards a single market.3. The parties have substantially revised and upgraded this accord; a new agreement is in forcesince August 1, 1999.4. The 1988 Protocol of Quito calls for amendments to the group’s founding treaty. In 1996, theGroup’s name was changed to the Andean Community and its institutional structure was revised(Declaration of Trujillo).5. Awaiting (sufficient) legislative approval
1. The Presidents agreed to re-activate CACM in 1990 (Montelimar Summit) and opted todefinitively pursue a customs union in 1993 (Protocol of Guatemala).
Table 4 Trade Agreements Entered into Force by 2003 in Latin America
Table 5 Outliers of the Results of Country Analaysis and Sector Analysis
Latin America Asia
Notes: the figures represent shares of the number of the SITC three-digit product categories regarded as outliers, suggested by country analysis and sector analysis, inthe total number of product categories in the corresponding SITC one-digit sector. Our study defines a range [-2, +2] as an ad hoc range for each common factor, andregards a case with factor score(s) out of the range for at least one common factor as an outlier. The ratios over 25 per cent are highlighted.
33
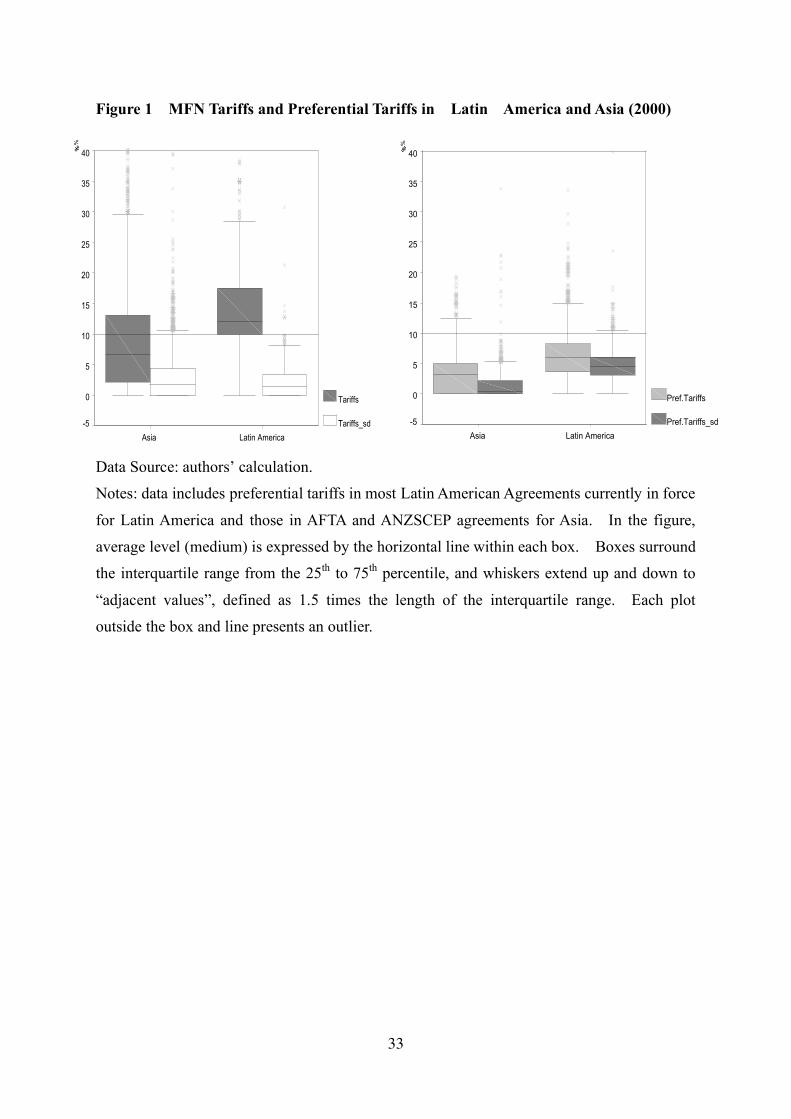
Figure 1 MFN Tariffs and Preferential Tariffs in Latin America and Asia (2000)
Data Source: authors’ calculation.
Notes: data includes preferential tariffs in most Latin American Agreements currently in force
for Latin America and those in AFTA and ANZSCEP agreements for Asia. In the figure,
average level (medium) is expressed by the horizontal line within each box. Boxes surround
the interquartile range from the 25th to 75th percentile, and whiskers extend up and down to
“adjacent values”, defined as 1.5 times the length of the interquartile range. Each plot
outside the box and line presents an outlier.
Latin AmericaAsia
%
40
35
30
25
20
15
10
5
0
-5
Tariffs
Tariffs_sdLatin AmericaAsia
%
40
35
30
25
20
15
10
5
0
-5
Pref.Tariffs
Pref.Tariffs_sd
34
Figure 2 MFN Tariffs and Preferential Tariffs in
Latin America and Asia by Country
Data source: authors’ calculation.
Notes: see notes for Figure 1. Preferential tariffs for China and Korea in this figure are
Data source: authors' calculation, based on UN PC-TAS.Notes: Machinery goods are defined as HS 84-92; i.e., they include general machinery, electric machinery,transport equipment, and precision machinery.
Asia
0
10
20
30
40
50
60
70
80
Philipp
ines
Singapo
re
Malaysi
aJap
anKore
a
Thailan
d
Hong K
ong
China
Indon
esia
%
Exports: machinery goods Imports: machinery goodsExports: parts and components in machinery goods Imports: parts and components in machinery goods
Figure 4 Trade in machinery goods and machinery parts and components in 2000: Latin America
0
10
20
30
40
50
60
70
80
U.S.A.
Mexico
Brazil
Argenti
na
Colombia Chil
e
Hondu
ras
Venezue
la
Guatem
ala Peru
Ecuado
r
%
37
Figure 5 NTM Incidence in Latin America and Asia
Data Source: authors’ calculation.
Notes: see notes for Figure 1.
38
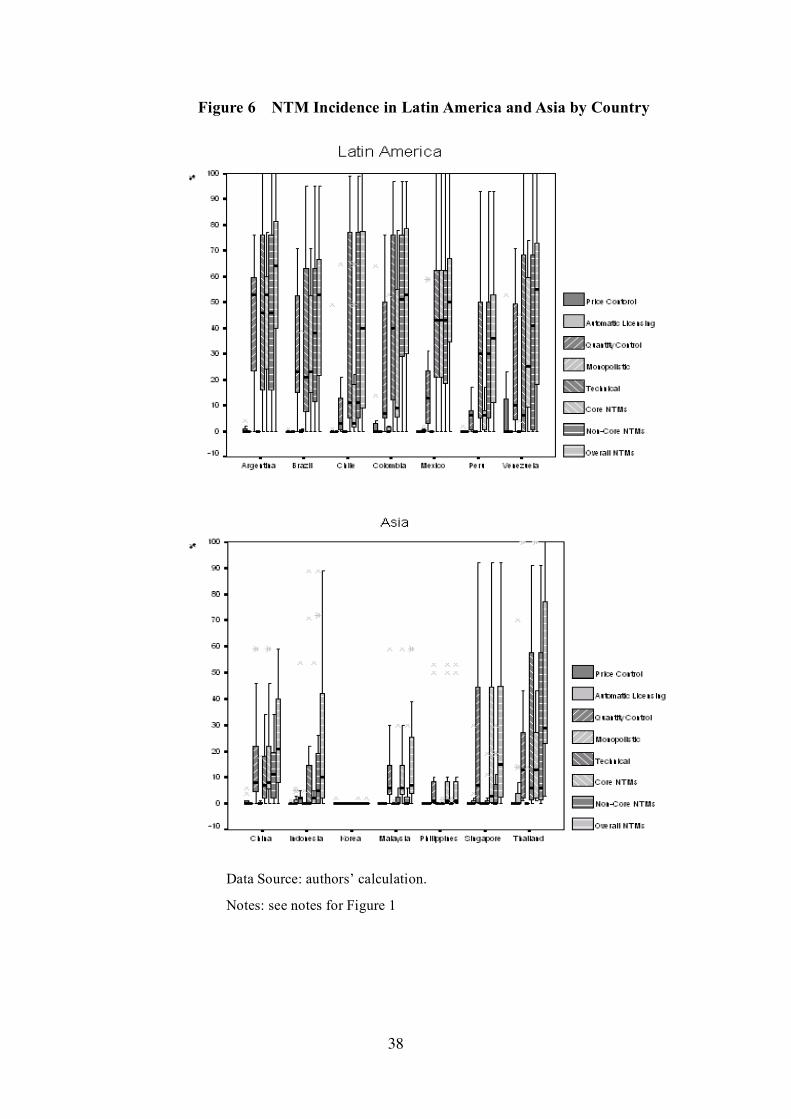
Figure 6 NTM Incidence in Latin America and Asia by Country
Data Source: authors’ calculation.
Notes: see notes for Figure 1
Canada
USA
Mexico
Chile
UruguayParaguay
BrazilArgentinaMercosur
Bolivia
Colombia
Venezuela
Peru
Ecuador
Costa Rica
Nicaragua
El Salvador
HondurasGuatemala
CACM
Trinidad & Tobago
Antigua & Barbuda
Barbados
Belize
DominicaGrenada
GuyanaJamaica
Suriname
St. Lucia
St. Vincent & Grenadines
St. Kitts & Nevis
CARICOM
Panama
DominicanRepublic
Figure 7 Trade and Regional Agreements Signed and Under Negotiation in Latin America and Asia-Pacific (at the end of 2003)
AndeanCommunity
FTAA
Bahamas
Haiti
Brunei
Cambodia
Thailand
Laos
Malaysia
Philippines
Myanmar
Singapore
Indonesia
Vietnam
Japan
New Zealand
Australia
ASEAN
Korea
PR China
Hong Kong
Taiwan
Russia
Papua New Guinea APECIntra-LAC in force
Intra-Asia-Pacific in force
Intra-LAC under negotiation
Trans-Pacific signed
Intra-Asia-Pacific under negotiation or strong consideration
APEC
Intra-Asia-Pacific signed
Trans-Pacific under negotiation39
40
Figure 8 Results of Factor Analysis: Regional Analaysis
Notes: factor loading plots expressed in the space of common factors extracted fromfactor analysis. Factor scores are with mean of zero and standard deviation of one.
Latin America Asia
41
Figure 9 Results of Factor Analysis: Country Analaysis
variable levies on imports (5) Countervailing measuresvariable components countervailing investigations compensatory elements countervailing duties flexible import fees price undertakings
2. Finance control measures(1) Advance payments requirements (3) Restrictive official foreign exchange allocation
advance import deposit prohibition of foreign exchange allocation cash margin requirement bank authorization advance payment of customs duties (4) Regulations concerning terms of payment for importsrefundable deposits for sensitive product categories (5) Transfer delays, queuing
retrospective surveillanceprior surveillanceprior surveillance for sensitive product categories
4. Quantity control measures(1) Non-automatic licensing (3) Prohibition
license with no specific ex-ante criteria suspension of issuance licenses license for selected purchasers seasonal prohibition license for specified use temporary prohibition - linked with export trade import diversification - for purpose other than exports prohibition on the basis of originlicense linked with local production prohibition for sensitive product categories - purchase of local goods prohibition for political reasons (embargo) - local content requirement (4) Export restraint arrangements - barter or counter trade voluntary export restraint arrangements license linked with non-official foreign exchange orderly marketing arrangements - external foreign exchange multi-fiber arrangement (MFA) - importers own foreign exchange - quota agreement license combined with or replaced by special import authorization - consultation agreement prior authorization for sensitive product categories - administrative cooperation agreement
(2) Import quotas (import restrictions) export restraint arrangements on textiles outside MFA global quotas (5) Enterprise-specific restrictions - unallocated selective approval of importers - allocated to exporting economies enterprise-specific quota bilateral quotas seasonal quotas quotas linked with export performance quotas linked with purchase of local goods quotas for sensitive product categoriesquotas for political reasons (embargo)
5. Monopolistic measures(1) Single channel for imports (2) Compulsory national services
state trading administration compulsory national insurancesole importing agency compulsory national transportsingle channel for imports for sensitive product categories
product characteristics requirements (3) Special customs formalitiesmarking (trademarks) requirements (4) Obligation to return used productlabeling requirementspackaging requirementstesting, inspection and quarantine requirements information requirements
Data Source: UNCTAD.
45
Table A.2 Reported NTMs: the Case of Thailand
CategozedType Description
CategozedType Description
3-(1) Automatic licence 4-(3) Prohibition to protect human health3-(2) Prior surveillance for health reasons 4-(3) Prohibition to protect environment4-(1) Licence with no specific ex-ante criteria 4-(3) Prohibition to protect wildlife4-(1) Licence for selected purchasers 5-(1) Sole trading administration4-(1) Licence linked with purchase of local goods 5-(1) Sole importing agency4-(1) Authorization for human health protection 6-(1) Product characteristics requirements to protect human health4-(1) Authorization to protect environment 6-(1) Product characteristics requirements to protect environment4-(1) Authorization to protect wildlife 6-(1) Product characteristics requirements to prevent drug abuse4-(1) Authorization to ensure national security 6-(1) Product characteristics requirements to ensure human safety4-(1) Authorization, n.e.s. 6-(1) Labelling requirements to protect human health
6-(1) Testing, inspection or quarantine requirements to protect environment
Note: The categorization of measures above is conducted by authors.