38

For an introductory engineering class at an all-girls urban high school in the Southeast, we planned an experience that would align with the engineering as-
pects of the Next Generation Science Standards (NGSS Lead States 2013). Our goal was to better relate science, technol-ogy, engineering, and mathematics (STEM) to everyday life. We expected our at-risk students—who historically perform below grade level—to struggle with the activity. So, we modified the activity, based on the 5E learning cycle (Bybee 2013), from the previous year to create better diagnostic as-sessments, more realistic contexts, and a focus on shared roles and processes of engineers and scientists.
Our activity uses explicit and reflective approaches to teach the practices that are part of science and engineer-ing, particularly the Constructing Explanations (for science) and Designing Solutions (for engineering) practice. We also wanted students to learn core ideas in the physical sciences about motion, forces, and stability (HS-PS2) and energy (HS-PS3) and investigate crosscutting concepts like struc-ture and function and stability and change. Consistent with the 5E learning cycle, our students first reflected on their own thinking in the engage phase, then ac-tively explored engineering processes and purposes. In the explanation phase, students were pre-sented accurate concepts of and compari-sons between science and engineering processes. Students participated in a new, realistic engineering task as a means of elaboration.
A 5E learning activity that compares engineering to science
Amy Gilbert and Katherine Wade
December 2014 37
Finally, students underwent evaluation based on how well they described the processes of designing a solution, includ-ing testing, redesigning, and forming a budget.
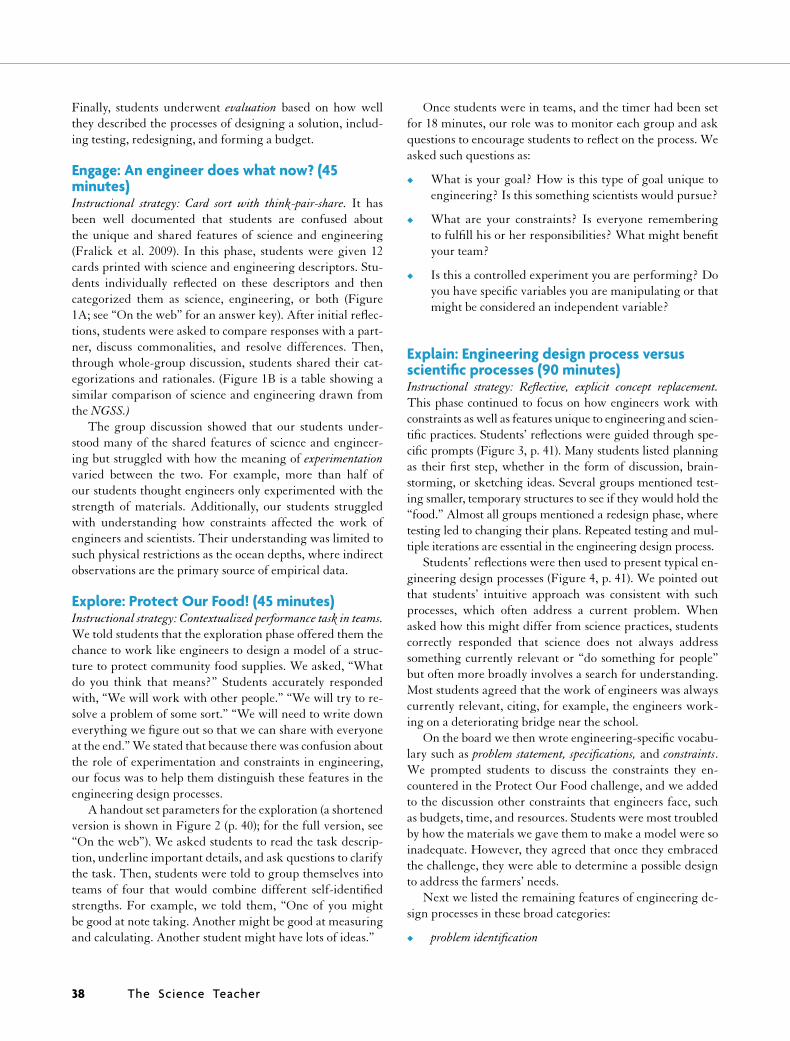
Engage: An engineer does what now? (45 minutes) Instructional strategy: Card sort with think-pair-share. It has been well documented that students are confused about the unique and shared features of science and engineering (Fralick et al. 2009). In this phase, students were given 12 cards printed with science and engineering descriptors. Stu-dents individually reflected on these descriptors and then categorized them as science, engineering, or both (Figure 1A; see “On the web” for an answer key). After initial reflec-tions, students were asked to compare responses with a part-ner, discuss commonalities, and resolve differences. Then, through whole-group discussion, students shared their cat-egorizations and rationales. (Figure 1B is a table showing a similar comparison of science and engineering drawn from the NGSS.)
The group discussion showed that our students under-stood many of the shared features of science and engineer-ing but struggled with how the meaning of experimentation varied between the two. For example, more than half of our students thought engineers only experimented with the strength of materials. Additionally, our students struggled with understanding how constraints affected the work of engineers and scientists. Their understanding was limited to such physical restrictions as the ocean depths, where indirect observations are the primary source of empirical data.
Explore: Protect Our Food! (45 minutes)Instructional strategy: Contextualized performance task in teams. We told students that the exploration phase offered them the chance to work like engineers to design a model of a struc-ture to protect community food supplies. We asked, “What do you think that means?” Students accurately responded with, “We will work with other people.” “We will try to re-solve a problem of some sort.” “We will need to write down everything we figure out so that we can share with everyone at the end.” We stated that because there was confusion about the role of experimentation and constraints in engineering, our focus was to help them distinguish these features in the engineering design processes.
A handout set parameters for the exploration (a shortened version is shown in Figure 2 (p. 40); for the full version, see “On the web”). We asked students to read the task descrip-tion, underline important details, and ask questions to clarify the task. Then, students were told to group themselves into teams of four that would combine different self-identified strengths. For example, we told them, “One of you might be good at note taking. Another might be good at measuring and calculating. Another student might have lots of ideas.”
Once students were in teams, and the timer had been set for 18 minutes, our role was to monitor each group and ask questions to encourage students to reflect on the process. We asked such questions as:
◆◆ What is your goal? How is this type of goal unique to engineering? Is this something scientists would pursue?
◆◆ What are your constraints? Is everyone remembering to fulfill his or her responsibilities? What might benefit your team?
◆◆ Is this a controlled experiment you are performing? Do you have specific variables you are manipulating or that might be considered an independent variable?
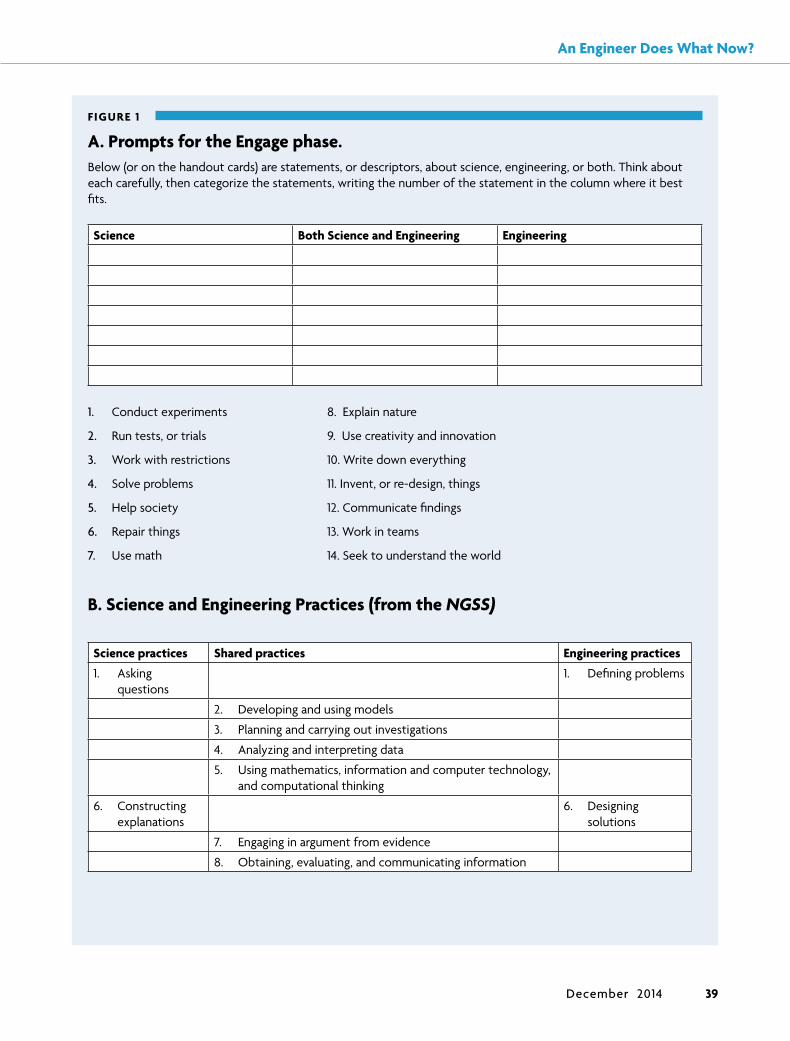
Explain: Engineering design process versus scientific processes (90 minutes)Instructional strategy: Reflective, explicit concept replacement. This phase continued to focus on how engineers work with constraints as well as features unique to engineering and scien-tific practices. Students’ reflections were guided through spe-cific prompts (Figure 3, p. 41). Many students listed planning as their first step, whether in the form of discussion, brain-storming, or sketching ideas. Several groups mentioned test-ing smaller, temporary structures to see if they would hold the “food.” Almost all groups mentioned a redesign phase, where testing led to changing their plans. Repeated testing and mul-tiple iterations are essential in the engineering design process.
Students’ reflections were then used to present typical en-gineering design processes (Figure 4, p. 41). We pointed out that students’ intuitive approach was consistent with such processes, which often address a current problem. When asked how this might differ from science practices, students correctly responded that science does not always address something currently relevant or “do something for people” but often more broadly involves a search for understanding. Most students agreed that the work of engineers was always currently relevant, citing, for example, the engineers work-ing on a deteriorating bridge near the school.
On the board we then wrote engineering-specific vocabu-lary such as problem statement, specifications, and constraints. We prompted students to discuss the constraints they en-countered in the Protect Our Food challenge, and we added to the discussion other constraints that engineers face, such as budgets, time, and resources. Students were most troubled by how the materials we gave them to make a model were so inadequate. However, they agreed that once they embraced the challenge, they were able to determine a possible design to address the farmers’ needs.
Next we listed the remaining features of engineering de-sign processes in these broad categories:
◆◆ problem identification
The Science Teacher38
An Engineer Does What Now?
FIGURE 1
A. Prompts for the Engage phase.Below (or on the handout cards) are statements, or descriptors, about science, engineering, or both. Think about each carefully, then categorize the statements, writing the number of the statement in the column where it best fits.
Science Both Science and Engineering Engineering
1. Conduct experiments 8. Explain nature
2. Run tests, or trials 9. Use creativity and innovation
3. Work with restrictions 10. Write down everything
4. Solve problems 11. Invent, or re-design, things
5. Help society 12. Communicate findings
6. Repair things 13. Work in teams
7. Use math 14. Seek to understand the world
B. Science and Engineering Practices (from the NGSS)
Science practices Shared practices Engineering practices
1. Asking questions
1. Defining problems
2. Developing and using models
3. Planning and carrying out investigations
4. Analyzing and interpreting data
5. Using mathematics, information and computer technology, and computational thinking
6. Constructing explanations
6. Designing solutions
7. Engaging in argument from evidence
8. Obtaining, evaluating, and communicating information
December 2014 39

◆◆ research/brainstorming
◆◆ idea/prototype development
◆◆ testing, and
◆◆ redesigning. To draw students into the discussion, we asked such ques-
tions as: “Did your team complete each step once and in or-der, as described on the board?” Many groups responded that they did not complete them in this order but had completed
most of the process. This gave us a chance to show students the flexibility associated with engineering processes. As seen in Figure 4, additional arrows represent the many different ways the process can be completed; there is no one linear pro-cess to follow.
For a formative assessment, we gave students cards with descriptors associated with engineering processes and asked them to create a visual that represented how they now under-stand the nature of engineering. Students’ visuals were con-sistently accurate, presenting a cyclical process in which some back and forth occurred in phases such as testing prototypes, developing ideas, and redesign. Then, to address features of scientific processes, we handed out a different set of cards to use in visually representing how they understand scientific processes. On these cards we wrote descriptors such as dis-covering, engaging in inquiry, hypothesizing, developing a con-trolled experiment, revising a hypothesis, communicating find-ings, analyzing results from experiment, redesigning controlled experiment, generating community analysis and feedback.
We concluded our discussion by comparing their visual representations, highlighting those processes that were rep-resented more accurately than others and the distinct features of scientific processes in comparison to engineering processes.
Elaborate/evaluate: Cell phones (360 minutes)Instructional strategy: Contextualized performance task in teams. In the elaborate phase, students were first asked to consider their mistakes in the Protect Our Food activity. Students reported that the most damaging assumption was that marshmallows, like soybeans and peanuts, were lightweight and needed very little support from their structures. This assumption led to a class discussion on the importance of the base, different mate-rials, and geometric shapes (e.g., triangles) in the design. Then, referring to the PBS force lab (see “On the web”), we present-ed students with specific civil engineering vocabulary along with related images and simulations. As a means of quickly and formatively assessing the students’ understandings, we challenged them to use this vocabulary to diagram different pictures of towers. Their diagramming was projected using a document camera and peer evaluated through whole-class discussion. Accurate labels were commended and missing la-bels identified. We told students they would apply these civil engineering concepts in their final project.
Challenge: Cell TowerStudents assumed the role of a team of engineers working for EAE, a fictional engineering firm hired by a cell phone com-pany to design a new cell phone tower. Students had to prepare a formal proposal for the phone tower, understanding that the contract would be awarded to the team who maximized height while minimizing cost. Budgeting was an exciting new challenge for the teams. Students were allowed to “buy” as much spaghetti, string, and tape as their $100,000 budget
FIGURE 2
Student handout for Protect Our Food activity.SituationPeanut and soybean crops stored in holding containers in a rural community are being eaten by deer and rabbits. Farmers suffering these losses are using containers made of a semi-permeable material that’s quickly corroding. The containers sit directly on the ground. The farmers determined:
• New structures are needed to store future harvests.
• Temporary structures are needed for the harvests already in the corroding containers.
Materials
• 20 sticks of uncooked spaghetti
• 1 meter of masking tape
• 1 meter of string,
• 1 large marshmallow,
• 10 mini marshmallows
Challenge Teams have 18 minutes to design, construct, and test models that can help solve this problem. The large marshmallow represents the already harvested crops. The smaller marshmallows represent the yet-to-be harvested crops. Teams must build both types of structures (permanent and temporary), which must be positioned above “sea level” (above the surface of the classroom table).
(For a longer version of this handout, see “On the web.”)
The Science Teacher40
An Engineer Does What Now?
FIGURE 3
Reflection prompts for students.
Our actions (in the sequence they occurred)
Our restrictions(within this sequence)
Generally speaking, does your process seem consistent with scientific processes? r Yes r No Explain your thinking:
FIGURE 4
Typical design process, with additional arrows to indicate multiple approaches.
December 2014 41

An Engineer Does What Now?
allowed. Spaghetti costs $10,000 per noodle; string costs $1,000 per 15 centimeters; and tape costs $1,500 per 5 centimeters.
As the student teams worked on their designs, we offered guidance, asking such questions as:
◆◆ What phase of the design process are you working on?
◆◆ What is the purpose of this phase?
◆◆ Is this something a scientist would do?
◆◆ How will you know when to move on to the next phase?
Through the students’ responses, involvement, and out-comes, we ascertained that they accurately understood the features associated with engineering practices and how this compared to scientific practices. Students were highly en-gaged during prototype development, testing, and redesign-ing. A few groups were discouraged when prototypes didn’t stand erect for long and wanted to completely start over. We encouraged them to consider where their prototypes failed and how they could modify them instead of developing a new plan. Throughout the process students were reminded to document their process in their engineering notebooks, which students use to keep detailed records of their engineering work, includ-ing documenting ideas and questions, sketching ideas, and re-cording testing data. Details recorded for this project included the use of mathematical/geometric principles in their design, forces involved, results of each prototype, and evidence of the different steps of the design process. Additionally, teams were reminded that they were working under the constraint of a deadline: two class sessions for teamwork and a final class ses-sion for writing their individual proposals.
Performance evaluation (90 minutes)Students were provided one class session to individually write a final, polished version of their formal engineering proposal, guided by a rubric (see “On the web”). The purpose of the proposal was to allow students to demonstrate their under-standing of the engineering design process, including choos-ing and justifying a final design, and the appropriate use of engineering and design principles. Many students completed their proposals successfully.
ConclusionsWe found that our activity proved valuable throughout the course and was revisited each time engineering concepts were taught. For example, when building electrical models later in the semester, students went through several prototypes, testing each one, using data and research to inform their decisions. Students were leading discussions, clearly communicating dis-tinctions in their practices as scientific or engineering (or both). This, along with the success students achieved with the activi-ty’s final performance task, led us to conclude that this explicit, reflective approach to teaching about scientific and engineer-
ing practices is effective. Teachers can modify it to fit their own students’ needs, including asking different types of questions once students break into small groups or changing the context of the performance tasks. ■
Amy Gilbert ([email protected]) is a teacher at Turner Middle School in Lithia Springs, Georgia, and Katherine Wade ([email protected]) is a teacher at Coretta Scott King Young Women’s Leadership Academy High School in At-lanta, Georgia.
On the webCell tower proposal rubric; Figure 1A answer key; handout for
Protect Our Food activity: www.nsta.org/highschool/connections.aspx
PBS Force Lab: www.pbs.org/wgbh/buildingbig/lab/forces.html
ReferencesBybee, R. 2013. Translating the NGSS for Classroom Instruction.
Arlington, Virginia: NSTA Press.Fralick, B., J. Kearn, S. Thompson, and J. Lyons. 2009. How
middle schoolers draw engineers and scientists. Journal of Science Education and Technology 18 (1): 60–73.
NGSS Lead States. 2013. Next Generation Science Standards: For states, by states. Washington, DC: National Academies Press.
The Science Teacher42

The Science Teacher60
Work overview.
We make over 20,000 orthopedic im-plants a year to help people in third-world countries. This is a small compa-ny, so I do a little bit of everything. The most fun part of my job is designing new products. The company’s founder travels around the world and tells us what kind of implant or instrument would be useful to people in different countries. It’s up to us to come up with a design to solve peo-ple’s problems and then interface with our machine shop to make the parts.
Third-world countries present an unusual challenge. There are a lot of high-impact fractures from traffic accidents, and these can cause a bad break that can’t be set right away. People who live in rural areas often don’t get to a hospital for weeks or months. By then the bone has already started healing incorrectly, so you have to straighten it out.
The company’s main product is an im-proved tibia nail, which is a rod implanted down the middle of the tibia bone, held together by screws. It holds together pieces of broken bone so they can align and heal. Our version can be implanted without an x-ray machine and is solid, which gives
it a strength advantage and reduces the infection rate.
One of the products I’ve worked on personally is a pediatric nail, which is typi-cally used in the femur. We borrowed a lot of features from the adult nail and made a few adaptations. The pediatric nail has a more flexible portion to accommodate changes in bone curvature as the child grows. Instead of screws, our nail has a fin on one side that wedges to the side of the bone. Because it’s not locked mechanically like a screw, it gives the bone rotational stability, and it doesn’t hinder growth, because the bone can grow over it.
Right now, we’re working on implants to treat tibia plateau fractures at the bot-tom of the knee. I’ve also worked on a hip construct, which is used to treat femoral neck fractures where the femur enters the hip.
For every project, we have to do back-ground research first. Books are often a good place to start, and then we do online searches for new advances in the field and read any new journal articles. We develop a hypothesis of what might work well, then sketch out features and rough dimensions for a model. We talk about the sketch and then make a 3-D model of
one or two designs using our 3-D printer. Later the shop makes a metal prototype, and we test it.
We start with mechanical testing, us-ing a machine that does axial testing to check tension, compression, and torsion and a fatigue machine that simulates walking (below). We use fractured syn-thetic bones that are as strong as real bones. We put them in the walking machine, tell it how much weight to put on, and it starts “walking.” After the prototype stage, the product usually goes for Food and Drug Administration (FDA) clearance.
We keep track of the surgeries done using our products, and the overall picture is that our implants do really well. We’re always trying to figure out how to manu-facture products more cost effectively and how to make them more efficient.
Career highlights.
The highlight so far has been getting FDA clearance for the pediatric nail. The patent won a Patents for Humanity
B iomedica l Eng ineerBiomedical engineers “look at the body as an engineering system with a structure and mechanical forces going through the bones,” says Paul DeVasConCellos. They apply their knowledge of both medicine and engineering to develop diagnostic and treatment devices such as prosthetic limbs, pacemakers, and magnetic resonance imaging machines. De-VasConCellos works for SIGN Fracture Care International, a nonprofit that develops practi-cal and cost-effective orthopedic implants that are provided free of charge to injured, low-income individuals in developing countries. SI
GN (B
OTH
PHOT
OGRA
PHS)
The “walking” machine.
December 2014, Based on Interviews With Professionals Using Science in the Workplace Luba Vangelova

December 2014 61
B O N U S P O I N TS
DeVasConCellos’s education: Education: BS in bioengineering, with minors in math and Spanish, and MS in mechanical engineering, Washington State University
On the web: http://signfracturecare.org
Related occupations: Mechanical engineer, manufacturing engineer
award given by the United States Patent and Trademark Office.
Career path.
When I was really young, I wanted to be a veterinarian or a doctor, but I also liked to take things apart and see how they worked. During my first year of col-lege, I learned about both medicine and engineering and became more interested in combining the two. Biomedical engi-neering was a natural combination.
During graduate school, I worked with SIGN on an antimicrobial coating for implants to prevent infection. After I finished my degree three years ago, I came to work for SIGN full-time.
Background needed.
You need a good background in me-chanical forces. A knowledge of anato-my also helps. You should know how to run testing machines and write reports. You should also know about 3-D mod-eling, which is the best way to convey ideas. Communication is also impor-tant, because the problem you need to solve is not always clear.
Advice for students.
Don’t slack off on math or science; they’re important for getting an engi-neering degree. I found graduate school was a pretty valuable experience. I also
had an internship. Usually the class-room teaches you basic skills, but it’s al-ways good to do something beyond the homework assignment.
NSTA’s NEW Multi-Touch Books Now Available on the iBookstoreSM!
SLIDE SHOWS HANDS-ON ACTIVITIES
NEW PROFESSIONAL DEVELOPMENT RESOURCE
REVIEW QUESTIONSINTERACTIVE IMAGES INTERACTIVE SIMULATIONS VIDEOS
NSTA’s NEW highly interactive and engaging Multi-Touch Books are full of dynamic and interactive features that enable you to learn, share, and explore various topics. Simulations, animations, and video bring content to life, while pop-up review questions and special notes help underscore the most crucial points of knowledge. They even give you the opportunity to collaborate with other educators who teach the same grade level, topic area, and much more. Access this professional development resource on the iBookstore today!iTunes®, iBooks®, iPad®, and iBookstoreSM are registered trademarks of Apple Inc.© 2013
Price in iTunes Store: $17.99
Indulge in the
ultimate learning
experience

The Science Teacher54
B O N U S P O I N TS
Coughlin’s education: BS in physics, University of Minnesota; MS in electrical engineering, University of Minnesota; PhD, electrical engineering, Shinshu University (Japan).
On the web: ww.ieee.org, www.tomcoughlin.com/techpapers.htm
Related occupations: Embedded systems engineer, computer scientist, and photonics engineer.
E lec t r i ca l Eng ineerElectrical engineers deal with machines and machine components that rely on electric current or electro-magnetic fields. They may work in any industry but are most heavily concentrated in the electronics sec-tor. Tom Coughlin specializes in magnetic record-ing devices and has worked on flexible tapes, floppy disks, and hard disks. He is now the president of Coughlin Associates, his own data storage consulting company.
February 2016, Based on Interviews With Professionals Using Science in the Workplace Luba Vangelova
TOM
COU
GHLI
N/IE
EE
Work overview.
I consult for various companies and in-dividuals and organize digital storage conferences, including one specifically for the entertainment industry. I write reports on technology trends in digital storage and applications.
To figure out industry trends, I confer with others and read a lot. Cur-
rently, new devices and new processing and memory capabilities are driving the industry. Digital storage in the cloud, making data accessible through the internet, has led to enormous changes in how we can use machines.
For my consulting work, I some-times test storage devices and analyze problems, such as corrupted data on the device or damaged firmware, a software program on a hardware device. I may try to recover missing or damaged data, which requires specialized equipment, interfaces, and software. Sometimes I use an electron microscope to do materi-als analysis.
Career highlights.
I like the sense of discovery that comes with understanding something and seeing how different parts work to-gether. I’ve made many successful stor-age devices and am the author of six U.S. patents. It’s satisfying to be able to make money off something you made.
I also enjoy writing. I wrote a book about digital storage and consumer electronics and blog about storage for Forbes.com.
Career path.
When I was a kid, I read a series of biographies. The people working in technology seemed so cool because they were making products that could change lives. And they were doing that by knowing about how the universe works.
In high school, I saw my first electron microscope when I visited a fossil collec-tor’s lab. I later got a bachelor’s degree in physics at the University of Minne-sota and then spent a year at Honeywell Research in the Twin Cities, working on magneto-resistive devices for sensor applications. I wanted to use equipment at the University of Minnesota, so I de-cided to go back to get a master’s degree in electrical engineering, with a minor in materials science. Later, I got a PhD.
For a few years after college, I worked on magnetic recording on floppy disks for 3M and then for another company that made magnetic recording heads. After that, I developed storage media for an electronic camera at Po-laroid. I then spent the next 20 years or so in California working at various hard-disk-drive companies, where I de-veloped magnetic recording technology as an engineer and manager. After my last employer went bankrupt, I started my own company.
Knowledge, skil ls and training needed.
My electrical engineering training is useful for understanding what’s going on in a device, how it operates logically, and what issues can occur with erasure or corruption. It’s good to understand software and common debugging tech-

February 2016 55
To submit a proposal, visit
www.nsta.org/conferenceproposals
S H A R E Y O U R I D E A S !Have an idea for an inspiring presentation or workshop on
science education? Submit a session proposal today.
Los Angeles, CA • March 30 – April 2
Proposal Deadline:
4/15/2016
NSTA 2017 National Conference on Science Education
niques, because few things work right the first time.
It’s helpful to know physics princi-ples and material science. Math subjects such as matrices and calculus are good to know. And having a geometrical view is helpful to visualize how things work. It’s important to have some knowledge of communications. Encoding and decoding information is useful, as is understanding the general architecture of systems. And it’s good to be comfort-able meeting people and talking to them so you can learn from them.
Advice for students.
Find something that fascinates you, and explore it as deeply as you can. Find people who know more about it than you do, and learn what they know and what they would recommend for learning even more.
If you look at something from a multifaceted view and examine every possible interaction, you will learn a lot about the world, and you will de-velop good concentration and other skills useful throughout your career.

Science students should undertake engineering design projects and carry out scientific investigations, as rec-ommended by the Next Generation Science Standards
(NGSS Lead States 2013) (see box, p. 28). However, studies show that students misconstrue the goals of science and en-gineering and are uncertain about their respective practices (Gilbert and Wade 2014; Harkema, Jadrich and Bruxvoort 2009, 2012; Jadrich and Bruxvoort 2013). This article de-scribes an electric circuits lesson to teach about the goals and practices of science and engineering to physics students.
Lighting a bulbThis two- to three-day lesson has two main learning goals—to understand the fundamentals of a complete circuit and to understand engineering and science’s related but differing purposes. We provide student pairs with a small lightbulb, insulated wires, and a 1.5-volt battery and challenge them to light the bulb. Students sketch their successful and un-successful configurations (Figures 1A and 1B, p. 24) to help them document their progress and foster later class discus-sions. (Safety note: Instruct students to cautiously manipulate
the batteries, wires, and bulbs. If at any time students’ fingers sting or feel hot, they should immediately release their hold on the equipment [Roy 2010]).
Generally, even students who have previously stud-ied electricity can’t easily light the bulb. The predominant problem-solving strategy is to try every conceivable combina-tion of wires and connection points randomly. We challenge students to reflect on this unsystematic, trial-and-error ap-proach as we proceed with the lesson and present the purpose and methodologies considered normative in engineering.
A “tinkering only” approach After all student pairs have successfully lit the bulb, we initi-ate a large group discussion that focuses on our two main learning goals. We ask students to examine their circuit sketches (successful and unsuccessful), identify the connec-tions that seem necessary to light the bulb, and think about how they approached the task of getting the bulb to light. We ask: “How did you and your partner light the bulb?” and “What were you thinking about as you worked to light the bulb?”
Crystal Bruxvoort and James Jadrich
Exploring the goals of engineering and science
January 2016 23

When asked to reflect in this way, students admit, sometimes sheepishly, to trying lots of different configurations of wires and connections until they lit the bulb. This “confession” usually yields sup-porting comments from other groups such as: “We just messed around until we saw the bulb light up” and “It was sort of like trial and error.”
Students’ answers allow us to begin explaining the purpose of engineering and its associated methodologies. Accord-ing to the A Frramework for K–12 Science Education (NRC 2012), engineering en-compasses all manner of societal and tech-nological problem-solving to meet human needs and wants. The Framework and NGSS (NGSS Lead States 2013) also point out that engineering design typically involves researching or developing relevant scientific models and systematically ap-plying those models to design a carefully considered solution. In this respect, “messing around” or “trial and error” is an inadequate portrayal of standard engineering practice. At times, engineers (and scientists) use trial and error or tinker-ing as practicing engineers commonly refer to it, but tinker-ing alone doesn’t represent normative practice for engineers.
We explain this idea further in the next two phases of the lesson.
Developing a scientific model for a complete circuit Students next develop a model to account for electricity flow in a circuit. Given time constraints, we present students with four possible scientific models (Figure 2) that represent stu-dents’ most common responses to how an electric circuit works (Osbourne and Freyberg 1985).
We begin by describing the subtle differences among the four proposed models. Then, working in small groups, stu-dents test and determine which model best explains how a complete circuit works, keeping in mind that no scientific model completely explains everything.
Having taught this lesson for many years, we can state how students typically work through this section of the les-son. Students quickly reject Model A, recognizing that they tested this model when they tried to light their bulbs. At first glance, Models B, C, and D appear identical to most students. We encourage them to inspect each model closely and, with prompting, they eventually notice some important differ-ences:
◆◆ Model B depicts positive and negative charges combining to make the bulb light.
◆◆ Model C proposes that charges are used up as they pass
through the bulb.
◆◆ Model D proposes that charges leave one side of a battery, pass through the bulb, and return to the battery.
We provide students with additional equipment (i.e., extra batteries, bulbs, bulb holders), and they build test cir-cuits to evaluate the models. We encourage them to compare what they observe in their test circuits with what they pre-dict should happen. Depending on group progress, we may even suggest that students construct a particular test circuit
FIGURE 1A
A typical student drawing of the circuits that light a bulb.
FIGURE 1B
A typical student drawing of the circuits that don’t light a bulb.
The Science Teacher24

Don’t “Short Circuit” STEM Instruction
(Figure 3), and we talk through how this setup will help make and test predictions.
Below we offer a summary of the test circuits along with students’ predictions and analysis as they evaluate Models B, C, and D.
◆◆ Model B: According to Model B, negative and positive charges come together and combine to make a bulb light. If that is so, Model B is unclear as to what should happen if students wire two bulbs as in Figure 3. Will only one of the two bulbs light (presumably the bulb where the charges combine) or will both bulbs remain unlit because the charges combine somewhere inside one of the wires? Model B is ambiguous as to what would happen in these cases, and thus it doesn’t seem to support the fact that both bulbs light up. This prompts students to reject Model B.
◆◆ Model C: According to Model C, some charge is used as current passes through a bulb. If multiple bulbs are
FIGURE 2
Four possible models for electric current.
Model A: Negative charge comes out of the battery, goes into the bulb, and produces light.
Model B: Positive charge comes from the positive side of the battery, and negative charge comes from the negative side. The charges meet in the bulb and produce light.
Model C: Negative charge comes from the battery. Some of this charge gets used up in the bulb to produce light, and the rest goes back into the battery.
Model D: Negative charge comes from the battery. All of this charge goes back into the other end of the battery.
FIGURE 3
Examining two bulbs in series helps to shed light on how current flows in an electric circuit.
January 2016 25

connected (e.g., Figure 3), one bulb would be dimmer than the others as some charge is used up from one bulb to the next. When examining their results, students see that the bulbs in the series are equally bright and subsequently reject this model.
◆◆ Model D: According to Model D, charges leave one end of the battery, move through the bulb, and return to the other end of the battery. In this case, when observing two bulbs in series, both bulbs appear equally bright. Because this observation is consistent with the prediction, Model D appears to be the best of the four models.
Despite these results, many students remain un-comfortable with Model D. They argue that if all the charges return to the battery, then batteries would never die. This concern leads to a discussion about the nature of scientific models. Scientific models are never fully complete: They all have limitations in how accu-rately or completely they represent the physical world (Jadrich and Bruxvoort 2011; Gilbert 1991). In this case, a more complete model would have to include many more details, such as how batteries operate and why they eventually lose the ability to push charges through a circuit as the chemical reactants deplete. Scientists are constantly working to increase the accuracy and com-pleteness of scientific models. This practice distinguishes sci-ence as a field of study.
We emphasize that Model D isn’t wrong but incomplete. It doesn’t explain why charges go around and eventually stop in a circuit, and there is no way of knowing if those charges are positive or negative. The model does, however, provide a good explanation for how circuits could work.
Solving circuit design problems After students develop a scientific model for electric circuits, we assign problem-solving activities in which they design cir-cuits to perform specific functions. We give students access to additional batteries, battery holders, bulbs, bulb holders, wires, and a variety of switches. Examples of problem-solv-ing activities include
◆◆ Design an alarm system that sounds a buzzer or turns on a light when an intruder steps on a doormat.
◆◆ Design a circuit involving a toggle switch so that a bulb lights when the switch is “closed” and turns off when the switch is “open.”
◆◆ Design a circuit with two bulbs and a switch so that one bulb is on and the other is off when the switch is in one position and the reverse happens when the switch is in the opposite position.
FIGURE 4
A student solution to a design problem in which the bulb(s) stay lit even if other bulb(s) are removed from the circuit.
◆◆ Design a circuit with three lightbulbs so that one bulb can be removed while the others stay on (e.g., Christmas tree lights). Figure 4 shows a student solution to this problem.
While students work on these design challenges, we re-mind them to use the model they previously developed. To dissuade students from reverting to the tinkering approach, we require them to sketch circuit designs they think might work and provide oral explanations describing their mod-els. As students work, we ask them to justify their designs, asking questions such as: “Tell me how you are using the idea of a complete circuit” and “Trace how you think cur-rent would flow.”
Students could solve these circuit problems more quickly if they didn’t have to reflect on and justify how a scientific model informed their work. However, allowing random tin-kering reinforces the misconception that engineering is just tinkering and obscures the essential interdependence of sci-ence and engineering.
Distinguishing the purposes of science and engineeringWe open the final discussion by emphasizing that the purpose of science is to generate and test scientific models to determine which models best explain and predict natural phenomena (Boesdorfer and Greenhalgh 2014; Gilbert 1991; Harkema,
The Science Teacher26
Don’t “Short Circuit” STEM Instruction
Jadrich, and Bruxvoort 2009, 2012; Jadrich and Bruxvoort 2011, 2013; Seok Oh and Jin Oh 2011). In contrast, engineer-ing’s main goal is to generate desired outcomes to meet spe-cific needs and wants, such as solving a societal problem or as-sisting the scientific community (Boesdorfer and Greenhalgh 2014; Harkema, Jadrich and Bruxvoort 2009, 2012; Jadrich and Bruxvoort 2013; Landis 2007). Figure 5 provides exam-ples of both scientific and engineering projects.
Students are asked to identify where in this lesson they pursued engineering goals and where they pursued scientific goals. They readily identify that they tested Models A, B, C, and D for a scientific goal and that the design challenges were consistent with engineering. The initial problem stu-dents solved (i.e., lighting a bulb) is engineering, but we rein-force that their tinkering approach isn’t generally normative.
Science and engineering aren’t always clearly distinct. Sometimes practicing scientists pursue engineering goals, and vice-versa. If few relevant models are at hand, engineers must first do some model testing to derive potentially relevant models, as scientists would do. Similarly, scientists often have both a scientific and an engineering goal in mind, such as when they generate a new model for antibiotic resistance and then work on the production of molecules for that purpose.
ConclusionThe NGSS charge science teachers to teach the goals and prac-tices of science and engineering. We use this electric circuits lesson to compare and contrast the primary goals of science and engineering and reflect on how they are integrally related. Be-cause students tend to rely on an unsystematic, trial-and-error
FIGURE 5
More examples of scientific and engineering pursuits. Scientific questions:• In a lever, what is the relationship between load
position and effort? • Why do slow-moving rivers meander more than
fast ones?• What is the effect of temperature on chemical
reaction rates?
Engineering questions or problems: • Make a toothbrush to clean hard-to-reach back
teeth. • Design a school composting and recycling system
that reduces waste by 50%.• What is the most efficient way for passengers to
board an airplane?
approach when pursuing engineering problems, we empha-size that tinkering isn’t the dominant engineering strategy. Rather, engineering is primarily dependent on using models to problem solve. ■
Crystal Bruxvoort ([email protected]) is an associate professor of science education, and James Jadrich ([email protected]) is a professor of science education, at Calvin College in Grand Rap-ids, Michigan.
AcknowledgmentsThe authors wish to acknowledge financial support provided by the National Science Foundation (DUE-0639694) and Calvin College.
ReferencesBoesdorfer, S., and S. Greenhalgh. 2014. Make room for
engineering. The Science Teacher 81 (9): 51–55. Gilbert, A., and K. Wade. 2014. An engineer does what now?
The Science Teacher 81 (9): 37–42.Gilbert, S.W. 1991. Model building and a definition of science.
Journal of Research in Science Teaching 28 (1): 73–79. Harkema, J., J. Jadrich, and C. Bruxvoort. 2009. Science and
engineering: Two models of laboratory investigation. The Science Teacher 76 (9): 27–31.
Harkema, J., J. Jadrich, and C. Bruxvoort. 2012. Science and engineering: Two models of laboratory investigation. In Integrating Engineering + Science in Your Classroom, ed. E. Brunsell, 7–12. Arlington, VA: NSTA Press.
Jadrich, J., and C. Bruxvoort. 2011. Learning and Teaching Scientific Inquiry: Research and Applications. Arlington, VA: NSTA press.
Jadrich, J., and C. Bruxvoort. 2013. Confusion in the Classroom about the Natures of Science and Technology: Implications for Scientific and Technological Literacy. In The Nature of Technology: Implications for Learning and Teaching, eds. M.P. Clough, J.K. Olson and D.S. Niederhauser, 411-426. Rotterdam, The Netherlands: Sense Publishers.
Landis, R.B. 2007. Studying engineering: A road map to a rewarding career. 3rd ed. Los Angeles: Discovery Press.
National Research Council (NRC). 2012. A framework for K–12 science education: Practices, crosscutting concepts, and core ideas. Washington, DC: National Academies Press.
NGSS Lead States. 2013. Next Generation Science Standards: For states, by states. Washington, DC: National Academies Press.
Osbourne, R., and P. Freyberg. 1985. Learning in science: The implications of children’s science. Portsmouth, New Hampshire: Heinemann Publishers.
Roy, K. 2010. Battery safety basics. Science Scope 33 (7): 18–20.Seok Oh, P., and S. Jin Oh. 2011. What teachers of science need
to know about models: An overview. International Journal of Science Education 13 (8): 1109–1130.
January 2016 27

Don’t “Short Circuit” STEM Instruction
Connecting to the Next Generation Science Standards (NGSS Lead States 2013).
StandardHS-PS3 Energy
Performance ExpectationsThe materials/lessons/activities outlined in this article are just one step toward reaching the performance expectations listed below.HS-PS3-2. Design and use models to illustrate that energy at the macroscopic scale can be accounted for as a combination of energy associated with the motions of particles (objects) and energy associated with the relative position of particles (objects).HS-PS3-3. Design, build, and refine a device that works within given constraints to convert one form of energy into another form of energy.
Dimension Name and NGSS code/citation Specific Connections to Classroom Activity
Science and Engineering Practices
Developing and Using Models• Use a model to provide mechanistic accounts of
phenomena. (HS-PS3-2)
Constructing Explanations and Designing Solutions• Design, evaluate, and/or refine a solution to a complex
real-world problem, based on scientific knowledge, student-generated sources of evidence, prioritized criteria, and tradeoff considerations. (HS-PS3-3)
Students test four models—each of which attempts to account for how electricity works in a closed circuit.
Students are tasked to apply a model for electricity to explain why certain circuits work as desired and others do not.
Disciplinary Core Ideas
HS-PS3.A: Definitions of Energy • At the macroscopic scale, energy manifests itself in mul-
tiple ways, such as in motion, sound, light, and thermal energy. (HS-PS3-2, HS-PS3-3)
Students develop and test a model for electricity. Ultimately, this model is used to develop circuits according to certain specifications.
Crosscutting Concepts
Energy and Matter• Changes of energy and matter in a system can be
described in terms of how energy and matter flows into, out of, and within that system. (HS-PS3-3)
• Energy cannot be created or destroyed—only moves between one place and another place, between objects and/or fields, or between systems. (HS-PS3-2)
Students design circuits where various energy transformations occur to generate the desired outcome(s) (e.g., stored chemical energy to electrical energy to heat energy to light energy).
Connections to Engineering, Technology, and Applications of Science:• Modern civilization depends on major
technological systems. Engineers continuously modify these technological systems by applying scientific knowledge and engineering design practices to increase benefits while decreasing costs and risks. (HS-PS3-3)
Discussions throughout this lesson focus on two important aspects related to the natures of science and engineering:• The purpose of science is different from the purpose of
engineering.
• Good engineering practice does not end with only a tinkering approach, rather effective engineering practice also involves applying scientific models to achieve certain outcome(s).
Connecting to the Common Core State StandardsMathematics: MP.2 Reason abstractly and quantitatively. (HS-PS3-3)
The fundamental model for electricity students are developing and testing requires abstract thinking on the level of charges, charges moving, etc.
The Science Teacher28

The Next Generation Science Standards (NGSS Lead States 2013) urge science teachers to include engineer-ing practices and ideas in their already full science cur-
riculum. But many teachers don’t know where to start. Only 7% of high school science teachers report feeling “very well prepared” to teach engineering. The apprehension level may be higher for those who don’t teach physics—28% of physics teachers have taken an engineering course compared to only 10% of other science teachers (Banilower et al. 2013). In this article, we describe the engineering design process and how it parallels scientific practices. Then we suggest ways science teachers can begin to incorporate engineering design into their current classroom curricula.
How science and engineering are similar and differentEngineering education parallels and complements science education. Similar to some goals of science education, a goal of engineering education is to promote engineering “habits of mind” in addition to preparing the next generation of scientists, engineers, and related STEM professionals. Engi-
neering education provides students with skills in creating and evaluating the built (technological) world, just as science education provides skills in understanding the natural world.
Although scientists and engineers use similar practices, such as
◆◆ developing and using models,
◆◆ planning and carrying out investigations,
◆◆ analyzing and interpreting data,
◆◆ using mathematical and computational thinking,
◆◆ engaging in arguments from evidence, and
◆◆ obtaining, evaluating, and communicating information (NRC 2012 p. 49),
they use these practices to achieve generally different out-comes. Scientists typically work to understand natural phe-nomena while engineers try to design a solution to a prob-lem. This similarity in practices of scientists and engineers has led to two common categories of science class activities: science model and engineering model (Harkema, Jadrich, and
Strategies to overcome anxieties about adding
engineering to your curriculum
Sarah Boesdorfer and Scott Greenhalgh
December 2014 51
Bruxvoort 2012; Schauble, Klopfer, and Raghavan 1991). Sci-ence model activities ask students to collect and use data to find relationships or understand what occurs in an observed phenomenon. For example, students could discover and ex-plain the relationship between the pressure and volume of a gas or identify the environmental conditions that seeds re-quire to sprout. In science model activities, students ask ques-tions and collect data to understand and explain.
Engineering model activities, on the other hand, ask stu-dents to develop a product, process, or system to meet a chal-lenge or solve a problem. For example, students could design a zoo habitat for an animal based on its specific adaptations, or students could use their knowledge of stoichiometry to de-sign a process that consistently produces 5.0 g of zinc chloride by reacting zinc and hydrochloric acid. These activities are engineering model investigations because a problem is de-fined, a solution (product) created, and a need fulfilled. The science activities result in “universal” knowledge and under-standings, while engineering activities result in solutions that are context specific.
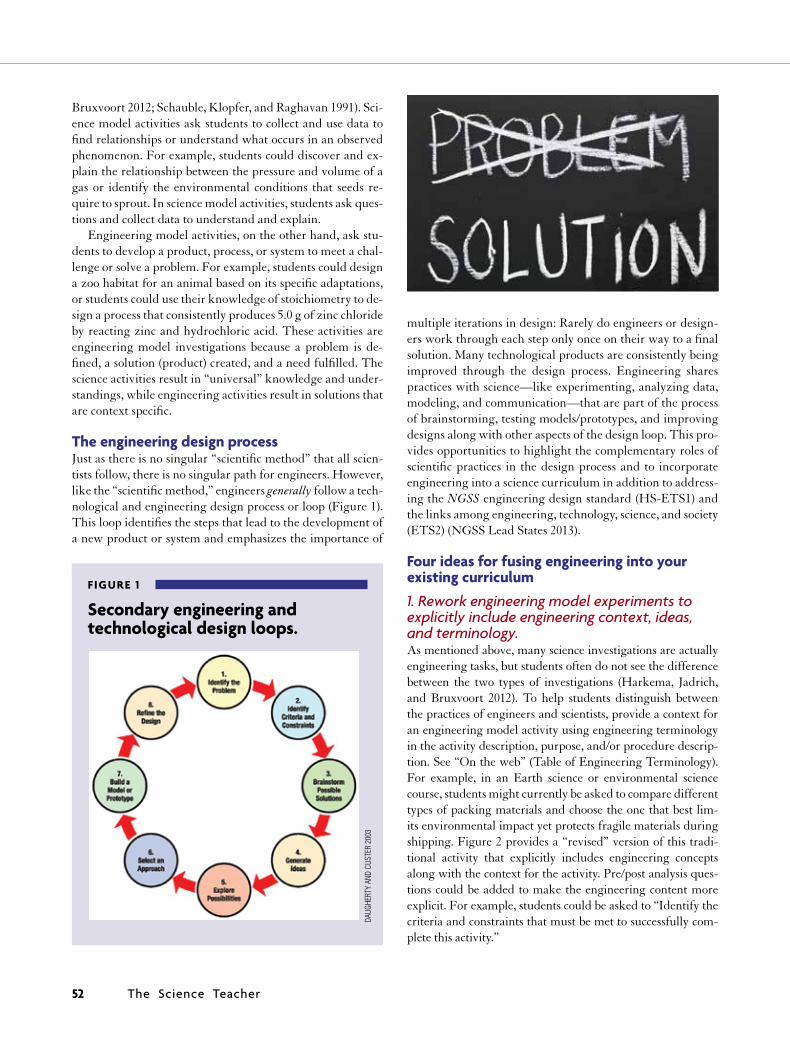
The engineering design process Just as there is no singular “scientific method” that all scien-tists follow, there is no singular path for engineers. However, like the “scientific method,” engineers generally follow a tech-nological and engineering design process or loop (Figure 1). This loop identifies the steps that lead to the development of a new product or system and emphasizes the importance of
multiple iterations in design: Rarely do engineers or design-ers work through each step only once on their way to a final solution. Many technological products are consistently being improved through the design process. Engineering shares practices with science—like experimenting, analyzing data, modeling, and communication—that are part of the process of brainstorming, testing models/prototypes, and improving designs along with other aspects of the design loop. This pro-vides opportunities to highlight the complementary roles of scientific practices in the design process and to incorporate engineering into a science curriculum in addition to address-ing the NGSS engineering design standard (HS-ETS1) and the links among engineering, technology, science, and society (ETS2) (NGSS Lead States 2013).
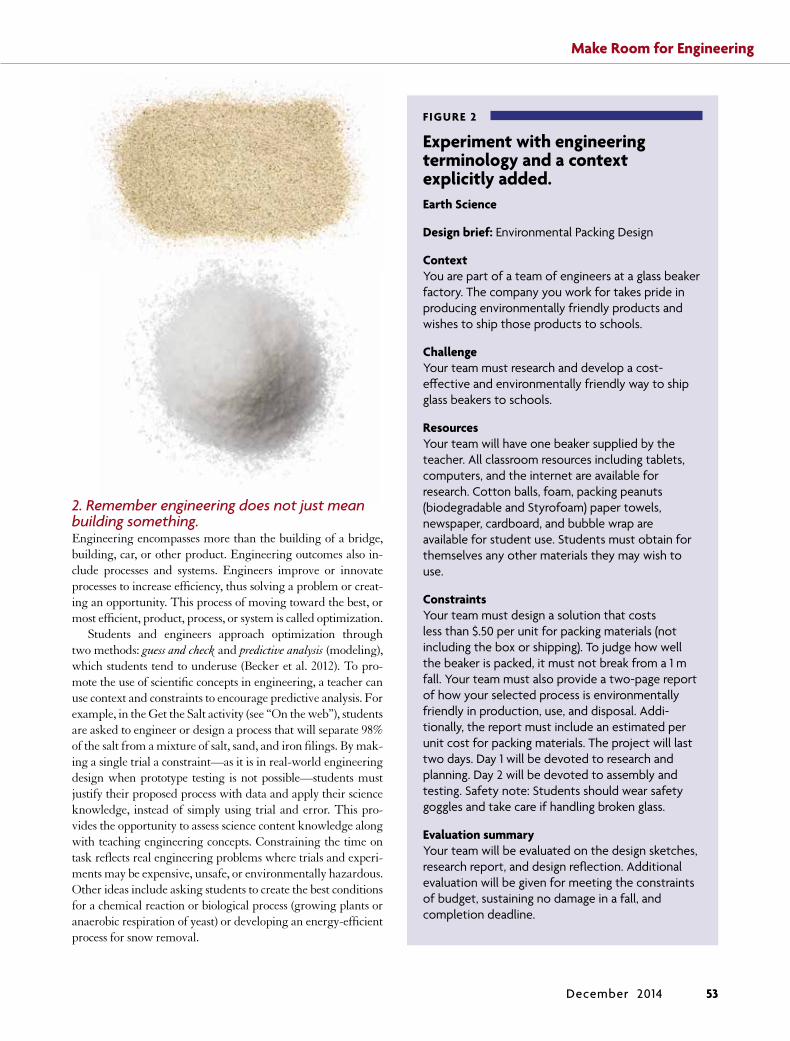
Four ideas for fusing engineering into your existing curriculum 1. Rework engineering model experiments to explicitly include engineering context, ideas, and terminology.As mentioned above, many science investigations are actually engineering tasks, but students often do not see the difference between the two types of investigations (Harkema, Jadrich, and Bruxvoort 2012). To help students distinguish between the practices of engineers and scientists, provide a context for an engineering model activity using engineering terminology in the activity description, purpose, and/or procedure descrip-tion. See “On the web” (Table of Engineering Terminology). For example, in an Earth science or environmental science course, students might currently be asked to compare different types of packing materials and choose the one that best lim-its environmental impact yet protects fragile materials during shipping. Figure 2 provides a “revised” version of this tradi-tional activity that explicitly includes engineering concepts along with the context for the activity. Pre/post analysis ques-tions could be added to make the engineering content more explicit. For example, students could be asked to “Identify the criteria and constraints that must be met to successfully com-plete this activity.”
FIGURE 1
Secondary engineering and technological design loops.
DAUG
HERT
Y AN
D CU
STER
200
3
The Science Teacher52
Make Room for Engineering
2. Remember engineering does not just mean building something.Engineering encompasses more than the building of a bridge, building, car, or other product. Engineering outcomes also in-clude processes and systems. Engineers improve or innovate processes to increase efficiency, thus solving a problem or creat-ing an opportunity. This process of moving toward the best, or most efficient, product, process, or system is called optimization.
Students and engineers approach optimization through two methods: guess and check and predictive analysis (modeling), which students tend to underuse (Becker et al. 2012). To pro-mote the use of scientific concepts in engineering, a teacher can use context and constraints to encourage predictive analysis. For example, in the Get the Salt activity (see “On the web”), students are asked to engineer or design a process that will separate 98% of the salt from a mixture of salt, sand, and iron filings. By mak-ing a single trial a constraint—as it is in real-world engineering design when prototype testing is not possible—students must justify their proposed process with data and apply their science knowledge, instead of simply using trial and error. This pro-vides the opportunity to assess science content knowledge along with teaching engineering concepts. Constraining the time on task reflects real engineering problems where trials and experi-ments may be expensive, unsafe, or environmentally hazardous. Other ideas include asking students to create the best conditions for a chemical reaction or biological process (growing plants or anaerobic respiration of yeast) or developing an energy-efficient process for snow removal.
FIGURE 2
Experiment with engineering terminology and a context explicitly added.Earth Science
Design brief: Environmental Packing Design
ContextYou are part of a team of engineers at a glass beaker factory. The company you work for takes pride in producing environmentally friendly products and wishes to ship those products to schools.
ChallengeYour team must research and develop a cost-effective and environmentally friendly way to ship glass beakers to schools.
ResourcesYour team will have one beaker supplied by the teacher. All classroom resources including tablets, computers, and the internet are available for research. Cotton balls, foam, packing peanuts (biodegradable and Styrofoam) paper towels, newspaper, cardboard, and bubble wrap are available for student use. Students must obtain for themselves any other materials they may wish to use.
Constraints Your team must design a solution that costs less than $.50 per unit for packing materials (not including the box or shipping). To judge how well the beaker is packed, it must not break from a 1 m fall. Your team must also provide a two-page report of how your selected process is environmentally friendly in production, use, and disposal. Addi-tionally, the report must include an estimated per unit cost for packing materials. The project will last two days. Day 1 will be devoted to research and planning. Day 2 will be devoted to assembly and testing. Safety note: Students should wear safety goggles and take care if handling broken glass.
Evaluation summaryYour team will be evaluated on the design sketches, research report, and design reflection. Additional evaluation will be given for meeting the constraints of budget, sustaining no damage in a fall, and completion deadline.
December 2014 53

use the first part of the design process; identify the problem, constraints, and criteria and then create a design. Students communicate their design, justifying it with their science knowledge; an example is the Heating Water with the Sun activity (see “On the web”). Using activities that focus on dif-ferent aspects of the design loop allows students to learn, im-prove, and understand different engineering practices, and provides teachers several options to connect engineering to the curriculum. Students at times are provided with data rather than collecting it themselves so they can focus on the skill of making claims from data.
3. Use the design loop as a tool for creating activities.The design loop can provide a scaffold to create activities for students. The design loop provides a systematic problem-solving strategy used to develop many possible solutions to a problem (ITEA 2007). Students can be asked to perform a task in which they must go through the entire process, or a task could be designed to focus on just part of the process, e.g., identifying the problem and criteria and developing pos-sible solutions, or simply testing and improving a design.
For example, students could go through the entire de-sign loop if asked to design a plan to improve a local outdoor space. In the Improving Your Environment activity (see “On the web”), students justify their plan, including addressing the environmental impact, and then assess their improve-ment and its impact on humans and the environment. Al-ternatively, activities might use only a portion of the design process. The activity in Figure 3 requires students to use the later portions—by testing and improving a prototype/design that already exists for keeping carbonated beverages from losing their fizz. Another activity might require students to
Using activities that focus on different aspects of the design loop allows students to learn, improve, and understand different
engineering practices and provides teachers several options to connect
engineering to the curriculum.
4. Create a design briefPresent students with a design brief—a written plan that identifies a problem to be solved, its criteria, and its con-straints (ITEA 2007). The design brief encourages thinking about all aspects of a problem before attempting a solution and provides the context and the reasons the problem needs solving. A design brief should include
1. the situation (the context);
2. the problem;
3. the materials/resources available for the students;
4. the constraints of the project, including time; and
5. the criteria for evaluation.
AssessmentA template rubric reflecting the processes of the engineering and technological design loop described in this article is avail-able online, as are simple rubrics for the “Get the Salt” and “Heating Water with the Sun” activities (see “On the web”).
ConclusionEngineering tasks require students to meet a challenge, per-form a specific task, create an opportunity, or solve a prob-lem. For science educators, it is important to remember the objective is learning an open-ended problem-solving process in which students use and demonstrate their knowledge of science core ideas and gain experience with science and engineering practices. It is easy for teachers and students to be caught up in the individual task and products. Often,
The Science Teacher54

Make Room for Engineering
FIGURE 3
Activity in which students use part of the design process.
Chemistry
Design brief: Retain the Fizz
ContextThe Sodas ‘R’ Us company just purchased the Pop’s Our Game company. Among the company’s inventory, they found some small plastic devices labeled as CO2 Keepers. Sodas ‘R’ Us believes it is a device to keep the soda from losing its carbonation (going flat) after it has been opened. However, there are no instructions with the devices. They don’t know how the device works and how to use it to its fullest potential. They have called in a team of engineers (you) to investigate and develop the process by which the device can be used to maintain the carbonation in the soda the longest.
ChallengeCreate a set of instructions for the CO2 Keepers that allows them to keep soda “fresh” the best. You must present your instructions to the company representatives. Your presentation must include an explanation of how the CO2 Keeper works, your instructions, the results of your instructions (and how you define “best”), and data to support your instructions.
ResourcesYou will get 1 CO2 Keeper and three 20 oz. bottles of soda along with any lab equipment you want or need, which includes CO2 sensors and gas pressure sensors from our probeware. You will also have internet/computer access as needed. If you need more soda, you may provide your own.
Constraints You have three class periods to plan, experiment, collect data, and create your presentation. Some presentation work may be done outside of class. You may collaborate with other groups for data collection, but each group should create its own presentation.
Evaluation summaryYour team will be evaluated on the quality of your presentation, which includes the use of data to support your findings. See the rubric for specific details about the evaluation of the presentation.
students (and maybe teachers) do not realize that these activi-ties require students to use engineering practices.
We hope this article helps teachers to make engineering practices and design more explicit in science instruction and to improve student understanding of engineering and how it relates and strongly overlaps with the practice of science. NGSS asks science teachers to include engineering design in our science teaching. The ideas presented here should help reduce the anxiety that comes with adding something new to a curriculum. ■
Sarah Boesdorfer ([email protected]) is an assistant professor of chemical education in the Department of Chemis-try and Biochemistry, and Scott Greenhalgh ([email protected]) is assistant professor and program coordinator of Tech-nology and Engineering Education at the University of Northern Iowa in Cedar Falls.
On the webDesign brief template, Get the Salt activity description, Heating
Water with the Sun activity description, Improving your Environment activity description, table of engineering terminology, template for a design loop rubric: www.nsta.org/highschool/connections.aspx
ReferencesBanilower, E. B., P. S. Smith, I. R. Weiss, K. A. Malzahn, K. M.
Campbell, and A. M. Weis. 2013. Report of the 2012 national survey of science and mathematics education. Chapel Hill, NC: Horizon Research, Inc.
Becker, K., N. Mentzer, K. Park, and S. Huang. 2012. High school student engineering design thinking and performance. American Society for Engineering Educators National Conference. San Antonio, TX.
Daugherty, M., and R. Custer. 2003. STEM Flow Chart. http://1.usa.gov/1o0Bbhi.
Harkema, J., J. Jadrich, and C. Bruxvoort. 2012. Science and engineering: Two models of laboratory investigation. In Integrating engineering and science in your classroom, ed. E. Brunsell, 7–12. Arlington, VA: NSTA Press.
International Technology Education Association (ITEA). 2007. Standards for technological literacy. Reston, VA. International Technology Education Association. www.iteea.org/TAA/PDFs/xstnd.pdf
National Research Council (NRC). 2012. A framework for K–12 science education: Practices, crosscutting concepts, and core ideas. Washington, DC: National Academies Press.
NGSS Lead States. 2013. Next Generation Science Standards: For states by states. Washington, DC: National Academies Press.
Schauble, L., L. E. Klopfer, and K. Raghavan. 1991. Students’ transition from an engineering model to a science model of experimentation. Journal of Research in Science Teaching 28 (9): 859–882.
December 2014 55
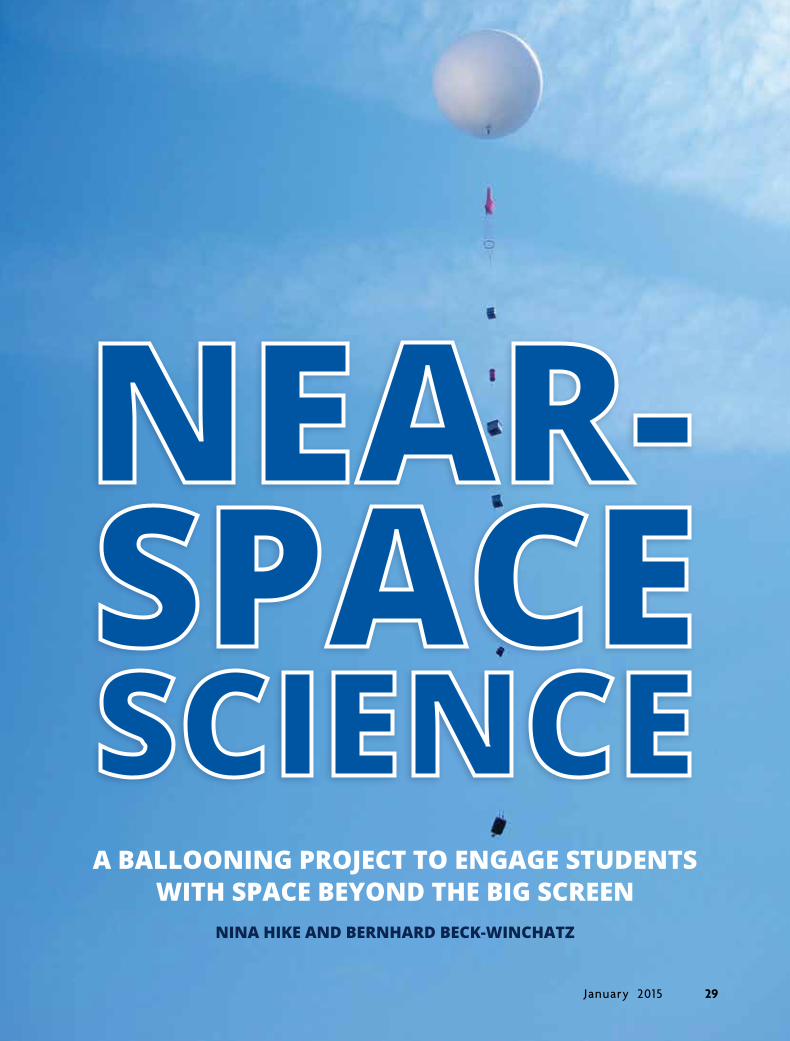
A BALLOONING PROJECT TO ENGAGE STUDENTS WITH SPACE BEYOND THE BIG SCREEN
NINA HIKE AND BERNHARD BECK-WINCHATZ
January 2015 29
Many of your students probably know
something about space from playing
computer games or watching movies
and TV shows. But you can expose them to the
real thing by launching their experiments into near
space on a weather balloon.
This article describes how to use high-altitude ballooning (HAB) as a culminating project to a chemistry unit on exper-imental design, gas laws, and air pollution. We describe how to design an instructional unit and perform a balloon launch, and we provide examples of student projects. We hope your students enjoy this real-life taste of space as much as ours did.
Ballooning backgroundHABs are filled with helium or hydrogen and released into the stratosphere (for student projects, only helium is accept-able, due to hydrogen’s flammability); scientists often use a weather ballon (a type of HAB) to conduct experiments in near space—at altitudes above 99% of Earth’s atmosphere. Many research projects require scientists to collaborate with engineers to develop the technology they need for such ex-periments. For example, when NASA launches a new space mission, the scientists tell the engineers what data the space-craft should collect, and the engineers tell the scientists the design constraints of their instruments, such as limits on size, weight, and power consumption.
Ballooning engages high school students in a similar in-teraction and thus aligns with the Next Generation Science Standards’ (NGSS) emphasis on science and engineering practices (NGSS Lead States 2013); the project is inherently interdisciplinary and can cover the range of NGSS disciplin-ary core ideas and crosscutting concepts.
Our near-space adventureWe undertook our own HAB project in spring 2013 as part of an International Baccalaureate Middle Years Programme chemistry course at Curie Metro High School in Chicago. Eighty percent of the students are Hispanic, and 95% come from low-income families.
More than 80 students in three sections of the course par-ticipated in our project. The textbook we use, the American Chemical Society’s Chemistry in the Community (ACS 2011), worked well because it allowed us to integrate ballooning as part of a Putting It All Together Project (PIAT)—something the textbook includes at the end of each unit. We selected “Unit 2—Air: Designing Scientific Investigations” because it covers many concepts that are relevant for balloon experi-ments, such as
◆◆ experimental design,
◆◆ gas laws,
◆◆ kinetic molecular theory,
◆◆ atmospheric properties, and
◆◆ air pollution.
Students designed and launched 12 different experiments based on their understanding of these concepts. For example, one group investigated the effect of changing atmospheric conditions on the propagation of sound waves. They played a single-frequency tone using an MP3 player connected to a speaker and measured its volume using a sound level me-ter. The following sections describe the project in more de-tail.
Project breakdownWe divided the project into five segments:
◆◆ review of literature,
◆◆ experimental design,
◆◆ collecting and presenting data,
◆◆ conclusions and evaluation, and
◆◆ oral presentations.
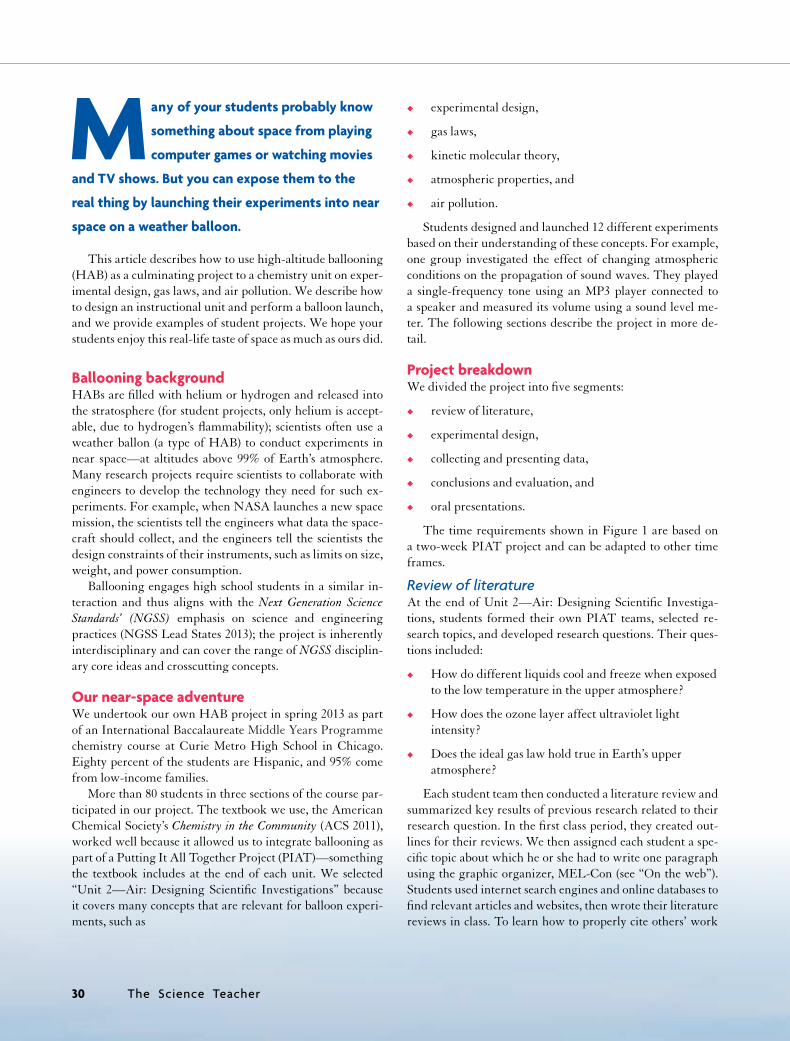
The time requirements shown in Figure 1 are based on a two-week PIAT project and can be adapted to other time frames.
Review of literature At the end of Unit 2—Air: Designing Scientific Investiga-tions, students formed their own PIAT teams, selected re-search topics, and developed research questions. Their ques-tions included:
◆◆ How do different liquids cool and freeze when exposed to the low temperature in the upper atmosphere?
◆◆ How does the ozone layer affect ultraviolet light intensity?
◆◆ Does the ideal gas law hold true in Earth’s upper atmosphere?
Each student team then conducted a literature review and summarized key results of previous research related to their research question. In the first class period, they created out-lines for their reviews. We then assigned each student a spe-cific topic about which he or she had to write one paragraph using the graphic organizer, MEL-Con (see “On the web”). Students used internet search engines and online databases to find relevant articles and websites, then wrote their literature reviews in class. To learn how to properly cite others’ work
The Science Teacher30
Near-Space Science
FIGURE 1
Project timeline. Each class period is 52 minutes long.
Segments Activities Required timeNGSS Science and Engineering Practices (NGSS Lead States 2013)
Review of literature
• Develop Review of Literature outlines. Conduct internet research and review class notes for scientific concepts and ballooning procedures.
• Write group Review of Literature.
Two class periods
Practice 8: Obtaining, evaluating, and communicating information
Experimental design
• Finalize research questions.
• Construct hypotheses and experimental design tables.
• Develop and practice procedures.
• Address safety issues.
Three class periods
Practice 1: Asking questions and defining problems
Practice 3: Planning and carrying out investigations
Practice 6: Constructing explanations and designing solutions
Data collection and presentation
• Construct payloads.
• Launch balloon.
• Generate data tables and graphs.
One school day (7 a.m.–5 p.m.)
Two class periods
Practice 2: Developing and using models
Practice 3: Planning and carrying out investigations
Practice 4: Analyzing and interpreting data
Practice 5: Using mathematics and computational thinking
Conclusions and evaluation
• Draw conclusions.
• Evaluate experimental designs.
One class period
Practice 6: Constructing explanations and designing solutions
Practice 7: Engaging in argument from evidence
Presentations • Present results to peers, teacher, and assistant principal.
One class period
Practice 8: Obtaining, evaluating, and communicating information
according to the American Psychological Association (APA) style guide, students used the Son of a Citation Machine web-site (see “On the web”).
Experimental designWe gave students three class periods to plan their experi-ments, finalize their hypotheses, and design their payloads. (The Federal Aviation Administration [FAA] imposes a
12 lb. [5.4 kg] weight limit on a weather balloon’s payload [U.S. GPO 2014].) An experimental design table (example, Figure 2, p. 33) provided students a framework for devel-oping experimental procedures. Students also completed a tethered launch—without actually releasing the balloon— on the school’s athletic field to practice filling the balloon, attaching payload containers, and using the tracking soft-ware.
January 2015 31

Ballooning logistics: A how-to guide.Launch and landingYou can launch a weather balloon from a park, athletic field, or parking lot with enough space for the balloon to ascend without catching in a tree or other obstacle. Avoid densely populated areas and airports. You can predict the landing site to within a few miles by using prediction software (see “On the web”).
A balloon will typically ascend for about 90 minutes to altitudes of 27–30 km before it bursts. Descent of payloads on a parachute takes about 30 minutes. The horizontal distance between launch and landing sites varies from a few kilometers in spring, summer, and fall to over 150 km during the winter months.
Regulations and safetyComply with all FAA regulations (U.S. GPO 2014) and follow common-sense safety precautions for student transportation, launch, and payload recovery from difficult locations such as trees. Helium tanks should be properly secured for transport, strapped to a wheeled cart or dolly when moved, and kept upright. Never allow students or adults to inhale helium, as this can cause asphyxiation. Trained adult supervision should be provided at all times.
Costs and materialsThe figure below shows a typical flight system, and the table lists the various costs associated with the project. Consumables for each flight include the balloon, helium, and miscellaneous other supplies that are approximately $200–400. Because our high school is located in a densely populated urban area, we rented a school bus to provide student transportation to the launch site and during the chase. The cost of the reusable equipment for this project is about $1,000 and consists of both a parachute and a HAM radio tracking system.
The flight track for our project.
Part Purchase informationApproximate cost
1,200 g or 1,500 g balloon
Kaymontballoons.com: Part HAB-1200 or HAB-1500
$100–120
Helium size 300 cylinder
Purchase from welding supply stores or other gas supplier
$100–200
Miscellaneous consumables
Mason line, duct tape, cable ties, payload containers, and batteries
$50–100
Global Positioning System (GPS) tracker
BigRedBee.com: Part BLGPS2MHP with case and antenna
$280
Parachute (6 ft. [1.8 m]) The-RocketMan.com $55
Tracking radio for chase vehicle
Universal-Radio.com: Part Kenwood TH-D72 with vehicle antenna
$650
Tracking software APRSPoint.com $77
Equipment and costs.A typical flight system.
BERN
HARD
BEC
K-W
INCH
ATZ
The Science Teacher32
Near-Space Science
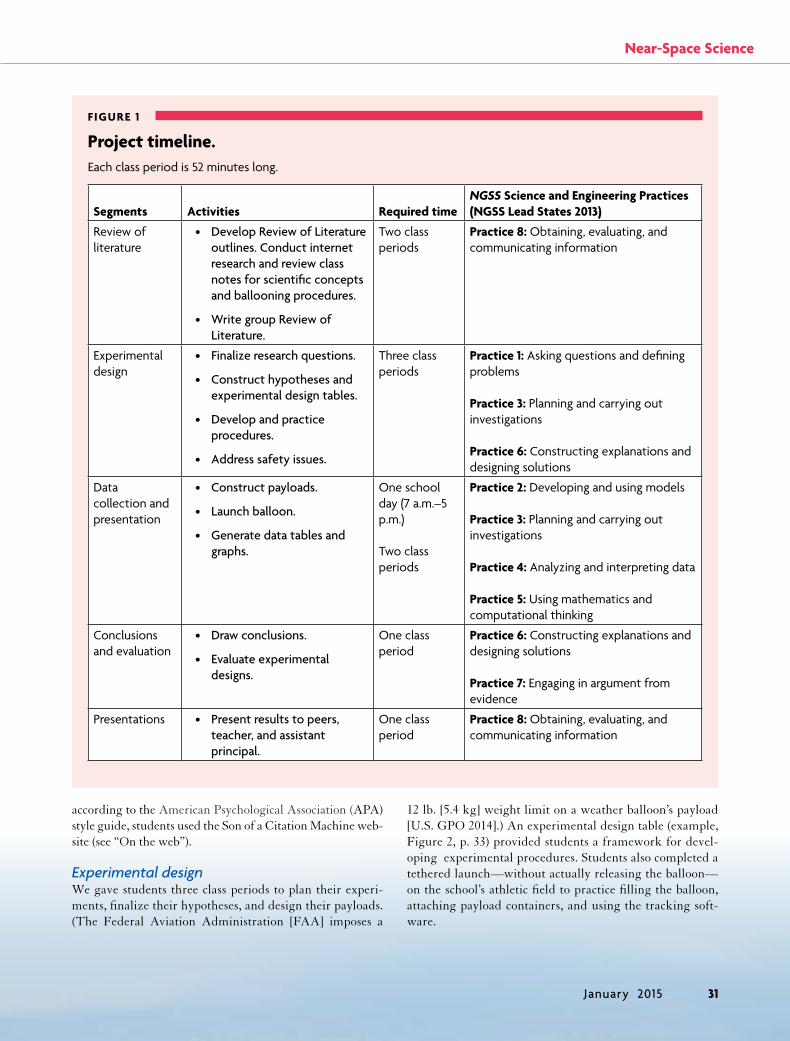
FIGURE 2
Experimental design table.Students conducting the sound-intensity experiment created this table.
Question: Does sound intensity in Earth’s atmosphere change with altitude?
Hypothesis: Sound waves are mechanical waves that require a medium (e.g., air). As the density of the medium decreases, the sound waves will not be able to propagate as well and the sound intensity will decrease.
Independent variable: Altitude (A). The altitude is expected to range from 200 m at launch and landing to approximately 30,000 m at burst.
Dependent variable: Sound intensity (I) (sound energy per unit area and time).
Controlled variables: Distance between sound-level meter and MP3 player; level of the tone; volume of the box.
Control tests: Measure sound intensity in a vacuum jar.
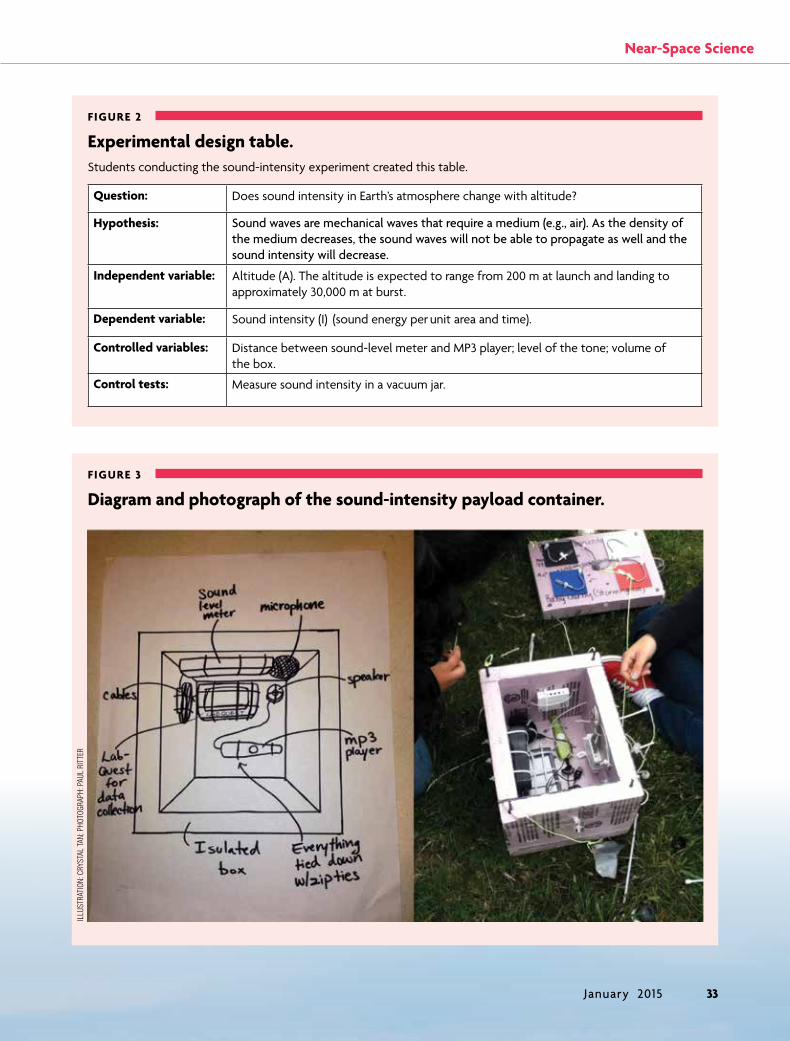
FIGURE 3
Diagram and photograph of the sound-intensity payload container.
ILLU
STRA
TION
: CRY
STAL
TAN;
PHO
TOGR
APH:
PAU
L RI
TTER
January 2015 33
Collecting and presenting dataOn launch day, before leaving for the launch site on a school bus, students predicted the approximate flight path of the balloon with an online flight predictor (see “On the web”). Upon arrival at the launch site (another athletic field), each team had to complete its own preflight procedures (Figure 3, p. 33, and Figure 4), often coordinating with other teams that shared their payload containers. Students set up equip-ment to track the balloons’ flight pattern and landing. They
Evaluation During the final two class periods of the project, students evaluated their hypotheses, proposed alternative explana-tions, and revised their experimental designs.
For example, the sound-level team concluded that the data supported their hypothesis that the low-pressure, low-density air in the upper atmosphere would not transport sound energy as efficiently as the denser air on the ground. Their revised experimental design included several tones, in-stead of just one, to determine if the decrease in sound level depended on frequency.
Presentations At the end of the project the students were excited to pres-ent their near-space experiments to their peers, teacher, and assistant principal. Each team prepared a 15-minute Power-Point presentation, which included a brief background sum-mary, the research question, hypothesis, variables and control table, procedure with a diagram, data presentation, conclu-sion, and evaluation.
FIGURE 4
Preparing experiments for flight.
NINA
HIK
E
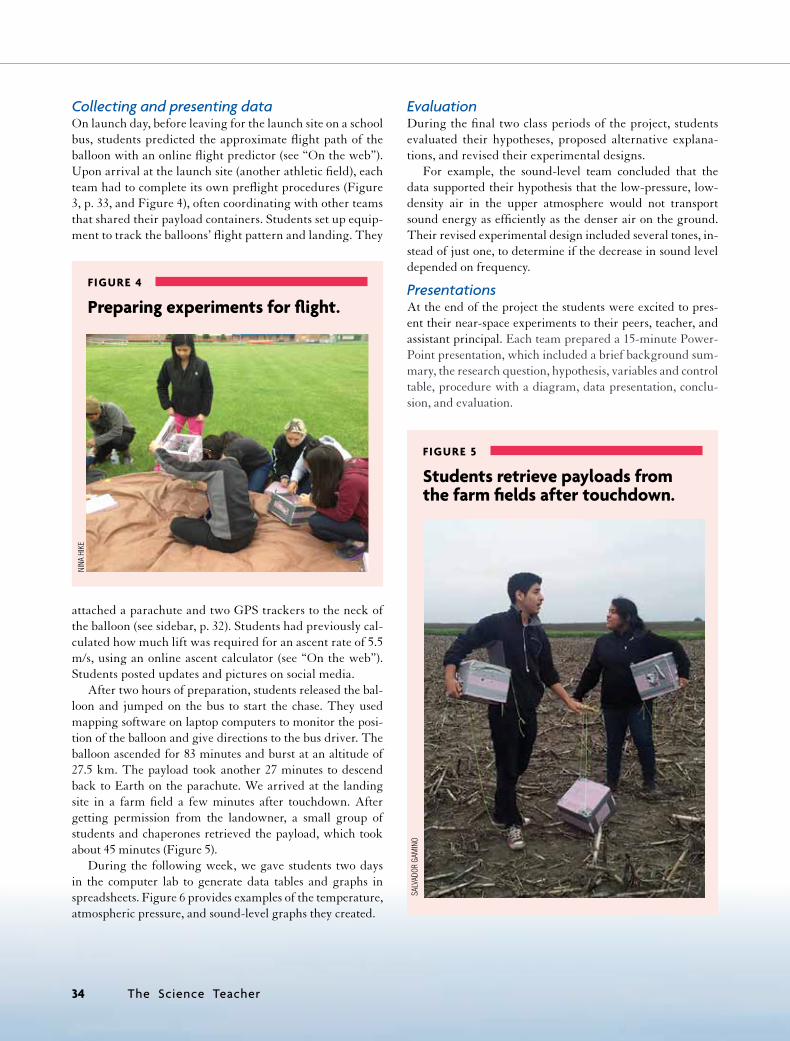
attached a parachute and two GPS trackers to the neck of the balloon (see sidebar, p. 32). Students had previously cal-culated how much lift was required for an ascent rate of 5.5 m/s, using an online ascent calculator (see “On the web”). Students posted updates and pictures on social media.
After two hours of preparation, students released the bal-loon and jumped on the bus to start the chase. They used mapping software on laptop computers to monitor the posi-tion of the balloon and give directions to the bus driver. The balloon ascended for 83 minutes and burst at an altitude of 27.5 km. The payload took another 27 minutes to descend back to Earth on the parachute. We arrived at the landing site in a farm field a few minutes after touchdown. After getting permission from the landowner, a small group of students and chaperones retrieved the payload, which took about 45 minutes (Figure 5).
During the following week, we gave students two days in the computer lab to generate data tables and graphs in spreadsheets. Figure 6 provides examples of the temperature, atmospheric pressure, and sound-level graphs they created.
FIGURE 5
Students retrieve payloads from the farm fields after touchdown.
SALV
ADOR
GAM
INO
The Science Teacher34

Near-Space Science
AssessmentWe used the science writing heuristic (Hand and Keys 1999) as a framework for student investigations through-out the balloon project (see “On the web”). The SWH supports the Common Core State Standards’ emphasis on literacy practices across content areas (NGAC and CC-SSO 2010) by encouraging students to integrate group discussions, writing, and reflection with their lab work. It’s also designed to help students take ownership of their lab work by asking them to formulate their own research questions, develop investigations to address those ques-tions, and make claims based on the evidence they collect. The balloon investigations were conducive to the SWH framework because they are inherently open-ended. We used a modified version of the SWH grading rubric for instructors (Burke, Greenbowe, and Hand 2006) to eval-uate students’ lab reports.
Student experiments There are many possibilities for balloon-based student re-search not just in chemistry but in biology, physics, and astronomy as well. Our balloon flight included 12 experi-ments, and students conducted all of them with standard Vernier probeware (although sensors from other vendors, such as Pasco, could be used instead) and other equipment and supplies readily available to many high school science teachers. Here are examples of other potential research questions students might explore with this project:
◆◆ How does altitude affect sky brightness?
◆◆ How does temperature affect the speed of sound?
◆◆ How do cosmic rays affect mutation rates of yeast?
◆◆ How do cosmic rays affect radish seeds?
◆◆ How do different liquids cool and freeze when exposed to the low temperature in the upper atmosphere?
◆◆ How does the ozone layer affect ultraviolet light intensity?
◆◆ Does the ideal gas law hold true in Earth’s upper atmosphere?
◆◆ How does exposure to the conditions in the upper atmosphere affect cricket chirps and daphnia swim patterns?
ConclusionHAB is an exciting way to engage students in a real-world science and engineering project. You may be intrigued by HAB but worry that it might be impractical for your own classroom. Ballooning may seem daunting at first, but
FIGURE 6
Temperature, pressure, and sound level measured during the flight.The temperature (A) during ascent (blue line) and descent (red line) was measured outside of the payload containers with a temperature sensor. Atmospheric pressure (B) was measured with the sensor built into a GPS tracker. Sound level (C) was measured with a Vernier sound level meter connected to a LabQuest 2 interface.
A
B
C
January 2015 35
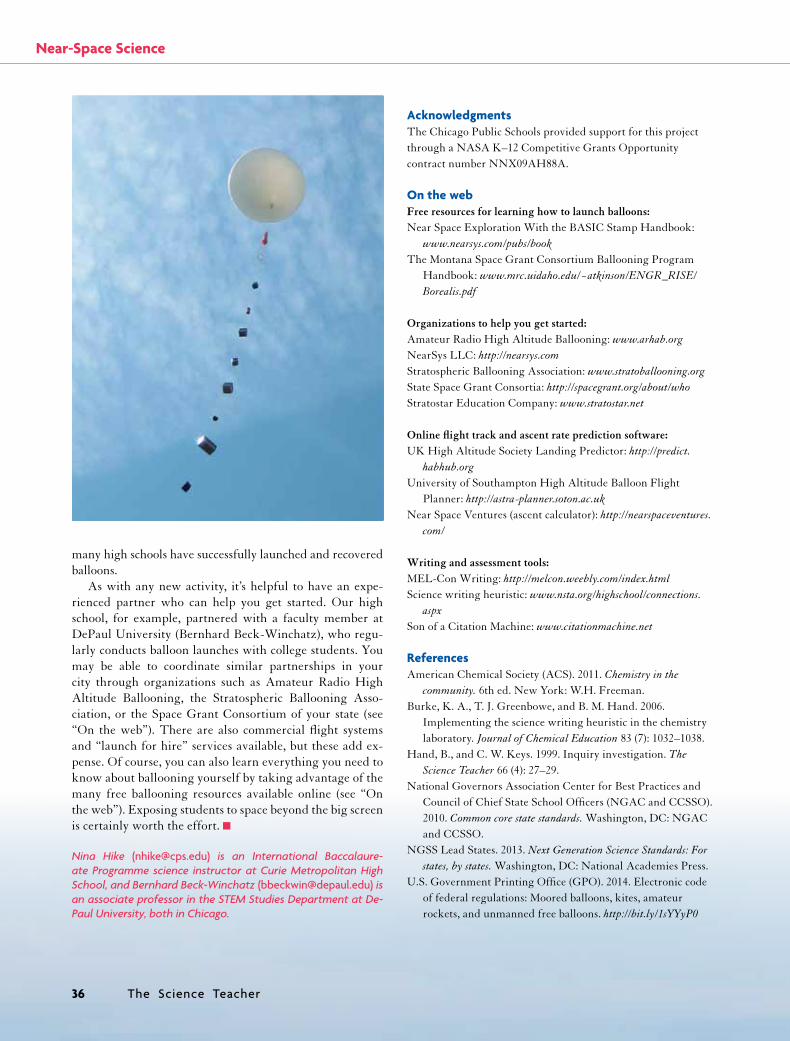
many high schools have successfully launched and recovered balloons.
As with any new activity, it’s helpful to have an expe-rienced partner who can help you get started. Our high school, for example, partnered with a faculty member at DePaul University (Bernhard Beck-Winchatz), who regu-larly conducts balloon launches with college students. You may be able to coordinate similar partnerships in your city through organizations such as Amateur Radio High Altitude Ballooning, the Stratospheric Ballooning Asso-ciation, or the Space Grant Consortium of your state (see “On the web”). There are also commercial flight systems and “launch for hire” services available, but these add ex-pense. Of course, you can also learn everything you need to know about ballooning yourself by taking advantage of the many free ballooning resources available online (see “On the web”). Exposing students to space beyond the big screen is certainly worth the effort. ■
Nina Hike ([email protected]) is an International Baccalaure-ate Programme science instructor at Curie Metropolitan High School, and Bernhard Beck-Winchatz ([email protected]) is an associate professor in the STEM Studies Department at De-Paul University, both in Chicago.
AcknowledgmentsThe Chicago Public Schools provided support for this project through a NASA K–12 Competitive Grants Opportunity contract number NNX09AH88A.
On the webFree resources for learning how to launch balloons:Near Space Exploration With the BASIC Stamp Handbook:
www.nearsys.com/pubs/bookThe Montana Space Grant Consortium Ballooning Program
Handbook: www.mrc.uidaho.edu/~atkinson/ENGR_RISE/Borealis.pdf
Organizations to help you get started:Amateur Radio High Altitude Ballooning: www.arhab.orgNearSys LLC: http://nearsys.com Stratospheric Ballooning Association: www.stratoballooning.orgState Space Grant Consortia: http://spacegrant.org/about/whoStratostar Education Company: www.stratostar.net
Online flight track and ascent rate prediction software:UK High Altitude Society Landing Predictor: http://predict.
habhub.orgUniversity of Southampton High Altitude Balloon Flight
Planner: http://astra-planner.soton.ac.ukNear Space Ventures (ascent calculator): http://nearspaceventures.
com/
Writing and assessment tools:MEL-Con Writing: http://melcon.weebly.com/index.htmlScience writing heuristic: www.nsta.org/highschool/connections.
aspxSon of a Citation Machine: www.citationmachine.net
ReferencesAmerican Chemical Society (ACS). 2011. Chemistry in the
community. 6th ed. New York: W.H. Freeman.Burke, K. A., T. J. Greenbowe, and B. M. Hand. 2006.
Implementing the science writing heuristic in the chemistry laboratory. Journal of Chemical Education 83 (7): 1032–1038.
Hand, B., and C. W. Keys. 1999. Inquiry investigation. The Science Teacher 66 (4): 27–29.
National Governors Association Center for Best Practices and Council of Chief State School Officers (NGAC and CCSSO). 2010. Common core state standards. Washington, DC: NGAC and CCSSO.
NGSS Lead States. 2013. Next Generation Science Standards: For states, by states. Washington, DC: National Academies Press.
U.S. Government Printing Office (GPO). 2014. Electronic code of federal regulations: Moored balloons, kites, amateur rockets, and unmanned free balloons. http://bit.ly/1sYYyP0
Near-Space Science
The Science Teacher36

Teaching the science of energy, force, and motion through an engineering design challenge
Christine Schnittka and Larry Richards
Sun POWERED
by the
March 2016 25

Solar energy is clean, free, and abundant worldwide. The challenge, however, is to convert it to useful forms that can reduce our reliance on fossil fuels. This article pres-
ents an activity for physical science classes in which students learn firsthand how solar energy can be used to produce elec-tricity specifically for transportation. The activity introduces students to solar-powered mass transit currently in use and then challenges them to create their own vehicle (Figure 1). When students create a successful solar-powered mass trans-portation vehicle, they use the engineering-design process to create designs that solve problems and carry out relevant sci-entific investigations (see box, p. 32, for connections to the Next Generation Science Standards).
Engaging studentsDirectly or indirectly, people and products are transported by fossil fuels that are mined or drilled from the Earth, then burned with many environmental consequences; there is a
growing need for cleaner sources of energy. After describing this problem, give students a miniature toy solar car, a Match-box car, and a shop light (Figure 2; see “On the web” for sources for materials and parts). Explain that energy from the light transforms into motion for the solar car. Share images of so-lar transportation—of say, the Solar Impulse or the Türanor (see sidebar, p. 29)—or let students browse the internet for images, videos, and news stories related to solar transportation. Plan on one class period for the pretest on energy and motion (included in the complete curriculum; see “On the web”); learning about solar trains, planes, boats, and automobiles; and the investiga-tion with the toy solar and Matchbox cars described above.
Testing the componentsNext, students will prepare to design their own solar vehicles by devoting a few class periods to testing the various design components: the solar cells, motors, gears, and wheels.
Solar cellsDistribute the solar panels for students to examine. Ideally, one panel should be rated for high voltage and low current (5.0 V and 100 mA) and another for low voltage and high current (1.0 V and 415 mA). Have students compare them by mea-suring surface area, counting the number of cells within the panels, and observing the wires beneath the plastic surface. Challenge them to use a light source and multimeters to de-termine how much energy the solar cells produce (Figure 3). (See “On the web” for a video on how to use a multimeter.) Have students use the multimeters’ direct current (DC) set-tings to measure voltage and current. Many will be familiar with the former but not the latter. Both are important for un-derstanding how much energy a solar cell can produce. Have students test the solar cells in series and in parallel to see which configuration produces more power over time. The overhead
FIGURE 1
Testing a solar car.
ALL
PHOT
OGRA
PHS
BY C
HRIS
TINE
SCH
NITT
KA
FIGURE 2
Toy car and miniature solar car.
FIGURE 3
Testing a solar cell that produces .528 volts.
The Science Teacher26

Powered by the Sun
light in the classroom might be sufficient as a power source, but we find it better to conduct this activity outside in the sunshine or with shop lights in the classroom. (Safety note: When using shop lights, 150-watt incandescent bulbs are ideal but get very hot. Mount the shop lights so that students do not have to touch them and remind students to keep all hands and solar panels at least 50 cm away.) After testing, students might create a data chart similar to the one in Figure 4.
Electric motorsDistribute inexpensive electric motors typically used for hobbies and robotics. Ideally, one should be rated for high speed and low torque and another for lower speed and high-er torque. We mount ours in Lego pieces glued together to make them easier to use (Figure 5) and mount special Lego-type pieces on the shafts as well (Figure 6). These are made especially for the 2 mm- or 3 mm-diameter motor shafts that we purchase from Pololu (see “On the web”).
Torque can be defined as a twisting force. A higher-torque motor can move a heavier load than one with lower torque. When students connect a motor to a solar cell under light, they can compare how much twisting force each motor produces.
Our students compare motors by seeing how much weight each can lift in a bucket on a string. To do this, place the motor on the edge of a tabletop and attach a Lego wheel to the connector on the motor shaft so it can wind up a string (Figure 6). Secure the string to the wheel with a small piece of tape. Attach a cup to the string so the motor can lift different amounts of weight until students find a load it cannot lift. There should be a marked dif-ference between the output force, or torque, of the
two motors, and deciding between them is an important de-sign decision.
GearsNext, ask students if they can think of a way to enable the motors to pull more weight. If we need solar-powered ve-hicles that can carry cantaloupes across the country, for
FIGURE 4
Data collected from solar cells.
Solar cellVoltage (volts)
Current (amperes)
Energy per second (joules/second)
Power (watts)
A
B
A+B in series
A+B in parallel
FIGURE 5
Two different motors in Lego motor mounts.
FIGURE 6
Measuring torque: Motor with spool on its shaft lifting a load.
March 2016 27

example, then we need electric motors that can exert a lot of torque. Here, someone is bound to suggest gears, which are great for multiplying the output force of a motor (Figure 7).
To test the gears, have students put a small one on the motor shaft and mesh it with a large one on a shaft that will lift a bucket. We use Lego parts and pieces for this, but if you have other parts available, you can make just about anything work. Have students test this configuration and then switch the gears so that the large gear is on the motor shaft and the small one is twisting up the bucket. Which one can lift more weight? Students will find that when speed is sacrificed, force is increased. Both configurations will do the same amount of work, but when the smaller gear is on the motor, the larger gear turns more slowly. Since work = force × distance, and the output distance is decreased, the output force is increased. Students can compute the gear ratio and compare it to the resulting increase in force. We use the GearSketch website to model gear pairs (see “On the web”).
FIGURE 7
Multiplying force: Motor with small gear meshed with large gear.
WheelsStudents might not think that wheels matter, but they do. Friction is the force that is required between the wheel and the ground for motion to happen; it’s the force required be-tween your foot and the ground for you to walk! Different wheel surfaces will produce higher or lower friction forces. Think about a car with wax paper wheels or one driving on an icy road—the car will spin out and not pull much force behind it. Demonstrate this with spring pull-back cars, which can be found at your local toy store (Figure 8). Cover the wheels in different materials, such as sandpaper or wax paper, and show students the effect friction has on motion.
Then, pass out a variety of wheels for testing. Students can use any method to test the wheels’ friction, but we find it easiest to connect two wheels to a shaft so that they do not spin, and to hang a string with a cup to see how much weight it takes to overcome static friction and slide the wheels (Figure 9). Discuss how vehicle tires need friction.
FIGURE 8
Comparing friction: Pull-back cars with different tire surfaces.
The Science Teacher28
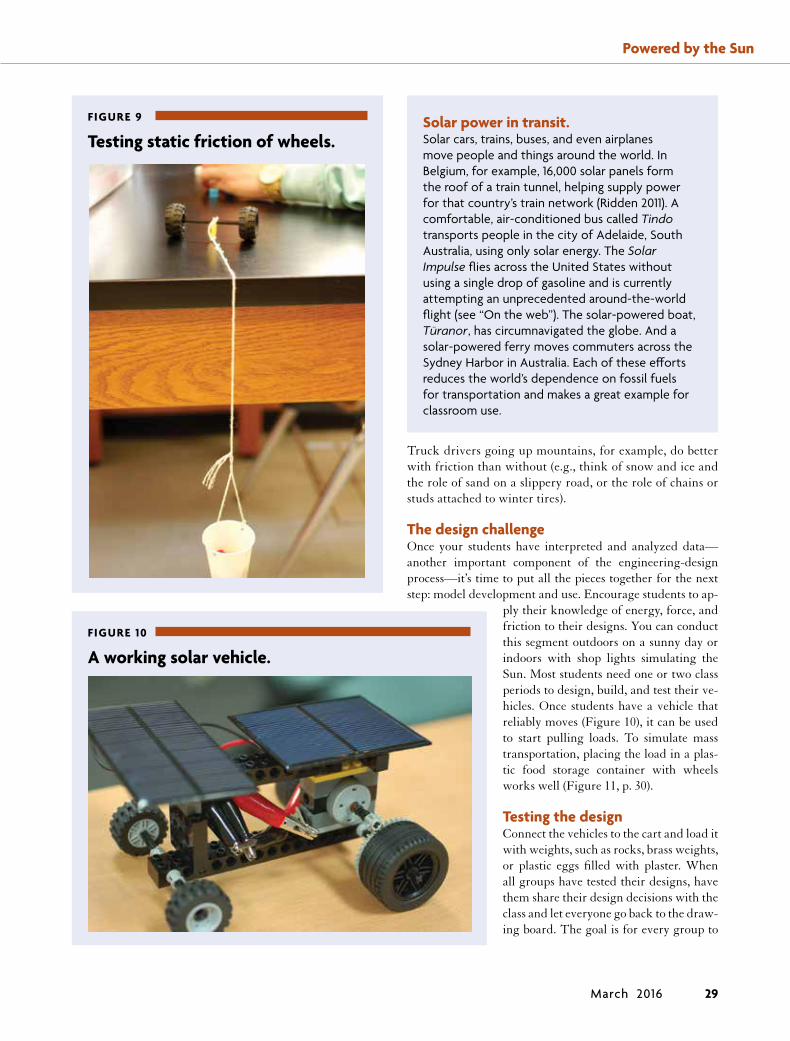
Powered by the Sun
Solar power in transit.Solar cars, trains, buses, and even airplanes move people and things around the world. In Belgium, for example, 16,000 solar panels form the roof of a train tunnel, helping supply power for that country’s train network (Ridden 2011). A comfortable, air-conditioned bus called Tindo transports people in the city of Adelaide, South Australia, using only solar energy. The Solar Impulse flies across the United States without using a single drop of gasoline and is currently attempting an unprecedented around-the-world flight (see “On the web”). The solar-powered boat, Türanor, has circumnavigated the globe. And a solar-powered ferry moves commuters across the Sydney Harbor in Australia. Each of these efforts reduces the world’s dependence on fossil fuels for transportation and makes a great example for classroom use.
Truck drivers going up mountains, for example, do better with friction than without (e.g., think of snow and ice and the role of sand on a slippery road, or the role of chains or studs attached to winter tires).
The design challengeOnce your students have interpreted and analyzed data—another important component of the engineering-design process—it’s time to put all the pieces together for the next step: model development and use. Encourage students to ap-
ply their knowledge of energy, force, and friction to their designs. You can conduct this segment outdoors on a sunny day or indoors with shop lights simulating the Sun. Most students need one or two class periods to design, build, and test their ve-hicles. Once students have a vehicle that reliably moves (Figure 10), it can be used to start pulling loads. To simulate mass transportation, placing the load in a plas-tic food storage container with wheels works well (Figure 11, p. 30).
Testing the designConnect the vehicles to the cart and load it with weights, such as rocks, brass weights, or plastic eggs filled with plaster. When all groups have tested their designs, have them share their design decisions with the class and let everyone go back to the draw-ing board. The goal is for every group to
FIGURE 9
Testing static friction of wheels.
FIGURE 10
A working solar vehicle.
March 2016 29
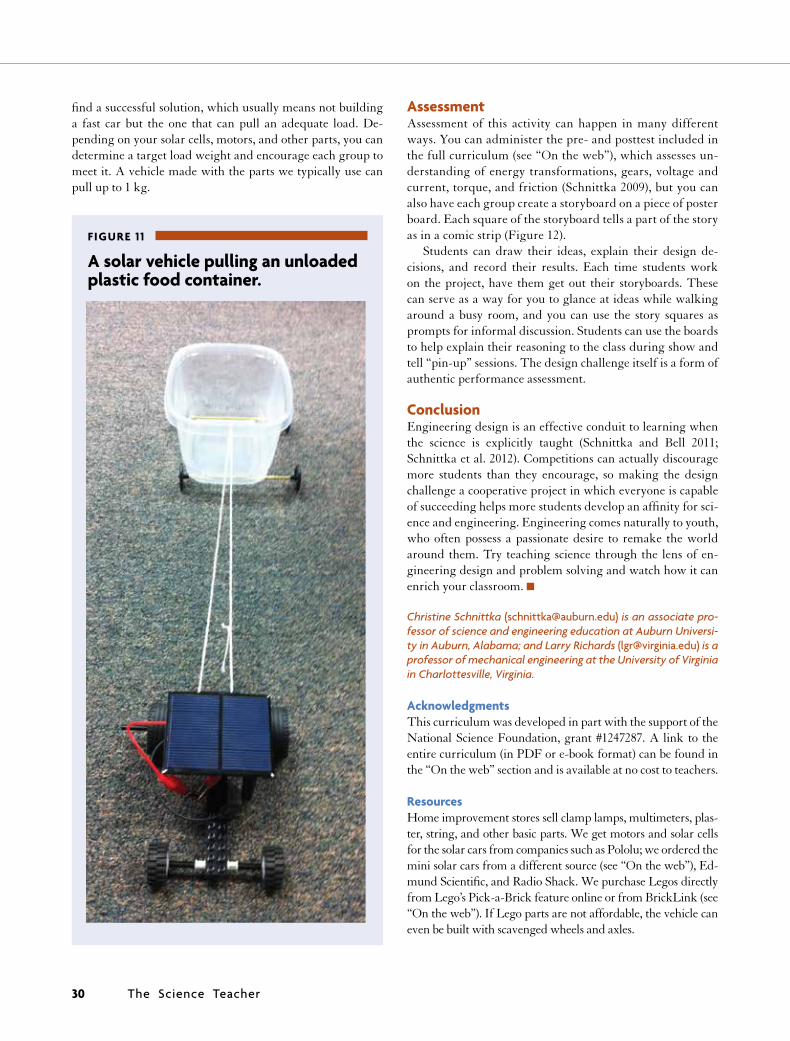
find a successful solution, which usually means not building a fast car but the one that can pull an adequate load. De-pending on your solar cells, motors, and other parts, you can determine a target load weight and encourage each group to meet it. A vehicle made with the parts we typically use can pull up to 1 kg.
FIGURE 1 1
A solar vehicle pulling an unloaded plastic food container.
AssessmentAssessment of this activity can happen in many different ways. You can administer the pre- and posttest included in the full curriculum (see “On the web”), which assesses un-derstanding of energy transformations, gears, voltage and current, torque, and friction (Schnittka 2009), but you can also have each group create a storyboard on a piece of poster board. Each square of the storyboard tells a part of the story as in a comic strip (Figure 12).
Students can draw their ideas, explain their design de-cisions, and record their results. Each time students work on the project, have them get out their storyboards. These can serve as a way for you to glance at ideas while walking around a busy room, and you can use the story squares as prompts for informal discussion. Students can use the boards to help explain their reasoning to the class during show and tell “pin-up” sessions. The design challenge itself is a form of authentic performance assessment.
Conclusion Engineering design is an effective conduit to learning when the science is explicitly taught (Schnittka and Bell 2011; Schnittka et al. 2012). Competitions can actually discourage more students than they encourage, so making the design challenge a cooperative project in which everyone is capable of succeeding helps more students develop an affinity for sci-ence and engineering. Engineering comes naturally to youth, who often possess a passionate desire to remake the world around them. Try teaching science through the lens of en-gineering design and problem solving and watch how it can enrich your classroom. ■
Christine Schnittka ([email protected]) is an associate pro-fessor of science and engineering education at Auburn Universi-ty in Auburn, Alabama; and Larry Richards ([email protected]) is a professor of mechanical engineering at the University of Virginia in Charlottesville, Virginia.
AcknowledgmentsThis curriculum was developed in part with the support of the National Science Foundation, grant #1247287. A link to the entire curriculum (in PDF or e-book format) can be found in the “On the web” section and is available at no cost to teachers.
ResourcesHome improvement stores sell clamp lamps, multimeters, plas-ter, string, and other basic parts. We get motors and solar cells for the solar cars from companies such as Pololu; we ordered the mini solar cars from a different source (see “On the web”), Ed-mund Scientific, and Radio Shack. We purchase Legos directly from Lego’s Pick-a-Brick feature online or from BrickLink (see “On the web”). If Lego parts are not affordable, the vehicle can even be built with scavenged wheels and axles.
The Science Teacher30

Powered by the Sun
FIGURE 12
Sample storyboard.
On the webBrickLink: www.bricklink.comComplete curriculum: http://bit.ly/1OHkSYSGearSketch: www.gearsket.chMini solar car source: http://bit.ly/1RmfZDpMultimeter video: http://bit.ly/1RDfRl6Pololu: www.pololu.comSolar cells: www.futurlec.com/Solar_Cell.shtml. See parts
SZGD6060-PET and SZGD10040-10Solar Impulse: http://bit.ly/1QNWvd0
ReferencesNational Research Council (NRC). 2012. A framework for K–12
science education: Practices, crosscutting concepts, and core ideas. Washington, DC: National Academies Press.
NGSS Lead States. 2013. Next Generation Science Standards: For states, by states. Washington, DC: National Academies Press.
Ridden, P. Gizmag. 2011. Infrabel and Enfinity Announce Completion of 16,000-Panel Solar Train Tunnel. June 10. http://bit.ly/1Svq8yE
Schnittka, C.G. 2009. Save the sea birds engineering teaching kit: An introduction to solar energy, force, and motion. www.auburn.edu/~cgs0013/ETK/SaveTheSeaBirdsETK.pdf
Schnittka, C.G., and R.L. Bell. 2011. Engineering design and conceptual change in the middle school science classroom. International Journal of Science Education 33 (13): 1861–1887.
Schnittka, C.G., C. Brandt, B. Jones, and M.A. Evans. 2012. Informal engineering education after school: A studio model for middle school girls and boys. Advances in Engineering Education 3 (2): 1–31. http://bit.ly/1Z1vIZg
March 2016 31
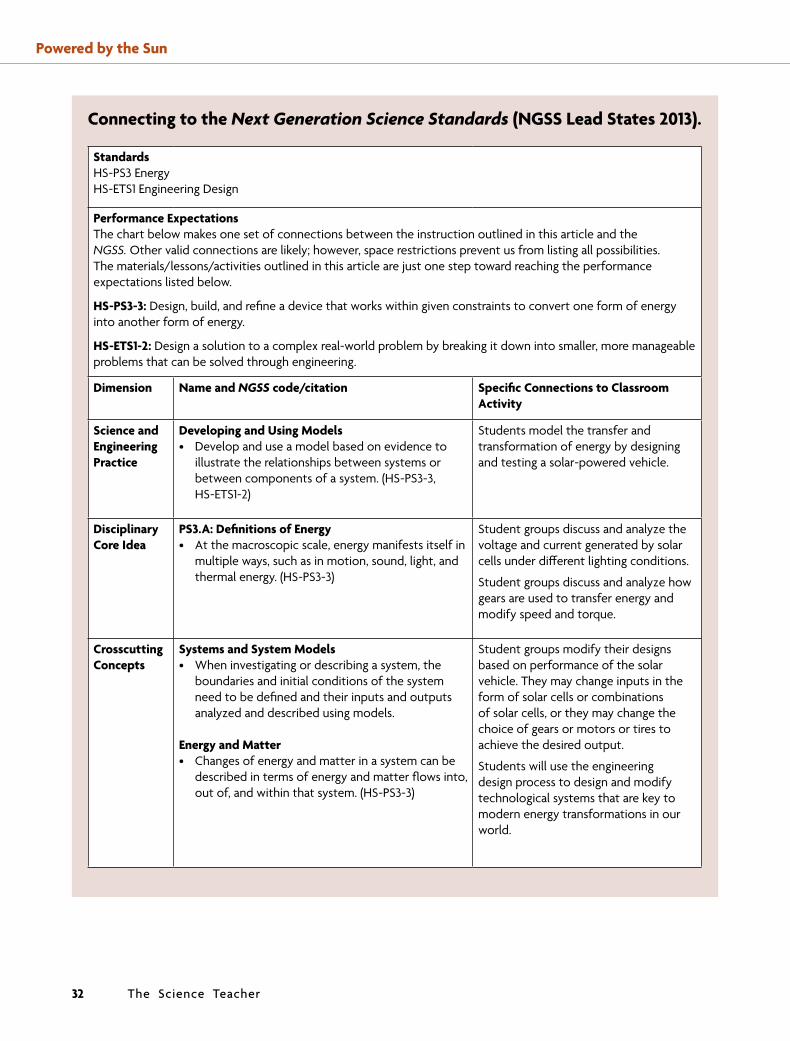
Powered by the Sun
Connecting to the Next Generation Science Standards (NGSS Lead States 2013).
StandardsHS-PS3 EnergyHS-ETS1 Engineering Design
Performance ExpectationsThe chart below makes one set of connections between the instruction outlined in this article and the NGSS. Other valid connections are likely; however, space restrictions prevent us from listing all possibilities. The materials/lessons/activities outlined in this article are just one step toward reaching the performance expectations listed below.
HS-PS3-3: Design, build, and refine a device that works within given constraints to convert one form of energy into another form of energy.
HS-ETS1-2: Design a solution to a complex real-world problem by breaking it down into smaller, more manageable problems that can be solved through engineering.
Dimension Name and NGSS code/citation Specific Connections to Classroom Activity
Science and Engineering Practice
Developing and Using Models• Develop and use a model based on evidence to
illustrate the relationships between systems or between components of a system. (HS-PS3-3, HS-ETS1-2)
Students model the transfer and transformation of energy by designing and testing a solar-powered vehicle.
Disciplinary Core Idea
PS3.A: Definitions of Energy• At the macroscopic scale, energy manifests itself in
multiple ways, such as in motion, sound, light, and thermal energy. (HS-PS3-3)
Student groups discuss and analyze the voltage and current generated by solar cells under different lighting conditions.
Student groups discuss and analyze how gears are used to transfer energy and modify speed and torque.
Crosscutting Concepts
Systems and System Models• When investigating or describing a system, the
boundaries and initial conditions of the system need to be defined and their inputs and outputs analyzed and described using models.
Energy and Matter• Changes of energy and matter in a system can be
described in terms of energy and matter flows into, out of, and within that system. (HS-PS3-3)
Student groups modify their designs based on performance of the solar vehicle. They may change inputs in the form of solar cells or combinations of solar cells, or they may change the choice of gears or motors or tires to achieve the desired output.
Students will use the engineering design process to design and modify technological systems that are key to modern energy transformations in our world.
The Science Teacher32


