+ All Categories
Home > Documents > A beauty and a beast? – Effects of predation by the

A beauty and a beast? – Effects of predation by the

Date post: 04-Feb-2022
Category:
Upload: others
View: 2 times
Download: 0 times
Share this document with a friend
61
Effects of predation by the introduced grouper roi (Cephalopholis argus) on populations of native reef fishes in Hawaii Jan Dierking University of Hawaii at Manoa Department of Zoology A beauty and a beast? – Max Wilkie
Transcript

Effects of predation by the introduced grouper roi (Cephalopholis argus) on

populations of native reef fishes in Hawaii

Jan DierkingUniversity of Hawaii at Manoa Department of Zoology

A beauty and a beast? –

Max Wilkie

Effects of predation by the introduced grouper roi (Cephalopholis argus) on

populations of native reef fishes in Hawaii

Outline

• Background

• Feeding biology of roi

• Ciguatera in roi in Hawaii

(Effects of ciguatera on roi fitness & growth)

Photo: Bill Walsh

Isolation:

Hawaii

few species immigrate successfullystrong natural selection pressure; evolution of new species

(Gosline 1968)

Hawaii

Nearshore marine fish communities24.3% rate of endemism highest in the world

Limited presence of many families of marine fishes common elsewhere in the Pacific, including the grouper family (Serranidae).

Isolation:few species immigrate successfullystrong natural selection pressure; evolution of new species

• Family Serranidae, subfamily Epinephelinae (Groupers)

RoiPeacock grouper Cephalopholis argus

• Family Serranidae, subfamily Epinephelinae (Groupers)

• 159 species

• most important predators of the coral reef system

Heemstra & Randall 1993

RoiPeacock grouper Cephalopholis argus

• slow growth, late reproduction, long life-span, low metabolic rate

• valuable food fish

• overfished (~50% of grouper species threatened)

• Family Serranidae, subfamily Epinephelinae (Groupers)

• Predatory reef fish

• Valuable in many locations, e.g., Guam, Palau, Hong Kong

RoiPeacock grouper Cephalopholis argus

• In decline in some locations

Froese & Pauly 2006

Distribution

How did it get here?

Roi alien species in Hawaii

• Proposed to introduce fish species valued as food or game fishes elsewhere to Hawaii to enhance fisheries

Back to the 1950s

Hawaii Division of Fish & Game

• Noted in its 1956 Annual report:“…fishes in the shallow inshore areas in Hawaii are on a declining trend…”.

Species introduction program: Groupers & Snappers

1956 & 1961:2385 individuals

roi rare till the 1980s

Introduction of roi

Juveniles sighted by the mid 1960s.

15-fold increase since then

Fishwatcher

Surpasses biomass of allother reef fish predators combined.

• 23% increase 1999 - 2005

Situation today:

>Dive Asia

0

20

40

60

80

100

1998 1999 2000 2001 2002 2003 2004 2005 2006

Year

D (n

/ha)

HDAR unpublished data

Situation today:

Abundant roi, functional roi fishery?

Ciguatera fish poisoning: “neurological disease in humans resulting from the ingestion of ciguatoxic fish” (Hokama & Ebesu 2001)

Carnivores Herbivore (Ciguatoxin Dinoflagellate)

The ciguatera problem

Oceanit

• Gambierdiscus toxicus (Yasumoto et al. 1980)

• Ciguatoxin isolated in 1967 (Scheuer et al.)

• ~ 50,000 cases per year

• Public health & economic factor:

Blueventures.org

Orhan Aytuer

The ciguatera problem

• Food chain concept of ciguatera (Randall 1958)

Bonnat~30 μm

Fishes associated with ciguatera fish poisoning in Hawai’i (1996-2000):

Common Name IncidentsRoi 20Jack 20Surgeonfish (var.) 18Surgeonfish (Kole) 16Goatfish 10Snapper 9Barracuda 4Moray Eel 4Mullet 4Other 20Total 126

(DOH Communicable Disease Report 2001)

Rarely caught by commercialand recreational fishermen

Bad reputation

Roi in Hawaii and Ciguatera

Annual sales of roi average:~ $1,000/year

(DAR Commercial Marine Landings reports)

No functional fishery!

Dierking

Hawaii Skindiver Magazine

Kona coast divers

The perception of the people

“Roi is a ferocious predator & harmsnative reef fishes!”

“Don’t eat roi, it’s ciguatoxic!”

“Scapegoat” for various problems

Data on toxicity, feeding, not available

Prevents fishery for roi

My Project

2. Feeding biology

1. Ciguatera

Secondary • Feasibility of a roi fishery

• Roi impact on native species

• Is roi as toxic as perceived by reef users?

• Are there predictable patterns in toxicity?

• What does roi feed on in Hawaii?

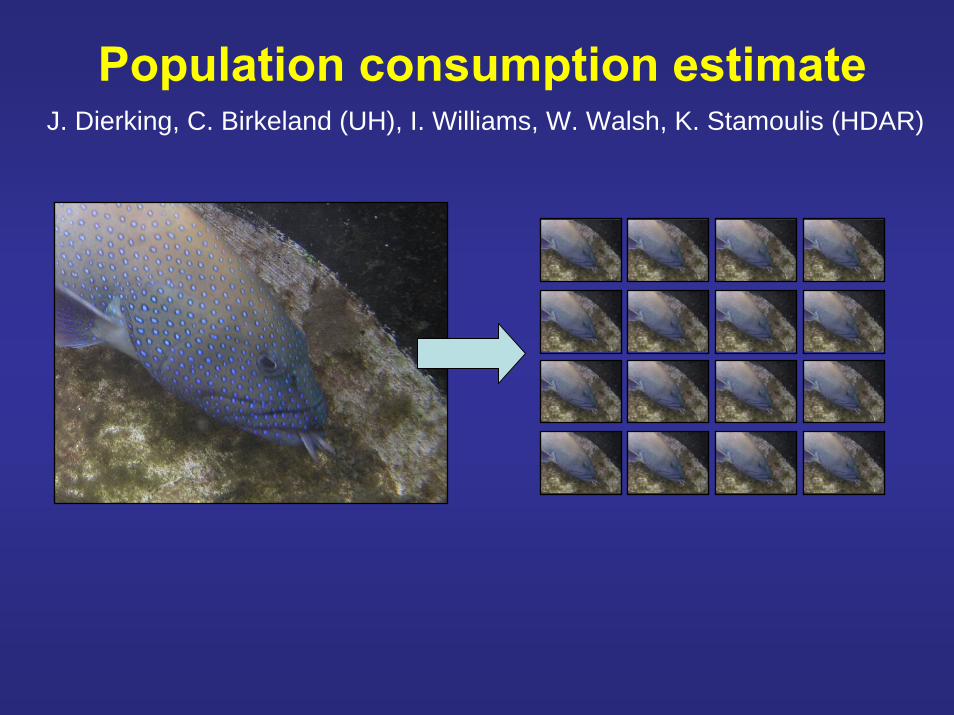
• How much prey is consumed by roi populations in Hawaii?

Roi - A beauty and a beast?!

a. Geographic patterns

2. Are there predictable patterns in toxicity?

b. Correlation of roi size & toxicity

Ciguatera

• Republic of Kiribati: Fish on certain reefs are commonly ciguatoxic,fish from all other reefs are predictably safe

• Barracuda in Florida: high prevalence of toxic fish at all analyzed sites(De Sylva 1994)

vs.(Lewis 1992)

1. Is roi as toxic as perceived by reef users?

a. Geographic patterns

b. Correlation of roi size & toxicity

Ciguatera

1. Is roi as toxic as perceived by reef users?

2. Are there predictable patterns in toxicity?

• Bioaccumulation hypothesis older, larger fish increase in toxicity(Lehane 1999)

SamplingSpearfishing, July/Aug. 2003, with a team of 5 divers

11 sites186 roi

6 sites106 roi

Method

• Semi-quantitative assay of ciguatoxin concentrationHokama’s (1998) Monoclonal Immunobead Assay (MIA)

• Toxicity of a fish expressed as score between 0 & 6 (steps of 0.5) (based on assays run on muscle tissue samples from head, body and tail)

MIA test scores

Interpretation Fish score range Score class Interpretation< 0.5 Negative Safe0.51 – 2 Marginal Safe2.01 – 4 Positive Unsafe (Incident possible)> 4 - 6 Strong positive Unsafe (Incident likely)

• Used by Hawaii DOH to test fish suspected in ciguatera outbreaks.

• Only commercially available test at this time.

Results

• The overall sample

• Geographic patterns in toxicity

• Correlation of roi size & toxicity

The overall sample +

18% of roi unsafe for consumption

Perspective:

Group/species Frequency Source

HI reef fishes overall 4%

Amberjack, Hawaii

Hokama et al. 1998

15% Kimura et al. 1982

Bottein Dechraoui et al. 2005Great barracuda, Florida 30%

Ciguatoxicity in other reef fishes

46%

36%

14%

4% Safe

Marginal

Positive

Strongpositive

n = 292

Negative

Geographic patterns in ciguatoxicity

*

*63%

29%

6%2%

36%

40%

18% 6%

negativemarginalpositivestrongly positive

Geographic patterns – Island level

Origin Mean score

Kona 1.55Oahu 0.73

Difference significant(t test using site means as sampling units, p<0.001)

Geographic patterns – smaller scales

*

*

Correlation of roi size & toxicity

Significant positive correlation of roi TL & toxicity(ANCOVA, proi SL = 0.03).

Variability in toxicity explained by TL very low (r2 = 1.5%).

0

1

2

3

4

5

6

12 17 22 27 32 37 42

Total length (cm)

MIA

sco

re

Ciguatera conclusions1. Is roi as toxic as perceived by reef users?

Yes, it is!

( Prevalence of toxic roi in the range of speciesin HI & elsewhere banned from markets.)

Ciguatera conclusions

• Geographic:

Large variability in toxicity within sites.

Oahu vs. Hawaii: prevalence of toxic roi much lower (8% vs. 24%).

• Correlation with roi size:Very weak positive correlation between fish length & toxicity.

2. Are there predictable patterns in toxicity?

Within island: no clear patterns between or within coastlines.

Only 2 of 17 sites without any unsafe roi in sample, & sites with low mean toxicity often with toxic outliers.

Understanding of what makes a roi toxic remains incomplete.

Ciguatera conclusions

Key management question:Feasibility of Roi fishery in Hawaii

Data suggest that a low-risk roi fishery is not feasible.

Feeding biology

• Evaluation of roi impact

Population consumption estimation

What does roi feed on in Hawaii?Stomach content analysis

Management issue:

2. How much prey is consumed by roi populations?

1.

Stomach content analysis

• Same sample of 292 roi from 17 sites.

Sampling

Results – diet composition

Squirrelfishes, 17.6%

Monacanthidae, 13.7%

Other (9 families total), 6.5%

Scaridae, 27.1%

Acanthuridae, 18.7%Priacanthidae, 9.3%

Chaetodontidae, 4.3%

Aulostomidae, 2.8%

Fish97.7%

Crustacean2.3% Empty

45%Full55%

Prey TL (cm)

Freq

uenc

y

181512963

25

20

15

10

5

0

Results: size composition

0.0

0.2

0.4

0.6

0.8

1.0

Prop

ortio

n of

sam

ple

0.0

0.2

0.4

0.6

0.8

1.0

Size range

0-5c

m5-

10cm

11-1

5cm

15-2

0cm

20-2

5cm

25cm

30cm

35cm

40cm

45cm

50cm

0.0

0.2

0.4

0.6

0.8

1.0

0-5c

m5-

10cm

11-1

5cm

15-2

0cm

20-2

5cm

25cm

30cm

35cm

40cm

45cm

50cm

Monacanthidae

Aulostomidae

Acanthuridae

Chaetodontidae

Scaridaen = 14

n = 6

n = 14

n = 11

n = 16

n = 6

Holocentridae

(Wild abundances from DAR monitoring data)

Size by family:

Surv

ivor

ship

(%)

Mortality patterns in reef fish

Grunt, Virgin Islands Squirrelfish, VI

(Hixon 1991)

Diet composition conclusions

Focus on reef fishes.

Feeding focused on small fish(Life history stages settler, recruit, early juvenile.)

Wide dietary breadth.

1. What is the focus of roi consumption in Hawaii?

Population consumption estimateJ. Dierking, C. Birkeland (UH), I. Williams, W. Walsh, K. Stamoulis (HDAR)

Background Previous applications:

• Freshwater fishes: e.g. Brown trout (Jensen et al 2006)

• Marine fishes: e.g.: • piscivores in NE Atlantic (Overholtz et al 2000)

• dolphinfish in E Pacific (Olson & Galvan-Magana 2000)

• Coral reef fishes: 1 (one) published study on consumption by populations of twogrouper species in Australia (Beukers-Stewart & Jones 2004)

Goals: • Quantitative impact estimation.

• Comparison with fisheries take.

• Adding to ecosystem level understanding of marine systems (e.g., component of Ecopath model).

• Comparison with prey fish stocks.

Analysis area

• Reef habitat, 10-17m depth

• Important collection area of the aquariumfish industry ( comparison).

• One of few areas with sufficient data availability.

• 167 km stretch of the Kona coast

Annual consumption = Total abundance * daily individual consumption * 365

Roi consumption - Method

Population size = Area * density

(Friedlander & DeMartini 2002)

(Bromley 1994)Component 1

Component 1 – roi population size

• From NOAA benthic habitat maps1. Habitat extent

Component 1 – roi population size

1. Habitat extent

• 23 sites• 4-6 times/year

• reef habitat, depth 10-17 m

2. Roi densities• From DAR fish monitoring data.

• From NOAA benthic habitat maps

Annual consumption = Total abundance * daily individual consumption * 365

Roi consumption - Method

Population size = Area * density

Daily consumption = 24h x gastric evacuation rate x mean stomach content

Component 2

(Bajkov 1935 modified by Eggers 1979)

Component 1

1. Gastric evacuation rateBased on:Tank experiments with live roi (serial-slaughter method, Elliott & Persson 1978).

Component 2: daily individual consumption

1. Gastric evacuation rateBased on:Tank experiments with live roi (serial-slaughter method, Elliott & Persson 1978).

Component 2: daily individual consumption

Exp.model: Y = 105.4*exp(-0.0515*x) adj. r2 = 0.985

Digestion interval (h)

0 10 20 30 40 50 60

Prop

ortio

n of

mea

l rem

aini

ng (%

)

0

20

40

60

80

100

n = 15

2. Average stomach fullness avg. content of 292 stomachs

Annual consumption = Roi abundance * daily individual consumption * 365

Population consumption – Results

N roi = Area * density

Daily consumption = 24h x gastric evacuation rate x mean stomach content

Component 1

Component 2

Annual consumption =

N roi =

Daily consumption = 0.0515*h-1 x 0.64% = 0.8% of own body W/day24h x

784 ha * 71.2 ind/ha = 56,292

56,292 roi * * 3650.8% of own body W/day * 600g =

(C.I. 41,500 – 71,085)

(C.I. 0.65% - 0.97%)

Population consumption – Results

Tuna, dolphinfish: 6% (e.g., Olson & Galvan-Magana 2002).

Annual consumption = 56,292 roi * * 3650.8% of own body W/day * 600g

Population consumption – Results

= 99 metric tons ≈ 8.2 million reef fish/year

Consumption = 12 metric tons/km2 (99 metric tons per 784 ha)

In other terms:

≈ 1 fish/m2 (8.2 million fish per 784 ha)

Discussion

Putting the numbers in perspective.Consumption versus …

2. Aquarium fish industry take.

3. Standing stock of reef fishes.

1. previous studies.

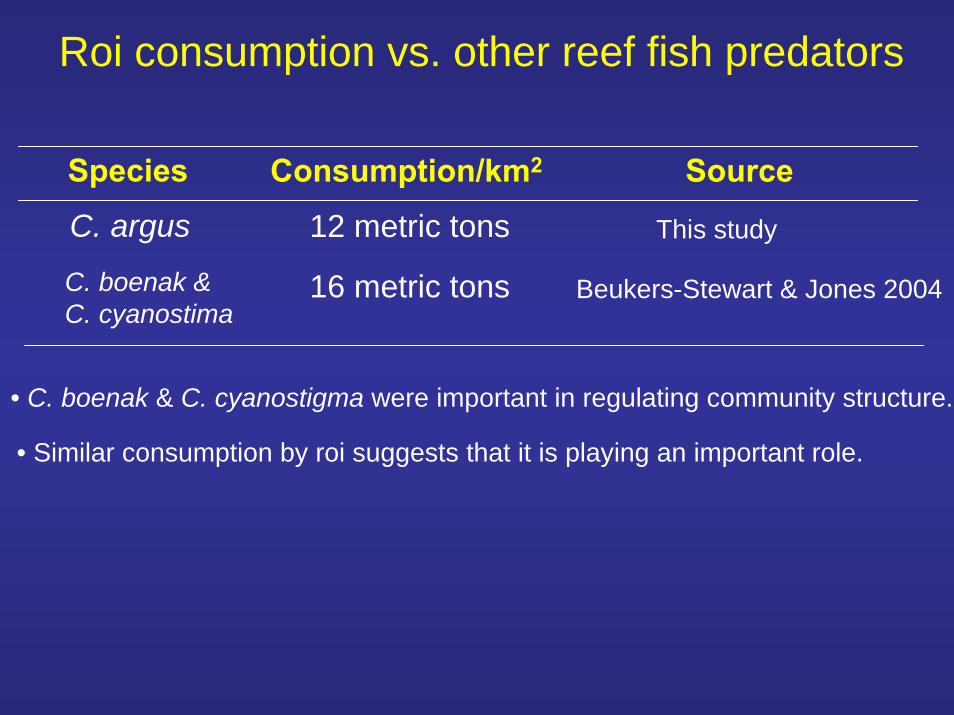
Roi consumption vs. other reef fish predators

C. argus 12 metric tons This study

16 metric tonsC. boenak & C. cyanostima

Beukers-Stewart & Jones 2004

Species Consumption/km2 Source

• C. boenak & C. cyanostigma were important in regulating community structure.

• Similar consumption by roi suggests that it is playing an important role.

Consumption vs. Aquarium fish industry take

Roi consumes substantial amounts of reef fish biomass vs. AFI take.

Feeding is focused on much smaller sizes than AFI take.

1.0 3.0 33%3.6 137%

roi AFI roi vs AFI

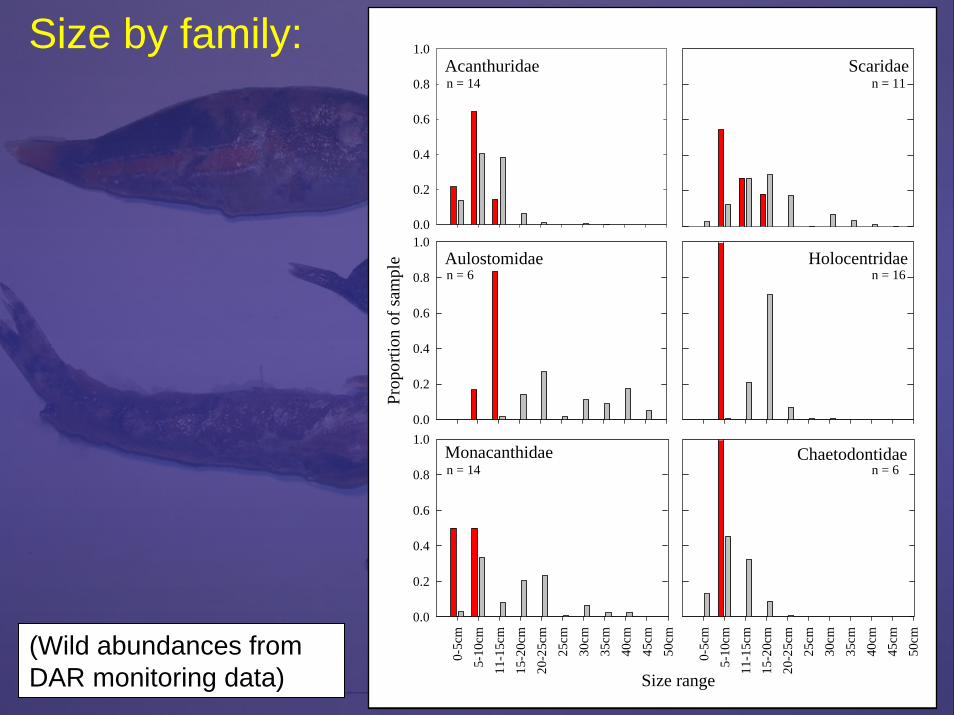
Yellow TangAcanthuridae

All fishes

4.9

41.1 3.7 1,100%

Avg size: 11 g 25 g 43%

Consumption (t) in open areas only

Consumption vs. prey fish standing stock

Biomass removed substantial.

93.7 836 11%11.4 72%

73.5 16%

Consumption Stock C vs. Stock

Biomass (t)Number (million)

Size (g)

8.2

11.4

2. How much prey did roi consume in our analysis area in 2003?8.2 million reef fish weighing 93.7 metric tons.

Feeding biology conclusion1. What is the focus of roi consumption in Hawaii?

Small reef fish individuals ( settlers, recruits, early juveniles)

Management issue:Evaluation of effects of roi consumption

Feeding biology conclusion

… suggests that roi consumption is an important factorin the reef ecosystem in Hawaii.

• At the same time, comparison of roi consumption with …

1. the available study from the literature2. the standing stock size of reef fishes3. the take of reef fish by the aquarium fish industry

• Consumption may not directly translate into ecological impact.

Taxon Closed Open

Total fish community ++ +/-

Future work

Trends in fish abundance, Kona coast, 1999 – 2005 (DAR surveys)

0

10

20

30

40

50

60

70

80

90

100

1998 1999 2000 2001 2002 2003 2004 2005 2006

Year

D (n

/ha)

Closed

Open

Linear (Closed)

Linear (Open)

Future work

Taxon Closed Open

Total fish community ++ +/-Cephalopholis argus ++ -

Future work

Trends in fish abundance, Kona coast, 1999 – 2005 (DAR surveys)

Preferential feeding

Acknowledgements

• HCRI

• HIMB (logistical support)

My committee: Charles Birkeland, Ivor Williams, Sheila Conant, Bob Kinzie, Yoshitsugi Hokama

• UH EECB program

Funding:

Special thanks to:Chuck, my parents, Katja, Judy, Amanda, John, and to Hawaii, a very special place.

Mahalo!

Collaborators: Bill Walsh, Kosta Stamoulis

Help on the project & on my way: Amanda Meyer, Tim Clark, Lance Smith, Shawn Fujimoto, Jim Parrish, Brett Schumacher, Jeremy Claisse, Sasa Satele, Brittany Graham, Jamie Tanimoto, Terri Rust, Brian Popp, Albert Tacon, Joanne Leong, Steve Cotton, Brent Carmen, Randy Kosaki, Risa Minato, Kristine Davidson, Mike Hamnett, Dave Pence, Kevin Flanagan, Kerwin Lum, Lucy Kida, Audrey Shintani, Jan Tatsuguchi, Lynne Ogata, Shannon Oshiro, Neil Sarver, Dale Simms, Martha Staff, and Tom Koerber.

Questions?

Mahalo!


Recommended