ISSN : 0974-908X Volume: 2 Issue: 2 September 2010 A bi-annual journal from GRG School of Management Studies Coimbatore, India Journal of Management Thought and Practice Employees' Job Satisfaction in Electronics Corporation of India Ltd., Hyderabad S. R. Padala A Study on the Changing Face of the Indian Health Insurance Industry M. Mohanasundari and K. Balanaga Gurunathan An Empirical Study on Customer Retention Strategies in Rural India: A Case Study on UAE Exchange I. Krishna Murthy and T. Anupama Effective Return on Tax Saving Mutual Fund Schemes N. S. Santhi and K. Balanaga Gurunathan Case Study: A Preamble to Employee Engagement Practices T. Frank Sunil Justus, T. Sunitha and M. Ramesh
Transcript
ISSN : 0974-908X
Volume: 2 Issue: 2September 2010
A bi-annual journal from GRG School of Management Studies
Coimbatore, India
Journal of Management Thought and Practice
Employees' Job Satisfaction in Electronics Corporation of India Ltd., HyderabadS. R. Padala
A Study on the Changing Face of the Indian Health Insurance IndustryM. Mohanasundari and K. Balanaga Gurunathan
An Empirical Study on Customer Retention Strategies in Rural India: A Case Study on UAE ExchangeI. Krishna Murthy and T. Anupama
Effective Return on Tax Saving Mutual Fund SchemesN. S. Santhi and K. Balanaga Gurunathan
Case Study: A Preamble to Employee Engagement Practices T. Frank Sunil Justus, T. Sunitha and M. Ramesh
PRERANA in Sanskrit means hope and inspiration. The primary objective of PRERANA journal is to enhance the standard of management education by drawing from conceptual and empirical research based articles reflecting current industry practices. PRERANA shall include contributions from eminent members of the academia and sharing of practices by experts from industry. The Journal will also contain book reviews, editorial abstracts and executive summaries of recent publications in management.
Prof. S. Balasubramanian, DirectorGRGSMS, Coimbatore
Dr. D. Dhanapal, Group Director KPR Institutions, Coimbatore
Mr. P.M. Jagatheesan, Vice President-HR Sara ELGI Group, Coimbatore
Dr. Rajesh Haldipur, Dean and Professor SDM Institute for Management Development, Mysore
Mr. Rajeev Kamineni, DirectorKamineni Retail Enterprises, Coimbatore
Dr. R. Mahadevan, DirectorIndia Pistons, Chennai
Dr. R. Nandagopal, DirectorPSG Institute of Management, Coimbatore
Dr. Gail K Naughton, Dean College of Business, San Diego State University, USA
Executive Editor: Dr. B. Sripirabaa, Faculty, GRG School of Management Studies
Dr. Alford H Ottley, ProvostNorthwestern College, USA
Mr. Benedict Paramanand, DirectorManagement Next, Bangalore
Dr. T.S. RagunathanChair, Informations Operations Technology ManagementCOBA, University of Toledo, USA
Dr. Ms. Sheela Ramachandran, Vice ChancellorAvinashilingam University for Women, Coimbatore
Dr. A. Senthil Kumar Associate Professor of Mechanical EngineeringNational University of Singapore, Singapore
Dr. Monideepa Tarafdar, Associate Professor, Informations Operations Technology ManagementCOBA, University of Toledo, USA
Dr. Ms. N. Yeshodha Devi, PrincipalPSGR Krishnammal College for Women, Coimbatore
The Editorial Board
ISSN : 0974-908X
Volume: 2 Issue: 2 September 2010PRERANA
Journal of Management Thought and Practice
A bi-annual journal from GRG School of Management Studies
Coimbatore, India
CONTENTS
Title
Employees' Job Satisfaction in Electronics Corporation of India Ltd., Hyderabad
A Study on the Changing Face of the Indian Health Insurance Industry
An Empirical Study on Customer Retention Strategies in Rural India: A Case Study on UAE Exchange
Effective Return on Tax Saving Mutual Fund Schemes
Case Study: A Preamble to Employee Engagement Practices
CXO Interview
Book Review
PRERANA September 2010
Author(s)
Dr. S. R. Padala
M. Mohanasundari and Dr. K. Balanaga Gurunathan
I. Krishna Murthy and T. Anupama
N. S. Santhi and Dr. K. Balanaga Gurunathan
T. Frank Sunil Justus, T. Sunitha and Dr. M. Ramesh
Page No.
1
15
25
35
45
53
59
i
PRERANA September 2010
ii
PRERANA September 2010
From the Executive Editor
It is my pleasure to place before you the second issue of the second volume of PRERANA: Journal of Management Thought and Practice.
Talent management is the buzz word in human resource management. Employers use it as a strategy to improve the retention ratio of their best staff, increase employee loyalty and boost productivity. Talent management focuses on the growing individuals and concentrates on their training and development within the company and ensures that there are always successors in place that are suitable for key positions. Structuring flexible benefit programme enabling employees to select the incentives that suit their lifestyle is a key weapon in the arsenal of talent management and the retention of star employees. Organizations deploy talent management as a key differentiator in the current competitive scenario to succeed in business.
The objective of PRERANA is to enhance the standard of management education by drawing from conceptual and empirical-research based articles reflecting current industry practices. The Journal also enables industry in applying the most recent developments in the evolution of management thought. PRERANA encourages contributions from eminent members of the academia and sharing of industry practices through case studies from captains of industry. The Journal also encourages book reviews, editorial abstracts and executive summaries of recent publications. PRERANA's international and multi-disciplinary review team ensures achieving high standards of excellence with regard to the quality of contents. The current issue has four articles in the areas of Human Resources, Marketing and Finance, a case study and a book review.
Padala in his article has attempted in identifying the level of employees' job satisfaction in Electronics Corporation of India Ltd., (ECIL) Hyderabad and has examined the relationship between employees' socio-economic character and the motivating parameters. The results of the study revealed that salary and allowances, career opportunities, cooperative staff, recognition and appreciation enhances the satisfaction of employees.
Mohanasundari and Balanaga Gurunathan in their article have portrayed the history and the changing trends in the health insurance sector in India. The challenges and the hurdles in the current scenario are discussed. Krishna Murthy and Anupama in their article have explored the customer retention strategies adopted by UAE Exchange, Rajahmundry, Andhrapradesh a financial service organization and concluded that the company has established good cross selling activities to promote their service through their satisfied customers. The study further highlighted that the usage of the different type of service depended on the satisfaction level of the customers with regard to the service rendered by the company and the frequency of customer willingness to avail the service.
Santhi and Balanaga Gurunathan in their article have compared the return on the investment in bank and tax saving mutual fund schemes over a period of four years. The study included the dividend declared tax saving mutual fund schemes launched during the year 2000-05. The study revealed that the return from tax saving mutual fund is low and volatile than bank return.
iii
PRERANA September 2010
iv
Frank Sunil Justus, Sunitha and Ramesh have highlighted the need for employee engagement practices in organizations through their case study. This issue also carries a CXO interview with Mr. Harjeet Singh Wahan and a book review.
As the Executive Editor of PRERANA, I thank all the authors for their contributions to the second issue of the second volume and the readers for their support and suggestions. I invite articles from academicians, practitioners and researchers highlighting business issues and future challenges with implications for management education and the business community.
- Dr. B. Sripirabaa
PRERANA September 2010
1Dr. S. R. Padala
EMPLOYEES' JOB SATISFACTION IN ELECTRONICS CORPORATION OF INDIA LTD., HYDERABAD
1Dr. S. R. Padala
1 Dr. Shanmukha Rao Padala, Faculty, Department of Management studies, Andhra University Campus, Vizianagaram, (AP), India. E-mail: [email protected]
ABSTRACTIn the literature of industrial psychology the term 'job satisfaction' is quite
frequently used for individuals' attitude towards the specific aspects of total work situation. Since the time when the occupation of individuals became a socially significant phenomenon, social scientists focused their attention on the problem of job satisfaction. Even from early days social scientists like Blum stressed the significance of studying job satisfaction of workers in an industrial atmosphere. Job is not the only means of satisfying the employees' needs, but employees' spend nearly half of their life at work. The nature and significance of work would be important as an area for study, if only on the basis, that it occupies so much of employees' life span. To the society as a whole as well as from an individual employee standpoint job satisfaction is a desirable outcome. Job satisfaction has been described as an output of a work environment. An attempt is made in this study to identify the various parameters for employee job satisfaction in Electronics Corporation of India Ltd., (ECIL) Hyderabad, to examine the relationship between employees' socio-economic character and the motivating parameters, and to measure the level of employees' job satisfaction in the ECIL based on the selected parameters. Around five per cent of the employees (out of 6050 employees, 300 respondents are selected i.e., 115 executive cadre, 55 junior executive cadre and 130 non executive cadre employees) were selected based on stratified random sampling and the collected data was analyzed using Mean, Standard Deviation, F-tests and t-tests. Among the selected parameters, salary and allowances and promotion emerged as important factors for job satisfaction. The study also revealed that younger workers have greater job satisfaction than older ones. Junior officers and non-executive employees with less number of service and high degree of participation in Trade Unions are found to have more job satisfaction levels. The study also revealed that the executives considered the nature of work as the important factor of job satisfaction than their counterparts.
INTRODUCTIONThe term 'job satisfaction' is quite frequently used for individuals' attitude
towards the specific aspects of total work situation. Since the time when the occupation of individuals became a socially significant phenomenon, social scientists focused their attention on job satisfaction. Even from early days, social scientists stressed the significance of studying job satisfaction of workers in an industrial atmosphere. Job satisfaction has been described as an output of a work environment. Katzwl et al., (1961) observed the employee satisfaction and
PRERANA September 2010
Dr. S. R. Padala2
performance as the outputs and the working environment and the employees' efforts as the inputs. Inputs affect the outputs via employees' motivation and ability.
The agreement between the environment and the workers' expectations result in job satisfaction. Lawler (1967) found employees who are not satisfied with their jobs are more likely to be absent and quit since they do not see any relationship between having the job and the satisfaction of their needs. Job satisfaction is person's attitude towards the job. Positive attitude towards the job are equivalent to job satisfaction where as negative attitude towards the job are equivalent to job dissatisfaction.
Bullock (2003) described job satisfaction as “an attitude which results from balancing and summation of many specific likes and dislikes experienced in connection with the job”. Peptone (1999) defined job satisfaction as summation of employees feelings in four important areas namely; job, management, personal adjustment and social relations. Hop Pock (1996) defined employee satisfaction as any combination of psychological, physiological and environment circumstances that causes the person truthfully to say I am satisfied with my job. In his study he compared the job satisfaction of public and private sectors and found the private sector professionals to be more satisfied than their counterparts in the public sector.
FACTORS OF JOB SATISFACTIONThe factors, which are influencing the employees' satisfaction, are broadly
classified into three categories:1. Personal Factors: They include workers gender, education, age, marital status
and their personal characteristics, family back ground, socio-economic background and the like.
2. Factors inherent in the job: These factors have recently been studied. Workers, supervisors and the skilled workers would rather like to be guided by their own incrimination to choose jobs in consideration of 'what they have to do'.
3. Factors controlled by the management: They include the nature of supervision, job security, kind of work group, wage rate, promotional opportunities, transfer policy, duration of work and sense of responsibilities. All these factors greatly influence the workers. Their presence in the organization motivates the workers and provides a sense of job satisfaction.
DETERMINANTS OF JOB SATISFACTIONThe following are the determinants of the job satisfaction: Equitable Rewards,
Mentally challenging work, Supportive Working Conditions, Promotions, Supervision, Job security, Work group, Health, Welfare and safety, Opportunity for development, Employee Satisfaction at Social Environment, Autonomy at work and Grievance redressal system.
REVIEW OF LITERATURE Turner and Lawrence (1965) stated that enriched job characterized by variety,
autonomy, responsibility etc. will lead to increased job satisfaction. The study conducted by Khaleque and Chowdhary (1984) examined the factors relevant to
PRERANA September 2010
Dr. S. R. Padala 3
overall job satisfaction among industrial mangers. The study revealed that top managers considered the nature of work as the most important factor of job satisfaction and fringe benefits as the least important factor of job satisfaction. Savery and Wingham (1991) in a study of directors of child care centre found that intrinsic motivators such as 'interesting and challenging work' and 'feeling of achievement' were more important to their job satisfaction than 'salary'.
Pincus (1986) in a study of hospital nurses revealed significant positive relationship between communication satisfaction and job satisfaction and between communication satisfaction and job performance. Morse and Reimer's (1956) experiment on the employees of a large insurance company proved that participation enhances satisfaction. Vroom (1960) obtained evidence to conclude that the effect of participation in decision making on satisfaction depends on the personality of the participants. Ahuja (2006) reported that participative situation increases the degree of involvement with the enterprise, boost morale, increase motivation for work, and provide opportunity to demonstrate the skills of the employees. Cooper and Marshal (1976) have found that lack of participation by employees in decisions about their job led to high rate of absenteeism, turnover, tardiness, job dissatisfaction, sabotage and low levels of performance in the job.
Laldas (1985) studied the relations with supervisors, colleagues, subordinates, management staff and their work satisfaction, dependency relations, wage-salary satisfaction, and work environment. The results showed that change in interpersonal relations is positively related to work satisfaction. House and Path (1971) explored the relationship between individual perceptions, their immediate supervisor's behavior and their satisfaction from their work and organizations and noted that considerate behavior of supervisors towards their subordinates was highly correlated with various indices of job satisfaction. Arun and Misra (2007) found that the impairment of interpersonal relations may affect individual well being and the health of the organization.
According to McClelland (1961) money is not only a physical need that satisfies one's desire, but it can serve as a symbol of achievement, as a source of recognition, and as a means of obtaining other valuables. Ganguly (1999) in his study on Indian workers examined various factors leading to job satisfaction and ranked adequate earnings as the first factor followed by job security and opportunity for advancement. Smith and Cranny (1968) studied workers satisfaction with their pay. They found stability in their attitude and performance. What the worker gets out of the job (pay, fringe benefits etc.) was in balance with what he puts into the job (hard work, skill etc.). Deviations from what the worker sees as the balance point result in changes in their attitudes or their performance.
Barber et al., (1992) observed an increase in overall satisfaction depending on the benefits received as a result of the introduction of a flexible benefit plan for the employees of a financial service organization. But Sharma (1980) found that income is not positively related to job satisfaction. The study conducted by Khaleque and Chowdhary (1984) examined the factors relevant to overall job satisfaction among industrial mangers. It revealed that top managers considered fringe benefits as the least important factor of job satisfaction.
PRERANA September 2010
Dr. S. R. Padala4
The study by Stagner (1950) revealed that opportunities for promotion are known to have a vital influence on the job satisfaction of workers. Kumar studied job expectations of supervisors and managers in a public sector organization and found that among the job expectation factors, the factors of opportunity for advancement and pay according to merit emerged as significant.
Vinokur et al., (1994) examined the impact of work place conditions and motivators on the job satisfaction and retention of social workers in public agencies, non-profit agencies and private agencies. They found opportunities for promotion and job challenge were the most important factors influencing the job satisfaction of individuals in non-profit and public agencies. Hossain (2000) identified the major causes of dissatisfaction as perceived by respondents were lack of promotional prospects, poor salary, poor job status and absence of recognition for good work. Lawler and Portler (1967) suggested that performance causes satisfaction rather than the other way around, and this causal connection occurs only when employee perceives that intrinsic and extrinsic rewards are associated with superior performance.
Slomon (2007) stated that studies comparing job satisfaction of public and private sectors have consistently reported that private sector professionals to be more satisfied than their counterparts in the public sector. Aryee (2009) conjectured that considering the higher degree of bureaucratization in the public sector, it is not surprising that public sector professionals perceived low realization of their expectations when compared with their counterparts in the private sector. Shukla (2009) found that private and public sector professionals differed in their job satisfaction. Private sector executives scored higher on job satisfaction in terms of the companies' policies and intrinsic job satisfaction.
The review of literature on the job satisfaction shows that different researchers examined the concept on different dimensions like: autonomy, responsibility, variety, nature of job, communication network, democratic functioning, public and private sector, relation with controlling officers and colleagues, attitudes and morale, salary and allowances, promotion prospects, work place conditions, recognition, intrinsic and extrinsic rewards, job security, absenteeism, turnover, tardiness, job dissatisfaction, sabotage and low levels of performance in the job, child care centre, interesting and challenging work, feeling of achievement etc. The researchers concentrated on one or a few dimensions of job satisfaction. No comprehensive study has been made so far covering different dimensions of job satisfaction i.e., Salary and allowances, Challenging Job, Inter personal relations, Better work environment, Cooperative staff, Social security measures, Promotion, Recognition and appreciation, Training and guidance and Encouraging superiors. The present study is therefore, a modest attempt to fill the existing research gap to some extent. It is intended to carry out the study in Electronics Corporation of India Ltd., Hyderabad for the following reasons:
Electronics occupies a key position in modern science and technology. It has a vital role to play in the field of Atomic Energy, communication, defense, education, space technology and entertainment. In India, the electronics industry has grown in many strides both in public and private sector in order to produce industrial
PRERANA September 2010
Dr. S. R. Padala 5
electronics systems with indigenous technology to meet the nation's requirement in strategic areas.
Electronics Corporation of India Ltd., (ECIL) was set up by a great scientist Dr. A. S. Rao under the department of atomic energy on April 11, 1967 with a view of generating a strong indigenous capability in the field of refined professional grade electronics. ECIL was engaged in the fields of design, development, manufacture and marketing of several items to the tune of almost 460 with emphasis on 3 technology lines that is computers, control system and communication.
ECIL's mission is to consolidate its status as a valued national asset in the area of strategic electronics with specific focus on atomic energy defense, security and such critical sectors of strategic national importance. ECIL manufactures various items ranging from TV sets for domestic purposes to Computers, Communication equipment required for Defense- Air Force and Navy and also those required for Atomic Electronics Energy (to Bhabha Atomic Research Center), those useful for Steel Plants, Cement Plants, Telecommunication, Railways, Petro-Chemicals and other Industrial Organization ranging from more than 400 items conforming to ISI standards.
OBJECTIVES OF THE STUDY The objectives of the study are:
1. To identify the various parameters for employee job satisfaction.2. To examine the relationship between employees' socio-economic character
and the motivating parameters.3. To measure the level of employees' job satisfaction in the selected
organization based on the selected parameters.
METHODOLOGY The study is descriptive in nature and is based on both primary and secondary
data. The secondary data was collected from organization records, management reports and special project reports to understand the present state of job satisfaction in terms of selected job satisfaction factors. Primary data was collected from the workers of the organization with the help of questionnaire. The researcher constructed a questionnaire using five-point scale. Each statement in the questionnaire has five alternatives ('Strongly Agree', 'Agree', Neither Agree nor Disagree', 'Disagree', 'Strongly Disagree'). The questionnaire has two parts. The first part of the questionnaire relating to socio-economic background of employees consisted of 15 questions relating to age, educational qualification, religion, mother tongue, income, earning members in the family, job category, length of service etc. The second part of the questionnaire consisted of 50 statements relating to various factors of job satisfaction considered for the study. There are 6050 employees in ECIL, Hyderabad, out of which 2314 were in executive cadre, 1102 in junior executive cadre and the remaining 2634 employees in non-executive category. The sample was selected based on stratified random sample technique. A sample of five per cent from each category was drawn, which accounted to around 300 employees consisting of 115 executive cadre, 55 junior executive cadre and 130 non executive
PRERANA September 2010
Dr. S. R. Padala6
cadre Social Sciences) software and STATISTICA. Uni-variate and bi-variate tables were generated and Mean, Standard Deviation, F-tests and t-tests were performed to find out the relationship between the variables.
ANALYSIS AND DISCUSSIONThe main theme of the study was to examine the motivating factors among the
employees to perform the tasks assigned to them in an efficient manner and with a sense of satisfaction and commitment. As explained in the methodology part, ten factors have been identified and the employees' ratings were collected on a constant sum scale. The resulting mean score and standard deviations of the factors are presented in Table 1. It can be observed from the table that 'Salary and allowances' with a mean score of 4.80 emerged as the most significant factor motivating the employees for better performance, followed by 'Promotion' and 'Social security measures' with mean values of 2.56 and 2.25 respectively. 'Challenging Job', 'Cooperative Staff' and 'Recognition and Appreciation' occupy subsequent positions respectively in the hierarchy of motivating factors. Training and guidance although important from the point of view of job performance, occupies the lowest position as a motivator.
employees. The Primary data was analyzed using SPSS (Statistical Package for
Table 1: Scores of Motivating Factors
Motivating factors
Mean
Standard Deviation
Salary and allowances
4.80
2.67
Challenging Job
2.18
1.88
Inter personal relations
1.60
1.95
Better work environment 1.82 2.19
Cooperative staff 1.95 1.87
Social security measures 2.25 1.61 Promotion 2.56 2.9 Recognition and appreciation
1.94
2.07
Training and guidance
1.51
1.6
Encouraging superiors
1.61
2.15
Based on the analysis of the above table it can be concluded that the monetary
rewards and promotion emerged as major factors of motivation for better performance. Monetary rewards, more than meeting economic needs is a measure of power, status happiness and so on. Training and Guidance, although important from the point of view of job performance, it occupied the lowest position as a motivator which is an unhealthy phenomena. Hence it is suggested that any strategy for motivating employees should be based on recognizing the role of financial benefits and job enrichment.
Age Wise Analysis of Motivating Factors: The age wise distribution of the mean scores of motivating factors depicted in Table 2 indicates that irrespective of age
PRERANA September 2010
Dr. S. R. Padala 7
everybody gives topmost importance for 'Salary and Allowances' followed by 'Promotion', 'Social Security Measures' and 'Challenging Job'. The low age group as well as upper age group opted 'Cooperative Staff' as the next priority while the option of middle age group was 'Recognition and Appreciation'. It is apparent from the analysis that priority of 'Challenging Job' is high in low age group compared to middle age and upper age group with the mean values 2.29, 2.21 and 2.08 respectively. The difference is statistically significant at 1% level as indicated by the corresponding 'F' value of 6.256. Secondly the factor 'Encouraging Superiors' has gained importance with the increasing age group and is found significant at 1% level with 'F' value 4.013 as shown in Table 2. It can be concluded that the age was found to be an explanatory variable of job satisfaction. The level of job satisfaction was found to be high for the low age group and it declines in middle age and upper age group of employees.
Table 2: Age Wise Distribution of Mean Scores of Motivating Factors
* Significant at 0.05 level ** Significant at 0.01 level
Gender Wise Analysis of Motivating Factors: Table 3 shows gender wise distribution of the mean scores of motivating factors. 'Salary and Allowances' and 'Promotion' occupy the top two positions respectively followed by 'Social Security Measures' in the inventory of needs of both males and females. It can be seen from the analysis that gender difference influences significantly the employees' perceptions of 'Cooperative Staff'. Males have more expectations of 'Cooperative Staff' as compared to females. The mean scores of males and females are 2.12 and 1.91 respectively. The difference is statistically significant at 1 per cent level as indicated by the 't' value of 3.92. Females have more expectations for 'Salary and Allowances' as compared to males and it is significant at 1 per cent level with 't' value 3.15 as shown in table 3.
PRERANA September 2010
Dr. S. R. Padala8
Table 3: Gender Wise Distribution of Scores of Motivating Factors
Male
Female
Gender / Motivating Factors
Mean
SD
Mean
SD ‘t’ value
Salary and allowances 4.60 3.24 4.84 2.49 3.15**
Challenging Job 2.10 2.01 2.20 1.84 1.84
Inter personal relations
1.55
1.41
1.61
2.05
1.08
Better work environment
1.83
1.82
1.82
2.26
0.21
Cooperative staff
2.12
2.20
1.91
1.76
3.92**
Social security measures
2.28
1.73
2.24
1.58
0.95
Promotion
2.68
2.46
2.53
2.98
1.85
Recognition and appreciation
1.96
2.23
1.94
2.03
0.41
Training and guidance
1.48
1.31
1.52
1.66
0.80
Encouraging superiors
1.61
1.98
1.61
2.18
0.12
* Significant at 0.05 level ** Significant at 0.01 level
Education Wise Analysis of Motivating Factors: The influence of educational qualification in factors motivating for better performance is examined in Table 4. The two significant groups identified on the basis of 'Education' are 'Below the Graduations' and 'Graduation, Post Graduates and above'. 'Salary and Allowance' and 'Promotion' are the top two factors of motivation among both the groups. When it comes to 3rd and 4th places of priority, 'Below Graduate' group opted 'Challenging Job' and 'Social Security Measures' factors respectively, while 'Graduates, Post Graduate and above' group opted 'Social Security Measures', and 'Challenging Job' respectively. In the analysis it has been proved that 'Encouraging superiors' factor dominates in higher education group with a 't' value of 4.24 while 'Salary and Allowances', 'Challenging Job' and 'Better Work Environment' dominates Graduate group with 't' values of 2.71, 3.66 and 2.81 respectively. It is clear that the socio-economic variables like: gender and educational background of the employees is not that much of significant in explaining job satisfaction.
Nature of Job Wise Analysis of Motivating Factors: Based on the nature of job, the respondents were classified as executives, junior officers and non-executive. Table 5 shows the distribution of the scores of motivating factors on the basis of the nature of job engaged in by the respondents. From the analysis it can be seen that the nature of job does not make any difference in the prevalence of 'Salary and Allowances' and 'Promotion' as the top most motivating factors. Challenging job' and 'Social Security Measures' occupy the next two positions in the hierarchy of expectations in case of Executives and vice-versa in case of junior officers and non-executive groups. While
PRERANA September 2010
Dr. S. R. Padala 9
non-executive employees are more concerned about 'Cooperative Staff', Executives are more concerned about 'Challenging Job'. This phenomenon is illustrated significantly with the 'F' value of 7.865 and 6.418 respectively as detailed in table 5. It can be concluded that the nature of job is related with the level of job satisfaction. The variation in the level of satisfaction is more among the executives and non-executives. The Executives have the highest score of satisfaction.
Table 4: Education Wise Distribution of Scores of Motivating Factors
Below Graduation
Graduation, Post
Graduates and above
Education/Motivating factors
Mean
SD
Mean
SD
‘t’
Value
Salary and allowances
22.19
2.43
21.38
2.72
2.71**
Challenging Job 10.37 1.85 9.61 1.85 3.66**
Inter personal relations
7.43
2.48
7.13
1.72
1.35
Better work environment
8.69
2.67
8.00
1.96
2.81**
Cooperative staff
8.65
2.26
8.83
1.72
0.85
Social security measures
9.83
1.85
10.21
1.51
2.08*
Promotion
11.20
3.52
11.61
2.65
1.24
Recognition and appreciation
8.68
2.38
8.77
1.95
0.43
Training and guidance
6.44
1.57
6.94
1.60
2.79*
Encouraging superiors
6.52
2.11
7.52
2.10
4.24**
* Significant at 0.05 level ** Significant at 0.01 level
Table 5: Nature of Job Wise Distribution of Scores of Motivating Factors
Executives
Junior Officers
Non-Executives
Nature of Job / Motivating factors
Mean
SD
Mean
SD
Mean
SD
F - Value
Salary and allowances
4.84
2.63
4.84
2.39
4.62
3.19
4.211*
Challenging Job
2.27
1.85
2.12
1.78
2.13
2.04
6.418**
Inter personal relations
1.66
2.20 1.56
1.84
1.57
1.56
2.522
Better work environment 1.89 2.42 1.75 2.02 1.83 1.93 3.782*
Cooperative staff
1.91
2.04 1.91
1.47
2.12
2.14
7.865**
Social security measures
2.21
1.76
2.27
1.41
2.28
1.69
1.427
Promotion
2.42
3.38
2.64
2.46
2.66
2.55
5.861*
Recognition and appreciation
1.93
2.21
1.96
1.85
1.96
2.26
0.209
Training and guidance
1.50
1.81
1.54
1.52
1.48
1.29
1.059
Encouraging superiors
1.58
2.57
1.65
1.75
1.59
1.97
0.874
* Significant at 0.05 level ** Significant at 0.01 level
PRERANA September 2010
Dr. S. R. Padala10
Length of Service Wise Analysis of Motivating Factors: The length of service wise distribution of the mean scores of factors motivating for better performance is given in table 6. It can be observed that 'Salary and Allowances' and 'Promotion' remain as the first two factors expected by the respondents of all the three groups. While the seniors are expecting 'Social Security Measures' and 'Challenging Job' as their third and fourth motivators, the junior most employee preferred. 'Challenging Job', 'Better Working Environment', 'Training and Guidance' and 'Encouraging Superiors' are the areas making difference among the groups basing on length of service.
The junior most employees have the highest concern for 'Challenging Job' with a mean score of 2.30. The need for 'Challenging Job' is seen negatively related with increase in service. The difference between the groups is significant at 1% level as indicated by the corresponding 'F' value of 8.590. The factors 'Encouraging Superiors', 'Training and Guidance' and 'Better Working environment' have been found more needy in the senior managers group with the 'F' value 14.617, 7.805 and 8.460 respectively with the significant level of 1 per cent.
Table 6: Distribution of Scores of Motivating Factors according to Length of Service
Below 10 years
10 – 20 years
Above 20 years
Length of service / Motivating Factors
Mean
SD
Mean
SD
Mean
SD
F - value
Salary and allowances
4.98
2.37
4.76
2.55
4.72
3.03
5.927*
Challenging Job
2.30
1.76
2.18
1.70
2.06
2.17
8.590**
Inter personal relations
1.66
2.58
1.59
1.81
1.57
1.53
1.119
Better work environment
1.99
2.77
1.75
1.98
1.81
1.81
8.460**
Cooperative staff
1.94
2.24
1.91
1.54
2.05
2.07
4.003*
Social security measures
2.22
1.94
2.24
1.38
2.29
1.70
0.977
Promotion
2.42
3.51
2.57
2.73
2.65
2.56
3.353*
Recognition and appreciation
1.91
2.26
1.96
1.82
1.94
2.37
0.405
Training and guidance
1.40
1.39
1.57
1.70
1.50
1.46
7.805**
Encouraging superiors
1.39
2.07
1.70
2.06
1.63
2.12
14.617**
* Significant at 0.05 level ** Significant at 0.01 level
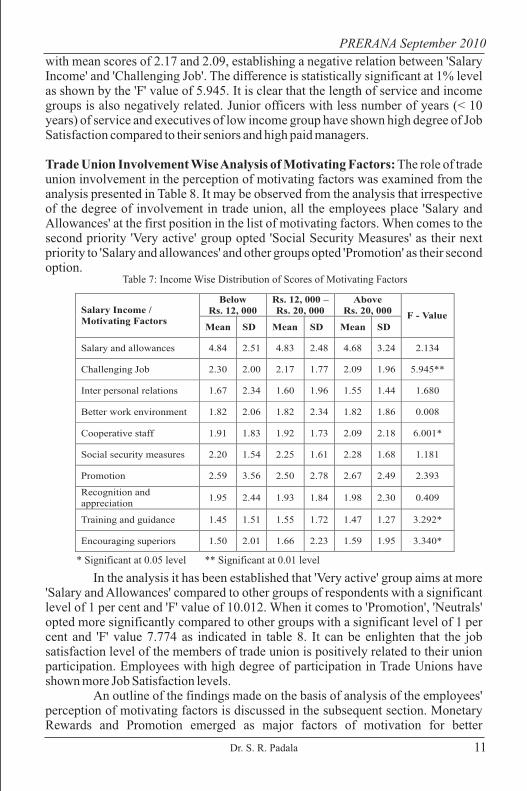
Income Wise Analysis of Motivating Factors: The salary wise analysis of motivating factors showed in Table 7 clearly indicates that even for higher income groups 'Salary and Allowances' tops in the list of motivating factors. The lowest income group places 'Challenging Job' and 'Social Security Measures' next to 'Salary and Allowance' and 'Promotion', in the hierarchy of their needs. The middle income and higher income groups need for 'Challenging Job' comes only after 'Social Security Measures' followed by 'Recognition and Appreciation'.
It can be seen from the analysis that the need for 'Challenging Job' differs significantly among the different salary groups. The lowest salary group comes top with a mean score of 2.30 and the highest salary group comes in the lowest positions
PRERANA September 2010
Dr. S. R. Padala 11
with mean scores of 2.17 and 2.09, establishing a negative relation between 'Salary Income' and 'Challenging Job'. The difference is statistically significant at 1% level as shown by the 'F' value of 5.945. It is clear that the length of service and income groups is also negatively related. Junior officers with less number of years (< 10 years) of service and executives of low income group have shown high degree of Job Satisfaction compared to their seniors and high paid managers.
Trade Union Involvement Wise Analysis of Motivating Factors: The role of trade union involvement in the perception of motivating factors was examined from the analysis presented in Table 8. It may be observed from the analysis that irrespective of the degree of involvement in trade union, all the employees place 'Salary and Allowances' at the first position in the list of motivating factors. When comes to the second priority 'Very active' group opted 'Social Security Measures' as their next priority to 'Salary and allowances' and other groups opted 'Promotion' as their second option.
Table 7: Income Wise Distribution of Scores of Motivating Factors
Below
Rs. 12, 000
Rs. 12, 000 –
Rs. 20, 000
Above
Rs. 20, 000
Salary Income /
Motivating Factors
Mean
SD
Mean
SD
Mean
SD
F - Value
Salary and allowances
4.84
2.51
4.83
2.48
4.68
3.24
2.134
Challenging Job
2.30
2.00
2.17
1.77
2.09
1.96
5.945**
Inter personal relations
1.67
2.34
1.60
1.96
1.55
1.44
1.680
Better work environment
1.82
2.06
1.82
2.34
1.82
1.86
0.008
Cooperative staff
1.91
1.83
1.92
1.73
2.09
2.18
6.001*
Social security measures
2.20
1.54
2.25
1.61
2.28
1.68
1.181
Promotion
2.59
3.56
2.50
2.78
2.67
2.49
2.393
Recognition and appreciation
1.95
2.44
1.93
1.84
1.98
2.30
0.409
Training and guidance
1.45
1.51
1.55
1.72
1.47
1.27
3.292*
Encouraging superiors
1.50
2.01
1.66
2.23
1.59
1.95
3.340*
* Significant at 0.05 level ** Significant at 0.01 level
In the analysis it has been established that 'Very active' group aims at more 'Salary and Allowances' compared to other groups of respondents with a significant level of 1 per cent and 'F' value of 10.012. When it comes to 'Promotion', 'Neutrals' opted more significantly compared to other groups with a significant level of 1 per cent and 'F' value 7.774 as indicated in table 8. It can be enlighten that the job satisfaction level of the members of trade union is positively related to their union participation. Employees with high degree of participation in Trade Unions have shown more Job Satisfaction levels.
An outline of the findings made on the basis of analysis of the employees' perception of motivating factors is discussed in the subsequent section. Monetary Rewards and Promotion emerged as major factors of motivation for better
PRERANA September 2010
Dr. S. R. Padala12
performance. Monetary Rewards, more than meeting economic needs is a measure of power, status happiness and so on. Hence it is suggested that any strategy for motivating employees should be based on recognizing the role of financial benefits and job enrichment. Challenging Job, which creates opportunities for realization of one's potential, is felt motivating the employees at lower levels compared to higher level group. Hence the organization should follow a selective policy of adopting the 'Challenging Job' as a factor of motivation considering the perceptions of employees.
Table 8: Trade Union Involvement Wise Distribution of Scores of Motivating Factors
Very active Active Neutral No
participation
Union participation / Motivating Factors
Mean
SD
Mean
SD
Mean
SD
Mean
SD
F – Value
Salary and allowances
5.18
1.85
4.68
2.60
4.82
2.52
4.66
2.97
10.012**
Challenging Job
2.31
1.28
2.23
1.84
2.18
1.80
2.08
2.19
3.588*
Inter personal relations
1.72
2.83
1.65
2.00
1.57
1.84
1.58
1.55
1.917
Better work environment
2.01
2.65
1.91
2.43
1.75
2.00
1.79
1.98
4.725*
Cooperative staff
1.92
2.21
1.93
1.98
1.92
1.61
2.05
2.06
2.461
Social security measures
2.35
1.77
2.21
1.82
2.21
1.41
2.29
1.71
2.534
Promotion
2.27
2.85
2.35
3.11
2.66
2.84
2.63
2.61
7.774**
Recognition and appreciation
1.74
1.97
1.96
2.10
1.99
1.88
1.94
2.34
3.659*
Training and guidance
1.37
1.42
1.57
1.98
1.51
1.40
1.54
1.69
3.329*
Encouraging superiors
1.34
1.84
1.74
2.94
1.61
1.71
1.66
2.19
7.479*
* Significant at 0.05 level ** Significant at 0.01 level
Training and Guidance, although important from the point of view of job performance, it occupied the lowest position as a motivator which is an unhealthy phenomena and to implement attractive training programmes especially among young generation who would be the future pillars of the organization become difficult. The findings of the study establish the role of Interpersonal relations; Cooperative staff, Recognition and Appreciation are motivating to the employees. Hence it is suggested that importance given for human relations in the training programmes should be given priority. Age is found to be an explanatory variable of job satisfaction. The level of job satisfaction is found to be high for the low age group and it declines in middle age and upper age group of employees. The other socio-economic variables i.e., gender and education is not seen significant in explaining job satisfaction. The nature of job is related with the level of job satisfaction. The variation in the level of satisfaction is more among the executives and non-executives. The Executives have the highest score of satisfaction. The length of service and income groups is also negatively related. Junior officers with less number of years (< 10 years) of service and executives of low income group have shown high degree of Job Satisfaction compared to their seniors and high paid
PRERANA September 2010
Dr. S. R. Padala 13
References
Ahuja, K.K. (2006), Personnel Management, New Delhi, Kalyani Publishers. 128-134.
Arun, M. and Misra, S.S. (2007), Personnel Management, New Delhi, Tata McGraw Hill. 12-46.
Aryee, S. (2009), Public and Private Sector Professionals - A Comparative Study of their Perceived work Experience. Group and Organization Studies, 17, 72-85.
Barber, A.E., Dunham, R.M., and Formisano, R.A. (1992), The Impact of Flexible Benefits on Employee Satisfaction: A Field Study. Personnel Journal, 45 (1), 55-75.
Bullock, L.M. (2003), The Measurement of Organizational Commitment. Journal of Vocational Behaviour, 14, 224-247.
Cooper, C.L. and Marshall, J. (1976), Occupational Sources of Stress: A Review of Literature Relating to Coronary Heart Diseases and Mental III Health. Occupational Psychology, 49, 11-28.
Ganguli, H.C. (1999), Structure and Process of Organization, Bombay, Asia Publishing House, 87-90.
Hop Pock (1996), Private and Public Sector Managers: An Empirical Investigation to Job Characteristics and Organizational Climate. Journal of Applied Psychology, 71, 247-259.
Hossain, M.M. (2000), Job Satisfaction of Commercial Bank Employees in Bangladesh: A Comparative Study of Private and Public Sectors. Indian Journal of Industrial Relations, 35(3), 347-61.
House, R.J. A Path (1971), Goal Theory of Leader Effectiveness. Administrative Science Quarterly, 16, 321-338.
Katzel, R.A., Barrett, R.S. and Parker, T.C. (1961), Job Satisfaction, Job Performance and Situational Chrematistics. Journal of Applied Psychology, 45, 65-72.
Khaleque, A and Choudhari, N. (1984), Job Facets and Overall Job Satisfaction of Industrial Managers. Indian Journal of Industrial Relations, 20 (2).
Laldas, D.K. (1985), Change in Interpersonal Relations of Industrial Employees: An Analysis. Indian Journal of Industrial Relations, 7(1), 20-28.
managers. The job satisfaction level of the members of trade union is positively related to their union participation. Managers with high degree of participation in Trade Unions have shown more job satisfaction levels.
CONCLUSIONBased on the past research on job satisfaction a modest attempt is made in
the present study based on selected factors of job satisfaction. Out of the selected factors, Salary and Allowance and Career opportunities are important job satisfaction factors. Subsequently Challenging Job, which creates opportunities for realization of one's potential, is felt motivating the employees at lower levels compared to higher level group. The organization should follow a selective policy of adopting the 'Challenging Job' as a factor of motivation considering the perceptions of employees. Cooperative staff, Recognition and Appreciation are motivating to the employees. Hence it is suggested that importance given for human relations in the training programmes should be given priority. Finally, Training and Guidance, although important from the point of view of job performance, it occupied the lowest position as a motivator. To enhance the satisfaction of the employees, ECIL could focus on making the job more challenging and by giving due recognition and appreciation for the employees for their contribution towards their job.
PRERANA September 2010
Dr. S. R. Padala14
Lawler, E.E. and Porter, L.W. (1967), The Effect of Performance on Job Satisfaction. Industrial Relations, 20(3), 333-340.
McClelland, D. (1961), The Achieving Society, New Jersey: Van Nostrand.
Morse, N.C. and Reimer, E. (1956), The Experimental Change of a Major organizational Variable. Journal of Abnormal Social Psychology, 52.
Pincus, J.D. (1986), Communication Satisfaction, Job Satisfaction and Job Performance. Human Communication Research, 12(3), 395-419.
Popton, R.E. (1999), A Casual Model of Turnover for Nurses. Academy of Management Journal, 24, 543-565.
Savery, L.K. and Wingham, D.L. (1991), Coping with the career plateau: Motivators for directors for child care centers, Leadership and Organization Development Journal, 12, 20-23.
Shukla, A. (2009), Public and Private Sector Professionals: Emerging Trends. Indian Journal of Industrial Relations, 39(2), 233-246.
Smith, P.C. and Canny, C.J. (1968), Psychology of Men at Work. Annual Review of Psychology,19.
Stranger, R. (1950), Psychological Aspects of Industrial Conflict, Motivation. Personal Psychology, 3.
Solomon, E. (2007), Private and Public Sector Managers: An Empirical Investigation to Job Characteristics and Organizational Climate. Journal of Applied Psychology, 71, 247-259.
Turner, A. No. and Lawrence, P.R. (1965), Industrial Jobs and the Worker, Boston: Harvard Graduate School of Business Administration.
Vinokur, K.D., Jayaratne, S. and Chess, W.A. (1994), Job Satisfaction and Retention of Social Workers in Public Agencies, Non-Profit Agencies and private Practice. The Impact of Workplace Conditions and Motivators Administration in Social Work: 18, 93-121.
Vroom, V.H. (1960), Some Personality Determinants of the Effects of Participation, Englewood Cliffs, NJ: Prentice Hall.
PRERANA September 2010
M. Mohanasundari and Dr. K. Balanaga Gurunathan 15
A STUDY ON THE CHANGING FACE OF THE INDIAN HEALTH INSURANCE INDUSTRY
1 2M. Mohanasundari and Dr. K. Balanaga Gurunathan
1 M. Mohanasundari, Lecturer, Department of Management Studies, Kongu Engineering College, Perundurai, Erode – 638 052. Handset: 9486763908, E-mail: [email protected]
2 Dr. K. Balanaga Gurunathan, Professor, Department of Management Studies, KSR College of Technology, Tirucehngode – 637 215.
ABSTRACTA decade back health insurance was an arcane word in India. After 2003,
the health insurance market in India has come to life and is an exciting business. It is one of the emerging areas in the Indian insurance industry and it has also grown-up to 30 percent in the year 2008-09. With the entry of the private players and foreign collaboration, penetration of health insurance has gone up. Introduction of new products and channels of distribution along with the penetration of private insurance companies and uncovered markets are the contribution factors for growth. Health insurance is important in the developmental schema of IRDA and has been taking many practical steps in this direction. National Health insurance working group was started by IRDA, which provided an opportunity for various shareholders of the health insurance industry to work mutually and propose solutions for better development of the sector. This article describes the various changing trends in the health insurance sector in India.
INTRODUCTIONIn 1818, a British company - Oriental Life Insurance set up the first
insurance firm in India followed by the Bombay Assurance Company in 1823 and the Madras Equitable Life Insurance Society in 1829. Though all these companies were operating in India, they were meant only for insuring the life of Europeans living in India. Later, some of these companies started providing insurance to Indians with approximately 20% higher premium than Europeans as Indian lives were treated as 'sub-standard' during those days. Bombay Mutual Life Assurance Society was the first company established in 1871, which started selling policies to Indians at a 'fair value'.
Insurance business was brought under the Indian Company Act in 1866. There were no specific regulations, but the Swadeshi Movement in 1905 gave birth to dozens of indigenous life insurance and provident fund companies. In the year 1937 the Government of India set up a consultative committee, which finally gave birth to the Insurance Act, 1938. In October 2000, the Insurance Regulatory and Development Authority (IRDA) issued license papers to three companies, HDFC Life Standard, Royal Sundaram Alliance Insurance Company and Reliance General Insurance. At the same time, 'in-principle approval' was given to Max New York Life, ICICI Prudential Life Insurance Company and IFFCO Tokio General Insurance Company. Today, we have 22 life insurance companies including LIC that are successfully operating in India. The growth of the sector can easily be judged by Figure 1.
PRERANA September 2010
M. Mohanasundari and Dr. K. Balanaga Gurunathan16
Figure 1: Indian Insurance Market ($ bn) : 2001-12
(Source: Krishna Kumar Agarval and Rajesh Kr Upadhyay (Jan 2010), Insurance Chronicle, (pp.65-70) The ICFAI University Press).
According to a study by McKinsey the total life insurance market premiums in India are likely to be doubled and reach a figure of Rs.3.88 - 4.85 Lakh Crores (US$80-100 billion) by 2012.
CHANGING COMPETITIVE ENVIRONMENTAt the time of opening up of the insurance sector in India, the share of
private insurer was very less. As shown in Figure 2, the total share of private insurers was just 2% in 2001-02.
Figure 2: Market Share of Public and Private Insurance Companies
(Source: Krishna Kumar Agarval and Rajesh Kr Upadhyay (Jan 2010), Insurance Chronicle, (pp.65-70) The ICFAI University Press).
Private players gave a tough competition to public sector companies. However, within a short period because of the innovative and customized products, novel distribution channels and aggressive marketing strategies which they employed, the market share of private insurers went up and by the financial year ending 2008, the total share of the private insurers reached an all-time high of 40%.
PRERANA September 2010
M. Mohanasundari and Dr. K. Balanaga Gurunathan 17
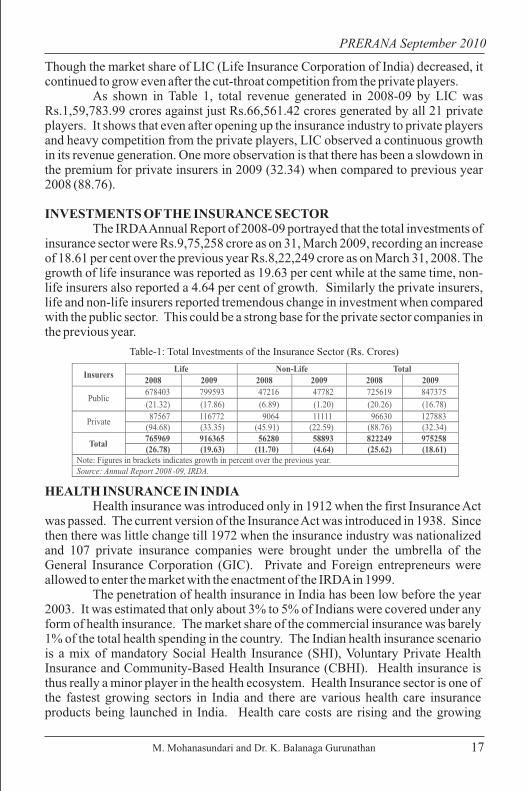
Though the market share of LIC (Life Insurance Corporation of India) decreased, it continued to grow even after the cut-throat competition from the private players.
As shown in Table 1, total revenue generated in 2008-09 by LIC was Rs.1,59,783.99 crores against just Rs.66,561.42 crores generated by all 21 private players. It shows that even after opening up the insurance industry to private players and heavy competition from the private players, LIC observed a continuous growth in its revenue generation. One more observation is that there has been a slowdown in the premium for private insurers in 2009 (32.34) when compared to previous year 2008 (88.76).
INVESTMENTS OF THE INSURANCE SECTORThe IRDA Annual Report of 2008-09 portrayed that the total investments of
insurance sector were Rs.9,75,258 crore as on 31, March 2009, recording an increase of 18.61 per cent over the previous year Rs.8,22,249 crore as on March 31, 2008. The growth of life insurance was reported as 19.63 per cent while at the same time, non-life insurers also reported a 4.64 per cent of growth. Similarly the private insurers, life and non-life insurers reported tremendous change in investment when compared with the public sector. This could be a strong base for the private sector companies in the previous year.
Table-1: Total Investments of the Insurance Sector (Rs. Crores)
Life Non-Life Total Insurers 2008
2009
2008
2009
2008
2009
678403
799593
47216
47782
725619
847375
Public
(21.32)
(17.86)
(6.89)
(1.20)
(20.26)
(16.78)
87567
116772
9064
11111
96630
127883
Private
(94.68)
(33.35)
(45.91)
(22.59)
(88.76)
(32.34)
765969
916365
56280
58893
822249
975258
Total
(26.78)
(19.63)
(11.70)
(4.64)
(25.62)
(18.61)
Note: Figures in brackets indicates growth in percent over the previous year.
Source: Annual Report 2008-09, IRDA.
HEALTH INSURANCE IN INDIAHealth insurance was introduced only in 1912 when the first Insurance Act
was passed. The current version of the Insurance Act was introduced in 1938. Since then there was little change till 1972 when the insurance industry was nationalized and 107 private insurance companies were brought under the umbrella of the General Insurance Corporation (GIC). Private and Foreign entrepreneurs were allowed to enter the market with the enactment of the IRDA in 1999.
The penetration of health insurance in India has been low before the year 2003. It was estimated that only about 3% to 5% of Indians were covered under any form of health insurance. The market share of the commercial insurance was barely 1% of the total health spending in the country. The Indian health insurance scenario is a mix of mandatory Social Health Insurance (SHI), Voluntary Private Health Insurance and Community-Based Health Insurance (CBHI). Health insurance is thus really a minor player in the health ecosystem. Health Insurance sector is one of the fastest growing sectors in India and there are various health care insurance products being launched in India. Health care costs are rising and the growing
PRERANA September 2010
M. Mohanasundari and Dr. K. Balanaga Gurunathan18
awareness about the importance of preventive care has led to growing demand in health insurance products. In the financial year 2003, the health insurance market stood at Rs.1,160 crores while in the year 2008, it had crossed Rs.5,000 crores, recording a growth of more than 4 times in 5 years. Despite the growth, there is still a large need for health insurance in India. As many as 75% people in India are without employer providing coverage and over 85% people are not insured at all. (Health Insurance, 2009)
WILLINGNESS TO JOIN THE HEALTH INSURANCE IN INDIABased on the different types of services, costs and additional benefits,
people make their choice to join in the health insurance. Some of the services, costs and additional benefits rendered by the Health Insurance in India are listed in table 2.
Table 2: Services and Benefits provided by the Health Insurance in India
Types of Services
Types of Costs
Types of Additional Benefits Hospitalization
Non-hospitalized benefits
Chronic illness benefits
General OPD
Specialist consultation
Reproductive and maternity care
Catastrophic coverage
Hospital cash plan
Medical coverage
Drugs & Diagnostic tests
Dental care
Mental health care
Preventive care
Medical equipment
Indirect cost
Fees
Medicines
Diagnostic services
Hospital charges
Specialist consultation cost
Transportation cost
Expenses on drugs
Cost of dental and mental health care
Wage loss
Life insurance
Personal accident
Permanent disability benefits
Reimbursement of wage or income loss
GROWTH TRENDS IN HEALTH INSURANCE Because of this notified focus and attention from all the shareholders,
encompassing investors, IRDA, health service providers and other sectors associated with the internal economic system there has been an inevitable growth in the health insurance sector in India. This fortifiable focus and awareness was due to increasing health problems and expenses. In this connection, the growing general insurance business forced the insurance companies to concentrate on health insurance and other personal lines of business. Concentration of premium rates modification in respect of individual MediClaim policies was carried out in 2007, which were not earlier revised for few years and high revision of rates in all group health policies have also shared to growth in premium. Products launched, especially for senior citizen and children enhanced in popularizing the health insurance.
The health insurance segment which has become popular in recent times has lot of opportunities for better growth and has recorded a growth of 30% in 2008-09 and also plays a vital role in the life insurance business. The growth of health insurance makes life insurance companies to launch health insurance products. The
PRERANA September 2010
M. Mohanasundari and Dr. K. Balanaga Gurunathan 19
IRDA Annual Report of 2008-09 revealed the increase in health insurance premium from Rs.675 crore in 2001-02 to Rs.6625 crore in 2008-09.
Number of persons covered under the health insurance has also seen a steady increase over the years; however it is small vis-à-vis the potential. In the absence of specific financial protection against high medical expenses, the financial impact of hospitalization is more pronounced. To protect the vulnerable groups, the Central and State Governments in association with insurance companies have initiated health insurance programmes to create awareness. Prominent among the government sponsored insurance schemes are the Rajiv Aarogyasri scheme of Andhra Pradesh, the Kalaignar scheme of Tamilnadu and the centrally-sponsored Rashtriya Swasthya Bima Yojana. Table 3 depicts the premium collected in health insurance over the last five years.
Table 3: Total Premium in Health Insurance 2004-2009 (Rs. crores)
Insurers 2004-05 2005-06 2006-07 2007-08 2008-09 Public
1366
1683
1974
3136
3824
Private
304
539
1224
1832
2266
Standalone Health Insurers
-
-
11
156
633
Total
1670
2222
3209
5125
6625
Source: Annual Report 2008-09, IRDA. Page 32
VOLUNTARY HEALTH INSURANCE SCHEMES
In private insurance sector, life insurance companies launched products with additional benefits of health expenses coverage. Premiums paid by all the buyers share the similar risk and insure them for health care expenses. The main difference is that the premiums are set at a level, which contributes a gain to third party and provider institutions. Price of the insurance products fixed by the insurance companies were based on an estimation of the risk condition of the customer (or group of employees) and the benefits level provided, rather than as a proportion of the consumers' income. (Srivastava, 1999 as quoted in Bhat and Malvankar, 2000).
The voluntary insurance schemes are contributed by the public sector, the General Insurance Corporation and its four subsidiary companies (National Insurance Corporation, New India Assurance Company, Oriental Insurance Company and United Insurance Company) and the LIC. For example, LIC offerred Ashadeep Plan II, Jeevan Asha Plan II, Personal Accident Policy, Jan Arogya Policy, Raj Rajeshwari Policy, MediClaim Policy, Overseas Mediclaim Policy, Cancer Insurance Policy, Bhavishya Arogya Policy and Dreaded Disease Policy in the year 1999-2000.
Though various schemes are offered by GIC Mediclaim is its main product. In November 1986, MediClaim (Medical Insurance) was introduced and it covers individuals and groups with persons aged 5 to 80 yrs. Children (3 months to 5 yrs) are covered with their parents. With the help of this scheme, the insured can reimburse medical expenses as an individual towards hospitalization and domiciliary hospitalization as per the insured amount. There are exclusions and pre-existing disease clauses. Mostly premiums are calculated based on age and the sum insured,
PRERANA September 2010
20
which varies from Rs.15,000 to Rs.5 lakhs. Half a million MediClaim policies were issued in 1995-96 and has increased to around 7.2 million during 2000-01.
For the lower class people a scheme named Jan Arogya Bima Policy was introduced with reimbursement coverage of hospitalization costs up to Rs.5,000 annually for an individual premium of Rs.100 a year. This scheme offers a special discount of 30% for a family whereas it does not allow any commission to the agents. Like MediClaim policy, the exclusion mechanism is applicable with this scheme and had limited success. The Jan Arogya Bima Scheme had only covered 4 lakhs individuals by 1997.
Excellent beginning of a new era has started in the year 1999 for health insurance with the bill passed by IRDA. This has thrown a great opening to private and foreign collaborations, and has been created a platform for the arrival of private health insurance companies. For the gradual growth of the insurance industry, the bill also supported the establishment of rights to secure the interest of insurance policyholders by regulating, promoting and ensuring their policies and strategies. The bill sets some rules for foreign promoters to keep paid-up capital up to 26% in an Indian company and demands them to have a capital of Rs.100 crore associated with a business operation plan to begin its business activities.
In the year 2009-2010, insurance companies like Bajaj Alliance, ICICI Lombard, Royal Sundaram, and Cholamandalam started offering various health insurance schemes with lot of additional benefits to the investors which has been another reason for the growth of this sector.
INSURANCE SCHEMES OFFERED BY SOCIAL WELFARE SERVICE PROVIDERS
Social Welfare Service Providers are generally termed as Community-based organization, which offers schemes where members are willing to prepay a certain amount each year with an expectation of specified services. The premium is calculated based on flat rate, so that it is not that much progressive. The main motive of these funds were not making profit but to some extent improving the right to use the services.
There often occurs the problem with adverse selection because of a large number of high-risk members, since premiums are not based on assessment of individual risk status. Exemptions may be adopted as a means of assisting the poor, but this will also have adverse effect on the ability of the insurance fund to meet the cost of benefits.
These schemes are generally offered by Non-Governmental Organizations (NGOs). The reimbursement benefits can be obtained by an individual only in terms of preventive care, though ambulatory and in-patient care are also covered. Increasingly in India, Community Based Health Insurance (CBHI) schemes are negotiating with the for-profit insurers for the purchase of custom designed group insurance policies. Nevertheless, the exposure of CBHI schemes is low due to the poor coverage. A review by Bennett et al., (1998) (as quoted in Ranson and Acharya, 2003) has shown that CBHI schemes have put up with poor design and management and hence have low membership and require extensive financial support. Table 4 provides an overview of some non-profit social insurance schemes.
M. Mohanasundari and Dr. K. Balanaga Gurunathan
PRERANA September 2010
21M. Mohanasundari and Dr. K. Balanaga Gurunathan
Table 4: Non-Profit Social Insurance Schemes in India
S.No Name Location Members Type of insurance 1
ACCORD/ ASHWINI Health Insurance Scheme
Tamil Nadu (Gudalur)
7356 (1997)
Health Insurance
(with NIA)
2
Aga Khan Health Services
Gujarat (Sidhpur)
40000 (1997)
Health insurance
3
Apollo Hospital Association (AHA)
Tamil Nadu (Madras)
10000 (1995)
Health Insurance
(with GIC)
4
ASSEFA (Association of Sarva Sewa Farms)
Tamil Nadu (Madurai)
N.N.
Cattle Insurance Health Insurance
5
Cooperative Development Federation (CDF)
Andhra Pradesh (Hyderabad)
26000
Death Relief Fund
(Life Insurance)
6
Goalpara Cooperative Health Society
West Bengal (Shantiniketan)
1247 (1997)
Health Insurance
7
Kottar Social Service Society (KSSS)
Tamil Nadu (Kanyakumari)
34000
Health Insurance
8
Mallur Health Cooperative
Karnataka
7000
Health Insurance
9
Mathadi Hospital Trust
Maharashtra (Bombay/Mumbai)
150000
Health Insurance
10
Medinova Health Card Scheme
West Bengal (Calcutta)
35000
Health Insurance
11
Navsarajan Trust
Gujarat
10000
Health Insurance (with NIA) Accidental Insurance (with LIC) Nutrition Legal Aid Drugs Fight Against Corruption
12
New Life
Tamil Nadu
N.N.
Health Insurance
13
Organization for Development of People (ODP)
Tamil Nadu (Mysore)
1137
Health Insurance Accidental Insurance (with NIC)
14
Pragati Thrift and Credit Society
–
410
Death Relief Fund
15
Raigarh Ambikapur Health Association (RAHA) Medical Insurance Scheme
Madhya Pradesh (Raigarh District)
75000
Health Insurance
16
Saheed Shibsankar Saba Samity (SSSS)
West Bengal (Burdwan)
6800
Health Insurance
17
Seba Cooperative Health Society
West Bengal (Calcutta)
3000 families
Health Insurance (with GIC)
18
Self Employed Women’s Association (SEWA)
Gujarat (Ahmedabad)
40000
Integrated Insurance Scheme Health Insurance Life Insurance (with LIC) Accident (with NIA) Asset Insurance Maternity Benefit
19
Kasturba Hospital Scheme, Sewagram
Maharashtra (Wardha District)
19457 (1997)
Health Insurance
20
Social Work and Research Centre (SWRC)
Rajasthan (Ajmer)
20000
Health Insurance
21
Society for Promotion of Area Resources Centre (SPARC)
Maharashtra (Bombay/Mumbai)
1200 couples
Health Insurance Accident Housing (with OIC)
22
Students Health Home
West Bengal (Calcutta)
550000
Health Insurance
23
Tribhuvandas Foundation
Gujarat (Anand)
800000
Health Insurance
24
Trivandrum District Fishermen’s Federation (TDFF)
Kerala (Thiruvananthapuram)
Craft & Gear Fund (loan basis) Contingency Fund (death, accidents, loss of work)
25
Urmal Rural Health and Research Development Trust
Rajasthan (Bikaner & Jodhpur)
N.N.
Health Insurance
26
Voluntary Health Services Medical Aid Plan
Tamil Nadu
160000
Health Insurance
27
Kalaignar Insurance Scheme
Tamil Nadu
150000 (2009)
Health Insurance
Source: Patrick Krause (2000), ‘Non-profit Insurance Schemes for the Unorganized Sector in India’, Social Policy Division 42, Working Papers No. 22 e, GTZ
PRERANA September 2010
M. Mohanasundari and Dr. K. Balanaga Gurunathan22
In the year 2009, comparatively the growth of health insurance in India has improved due to the penetration of the private health insurance players. In order to compete in the health insurance market, the private players have introduced lots of new schemes with various tangible and intangible benefits like ICICI Lombard offers Family Floater, Bajaj Allianz offers Star Package, Royal Sundaram offers Health Shield, Reliance General Insurance offers Health Wise Policy, Star Health offers Family Health Optima, Cholamandalam offers Chola Family Insurance etc., which cover Free Health Check-up, Family Discount, Post and Pre-Hospitalization Expenses, Ambulance charges etc.
CONCLUSIONThe preceding sections of this paper portrayed the health insurance scenario
in India. Given the situation, there are few issues of concern or barriers towards implementing a social health insurance scheme in India. These are enumerated below along with the possible way ahead. India is a developing country with 26% population living below the poverty line, and 35% illiterate population with skewed health risks (Social Health Insurance, 2009). Insurance is limited to only a small proportion of people in the organized sector covering less than 10% of the total population.
Currently, there is no mechanism or infrastructure for collecting mandatory premium among the large informal sector. Even in terms of the existing schemes, there is unsatisfactory and derisory information about the various schemes. Data gaps also prevail. Much of the focus of the existing schemes is on hospital expenses. There continues to be lack of awareness among the people about health insurance. In spite of existing regulation in some States, the private sector continues to operate in an almost unhindered manner. The growth of health insurance demands the need for proper regulations and specific criteria for private health insurance providers to decide appropriate services.
Health insurance per se, suffers from problems like adverse selection, moral hazard, cream-skimming and high administrative costs. This is coupled with the fact that in the absence of any costing mechanisms, there is difficulty in calculating the premium. There is also a need to evolve criteria to be used for deciding upon target groups, who would avail the different scheme/s and also to address issues relating to whether indirect costs would be included in health insurance. Health insurance can improve good quality health care only when health care institutions are able to provide tolerable facilities at affordable cost.
Given this scenario, the challenge for Indian policy-makers is to find ways to improve upon the existing situation in the health care sector like innovative products, competitive pricing, alternative distribution channels and aggressive marketing strategies in the industry, to make equitable, affordable and quality health care accessible to the population, especially the poor and the vulnerable sections of the society. It is in a way inevitable that the state reforms its public health delivery system and explores other social security options like health insurance. Implementing regulations would be the best mechanism to control provider behavior and costs. This could be done by developing mechanisms where government and
PRERANA September 2010
M. Mohanasundari and Dr. K. Balanaga Gurunathan 23
households can together pool their funds which could be thought of as one of the ways of controlling provider behavior.
There is an urgent need to document global and Indian experiences in social health insurance. Different financing options, like payment of premium from the source of income, need to be developed for different target groups. The wide differentials in the demographic, epidemiological status and the delivery capacity of health systems are a serious constraint to a nationally mandated health insurance system. Given the heterogeneity of different regions in India and the regional specifications, pilot projects could be undertaken to gather more information about the population to be targeted under an insurance scheme and develop options for different population groups.
Health policy-makers and health systems research institutions, in collaboration with economic policy study institutes, need to gather information about the prevailing disease burden at various geographical regions to develop standard treatment guidelines. This would help them to undertake costing of health services for evolving benefit packages to determine the premium to be levied, subsidies to be given, map the health care facilities available and the institutional mechanisms need to be in place for implementing health insurance schemes. Skill-building for the personnel involved and capacity-building of all the stakeholders involved would be a critical component for ensuring the success of any health insurance programme. The success of any social insurance scheme depends on its design, implementation and monitoring mechanisms which would be set in place and it would also call for restructuring and reforming the health system and developing the necessary prerequisites to ensure its success.
References
Bennett, S., Creese, A., and Monasch, R. (1998), Health Insurance Schemes for People Outside Formal S e c t o r E m p l o y m e n t , W H O G e n e v a ( D o c u m e n t W H O / A R A / C C / 9 8 . 1 ) , http://www.whqlibdoc.who.int/searo/2004/SEA_HSD_274_eng.pdf, Retrieved on December 31, 2009.
Comparison of Family Health Insurance Plans, http://www.bimaworld.com/ healthinsurance.htm, Retrieved on December 31, 2009.
Health Insurance, (2009), http://www.healthinsuranceindia.org/ market_share_of_health_ins_india.asp, Retrieved on December 31, 2009.
IRDA Annual Report 2008-2009, http://irdaindia.org/annualreport09/annual_rep_eng_09.pdf, Retrieved on December 31, 2009.
Krishna Kumar Agarval and Rajesh Kr Upadhyay, (2010), Insurance Chronicle, (pp.65-70) The ICFAI University Press.
Patrick Krause (2000), Non-profit Insurance Schemes for the Unorganized Sector in India. Social Policy Division 42, Working Papers No.22e, GTZ.
PRERANA September 2010
24
PRERANA September 2010
I. Krishna Murthy and T. Anupama 25
AN EMPIRICAL STUDY ON CUSTOMER RETENTION STRATEGIES IN RURAL INDIA: A CASE STUDY ON UAE EXCHANGE
1 2I. Krishna Murthy and T. Anupama
1 I. Krishna Murthy, Assistant Professor, College of Management and Economic Studies, University of Petroleum and Energy Studies, Bidholi Campus, Dehradun. Handset: 09690568342. Email: [email protected]
2 T. Anupama, Assistant Professor, College of Management and Economic Studies, University of Petroleum and Energy Studies, Bidholi Campus, Dehradun. Handset: 09837638699.Email: [email protected] , [email protected]
ABSTRACTBusinessmen took many years to realize that satisfying customers is the key
for making sales and profits in the long run. In this hyper competitive world customers are attracted by competitors with a better service or by giving promotional offers. Mostly companies concentrate on attracting a new customer instead of focusing on the existing customer. Acquiring a new customer costs more than satisfying an existing one. Hence attracting new customers is of less use unless a company identifies the art of maintaining them. A firm accrues several benefits by retaining its customers like increased revenue, decrease in cost of selling, word-of-mouth advertising, cross selling possibilities. Customer profit rate also increases over the life time of retained customers; decrease in attrition rate increases the profits to a company. Many organizations fail to recognize that retaining the customers is an important aspect and generally saddle with unprofitable customers which in turn leads to the detriment of the organization. Many studies have proved that companies are perpetually in customer acquisition mode, spending 75% of their marketing budgets, in the hope that new customer will compensate for lost ones. Traditionally companies have tried to retain the customers by offering financial incentives like discounts, product upgrades, awards prizes and rewards. UAE Exchange is a financial service organization. Since it is a service organization it may have more attrition when compared to a retailer store who sells tangible products. This article presents the results of the study carried on the customer retention strategies adopted by UAE Exchange, Rajahmundry, Andhrapradesh.
INTRODUCTIONAn increase in customer retention of 5% increases the profit by 25% to 95%.
–Frederick Reichheld The 21st century has witnessed dominant buyer and seductive seller markets
and while buyers take complete charge in purchase decision making, the seller constantly tries to woo the customers to buy their products. Getting a customer in today's competitive era is difficult and the more difficult is retaining them. Hence a company needs to analyze the changes in the expectations of customers and should try to match them by delivering value additions, in order to retain them. Many organizations fail to recognize this important point and generally saddle with unprofitable customers. It costs a lot to retain a customer, and almost 15 times as much to acquire a new customer than to retain them. Many studies have proved that companies are perpetually in customer acquisition mode, spending 75% of their
PRERANA September 2010
I. Krishna Murthy and T. Anupama26
marketing budgets, in the hope that new customer will compensate for lost ones, but they overlook the important issue of acquisition costs, which are 7 to 10 times more than retention costs. The longer the business keeps a customer the more profitable it becomes selling to the existing customers, which substantially reduces the cost of marketing. More importantly, the customers base their transactions on 'value for money' and not only on price. On the other hand the products and services of few companies are purchased through encouragement by friends and peers. The growing concern for firms to retain customers has resulted in a focus on customer's equity rather than on brand equity. Therefore, the desire to retain customers has gained tremendous importance in recent times and in this context customer retention strategies enable increased realization of customer lifetime value.
The borderless world owing to reduced trade barriers and the internet has resulted in immense global competition for all players and in addition to that, decreasing brand loyalty has made customer retention a major challenge for companies. The service sector is going through a period of almost revolutionary proportions in which established ways of doing business continue to be shunted aside. Service industry is growing at a rapid pace in comparison to the manufacturing industry and new opportunities in the form of globalization have prompted many companies to fine tune their marketing efforts towards their target markets. To 'attract, build and retain' customers has become critical today, hence Customer relationship Management (CRM) in the service industry is the least buzzword. Technology coupled with a need for delivering better service is putting many companies on their toes and this 'frictionless commerce' tends to raise customers' expectations about services and products and makes them more prone to switching to other service providers. This makes it imperative that service providers must provide best possible products and services to ensure customer satisfaction. CRM in the service industry exists in the following conditions: competitive, multi-supplier scenario where most of the service offerings are similar.
Customers have the choice and liberty to choose and switch over from one supplier to another according to his/her need fulfillment. Service consumption is not a once in a life-time scenario for customer. Demand for service is continuous and repetitive and many CRM initiatives have run into rough weather because the selection of the CRM tool was not done in a judicious manner. The issues that need to be considered while deciding a suitable CRM tool are:
lAbility to incorporate changing requirements since working methods and process keep changing
lUsability from staff point of view since the IT literacy of the staff must be taken into account before investing in ultra –modern tools
lExisting System's assimilation, wherein the tool should enable assimilation and integration of legacy systems that the company had been using
lRobustness and scalability, where in the tool should be operable under all circumstances that can arise and enable scalability with respect to increasing customers, products, geographical locations, etc.
PRERANA September 2010
I. Krishna Murthy and T. Anupama 27
In order to gain a positive value perception, companies need to innovative in their service delivery. Few innovative methods adopted by companies are Less-for–Less; More–for-Less; Same-for-Less and More-for-More. Today customers are expecting More-For-Less and hence firms should be capable of providing greater value, by not charging extra for it, to retain its loyal customers in this trendy inexorable business environment of the new millennium. Value addition is one common strategy employed by companies to retain its customers. By adding more value, the offering becomes better useful to the customers that help in retaining them. Value must be added on the basis of customer attitudes and desires. A peek into the psyche of the customers helps in this regard. For example, preference to eat 'healthy' food is a prominent attitude of customers today. This has prompted marketers of several products to add 'healthy' ingredients to their products. By adding value that is relevant for the customer, the chance of retention increases. Accordingly this study was conducted with the objective of identifying the customer retention strategies adopted by UAE Exchange a service organization.
LITERATURE REVIEWZeithaml et al., (1996) offered a conceptual model of service quality. This
service quality affects particular behaviors that indicate whether customers will remain loyal or leave an organization. The framework consists of numerous components: Decreasing customer defection leads to organizational profitability; Retaining current customers is more cost effective than attracting new ones; Customer defections should be a fundamental component of incentive programs; Advertising is necessary to replace lost customers; Advertising, promotion, and sales costs are expenses required for attracting new customers; At the beginning of the relationship, there is a period of time where customers are non-profitable and it can take approximately four years to recover the sales costs invested in obtaining a new customer; Customer assessments of service quality that are high, lead to positive behavioral intentions, which strengthen the relationship between the individual and the organization. Conversely, assessments of service quality that are low lead to customer behavioral intentions that are unfavorable and result in a weakened relationship. Therefore behavioral intentions are indicators of whether customers will stay with or leave an organization. Reinartz and Kumar (2000) agree with Zeithaml et al., (1996) that it is beneficial to serve customers over a long period of time, their research challenges the expectations delivered from popular literature in the field. Reinartz and Kumar (2000) argue that long-term customers are not always the most profitable customers. They believe the contention that loyal customers are always profitable is a gross oversimplification. Managers should not simply equate increased lifetime spending, decreased costs of service, and lower price sensitivity with retained customers. Their study rejected the notion that long-term retained customers are associated with lower promotional costs and concluded that long-term customers could have an inactive purchasing trend while they are retained within the organization; therefore they are not profitable in those absent time periods. Their tests also indicated that long-term customers are important to an organization, but short-term customers may be just as significant.
PRERANA September 2010
I. Krishna Murthy and T. Anupama28
Cohen et al., (2000) claimed that organizations that struggle with a single approach to satisfy all customers will end up with inefficient and inappropriate levels of service. Organizations must customize their service to satisfy each customer's individual needs, since these needs change from customer to customer. Hence the need arises for organizations to assess periodically the extent of satisfaction derived by their customers with regard to the services offered by them.
OBJECTIVES OF THE STUDYThe objective of the study was to lTo explore the reasons behind customer's loyalty towards UAElTo study the impact of customer retention strategies on the sales of
various products offered by UAE
METHODOLOGY The study was conducted in Rajahmundry, Andhra Pradesh. Target sample
size was kept as 200, since the customer data base of UAE Exchange, Rajahmundry was 1100. For the purpose of the study the entire sample of customers surveyed were categorized into four classes with respect to the usage of products from UAE Exchange namely: Currency Exchange, Air ticketing and tours, Money Transfer and Investment Options.
Stratified random sampling was adopted to select the sample of 200 customers. Based on the type of service opted by the customers they were divided in to strata's and from each stratum 50 customers were selected at random as respondents for the study. The respondents were interviewed and the data was collected using a well-structured interview schedule. The types of services considered were currency exchange, air ticketing and tours, money transfer and investment options. The first section of the questionnaire included questions pertaining to the demographic profile of the respondents. The second section of the questionnaire contained questions regarding the promotional offers offered by the company.
The primary data was collected from company employees to find various facets of the Customer Retention Strategies that were followed at their branch. Secondary data was gathered from the internet, journals and magazines that helped to comprehend and to understand the profile of the company and its products. UAE Exchange brochures helped a lot for a better understanding of the company's services that are being provided. The study was carried out between the periods April 2009 – August 2009.
Simple percentages were worked out to study general characteristics like age, gender, education, awareness, customer usage of products; retention strategies etc. The sample respondents were asked to indicate the satisfaction levels on excellent, good, moderate, bad and worst. Customer loyalty towards the company was discovered by identifying the satisfaction level of the customers and reasons for retention. Chi Square test was carried to find the relation between the two sets of variables i.e. types of services availed by the customers, their satisfaction levels and customer willingness to avail the services again.
PRERANA September 2010
I. Krishna Murthy and T. Anupama 29
ANALYSIS AND DISCUSSION Tabulation of the retention strategies of UAE Exchange and drawing its
impact on business in terms of profit generation would give a clear picture to identify the impact of business performance due to retention strategies.
Table 1 gives the responses of the respondents pertaining to the variables: Awareness through different channel, Usage of products, Retention strategies with respect to the products like-Currency exchange, Air ticketing and tourism, Money Transfer, Investment options Frequency of service usage, Promotional offers of the company, Satisfaction levels with respect to Courteousness and Helpfulness of Employees, Ambience and Layout of the Company, Customers response towards the quality, Respondents who are willing to avail the service again.
Table 1: Demographic Profile of the respondents
Demographic factors Variables Number of Respondents
Percentage
20 – 30 years 42 21
31 – 40 years 78 39
41 – 50 years 62 31
Age of respondents
Above 50 years 18 9
Male 164 82Gender
Female 36 18
Less than High School 32 16
Bachelors degree 132 66
Education
Masters degree 36 18
Personal 38 19
Referral 94 47
Advertising 22 11
Awareness through channel
Company Employees 46 23
Currency Exchange 148 36
Air ticketing 118 29
Money Transfer 56 14
Tourism 18 4
Customers usage of the Products
Investment Options
70
17
Price Discount
96
64
Prompt Service
28
19
Reliability
16
11
Retention strategies (Currency Exchange)
Nearer to Market Place
8
6
PRERANA September 2010
I. Krishna Murthy and T. Anupama30
Demographic factors Variables Number of Respondents
Percentage
Reliability 24 18
Prompt Service 28 21
Rates and Charges 40 29
Credit 30 22
Retention strategies (Air ticketing and tourism)
Customized Service 14 10
Faster Service 24 22
Reliability 16 14
Retention strategies (Money Transfer)
No other marketer 72 64
Good advisory services 6 8
Loyalty towards products
34 49
Customized service 26 37
Retention strategies (Investment options)
Others
4
6
Once in a Month vice d
114No
57
Once in 3 Months
34
17
Once in 6 Months
24
12
Frequency of service usage
More than 6 Months
28
14
Yes
128
64Privilege card Holders
No
72
36
Regular Visit
44
53
Brochures
16
19
Hording
8
9
Promotional offers of the company
Company Employees
16
19
Excellent
44
22
Good
96
48
Moderate
52
26
Bad
8
4
Courteousness and Helpfulness of Employees
Worst
0
0
Excellent
28
14
Good
108
54
Moderate
56
28
Bad
8
4
Ambience and Layout of the Company
Worst
0
0
PRERANA September 2010
I. Krishna Murthy and T. Anupama 31
Demographic factors Variables Number of Respondents
Percentage
Excellent 94 47
Good 62 31
Moderate 28 14
Bad
16
8
Customers response towards the quality
Worst
0
0
Definitely
232 56Respondents who are willing to avail the service again
Most likely
104 25
Most unlikely
60
15
Definitely Not
14
4
Yes
174
87
Customer willingness to refer company Services
No
26
13
The above constructed table depicts that among 200 respondents 82% are male and 18% are female and the respondents mostly from Rajahmundry area were in the age group varying between 31 to 50 years and their education levels are Graduation (66%). It is observed that 47% customers are referred through the satisfied Customers, from this it can be understood that most of the customers are satisfied with the company services and they serve as ambassadors promoting services offered by the company. Though the sample size is two hundred but customer has choosen more than one option in availing the services so the total is not equal to the sample size. It shows that most of the customers are availing Currency exchange and Air ticketing services and very less number in tourism. UAE retains majority of its customers (64%) due to price discount offered and prompt service and also providing service at best rates. Charges and Credit are also main strategies to retain customers.
As company is having their own products in Money Transfer they are the Monopoly in the market. So they have highest number of customers in that segment (64%). Instead of concentrating on direct marketing, the company's customers have involved themselves in promoting the services of UAE which implies that they have good cross selling activities because 49% of the respondents are loyal towards the products. It is observed that customers are regular to the company. 57% of the customers go once in a month because company is having wide range of products. 64 % of respondents possess customer Privilege Card which is useful to avail the service for price discount. It is observed that 53% of respondents are aware of Promotional offers due to regular visit.
PRERANA September 2010
32
With regard to the satisfaction levels 48% of the respondents are satisfied with the company employees namely Courteousness and Helpfulness, 54% are satisfied with the Ambience and Layout, 47% of respondents response is excellent towards the quality of the service given by the employees of the branch. It is also observed that 56% of the respondents are willing to avail the service again. It shows that company is having good retention strategies and 87% customers are interested to refer the new customers because the company is providing quality service to the existing customers.
Table 2: Type of service and satisfaction levels of customers
Satisfaction levels
Types of service
Excellent
Good
Moderate
Bad
Worst
No of respondents
Currency Exchange
14
84
42
8
0
148
Air ticketing & tours
8
72
36
12
8
136
Money Transfer
26
14
16
0
0
56
Investment Options
6
42
14
2
6
70
Total
54
212
108
22
14
410
Table 3: Type of service and customer willingness to avail the service again
Frequency of customer willingness to avail the service again Service
Definitely
Most likely
Most Unlikely
Definitely Not
No. of respondents
Currency Exchange
108
24
16
0
148
Air ticketing & tours
64
36
30
6
136
Money Transfer
42
14
0
0
56
Investment Options
18
30
14
8
70
Total
232
104
60
14
410
A quantitative test was conducted in order to identify if there existed any relation between the types of service used and satisfaction levels with respect to the service, willingness to avail the services again (table 2 and 3). The test results using Chi Square analysis suggests that there exists very strong evidence against null hypothesis results with Chi Square = 87.71, and Correlation=0.41, Chi Square = 74.4, and Correlation=0.39 for the satisfaction level of customers and willingness to avail the service again respectively. Using the above results it can be stated that customer usage of products is dependent on satisfaction levels and also type of service used is dependent on customer willingness to avail the service again.
Currency exchange is one of the services that are widely used by the customers and they are highly satisfied with the service so they are willing to use the service again. Air ticketing and tours can be concentrated by the company because they have loyal customers with high levels of satisfaction. RESULTS AND DISCUSSION
The general characteristics of the respondents like age of the respondents, gender and educational levels were collected to study the consumer profile. Majority
I. Krishna Murthy and T. Anupama
PRERANA September 2010
I. Krishna Murthy and T. Anupama 33
of the respondents were graduates and 82% of the customers using the services are males and out of which 39% are between the age group 20 to 30 years. 47% of the customers are aware of the system through referral policy and least (19%) through advertising.
These figures were taken as base and were further worked upon and the retention strategies and satisfaction levels specifically was analyzed. Maximum customers are availing Currency exchange (74%) and Air ticketing (59%) services and very less number in tourism (9%). Further maximum customers (65%) are retained towards the company due to the Currency Exchange product given at a price discount. The company retains its customers towards Air Ticketing and Tourism by giving credit facility and their flexible customer tailored charges and rates. As company is having their own products in Money Transfer and being Monopoly in the market, they are able to retain highest number of customers (64%). The study reveals that the company instead of concentrating on direct marketing they have established good cross selling activities because of their loyal and satisfied customers.
Chi Square test results reveal that the usage of the different type of service depended on the satisfaction level of the customers with respect to the service and on the frequency of customer willingness to avail the service again.
CONCLUSIONUAE Exchange has wide range of product category due to that reason most
of the customers are interested to select as destination for them to avail more services. Mostly customers avail the services in currency exchange and air ticketing. It faces tough competition from the private players in foreign currency exchange market but due to its good retention strategies it is retaining its customers. Good worked out strategies are 'price discount' in currency exchange, best rates and charges are quoted in air ticketing, in money transfer, faster services and customized service in investment options. Most of the customers are Privilege card holders. Along with good customer service they retain them by adopting strategies like lucky draws, credit points to the customers, contests gifts, price discounts etc., which increased the profits of UAE Exchange, Rajahmundry. Estimated value calculated from the analysis depicts that customers of this branch may increase to around 1400 by the end of year 2010. It is doing highest business through referral marketing. This is only possible factor when a customer gets satisfied with the service of an organization. Company should develop their services in Air ticketing and try to increase awareness about the promotional offers of the Company and also have to develop their brand awareness in Rajahmundry and its surrounding areas.
References
Ahmad, R. and Buttle, F. (2002), Customer retention management: A Reflection on theory and practice. Marketing Intelligence and Planning, 20 (3), 149 - 161.
Cohen, Morris A., Cull, Carl, Lee, Hau L. and Willen, Don. (2000), Saturn's Supply-Chain Innovation: High Value After-Sales. Sloan Management Review, 41, 93.
Dawkins, P.M. and Reichheld, F.F. (1990), Customer retention as a competitive weapon, Directors and Board, Summer, 42-47.
PRERANA September 2010
I. Krishna Murthy and T. Anupama34
Helm, S., Rolfes, L. and Günter, B. (2006), Suppliers' willingness to end unprofitable customer relationships: an exploratory investigation in the German mechanical engineering sector. European Journal of Marketing, 40 (3-4), 366 - 383
Reinartz, Werner J. and Kumar, V. (2000), On the Profitability of Long-Life Customers in a No contractual Setting: An Empirical Investigation and Implications for Marketing. Journal of Marketing, 64, 17.
Stauss , B. , Chojnacki , K. , Decker , A. and Hoffmann, F. (2001), Retention effects of a customer club. International Journal of Service Industry Management, 12 (1), 7 - 19.
Weinstein, A. (2002), Customer retention: a usage segmentation and customer value approach. Journal of Targeting, Measurement and Analysis for Marketing, 10(3), 259-268.
Zeithaml, Valarie A., Berry, Leonard L. and Parasuraman, A. (1996), The Behavioral Consequences of Service Quality. Journal of Marketing, 60, 31-46.
PRERANA September 2010
N. S. Santhi and Dr. K. Balanaga Gurunathan 35
EFFECTIVE RETURN ON TAX SAVING MUTUAL FUND SCHEMES1 2N. S. Santhi and Dr. K. Balanaga Gurunathan
1 N. S. Santhi, Research Scholar, Anna University of Technology Coimbatore, Coimbatore. E-Mail: [email protected]
2 Dr. K. Balanaga Gurunathan, Professor, Department of Management Studies, KSR College of Technology, Tirucehngode - 637 215.
ABSTRACTSavings are the tool used by a person or an organization that abstains from
present consumption for a future use. Investment is an activity that is engaged by people who have savings with the aim of achieving additional income or growth in values. Investors may have different aims for investing their money namely capital appreciation, regular return, safety, proud of holdings, additional return and tax benefits while few investors consider other promised benefits like retirement benefit, accident coverage, etc. They seek an investment area which fetches them maximum return at minimum or moderate risk. Investors expect safety of funds and regular payment of interest. The interest on bank deposits and postal saving are low in comparison to the investment in securities market. This paper aims to compare the return on the investment in bank and tax saving mutual fund schemes taking in to consideration the effective interest rates also. This study will help investors to evaluate their portfolio.
INTRODUCTION Savings are the tool used by a person or an organization that abstains from
present consumption for a future use. Investment is an activity that is engaged by people who have savings with the aim of achieving additional income or growth in values. Fischer and Jordon (1994) defined investment "as a commitment of funds made in the expectation of some positive rate of return".
Investors may have different aim for investing their money such as capital appreciation, regular return, safety, proud of holdings, additional return and tax benefits. They may expect to get back the money along with interest at a future date or the purpose may be the price appreciation on their investment or they may invest their money to get regular income from their investment. Many investors consider other promised benefits like retirement benefit, accident coverage, etc. They seek investment areas where they can get maximum return at a minimum risk. Some investors are ready to face risk to get maximum returns.
Generally individual investor expects security on their investment. Safety of funds and regular payment in the mode of interest is expected by everyone. This can be possible only on bank deposit/postal saving. Comparatively the returns of bank deposits are low than the investment in securities market. Among all other available investment options few investor looks into the tax relief they are likely to get through investments along with an optimal return on their investment.
Hence an attempt has been made in this paper to compare the return on the investment in bank and tax saving mutual fund schemes taking in to consideration the effective interest rates also. The dividend declared tax saving mutual fund schemes which are launched during the year 2000-05 have been selected for the purpose of study. This study will help investors to evaluate their portfolio.
PRERANA September 2010
N. S. Santhi and Dr. K. Balanaga Gurunathan36
INVESTMENT PATTERNThere are various investment plans available in the financial market to help
investors to choose a suitable area to make their investment. Figure 1 in Appendix portrays the various investment avenues available for investors as given by Vashist and Gupta (2005). The objective of an investor could be categorized as safety of investment, liquidity position and return on their invested money. The return on investment may further be classified into capital gain and the rate of return on investment as interest or dividend.
Every investor expects to get maximum economic advantage from their investment. Investment avenues are based upon the rate of return, risk and uncertainty, capital appreciation, marketability, tax advantage and convenience of investment. Table 1 gives clear picture which helps the investors' to take their investment decisions on various financial market instruments.
Table 1: Summary Evaluation of Various Investment Avenues
Return
Investment
options
Return yield
Capital Appreciation
Risk liquidity
Marketability
Tax shelter
Convenience
Equity shares
Low
High
High
Fairly High
Section 80C benefit
High
Non-Convertible Debentures
High
Negligible
Low
Average
Nil
High
Equity Schemes
Low
High
High
High
Section 80C benefit
Very high
Term Deposits
Under Tax benefit scheme
Moderate
Nil
Negligible
High
Section 80C benefit
Very high
Public Provident fund
Nil
High
Nil
Average
Section 80C benefit
Very high
Life Insurance Policies
Nil
Moderate
Nil
Average
Section 80C benefit
Very high
Residential House
Moderate
Moderate
Negligible
Low
Section 80C High
Fair
Gold and Silver
Nil
Moderate
Average
Average
Nil
Average
This paper seeks to have result for, Do the bank deposit returns and tax saving mutual fund schemes return vary?
PRERANA September 2010
N. S. Santhi and Dr. K. Balanaga Gurunathan 37
METHODOLOGY The study is descriptive in nature and used data collected from secondary
sources. To find out the result for the objective of the study the returns of dividend declared tax saving mutual fund schemes launched during the year 2000 to 2005 have been selected and the study period was selected from 2006-07 to 2009-10 up to February 2010. To examine the performance of selected tax saving mutual fund schemes and bank return, various tools are being used. Rate of return, Standard deviation, Dividend yield ratio has been selected to examine the performance of selected tax saving mutual fund schemes and future value. Effective interest rate is taken to analyze the bank returns.
Net Asset Value (NAV) is a term used to describe the value of an entity's assets less the value of its liabilities. Higher the rate of return shows better performance of the fund. It can be computed as
Ri = NAV i – NAV * 100%1 i0
NAVi0
Where, i is the number of fundsRi is the rate of return of portfolio iNAV is the net asset value of funds at current evaluation period i1
NAVi is the net asset value of funds at previous evaluation period0
Standard Deviation of fund measures the volatility level of return rates. The volatility level also describes the risk level. Usually, for higher rates of return the risk level will also become higher. Hence, the study includes standard deviation as the measure of risk level. It can be computed as
m 2ói = Ó (R -R)j=1 ij
m-1
ó = Standard deviation for portfolio iith R = Rate of return for portfolio i on j monthij
R = Average return rates of m months.m = Time period
Future value can also be used to calculate the future value of the deposits in a bank. Money has time value. The amount deposited in a bank will be increased with relation to the time. It can be calculated as
nFuture Value = p(1 + k)
Where, k is the rate of interest n is the number of years p is the amount deposited
PRERANA September 2010
N. S. Santhi and Dr. K. Balanaga Gurunathan38
Dividend yield is a financial ratio which shows how much a company pays out in dividends each year relative to its share price. Dividend is one form of return that the investor can get on their investment. In the absence of any capital gain, the dividend yield is the return on investment for a stock. It can be calculated as
Dividend yield = Annual Dividends per share
Price per share
Effective interest rate is also called as effective annual interest rate. It is the annual interest rate that accounts for the effect of compounding. It can be calculated as
pEffective interest rate = (1+R/P) -1
Where, R is the nominal rate P is the number of compounding periods.
ANALYSIS OF TAX SAVING MUTUAL FUND SCHEMESPerformance of the fund determines the interest of investors. Investors
generally do not compare all the schemes and distribute their funds. But they want positive NPV on their investment. By comparing returns of various avenues the investor can know the better investment area. When a company trades their funds, the performance of the funds determines the capital appreciation of the funds. The fund appreciation increases the share trades and the investors actively involved in the purchase and selling of shares. Table 2 shows the NAV return of selected tax saving mutual fund schemes during the year 2006-07 to 2009-10 till February.
Table 2: Net Asset Value of Tax Saving Mutual Fund Schemes
2006-07 (APRIL 1, 2006 TO MARCH 31, 2007)
Company Name
APR
MAY
JUN
JUL
AUG
SEP
OCT
NOV DEC JAN FEB MARDBS Chola tax saver fund
5.05
-3.91
-17.16
2.53
9.06
6.84
5.35
6.34 1.15 2.94 -8.46 -9.86HDFC long term advantage fund
NAV return of selected tax saving mutual fund schemes moves in a similar direction during the study period from 2006-07 to 2009-10 up to February 2010. NAV return of all the schemes shows negative return in the month of June 2006, March 2007, and January 2008 to March 2008, June 2008 to November 2008, February 2009 and March 2009. No scheme falls in a pattern which helps to determine their return. During the year 2008-09 all the schemes produced maximum negative return. On the other hand during the year 2009-10, till October 2009 there were no negative returns in all the schemes. It also has been noted that there was a fluctuation in all the months during the period of study.
STANDARD DEVIATIONStandard deviation has been used to measure the volatility of selected tax
PRERANA September 2010
N. S. Santhi and Dr. K. Balanaga Gurunathan40
saving mutual fund schemes. The volatility also denotes the risk level. Usually, there will be high risk for high returns. Hence, the standard deviation was included to measure the risk level. The following table shows the risk level of selected funds.
Table 3: Volatility of the Funds
Company Name
Standard Deviation
DBS Chola tax saver fund
2.444124
HDFC long term advantage fund
42.56922
ING tax saving fund 3.452677 Kotak tax saver 3.323016 Principal personal tax saver
100.9975
Reliance tax saver fund
2.398889
It can be noted from Table 3 that the fund volatility is very high for Principal
personal tax saver and low in Reliance tax saver fund.
RETURNS IN THE FORM OF DIVIDENDDividend is one form of return that the investors can get on their
investment. Not all the company declared their dividends in all the years during the study period from 2006-07 to 2009-2010 up to February 2010. From Table 4 it can be understood that the highest dividend was given by Principal personal tax saver and Reliance tax saver fund provides the lowest dividend. Hence it can be stated that there is a relation between the risk and return.
Table 4: Dividends Declaration
Rs. Per Unit NAME OF THE COMPANY
2006-07 2007-08 2008-09 DBS Chola tax saver fund 1 - - HDFC long term advantage fund 6 6 3.5 ING tax saving fund 4 - - Kotak tax saver 3 3.5 - Principal personal tax saver - 82 - Reliance tax saver fund 1 1 1.5
Source: www.moneycontrol.com, Retrieved on March 26, 2010
Principal personal tax saver declared (maximum) Rs.82/unit dividend in the year 2007-08. DBS Chola and Reliance tax saver fund declared (minimum) Rs.1/unit dividend in the year 2006-07.
Table 5 shows the dividends returns of the selected tax saving mutual fund schemes.
Table 5: Dividends Yield Returns
Company Name Inception Year 2006-07 2007-08 2008-09 DBS Chola tax saver fund
2005
0.08
-
-
HDFC long term advantage fund
2000
0.13
0.09
0.08
ING tax saving fund
2004
0.26
-
-
Kotak tax saver
2005
0.24
0.25
-
Principal personal tax saver
2002
-
1.16
-
Reliance tax saver fund
2005
0.08
0.08
-
PRERANA September 2010
N. S. Santhi and Dr. K. Balanaga Gurunathan 41
It can be noted from Table 5, that highest return on dividend was given by Principal personal tax saver in the year 2007-08. It also can be noted that Principal personal tax saver has not declared any dividend during the year 2006-07. HDFC declared Rs. 6/unit in the year 2006-07 and 2007-08. No company have declared the dividend in the year 2008-09 except HDFC long term advantage fund and Reliance tax saver fund.
FUTURE VALUEAlways money has time value. A rupee today is more valuable than a rupee
a year. Money deposited today has future value after certain period. Hence future value of money was calculated to know the value of investment. Table 6 shows the interest rate announced by RBI during the year 2006-07 to 2008-09. It can be noted that the interest rate has been reduced to 7% in the year 2008-09.
Table 6: Interest Rates
Year
< 1 Years
1-3 Years
Above 3 Years
2006-07
9%
9.75%
9.75%
2007-08 10.5% 11% 11% 2008-09
7%
8%
8.25%
Source: RBI Annual reports
Table: 7: Future Values of Deposits
Year < 1 Years 1-3 Years Above 3 Years 2006-07
1.09
1.32
1.59
2007-08
1.11
1.37
1.69
2008-09
1.07
1.26
1.49
Table7 shows the annually compounded interest returns. The rupee value
of Rs 1000 in the year 2008-09 increased to Rs. 1260 in the year 2012-13 at the rate of interest of 8%.
EFFECTIVE RATE OF INTERESTEffective rate is the interest rate on financial product restated from the
nominal interest rate as an interest rate with annual compound interest. Effective interest rate differs from the nominal rate.
Source: RBI Annual reports
Table 8: Effective Interest Rate
Year 1-3 Years 3-5 Year s Above 5 Years 2006-07
9.0
10.1
10.1
2007-08
10.5
11.4
11.5
2008-09
7.0
8.2
8.5
Table 8 shows the effective interest rate. It can be inferred that the return is
high for three years and above. The effective interest rate will be 10.1% where the nominal rate of interest is 9.75%. An investor depositing Rs.1000 at 8% interest rate in bank gets Rs.1,303 at the end of an year.
Source: RBI annual reports
PRERANA September 2010
N. S. Santhi and Dr. K. Balanaga Gurunathan42
Table 9: Return of Tax saving Mutual Fund Schemes
Schemes
3 years dividend
return alone
NAV as on
February 2010
No. of Units on 2006
Unit value as on February 2010
Total Return
(Dividend +
Unit Value)
DBS Chola tax saver fund
80.23
13.163
80
1053
1133.3
HDFC long term advantage fund
356.25
34.453
23
792.42
1148.7
ING tax saving fund
242.09
12.223
61
745.6
987.69
Kotak tax saver
484.06
9.657
74
714.62
1198.7
Principal personal tax saver
702.41
69.302
15
1039.5
1741.9
Reliance tax saver fund
256.83
13.701
73
1000.2
1257
The Table 9 shows the return of selected tax saving mutual fund schemes during the year 2006-07 to 2009-10 till February 2010. It can be noted from the table that the return of all the tax saving mutual fund schemes are lower than bank returns except Principal personal tax saver. All the tax saving mutual fund schemes had NAV less than its purchase value on April 2006. If the investor made investment of Rs. 1000 on a bank, the investor may get Rs. 1,303 with interest and if they had invested in tax saving mutual fund schemes they are likely to get less then Rs. 1,303. If they invested in DBS Chola tax saver fund they may get only Rs. 1,133 and Rs. 987.69 if they invested in ING tax saver fund on February 2010. Security market is highly volatile, prediction on this market in not possible. It can be accepted through this study. There is no pattern on the NAV return. Many factors like global economy position, natural calamities, political change, etc., affects the return of security market. Investment in Bank is highly secured in the above mentioned periods.
CONCLUSIONThis study tries to compare the return of bank deposit and tax saving mutual
fund schemes. The volatility of the fund has been analyzed by using standard deviation. The return of the tax saving mutual funds has been analyzed by using dividend yield return ratio. The bank returns has been analyzed by using Effective rate of return. The main findings of the study are that, the return from tax saving mutual fund is low and volatile than bank return. The NAV of all selected tax saving mutual fund schemes was negative during February 2010 and only few companies declared their lowest dividends.
The study brings out the current market status. In general the return from mutual fund is higher than bank but the present study shows that the return of all selected tax saving mutual fund is not higher than bank return. RBI regulates all the banks and standardizes all operations. It is necessary to create regulatory framework to safeguard the mutual fund investors. The authority of mutual funds and AMFI should involve into this area and may take necessary steps to protect the investors in the form of regular return, low risk and capital appreciation.
PRERANA September 2010
N. S. Santhi and Dr. K. Balanaga Gurunathan 43
References
Avadhani, V. A. (2004), Security and Portfolio Management. New Delhi : Himalaya Publishing House.
Batra, G. S. and Dangwal, R. C. (2008), Financial Services. New Delhi: Deep & Deep Publications Pvt Ltd.
Bhalla, V. K. (2008), Investment Management Security Analysis and Portfolio Management. New Delhi: S. Chand and Sons.
Dhanesh Kumar Khatri, (2008), Investment Management and Security Analysis. New Delhi: Macmillan.
Donald, E. Fisher, and Ronald, J. Jordan. (1994), Security Analysis and Portfolio Management. New Delhi: PHI (P) Ltd.
Kevin, S. (2009), Portfolio Management. New Delhi: PHI (P) Ltd.
Punithavathi Pandian, 2006), Security Analysis and Portfolio Management. New Delhi: Vikas Publishing House.
Reilly and Brown (2009), Investment Analysis and Portfolio Management. New Delhi: Cengage Learning.
Vashist, A.K. and Gupta R.K. (2005), Investment Management and Stock Market-Strategies for successful investing. New Delhi : Deep & Deep Publications Pvt Ltd. (P.10)
PRERANA September 2010
44
1. Blue chip shares 2. Growth share
3. Income share 4. Cyclical share 5. Speculative share
Equity Shares
Financial Assets
1. Treasury Bill
2. Commercial purpose
3. Certificate of Deposits
Money Markets Investments
Mutual fund
Schemes
1. Equity shares
2. Debt Schemes
3. Balanced Schemes
Real Estate
1. Agriculture Land
2. Semi Urban Land
3. Time share in a
Holiday Resort
Non Marketable
Financial Assets
1. Bank Deposits 2. Post office Deposits
3. Co-Operative Deposits
4. Public Provident
Fund Deposits
Bonds
1. Government Securities
2. GOI Relief Bonds
3. Govt. Agency
Securities
4. PSU Bonds
5. Debenture of Private
Sector Companies
6. Preference schemes
1. Endowment Assurance Policy
2. Money Back Policy
3. Whole Life Policy
4. Back Term Assurance Policy
LIC Policies
Financial Assets
1. Gold & Silver
2. Precious Stones
3. Art Objects
Money Markets
Investments
Financial Derivatives
1. Options
2.
Futures
AppendixFigure 1: Various Investment Avenues
PRERANA September 2010
45T. Frank Sunil Justus, T. Sunitha and Dr. M. Ramesh
Case Study: A PREAMBLE TO EMPLOYEE ENGAGEMENT PRACTICES
1 2 3T. Frank Sunil Justus , T. Sunitha and Dr. M. Ramesh
1 T. Frank Sunil Justus, Faculty, Department of Business Administration, Annamalai University, Annamalai Nagar - 608002. Email: [email protected]
2 T. Sunitha, Faculty, Department of Business Administration, Annamalai University, Annamalai Nagar - 608002
3 Dr. M. Ramesh, Faculty, Department of Business Administration, Annamalai University, Annamalai Nagar - 608 002
ABSTRACTEmployees with rented house mentality never work to their full potential
and they are never in a position to appreciate the goodwill shown by the management. People with an own house will always look for ways and means to improve, furnish and maintain the house as good as possible. Hence management should ensure that they are creating an environment where employees do have an own house mentality. Organization should understand that employees do not work for money alone and content elements of the job like responsibility, recognition, advancement, the work itself and personal growth act as motivator. Employee should be motivated to submit suggestions and modifications and when found apt may be implemented. This provides a creative instinct which acts as an intrinsic motivator to employees. It is always easy to retain satisfied employees and this is possible only when employees do have an own house mentality.
INTRODUCTIONDiamond Chemicals Ltd. was a huge chemical industry with an annual
turnover of Rs.500 crores with employee strength of six hundred and engaged in the manufacture of heavy chemicals. It is situated in Tamil Nadu in an industrial area, on a belt known for peaceful industrial relations. The native people of the area are usually hard working, submissive and carry a sense of pride in their work. Their attitude was high in affective component and they preferred calling themselves as Diamond men rather than employees of Diamond chemicals. The company took good care of its employees by providing them all amenities, good transport facilities, quarters, health care and one of the best salary packages in the state. The production in the plant was always beyond set targets and their product quality was far better than competing companies.
ORGANIZATION OVERVIEWThe company basically had employees at two tiers, staff cadre and
management cadre. The staff cadre had employees from A to G level, 'A' being senior technician down to 'G' which is the lower most cadre having non technical personnel like sweepers, etc. The management cadre had eight hierarchical levels viz., Engineer, Senior Engineer, Manager, Senior Manager, Chief Manager, Joint General Manager, General Manager and Executive director. Senior technician in A cadre for more than ten years were occasionally promoted to management cadre as officers
PRERANA September 2010
T. Frank Sunil Justus, T. Sunitha and Dr. M. Ramesh46
(probably one out of ten employees may get the promotion chance and this was purely based on performance and attitude of the employee. When promoted they will be designated either as operation or maintenance engineer based on their departments).The training system in the company is one of the best in the country and has churned out knowledgeable and disciplined employees through ESS (Engineering Subordinate Services) and EMS (Engineering Management Services) program for staff and officer cadre respectively.
BACKGROUND OF THE CASEThe Executive Director Mr. Joseph called the Chief Manager
(Administration and Personnel) Ms. Margaret to discuss with her a problem in hand. Three large industries had come up in the vicinity of their industry. The company suddenly found that a considerable number of first and second level officers as well some senior technicians had left to these nearby concerns. The company prior to that had also sent some of its supervisory talent on deputation to its sister concerns situated abroad. Earlier when someone had left a job there was always someone else to take up the responsibility. Hence the Executive Director was so particular in retaining the employees available in the company. The company never had a habit of hiring employees from other concern. They always picked up people fresh from colleges trained and molded them to suit their organization.
OBJECTIVE OF THE CASEThe objective of the case is to initiate a discussion on the various techniques
followed by organization around the globe to improve their employees' satisfaction on the job and to find what is suitable to be applied to a traditional Indian Industry. It also makes a comparison of the equivalent facilities already existing in the industry. It also sees how certain factors are applicable to independent departments.
THE RENTED VERSUS OWN HOUSE MENTALITYMs. Margaret pondered on what she has to do to ensure that people stay with
her concern. As the head of Personnel and Administration she was in charge for the allocation and maintenance of company quarters numbering about two hundred flats. Based on this experience she felt that people living in a rented house will always love to own a house. They do not care about the damages they make to the rented house. They wait for the day, when they can shift to their own house. People living in an own house will always look for ways to better their house. The own house provides a Pygmalion effect which enables the individual to see everything around them in a satisfied way. Employees with rented house mentality never work to their full potential and they are never in a position to appreciate the goodwill shown by the management. Hence a mutual animosity exists between the management and such employees. Ms. Margaret believed that the management should always build up an atmosphere whereby the employees always have an own house mentality. People with an own house will always look for ways and means to improve, furnish and maintain the house as good as possible. So she thought of looking ways wherein organization can create an own house mentality in their employees.
PRERANA September 2010
T. Frank Sunil Justus, T. Sunitha and Dr. M. Ramesh 47
Values: The first thing that came to her mind was the value system that was inculcated in each employee. She herself was an EMS trainee being an Electrical Engineer and was Manager Maintenance before shifting to personnel portfolio. She joined this organization which is supposed to be one of the best training organizations in the country. She remembered her first day when she was taken around this company and was shown how house – keeping was to be maintained. The next day she was taken to a neighboring concern only to be shown what poor house – keeping was. This kind of value inheritance differentiating the good and the bad, she ascertained, right at the start of the career will establish the right attitudes in the employee.Importance to Employees: Employees she believed should be treated as the organizations most valuable clients. She remembered what President Ramesh Maheswari of Texmaco talked about the concern of employees Shri. K.K. Birla had as, “round 1979, we acquired for the (nominal) of Re 1 the land and immovable appurtenances of G.D. Kothari's Modern India Construction Counselor. Ltd., Sodepur, which had been lying shut for five years, rendering about 600 workers jobless. Specifically, we agreed to take back every single worker, ignoring the bogey of over manning. This was in pursuance of our firm's conviction that a unit's assets are not just land, plant and machinery, but more importantly its workers.” This showed the importance the management attaches to its employees which he was sure his company was also following. Her own Managing Director often asserted that the greatest asset of his company was the well trained human resources available in his company.Performance appraisal system: She was dissatisfied with the performance appraisal system followed in her company. They were still continuing with the stale age old performance appraisal system done by disinterested managers who were proficient in technical skills rather than in man management skills and do it more as a part of their work rather than as their responsibility. A careful observation of a 360 degree appraisal will present a different picture of the performance of the employee. Potential appraisal is a process of determining an employee's strength and weakness with a view to using this as a predictor of his/her future performance. Potential appraisal can be used to dampen situations of low performance caused by temporary stress situations. She remembered an excellent and knowledgeable employee Mr. Sabapathi who was very good in his work. Suddenly due to family problems he became an alcoholic and became a chronic absentee and if at all he came was erratic in his work. After about two years and with the active support of the company he is back and at present a more responsible worker than he ever was. Hence the potential appraisal becomes an absolute necessity. Indian companies do pay their employees through performance appraisal system. But are we taking proper care of managerial bias? A balanced system of potential and performance appraisal will certainly remove the errors that creep into the appraisal system. More than Money: Hertzberg's theory says that hygiene factors like job security, working condition will prevent dissatisfaction but do not bring about satisfaction. For employees to be motivated more has to happen. Content elements of the job like responsibility, recognition, advancement, the work itself and personal growth act as
PRERANA September 2010
T. Frank Sunil Justus, T. Sunitha and Dr. M. Ramesh48
motivator. Hence the work place should be so set that instead of having people to fit jobs we should have jobs to fit people. A corporate haiku says, “Lone bee in the field, only you know the source of beehive salaries”. Quick career growth based on performance should be provided to employees. Mr. Akio Morita of Sony says, “People work for more than money. Management should try to give joy of work and joy of participation and the sense of participation to everyone.” He was satisfied with the reward system the company was maintaining. They gave a 2 gram , 4 gram , 8 gram gold coin for five, ten and fifteen year service respectively. The company Site in charge that is the Executive Director along with a few company Executives visited the house of the employee and spent some time with the employee and his family members and handed over the gift and certificate to him. He remembered that it was the presentation style rather than the gift that worked into the emotions of employees.Untapped abilities and talents: Ms. Margaret during one of the routine meetings involving the heads of various departments like operations, maintenance (mechanical, Civil, Instrumentation, Electrical), purchase, finance, internal audit, bagging, stores, MIS, casually initiated a talk on methods whereby the employee are more satisfied on their jobs. The Mechanical manager Mr. Sambandam felt that for employees the work itself is the greatest motivator provided it provides one with enough challenges. After a short period in the job the learning curve starts to flatten. This is where the employees should be exposed to new challenges. Otherwise a sense of dullness sets in. “An idle mind is a devils workshop” says an old proverb. Employee should be motivated to submit suggestions and modifications and where found apt may be implemented. Often he felt that suggestions coming from people with hands on experience are more practical than those by managers emanating from complicated calculations. Talent management is an art. Most of them accepted to what he said and Ms. Margaret immediately put a box in the time office. Employees while entering or leaving the company can drop their suggestions on to the box. The employee whose suggestions were implemented was to be offered cash prizes. She also formed a quality circle under every manager each consisting of a team of engineers and technicians for the discussion of plant improvements.Wage system: Mr. Alexander, the operations manager talked about a foreign concern which had a completely different wage system. SEMCO, a Brazilian company with about dozen businesses – high tech mixing equipment, inventory control, environmental resources management, to name a few – with 3000 employees and $160 million revenue was able to survive and perform well in the turbulent Brazilian economy. There are 11 compensation options at SEMCO for employees themselves to choose from. They are Fixed salary, Bonus, Profit Sharing, Commission, Royalty on sales generated, Royalty on profits generated, Commission on gross margin, Stock options, IPO/Sale warrants that an executive cashes in when a business unit goes public or is sold, Self set annual review/compensation in which an executive is paid for meeting self set goals, Commission on difference between actual and three year value of company.
SEMCO employees choose their objectives every six months, hire their co-workers, work out their budgets, set their own salaries, decide when to come to work, and even elect their own bosses. Employees preferred compensation packages that
PRERANA September 2010
T. Frank Sunil Justus, T. Sunitha and Dr. M. Ramesh 49
maximized returns for themselves and for the company. Diamond Chemicals themselves had a performance based pay system. Pay hike was given once in four years by negotiation. The union will negotiate the settlement for staff cadre employees and after the settlement the pay for officers will be fixed by the management. Once the base pay was fixed the increment for each year was based on performance. Ms. Margaret opined that an innovative pay system can be thought of but it was a long term process into which lots of planning has to be put into. Moreover the employees have to be prepared mentally if a major change was to be introduced in their wage pattern.
The Quality Manager Mr. Robert talked about another organizational – level reward strategy which is the balanced scorecard. This performance measurement system rewards people for improving performance on a composite of financial, customer and internal processes, as well as employee factors. The better the measurement improvements, the larger the bonus awarded. Originally aimed at for – profit firms, the balanced scorecard has recently been introduced to nonprofit organizations. The Swedish Police service's version of a balanced scorecard relies on surveys and objective criteria to measure customer satisfaction, police image, expected outcomes of crime investigation, perceived quality of service and efficient use of resources. The various managers felt that such a balanced score card can be maintained in their departments to monitor the day to day activities.Stress avoidance: Mr. Thomas the electrical manager felt that the organization should ensure everything under its control so that employees are stress free. He talked about The United States Army which had discovered by repeated tests that even young men – men toughened by years of army training – can march better and hold up longer if they throw down their packs and rest ten minutes of every hour. So the army forces them to do just that.
At the New York City headquarters of Tiger Management Corporation, a worldwide money-management firm, a fully equipped workout room was installed right outside the president's office. All Tiger employees were encouraged to use it. Tiger president Julian H. Robertson, Jr., says proudly, “I find the young people all seem to come here after work. The fact that they are here rather than at health clubs all over the city is a tremendous boon for us. They are exchanging ideas which are really good for us.” And obviously it was good for employees too – physically and mentally. It is management with a human touch! It is these little sparks of leisure, freedom and comradeship that creates a sense of ownership and responsibility to work in the minds of the employee. At the head office, Semler, the CEO of SEMCO installed hammocks so employees can snooze whenever they want.
The maintenance managers felt that such system was not possible in their company as theirs was a continuous process. The lunch time was from 01:00 to 01:45 pm and employees started work by 2 pm. The operation technicians worked in eight hour shifts and took turns while they went for lunch. The company managed two clubs one in their township (Quarters area) and the other in town. The clubs had recreation facilities like periodicals, news papers, indoor games, television, video collections etc. Moreover the company had a well maintained swimming pool, tennis court, volley ball court, ball badminton court, and athletics track. The company
PRERANA September 2010
T. Frank Sunil Justus, T. Sunitha and Dr. M. Ramesh50
maintained a mosque, church and temple within the township. The company had a reputed school within the township. The company arranged two tours a year for the employees and their families on company cost. Hence they felt that the company was giving its very best to ensure that the employees were stress free.
Ms. Margaret gave her own view point on what she understood between a rented house mentality work place and an Own house mentality work place.
Rented house mentality work place Own house mentality work place Promotions based on longevity Promotions based on performance Loyalty to the organization
Loyalty to the team
Wait to be told what to do
Challenge authority and take responsibility
Respect based on position/ title
Earn respect
People to fit jobs
Jobs to fit people
Identification with job
Identification transcends job description
Work and play separate
Blurring of work and play
Struggle for stability
Openness to change
Emphasis on short term solutions
Recognition that long term efficiency must take into
account harmonious work environment.
OPEN BOOK MANAGEMENTMr. Isaac the bagging plant manager talked about John Case, who in his
series of books on open-book management, contends that organizations require willing, eager talented employees who care about the success of their employer. To achieve this success, management must make sure that employee
1. View the organization and its practices as open and transparent2. See themselves as partners in the enterprise (have a stake in its success)3. Are empowered on a daily basis to help run the workplace4. Understand what the business is all about.Open - book management systems provide employees with the company's
financial and other operating numbers, which enables them to independently track and understand the organization's performance. Then employees must be expected and allowed to take appropriate actions to improve those numbers. Finally, employees must trust that they will receive some direct benefit from the organization's success. There was consensus among them that their employees were hard working but were not involved in the financial results of the company. They decided to be more transparent with the results and to have a face to face discussion with employees after any crucial decision making process.
WEED MANAGEMENTSome one in the crowd said that the management better not care about the
employees who left the organization. He felt that the 80:20 Paretto rule applies everywhere. Every department he felt had a 20 percentage of people blocking 80 percentage of innovative work. They stand stead fast against change. Retaining such people may turn havoc. A corporate haiku says, "An old woodcarver, his decisions on the floor, builds by downsizing". Induction of new blood is a must if organizations are to prosper. As Jack Welch says, "My main job was developing talent. I was a gardener providing water and nourishment to our top 750 people. Of
PRERANA September 2010
T. Frank Sunil Justus, T. Sunitha and Dr. M. Ramesh 51
course, I had to pull out some weeds, too." Still others felt that the loss of experienced and people of right attitude is even more disastrous. Organization they felt should ensure that they are retaining the right people at any cost. They talked about so many cases where employees leave their parent organization and give all their acquired skills and experience to the growth of a competitive organization.
CONCLUSIONMs. Margaret concluded the meeting with a story. In the deep jungles of
Africa, everyday the gazelle wakes up and thinks "I must run faster than the leopard or else it will eat me up". In the same jungle, elsewhere, the leopard wakes up and thinks: "I must run faster today than the gazelle or else I will stay hungry". Therefore whether one is a leopard or a gazelle run one must - faster than before- just in order to survive. Organizations have to compete with each other to create an environment where employees are happy. When one has satisfied employees, retention becomes a normal practice. He quoted K.K.Birla who says "employees must be given fair treatment coupled with good wages. There must be genuine concern for their welfare. In return, they must maintain proper discipline and deliver high productivity to enable competition to be met." Organization can take a leaf out of what Marian Wright Edelman says," You're not obligated to win. You're obligated to keep trying to do the best you can everyday." She felt that It was better for organization to see that employees have an own house mentality.
References
Ricardo Semler, (1995), Maverick: The success story behind the world's most unusual workplace, Warner Books.
Ricardo Semler, (1989), Managing without Managers. Harvard Business Review, September - October 1989.
Harvey Robbins and Michael Finley, (1997), Why change doesn't work, Orion Books.
Michele T. Myers and Gail E. Myers, (1982), Managing By Communication, McGraw-Hill International, Tokyo.
Elefalk, K. (2001), The Balanced scorecard of the Swedish police service: 7000 officers in Total Quality. Total quality Management, 12, 958-966
William Warriner, (1996), 101 Corporate Haiku, Harper Collins Publishers, London.
John Case, (1998), The Open-Book Experience, Reading, MA: Addison- Wesley.
Rustom S. Davar, (1996), Creative Leadership, UBS Publishers, New Delhi.
William Warriner, (1994), 101 Corporate Haiku, Harper Collins publishers, London.
PRERANA September 2010
52
PRERANA September 2010
53
CXO Interview
The Executive Editor of PRERANA (PRN) interviewed Mr. Harjeet Singh Wahan (HSW), Managing Director, ATS ELGI Ltd, Coimbatore on August 10, 2010.
PRN: What are the innovative practices adopted by your company to gain a competitive edge in the current scenario?
HSW: I think that innovation should never be taken as product innovation. Often people consider innovation synonymous to product innovation. The fundamental element of business is the customer. Once we have a customer, we keep finding innovative ways to satisfy the customer. Hence, the first step is customer and the second is customer satisfaction. The needs of the customer can be either tangible or intangible. Hence innovation should come under all categories. We call it under CQD- Cost Quality Delivery, which is very important. Cost in the sense, we keep on finding innovation on the cost so as to give higher value to the customers. Cost is a vertical or driver which must satisfy the customer and cost in terms of value is important. Quality is fundamental to business and business will be lost if there is no quality. Innovation in quality is always welcomed in business. We must find better ideas and methods to make sure that we give absolutely up class quality. The last component in CQD is delivery. In our company we run lean manufacturing and lean manufacturing drives us to make sure that the demand is pull. All the three in one way or the either are related to the product or the way we go about and work in the market. Hence, i feel these are the backgrounds. Customer is the king. We have to keep the customer in mind and do what the customer wants.
PRN: What are the practices of yours that you would recommend to other companies?
HSW: I think the best thing done in ELGI is lean manufacturing. We have a system called ELGI Business System (EBS) under which we have the ELGI Manufacturing System (EMS). EBS is the big umbrella and we have really matured and doing well in EMS. We have made huge improvements in quality and productivity in the last 3 to 4 years. In EMS we do a lot of work right up to the workers' level through daily work management. This helps them know exactly what they have to do and work on their own. We have the Self Managed Teams where employees are trained and hence we do not create too many supervisors in a team. In addition, all our workmen are going through a complete course in PSG College of Technology, Coimbatore termed the Caterpillar Project which takes about 6 months for a batch. We have designed the course and framed the syllabus. Three days a week they attend classes at PSG. This project we started 4 years back. We aspired to create the thinking power among the employees to make them understand the right and the wrong. Earlier they were just like normal workers doing whatever they were asked to do, but now they suggest new ideas and find new ways of increasing production. This transformation has happened because of the training program. We also have taught them about the best practices in the world. Now, under the EPS umbrella we are looking at other areas, like customer, marketing and design. We anticipate completing it in 10 years. The EMS that we have is perfect. I would suggest other companies to do it because it increases the
PRERANA September 2010
54
efficiency, reduces waste, brings down stocks, requires low inventories, enhances quality, reduces the throughput time and increases production with the same number of workers. It is a Toyota manufacturing system which everybody calls it lean and we call it EMS.
PRN: What measures will you suggest to companies to cope up with the increasing competitiveness?
HSW: Fundamentally companies have to keep their customer in the mind. The problem starts when we forget the customer and start thinking about our product. It is like product management verses customer management. We need to think about the market and not about the product. When I was the chairman of CII, Coimbatore, they invited me for a session during recession and asked me “what should we do during recession?” My answer was very simple, “go and sit with the customer”. Most of us feel that when there is recession we should avoid travel because we have to bring down cost. But that is not true. We should travel and go and sit with the customer to find out the requirements of the customer. Mr. Azim Premji of Wipro says that we have to sit in front of the customer to learn. To fight competition we have to be with the customer and learn what the customer wants and then work to satisfy the needs of the customer. It is only competition that creates new ideas in our mind. So to counter the competition, we need to know our customer. Why-Why Analysis helps to find out what the problem is and why a customer prefers a product.
PRN: Could you highlight the management principles, theories and concepts that you have implemented in the organisation?
HSW: We have to start our career from one vertical once you graduate from college. I am basically a marketing person. I worked in marketing up to the age of 37 and then entered general management. I personally believe that customer is the boss. It may sound repetitive but i believe it is a very strong management principle. Management principles should always be driven in such a way that anything you drive should satisfy the customer. So I always keep on pushing, “Have you satisfied the customer?”, “Is it your mistake?” Sometimes it is our mistake but we still push the product to the customer because we want to save our company, which i feel is not right. The real management principle that I have been always applying is 'first satisfy the customer, come back and correct your processes'.
PRN: Do you anticipate the fast growing compensation would have an impact on the cost competitiveness of the organisation?
HSW: I don't think so. It is the way organisations look at its own productivity. There is huge competition in the market and hence we need the best people. To obtain higher compensations people need to be competent and give their best. The competence required for the job will make sure that the people who are not competent enough are likely to go for jobs with lower salary. It is a clean formula. So i don't think increasing salary in India is going to be an issue for companies, as long as they produce quality products.
PRERANA September 2010
55
PRN: What talent management measures you have adopted to retain the employees?
HSW: Everybody in ELGI is very clear as to what they have to do through the EMS. Their targets, authority and responsibilities are very clear. Once the targets are clear to the people they are very happy. They are not shuttled from one idea to another. Clarity should be there on our daily activities. We have a review system, in which we review the achievement of the targets of all the employees. I review 8 people, and I review them every month. I review their next level managers, who are 40 every quarter. Based on the feedback from the review we provide training programs to the employees. We have good training programs and we call them IDP (Individual Development Program), to enhance the skills of the employees to perform their task better. We train and talk to them enabling them to perform better, but still if they do not come up then the last stage is separation and that would be very rare. Normally in ELGI we don't believe that. Our EMS process is making our people more satisfied. At the same time we also ensure that the salary that we pay is market driven. There should be a clean system where everything is transparent.
PRN: What new ventures you have for the next 2 to 3 years?
HSW: In ATS ELGI we are trying to get into newer areas which are becoming very prominent for our country. For example, we have a new product which we are launching now, the auto car wash, which is their in western countries. We have just installed one in Madurai. The second one is getting ready. This is the product which will be there in the market the next year. Another venture we are working is the multi-level car parking which is not very popular in India. Land is very expensive in cities due to which multi-level car parking is likely to gain importance. Our third venture is the exhaust system designed for garages. In the garage when the engine is started, there is an exhaust which is not good for the human body and the fumes stay inside the garage for a long period of time. Hence we have developed a very beautiful exhaust system which will take away the exhaust completely out of the garage and we have installed one in Chennai.
PRN: How do these products compete globally?
HSW: That is a very good question I would say, because many of the products which we make in India find markets only in India and there is only one product which we are able to compete globally. With Sri Lanka we do a huge amount of business. But the products that we make in India are still not suited for the European and Western markets because there have a lot of safety norms in garages which are not followed in the Indian context. We are now coming up with those ideas and making products to suit the western markets. We make compressors that are suitable for the European markets. We are trying to make our products competitive globally and are focussing on developing countries like Thailand, Malaysia, Middle East, Oman, UAE and the whole of Africa except South Africa. Today we make lifts to lift cars according to the German standards- the Maha Lift and BMW uses our lifts. This lift costs 60% more than our normal lift because it has all the safety features in it as per the requirements of the western markets. We were able to sell these lifts to Toyota and
PRERANA September 2010
56
Skoda. A Skoda dealer in Hyderabad bought 20 lifts from us. Indians are slowly becoming conscious of higher safety norms and people have started spending for the same.
PRN: What according to you are the hurdles to entrepreneurship in India?
HSW: If you ask me, it's nothing. Those who want to be entrepreneurs should be able to. I believe that whatever is standard and produced in very large quantities will not find a consistent market. You should be innovative; you should be able to do something different. I think that is where entrepreneurship comes in. I will call it a modern way of entrepreneurship than the older way. Older way was trying to do a similar thing that exists in the market and survive. But today the survival of those people is very little. Money is not an issue because banks lend us loans; it is the ideas which are more often a hurdle. My advice to those who would like to become entrepreneurs is to work for about five years in a good industry, learn, know the world, the product and the market, how the industry works and then become an entrepreneur. This helps you to know the pros and cons of the industry and get ideas from your friends. Learn business, the total business, because there is no education which will teach you complete business. It will only teach you what it is and obviously depending upon your mind, there will be more things you will learn as you go along.
PRN: According to you, what measures should B-Schools take to tap the creative bent of mind of the students?
HSW: Students must get more exposure to the industry and the teaching staff should interact with the industry. Students studying in business schools abroad are exposed to the industry practices through invited talks by the industry people. Faculty should be exposed to the industry and they should be able to talk in the language of the industry. Both these exercises would help students know the activities in the industry. Once students know what is happening, they start questioning and when they question that's what innovation is. Questioning is only possible provided the above two things happen continuously. Teachers in management should be closely associated with the industry and get updated with the industry practices and provide continuous inputs to the students and then i think creativity sets in the minds of the students.
PRN: According to you, what qualities are to be nurtured among the present youth and students of management in particular?
HSW: Any management student graduating today must keep the customer in mind and keep his/her mind open. Do not get tied down to anything because management is not a science and it keeps changing. Create the ability to question; questions from the point of view of the customers. Management is different in different places. Sri Lankan people are fun loving. At 5.00 pm they close their office and go home, whereas Indians have the habit of working till 6.00 pm or 7.00 pm and think it is hardwork. I like the Sri Lankan way. Can we change the Sri Lankan to Indian thinking and vice versa? Absolutely not! Similarly Mysore is a very sleepy town and
PRERANA September 2010
57
Coimbatore a very industrious town. Hence we have to behave accordingly and succeed within these cultures. Management students should be able to understand these differences and then manage.
PRN: What CSR measures in ELGI do you have?
HSW: We have a lot of CSR activities. We have an ELGI trust. All our money goes into that trust using which we run schools. We have a big block in the Kuppuswamy Naidu Hospital, Coimbatore and obviously we take care of Siruthuli – we pay a lot of money. We have a lot of activities going on but the main thing we focus on our Schools. We have one school in our village and we are trying to do more this year as this is our 50th year. We are focusing more on the education of children.
PRN: Thank you for your time Mr Wahan.
PRERANA September 2010
58
PRERANA September 2010
59
BOOK REVIEW
THE LEADER WHO HAD NO TITLE – A modern fable on real success in business and in life by Robin Sharma
1Dr. P. Paramanandam
Robin Sharma in his latest book, 'The Leader Who Had No Title' demonstrates how people working in organizations can step into the world of leadership regardless of their positions. The entire book maintains conversational tone with valuable takeaways. The conversation deals with leadership themes like 'You need no title
to be a leader', 'Turbulent times build great leaders', 'The deeper your relationships, the stronger your leadership', and 'To be a great leader, First become a great person'. Every body is a leader from pauper to prince and from peon to principal provided they deliver their best unmindful of their title and designation. The book helps one deliver one's best regardless of his or her hierarchical position.
The book deals with the story of Blake, a dissatisfied office worker who is offered a life-altering opportunity. Blake spends one full day studying the lessons of a mysterious group of teachers and learns the secrets of limitless success at work and in life. Along with Blake readers are introduced to four inspirational teachers – a maid who proves that every job can be done with great passion; a surfer who demonstrates how important it is to rise to the riskiest challenges in turbulent times; a former CEO who explains the value of great relationships; and a shoe shiner who proves that excellence begins from within. Each offers a lesson to show that the most powerful leadership comes from within.
Every one has the power to be a leader who transforms the world, one person at a time, no matter what he or she does and what title he or she possesses. The new leader is one who strives for excellence in all he or she does and defines success by what he or she gives and not by what he or she gets. This leadership revolution is truly democratic and based on the notion that families, organizations and communities of 21st century must train each member to be a leader.
In 'The Leader Who Had No Title' one can learn how to work with and influence people like a superstar regardless of one's position; a method to recognise and then seize opportunities in times of change; the real secrets of intense motivation; tactics to become mentally strong and physically tough enough to lead one's field; a strategy to build a great team; and ways to manage stress and unleash energy. 'The Leader Who Had No Title' is powerful, engaging and packed with real world lessons that will help any business person realize extraordinary results.
1 Dr. P. Paramanandam, Assistant Professor, GRG School of Management Studies, Peelamedu, Coimbatore – 641004. Email: [email protected]
PRERANA September 2010
60
Issue Dated Deadline for Submission
Issue No. 1 - March December 31
Issue No. 2 - September June 30
Guidelines to Authors
1. All articles are subject to peer review.
2. The manuscripts should be between 2000 – 3000 words (including figures and tables), typed using MS Word in 1.5 line spacing, Times New Roman, 12-point size, on A4 size papers with 1” (2.54 cm) margin on all sides.
3. All references in the manuscript should be placed at the end and arranged alphabetically. The referencing style suggested by the Amer ican Psycho logy Assoc ia t ion may be fo l lowed (www.apastyle.apa.org).
4. The cover page should contain (a) the title of the paper (b) author's name (c) designation and official address (d) address for communication (e) phone numbers and (f) e-mail address.
5. Author(s) should include a brief profile of themselves in about 50 words.
6. A non-mathematical abstract of about 150 words should be submitted along with the manuscript.
7. Two hard copies of the manuscript along with a soft copy in CD should be sent by courier/post addressed to “The Editor, PRERANA, GRG School of Management Studies, Peelamedu, Coimbatore – 641 004, Tamilnadu” and a soft copy to [email protected].
8. Authors(s) should send a declaration stating that the manuscript is not published, copyrighted, accepted or under review elsewhere. Please note that copyright of all accepted articles will be with PRERANA.
9 Each author will receive a complementary copy of the journal.
Deadlines for submission of Manuscripts
About GRGSMS
GRG School of Management Studies (GRGSMS) is a part of the GRG Group
of Educational Institutions in Coimbatore founded by GRG Trust. It is one of
the few Institutions in India dedicated and committed exclusively to the
development of women business leaders and entrepreneurs. The GRG Trust
was founded in 1956 by the late Shri GR Govindarajulu and his wife, Smt G
Chandrakanthi who were industrialists, philanthropists, educationists, and
great visionaries.
GRGSMS, established in 1993, is an autonomous institution, approved by the
All India Council for Technical Education (AICTE), affiliated to the
Bharathiar University, and accredited by the National Accreditation and
Assessment Council (NAAC) with ‘A’ rating.
The flagship programme offered by GRGSMS is the holistic, full-time, two-
year MBA programme. Other programmes offered include a full-time, one-
year PG Diploma in Business Administration.
GRGSMS is presently located within the premises of PSGR Krishnammal
College for Women. The environment-friendly landscape and architecture
provides conducive atmosphere for learning and development. State-of-the-
art infrastructure encompasses well-equipped classrooms, technology-based
teaching aids, latest hardware and software tools, an interactive multimedia
studio, a comprehensive digital studio, conference halls and seminar rooms.
The core members of the faculty at GRGSMS are qualified and experienced,
bringing a judicious mix of knowledge and skills. In addition, expertise of a
team of visiting faculty is drawn regularly to augment the learning