GENC2001 An Introduction to the Australian Economy: Lecture 3: Microeconomic reform Copyright: David Clark 2004 1 A big theme in Australian history has been: “The government should interfere to stop the laws of economics from working.” (Student essay) However, such laws usually defeat the best efforts of governments What is microeconomic reform? The generic term for 'government policies designed to deregulate or re-regulate product, service and factor markets in such a way as to promote competition and efficiency in relation to both domestic and international markets. Basic objectives? To allow the allocation of resources to better reflect market (as opposed to non-market) outcomes. Removal of reducing restrictions on trade - not just international trade but also trade among individuals and firms within a country 1. 2.
Transcript
GENC2001 An Introduction to the Australian
Economy: Lecture 3: Microeconomic reform
Copyright: David Clark 2004 1
A big theme in Australian history has been:
“The government shouldinterfere to stop the laws of economics from working.” (Student essay)
However, such laws usually defeat the best efforts of governments
What is microeconomic reform?
The generic term for 'government policies designed to deregulate or re-regulate product, service and factor markets in such a way as to promote competition and efficiency in relation to both domestic and international markets.
Basic objectives?
To allow the allocation of resources to better reflect market (as opposed to non-market) outcomes.
Removal of reducing restrictions on trade - not just international trade but also trade among individuals and firms within a country
1.
2.
Dave Clark
Note
Not all of these will be put up in lecture. See pages 14-16 in particular - good case study of MER results. Included to widen your knowledge of topic and to save you time.
GENC2001 An Introduction to the Australian
Economy: Lecture 3: Microeconomic reform
Copyright: David Clark 2004 2
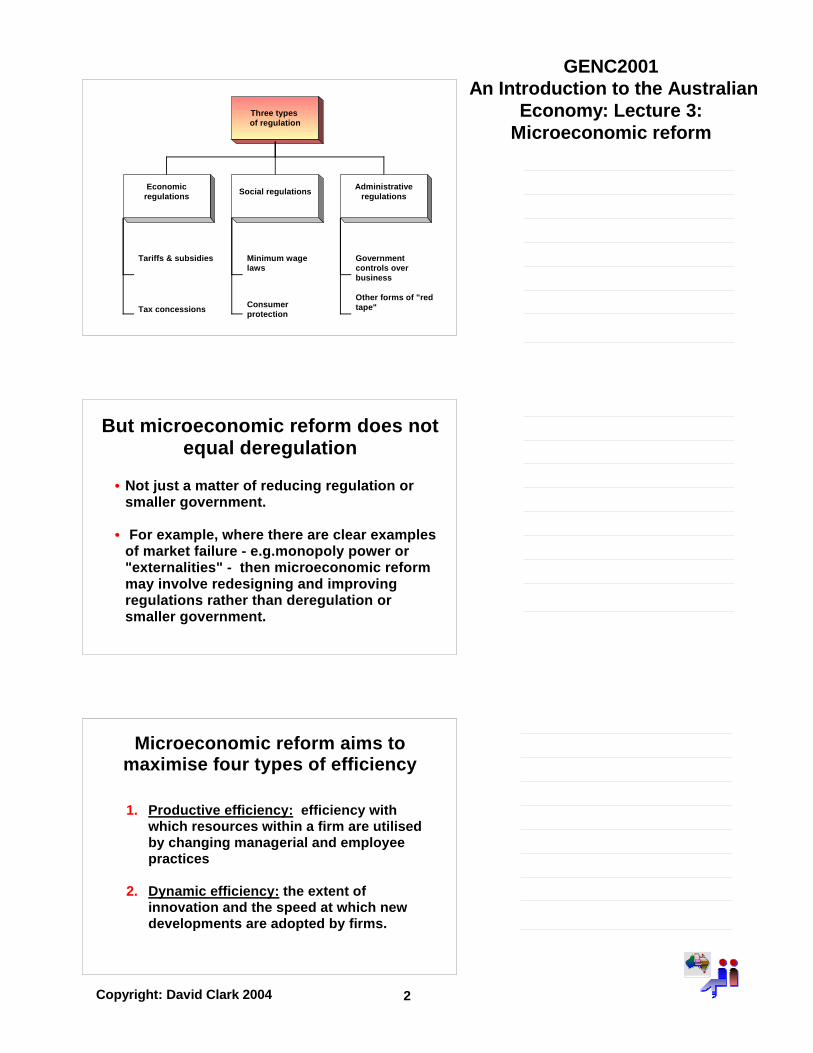
Three types of regulation
Economic regulations
Tariffs & subsidies
Tax concessions
Social regulations
Minimum wage laws
Consumer protection
Administrative regulations
Government controls over business
Other forms of "red tape"
But microeconomic reform does not equal deregulation
Not just a matter of reducing regulation or smaller government.
For example, where there are clear examples of market failure - e.g.monopoly power or "externalities" - then microeconomic reform may involve redesigning and improving regulations rather than deregulation or smaller government.
•
•
Microeconomic reform aims to maximise four types of efficiency
Productive efficiency: efficiency with which resources within a firm are utilised by changing managerial and employee practices
Dynamic efficiency: the extent of innovation and the speed at which new developments are adopted by firms.
1.
2.
GENC2001 An Introduction to the Australian
Economy: Lecture 3: Microeconomic reform
Copyright: David Clark 2004 3
Microeconomic reform aims to maximise four types of efficiency
Intertemporal efficiency - improve the allocation of resources between current consumption and investment and encourage more investment in technology and skill enhancement
Allocative efficiency: the extent to which prices reflect costs and funds are allocated to their best uses across the economy
3.
4.
Main ways in which microeconomic reform helps productivity
Through the exposure of Australian firms to increased competition:
Australian firms will have the incentive and the ability to exploit 'catch-up' opportunities - adopt world's best practice.
1.
2.
- internationally via the reduction of protection and
- domestically via competition policy
Barriers to Australian microeconomic reform were great
Resistance from all sorts of industry and interest groups - including regulatory bodies and their employees - to reforms which threaten their privileges or powers - even though such reforms may clearly be in the national interest.
Consumers of public sector provided services are often the last to be given a hearing in public debates. Debates usually dominated by the suppliers of the service, who have most to lose from any cut-backs or changes
1.
2.
GENC2001 An Introduction to the Australian
Economy: Lecture 3: Microeconomic reform
Copyright: David Clark 2004 4
Barriers to microeconomic reform were great
Difficult trade-offs between short-term macroeconomic costs and the long-term microeconomic benefits. For example, changes in taxes may reduce tax revenue and hence government spending but in the long-run encourage more investment, jobs, growth and dynamism in the economy.
Should reform be piece-meal, step-by-step, or is a bold, boots-and-all strategy superior in overcoming resistance from vested interests? Studies show that even the sequence of reforms can be very important.
3.
4.
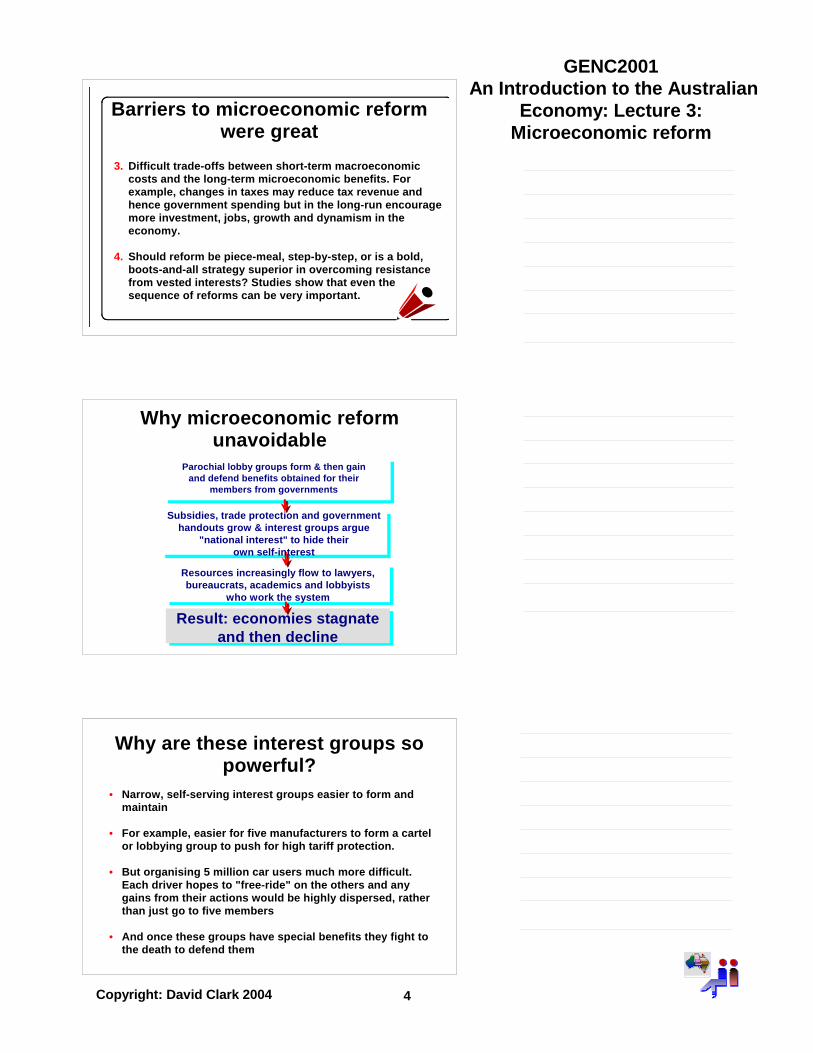
Why microeconomic reform unavoidable
Parochial lobby groups form & then gain and defend benefits obtained for their
members from governments
Resources increasingly flow to lawyers, bureaucrats, academics and lobbyists
who work the system
Result: economies stagnate and then decline
Subsidies, trade protection and government handouts grow & interest groups argue
"national interest" to hide their own self-interest
Why are these interest groups so powerful?
Narrow, self-serving interest groups easier to form and maintain
For example, easier for five manufacturers to form a cartel or lobbying group to push for high tariff protection.
But organising 5 million car users much more difficult. Each driver hopes to "free-ride" on the others and any gains from their actions would be highly dispersed, rather than just go to five members
And once these groups have special benefits they fight to the death to defend them
•
•
•
•
GENC2001 An Introduction to the Australian
Economy: Lecture 3: Microeconomic reform
Copyright: David Clark 2004 5
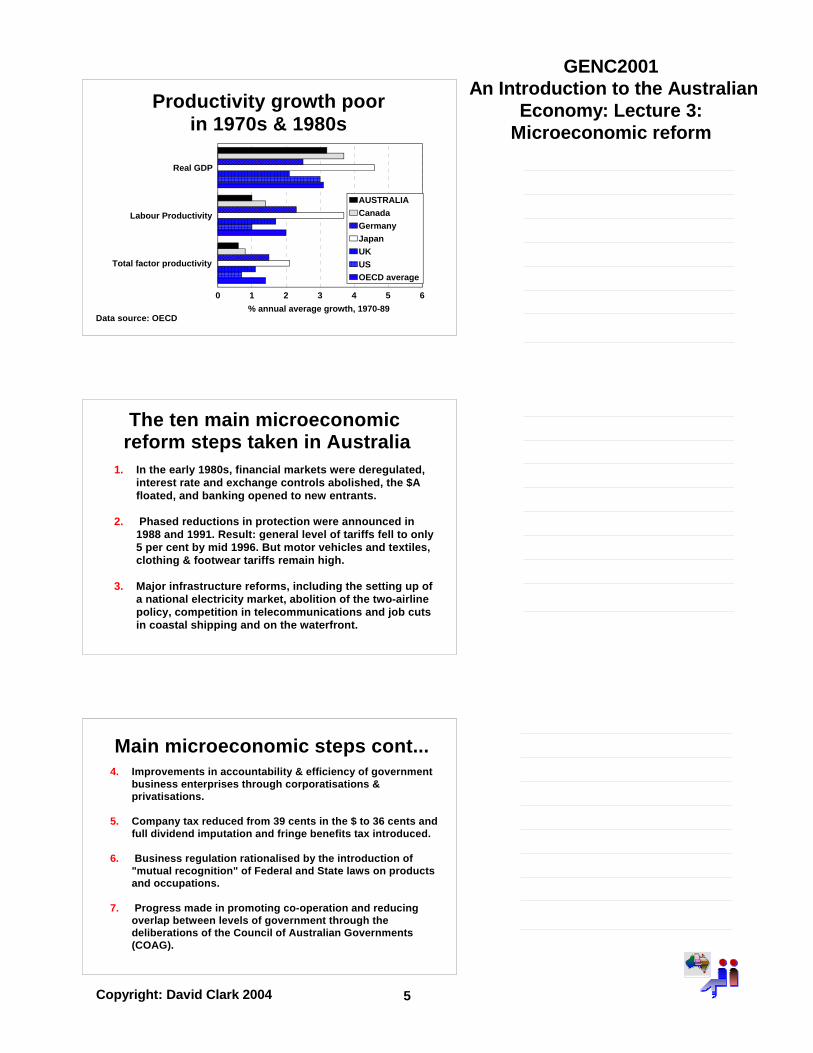
Productivity growth poor in 1970s & 1980s
Real GDP
Labour Productivity
Total factor productivity
0 1 2 3 4 5 6% annual average growth, 1970-89
AUSTRALIACanadaGermanyJapanUKUS OECD average
Data source: OECD
The ten main microeconomic reform steps taken in Australia
In the early 1980s, financial markets were deregulated, interest rate and exchange controls abolished, the $A floated, and banking opened to new entrants.
Phased reductions in protection were announced in 1988 and 1991. Result: general level of tariffs fell to only 5 per cent by mid 1996. But motor vehicles and textiles, clothing & footwear tariffs remain high.
Major infrastructure reforms, including the setting up of a national electricity market, abolition of the two-airline policy, competition in telecommunications and job cuts in coastal shipping and on the waterfront.
1.
2.
3.
Main microeconomic steps cont...Improvements in accountability & efficiency of government business enterprises through corporatisations & privatisations.
Company tax reduced from 39 cents in the $ to 36 cents and full dividend imputation and fringe benefits tax introduced.
Business regulation rationalised by the introduction of "mutual recognition" of Federal and State laws on products and occupations.
Progress made in promoting co-operation and reducing overlap between levels of government through the deliberations of the Council of Australian Governments (COAG).
4.
5.
6.
7.
GENC2001 An Introduction to the Australian
Economy: Lecture 3: Microeconomic reform
Copyright: David Clark 2004 6
Main microeconomic steps cont...
Labour market reform - including the restructuring of awards, some moves towards enterprise bargaining and measures to improve the flexibility and skills of the workforce.
Better social security targetting of genuine needy, through changes to means tests tightening of social security and clamp downs on fraud.
Reforms to education, including introduction of Austudy and the Higher Education Contribution Scheme and greater centralisation of universities. (Many academics believe latter has been disastrous.)
8.
9.
10.
Privatisation is the full or partial transfer of ownership of public assets to the private sector.
This process refers to the sale of enterprises which are a ‘going concern’ rather than the sale of land or buildings.
NB: Privatisation does not cover activities such as contracting out, leasing and private financing of infrastructure projects.
1.
2.
3.
What is privatisation?
Arguments for privatisation: a summary
MACROECONOMIC:- reduce public borrowing and debt.
MICROECONOMIC: - improve efficiency, innovation and choice
CAPITAL MARKETS: - widen share ownership and private opportunities
INSTITUTIONAL: - more rational pricing of goods and services
MAIN DANGER - PRIVATISATION MERELY REPLACES PUBLIC SECTOR MONOPOLY WITH PRIVATE SECTOR ONE
•
•
•
•
•
GENC2001 An Introduction to the Australian
Economy: Lecture 3: Microeconomic reform
Copyright: David Clark 2004 7
Why we had so many government business enterprises (GBE's)
Tyranny of distance and geography - in early days many activities were simply unprofitable.
Belief in the "Nanny State".
Seen by Left as a challenge to capitalism by worker controlled enterprises.
Desire to assist private sector with infrastructure and cheap materials.
1.
2.
3.
4.
Reasons for privatisations in Western economies: I
Academic studies which had tended to conclude that it was the lack of competition and the sectoral concentration of government business enterprises (GBEs), and not so much the ownership structure, which explained the differences in efficiency between private and public owned enterprises, were increasingly discredited.
Reason? Most of these studies were based on a comparison of cost between different enterprises in public and private ownership. Studies done outside universities, which have looked at the same enterprise before and after privatisation, have demonstrated the emergence of significant efficiency gains from privatisations.
•
•
Reasons for privatisations in Western economies: II
Increasing, internationalisation and economic integration of economies made cross-border mergers and acquisitions and strategic alliances all the more important. This encouraged privatisations for two main reasons.
First, relieved from the restraints of government budget financing, privatised GBEs were now more free to target new business areas and to make new investments by tapping directly into the capital market.
Second, private companies were now more willing to undertake joint ventures with enterprises that were not state owned.
•
•
•
GENC2001 An Introduction to the Australian
Economy: Lecture 3: Microeconomic reform
Copyright: David Clark 2004 8
Reasons for privatisations in Western economies: III
An aim to widen share ownership and to create a "share holder" culture in the population at large - a kind of "peoples' capitalism".
This aim part of a bigger goal: the development of further expansion of capital markets.
It was argued that large scale privatisation should lead to increased capitalisation, to more liquid markets, and to closer scrutiny of companies by the capital market.
•
•
•
Reasons for privatisations in Western economies: IV
In the 1990s, governments came under increasing budgetary strain. This made the privatisation of GBEs attractive by removing the need to transfer resources to GBEs running deficits and/or by generating revenues from their sale.
However, by selling off GBEs, the government gives up the future dividend stream from these assets, leaving the net effect on government wealth difficult to assess.
Also, it is crucial that the proceeds from privatisation are not utilised to simple relieve pressure for taking measures against structural budget deficits.
•
•
•
Privatisation: three main areasFinancial services - e.g.
Commonwealth Bank, State Banks of Victoria, SA, NSW
and WA
Electricity & gas - Victoria the most radical but other states likely to follow suit.
Telecommunications and transport - e.g. Telstra &
Qantas. But state railways unlikely to find buyers.
GENC2001 An Introduction to the Australian
Economy: Lecture 3: Microeconomic reform
Copyright: David Clark 2004 9
Australia's major privatisationsTelstra (66%)
Telstra (33 %)Vic Electric
CBA (2nd float)United Energy
Qantas (75 % float)CBA (1st float)
NSW GIOSolaris Power
Bank SATabcorp
Qantas (25 % to BA)
0 10 20 30 40 50Proceeds, billions of dollars
Nov 95Sept 93
Aug 93July 95July 91June 92
Oct 95June 95June 94Dec 93
Nov 97Estimated
Government ownership in 1990
Source: The Economist0%-25%25%-75%75%-100%
West Germany
Britain
United States
Japan
AustraliaPost AirlinesTelecom.
Railways Electricity
GBEs had more capital, less product
16.0%
10.0%
74.0%
15.0%
19.0%
66.0%Gross product Net capital stock
GBEs Other Public Sector Private Sector
1989 estimates for EPAC
GENC2001 An Introduction to the Australian
Economy: Lecture 3: Microeconomic reform
Copyright: David Clark 2004 10
State GBEs were the big losers
1983-84 1985-86 1987-88 1989-90
0
1
2
-1
-2
Losses, $s billions
Commonwealth States/Territories
Largely railway losses
Easier for Commonwealth - couldpush up phone & post prices
Australian privatisations big by world standards
RBA Bulletin, December 1997
0.12 0.120.35 0.4
0.75
1.75 1.8
JapanGermany
SwedenFrance
UKAustralia
NZ0
0.5
1
1.5
2
Annual average proceeds, 1990-97, as a % of GDP
According to the OECD, global privatisations totalled about US$30 billion in 1990 and nearly US$100 billion in 1997.
GENC2001 An Introduction to the Australian
Economy: Lecture 3: Microeconomic reform
Copyright: David Clark 2004 11
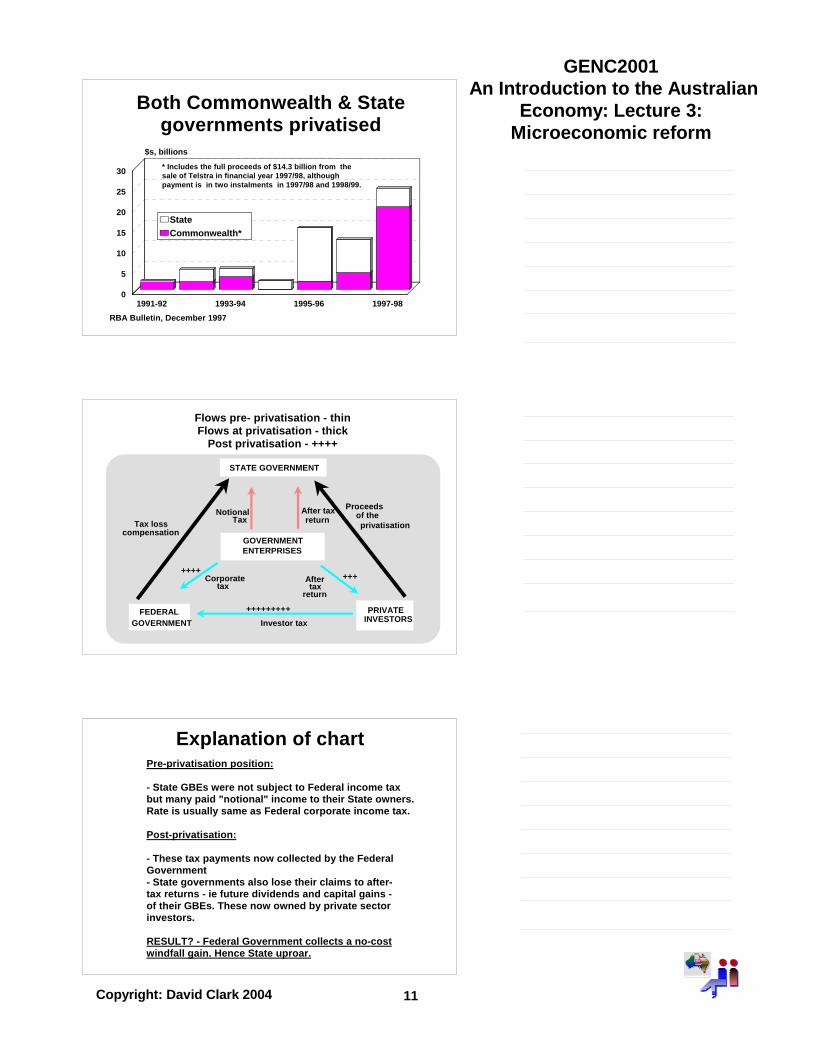
Both Commonwealth & State governments privatised
RBA Bulletin, December 19971991-92 1993-94 1995-96 1997-98
0
5
10
15
20
25
30
$s, billions
Commonwealth*State
* Includes the full proceeds of $14.3 billion from the sale of Telstra in financial year 1997/98, although payment is in two instalments in 1997/98 and 1998/99.
Flows pre- privatisation - thinFlows at privatisation - thick
Post privatisation - ++++
STATE GOVERNMENT
FEDERALGOVERNMENT
PRIVATEINVESTORS
GOVERNMENTENTERPRISES
NotionalTax
After taxreturnTax loss
compensation
Proceedsof theprivatisation
Aftertax
return
Corporatetax
Investor tax
+++++++
+++++++++
Explanation of chartPre-privatisation position:
- State GBEs were not subject to Federal income taxbut many paid "notional" income to their State owners.Rate is usually same as Federal corporate income tax.
Post-privatisation:
- These tax payments now collected by the FederalGovernment- State governments also lose their claims to after-tax returns - ie future dividends and capital gains -of their GBEs. These now owned by private sectorinvestors.
RESULT? - Federal Government collects a no-costwindfall gain. Hence State uproar.
GENC2001 An Introduction to the Australian
Economy: Lecture 3: Microeconomic reform
Copyright: David Clark 2004 12
Electricity industry: productivity up but jobs down
ABS 8401.0
-7-6
1
Jobs Wages & salaries bill Value added
0
2
-2
-4
-6
-8
% change, 1996-97
Microeconomic reform lowered many prices
Productivity Commission, 1998 Report on Government Trading Enterprises
-24
-11
-23
-23
-9
-9
-3
Electricity
Rail services
Port charges
Phone charges
Water
Main postal charge
Landing charges
0 5-5-10-15-20-25-30% change in average prices, 1993-98
Australia has had one of the larger programs among OECD countries – second, by value, to the UK and, relative to GDP, to New Zealand.
Privatisation proceeds are estimated to have been about $61 billion in the 1990s - coming roughly 50:50 from State and Commonwealth privatisations.
1.
2.
Australian privatisations: a check-list
Governments have sold assets both by offering equity to the public and through trade sales.
Proceeds of sales have been used largely to reduce government debt.
Privatisation has dramatically increased share ownership in Australia.
3.
4.
5.
GENC2001 An Introduction to the Australian
Economy: Lecture 3: Microeconomic reform
Copyright: David Clark 2004 13
However, will the godfathers defeat the Treasurer?
“Let's make it clear.. the reason why we're in favour of a competitive economy is to benefit consumers.” (The Treasurer, Peter Costello, immediately after the 1996 Election.)
“Like many businessmen of genius he learned that free competition was wasteful, monopoly efficient.”. (Mario Puzo, The Godfather.)
Critics of MER got egg all over their keyboards - & reputations
Most quoted critic: the author, Bob Ellis.
Ellis' main argument was that by sacking people and cutting expenditure, economic rationalists will 'abolish the customer', that is, that they will reduce the capacity of ordinary people to consume the goods produced by the market economy and therefore create a downward spiral towards economic disaster.(See B. Ellis, First Abolish the Customer: 202 Arguments against Economic Rationalism.)
Most quoted academic economist critic: Professor John Quiggin
"The fact that a decade of intensive effort has produced no measurable improvement in economic performance is clear evidence that a new approach is needed”. (Professor John Quiggin, 1996, www.ecocomm.anu.edu.au).
Both horribly wrong: Since 1996, GDP growth, consumer spending growth, productivity, and living standards improvement among the very best in Western world|
)
)
)
)
)
Government regulation index (1998)OECD Annual Economic Outlook Conference, Stockholm, Oct. 02
Our great deregulation paid offDifference in av. productivity growth rate, 1990-2000 compared with 1980-90
AUSTRALIA
More restrictive Less restrictive
GENC2001 An Introduction to the Australian
Economy: Lecture 3: Microeconomic reform
Copyright: David Clark 2004 14
A case study of MER: Australia's waterfront
See http://www.btre.gov.au/wline.htm for latest developments
Why waterfront productivity especially important
Over half of our goods export income usually comes from commodities and most of these are bulky - eg. coal, alumina, iron ore.
We face heavy competition on world markets with these exports. Hence even small cost differentials on getting goods across wharves, onto ships and to foreign markets can be very important.
Higher value-added exports are usually exported in containers. The fact that our container handling productivity is particularly poor by internat ional standards does nothing to encourage growth in such exports
Delays on our wharves can also encourage customers to seek more reliable sources of supply. Hence strikes can do long-term damage to our export trade
1.
2.
3.
4.
Waterfront workers once had it tough but:
Mid 1980s examples
In Newcastle, 54 foremen and supervisors were employed for the 186 waterside waterside workers employed at the port
"Nick off days" were common - i.e. members of a gang drew straws to see who could return home for the day on full pay
Two employees were required to observe wheat being poured into the hold of a vessel. But jobs with much more danger to the public - such as bus and train driving - did not have such conditions
Under union rules, shippers of containers of mixed goods had to have the containers packed by union members, either on the wharves or at nominated depots. This prevented, for example, farmers from loading their own containers at a much lower cost.
•
•
•
•
GENC2001 An Introduction to the Australian
Economy: Lecture 3: Microeconomic reform
Copyright: David Clark 2004 15
Australian unloading rates poor(Number of hours to load 600 boxes, 1994)
Bureau of Transport and Communications Economics
FremantleHamburg
MelbourneSydney
BrisbanePiraeus
AdelaideBangkok
WellingtonAntwerp
BarcelonaZeebrugge
Name of port
0 10 20 30 40 50Hours
Australian crane rates likewise
Bureau of Industry Economics
Adelaide
Fremantle
Melbourne
Sydney
Brisbane
Five ports average
Fed. Govt. target
World's best practice
Name of port
0 5 10 15 20 25 30Boxes per hours, irrespective of container size
Australian perks for seamen
A seamen who was sick for more than seven days was entitled to a further seven days leave, even if he had fully recovered and was fit for work
First class travel and accommodation had to be provided for seamen travelling between ports
Trans-Tasman ferries had one full-time barman for every 8 crew members - and many bars self-service!
And such conditions approved by Industrial Relations Commission.
It cost more to ship goods Sydney- Wellington on Australian or New Zealand crewed ships than from Sydney to San Francisco!
Also cabotage - restrictions on foreign ships moving goods around Australia - made it more expensive to add value to Australian minerals. For example, it cost the same to ship newsprint from Hobart to Sydney as from Hobart to Tokyo
Australian National Shipping Line - set up to reduce our dependence on foreign shipping companies - became a joke - but Labor and Liberal governments have found it very hard to change.
•
•
•
Net crane rate per port & liner shipping trade, lifts per net hour
Productivity Commission (1998), Report on the Waterfront
* Australian terminals Overseas terminals
* * ** *
*
** *
**
**
*
* * * * * *
*
Europeeast bound
Europewest bound
North Asia South EastAsia
US east coast
US west coast
Ham
burg
Tilb
ury
Mel
bour
neFr
eman
tleAd
elai
deSy
dney
*
Frem
antle
Mel
bour
neSi
ngap
ore
Sydn
eyPo
rt K
lang
Bris
bane
Adel
aide
Nag
oya
Pusa
nAd
elai
deM
elbo
urne
Bris
bane
Sydn
ey
Ham
burg
Tilb
ury
Mel
bour
neSy
dney
Frem
antle
Phila
delp
.B
risba
neM
elbo
urne
Sydn
eyM
elbo
urne
L.A
.Sy
dney
Net
cr a
ne ra
tes,
lifts
per
hou
r
35
25
10
Container handling productivity has improved dramatically
Average containers lifts per hour, December quarter figures