General rights Copyright and moral rights for the publications made accessible in the public portal are retained by the authors and/or other copyright owners and it is a condition of accessing publications that users recognise and abide by the legal requirements associated with these rights. • Users may download and print one copy of any publication from the public portal for the purpose of private study or research. • You may not further distribute the material or use it for any profit-making activity or commercial gain • You may freely distribute the URL identifying the publication in the public portal If you believe that this document breaches copyright please contact us providing details, and we will remove access to the work immediately and investigate your claim. Downloaded from orbit.dtu.dk on: May 10, 2018 A Blue Lagoon Function Markvorsen, Steen Publication date: 2007 Link back to DTU Orbit Citation (APA): Markvorsen, S., (2007). A Blue Lagoon Function
Transcript
General rights Copyright and moral rights for the publications made accessible in the public portal are retained by the authors and/or other copyright owners and it is a condition of accessing publications that users recognise and abide by the legal requirements associated with these rights.
• Users may download and print one copy of any publication from the public portal for the purpose of private study or research. • You may not further distribute the material or use it for any profit-making activity or commercial gain • You may freely distribute the URL identifying the publication in the public portal
If you believe that this document breaches copyright please contact us providing details, and we will remove access to the work immediately and investigate your claim.
Downloaded from orbit.dtu.dk on: May 10, 2018
A Blue Lagoon Function
Markvorsen, Steen
Publication date:2007
Link back to DTU Orbit
Citation (APA):Markvorsen, S., (2007). A Blue Lagoon Function
A BLUE LAGOON FUNCTIONPRINTED IN 3D AT DTU MATHEMATICS UPON SPECIAL REQUEST
FROM GUNNAR MOHR, DEAN OF STUDIES, DECEMBER 2007
Abstract. We consider a specific function of two variables whosegraph surface resembles a blue lagoon. The function has a saddlepoint p, but when the function is restricted to any given straightline through p it has a strict local minimum along that line at p.
1. Definition and properties
A function f(u, v) is defined in R2 as follows:
f(u, v) =(1− (u− 1)2 − v2
) (4− (u− 2)2 − v2
).
The function is zero along the two circles (the red circles in Figure 1):
(u− 1)2 + v2 = 1 and (u− 2)2 + v2 = 4 .
The point of interest is p, where the two red circles meet. This pointhas coordinates p = (0, 0). It is a stationary point for f :
∇f |(0,0)= 0 .
The Hessian of f is positive semi-definite at p :
Hess f |(0,0)=
(2 00 0
).
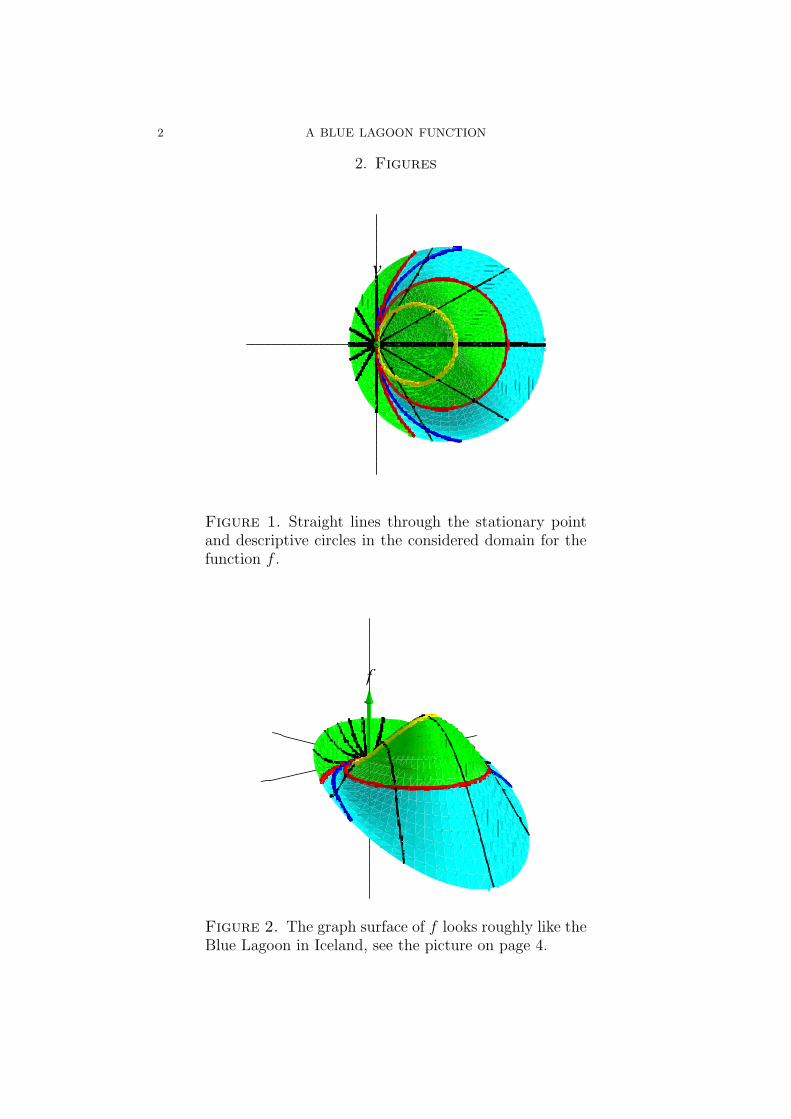
In the disc domain shown in Figure 1 there are two subdomains, wherethe function is positive (the green subdomains), and one subdomainwhere the function is negative (the blue subdomain). Every straightline through p therefore only experiences positive values of f close top - except precisely at p, where the value is 0. The point p is thencea strict local minimum along every one of these straight lines. Theyellow circle marks the location of the local maxima along the respec-tive straight lines through p. The function (considered as a functionin R2) does not itself have a local minimum at p . For example, thefunction is decreasing from p along the blue circle through p in theblue subdomain in between the two red circles through p in Figure 1(see the precise analysis on page 5). The point p is thus a saddle pointin the sense that it is a stationary point with the property that everyneighborhood around p contains points where f is strictly larger thanf(p) = 0 as well as points where f is strictly smaller than 0 .
2000 Mathematics Subject Classification. Primary 26.Key words and phrases. Functions of two variables.
1
2 A BLUE LAGOON FUNCTION
2. Figures
v
u
Figure 1. Straight lines through the stationary pointand descriptive circles in the considered domain for thefunction f .
v
f
u
Figure 2. The graph surface of f looks roughly like theBlue Lagoon in Iceland, see the picture on page 4.
A BLUE LAGOON FUNCTION 3
v
u
Figure 3. The function −f unfolded with ’dual colors’.
uv-f
Figure 4. The graph surface of −f (with ’dual’ col-ors) looks roughly like the Blue Lagoon at Abereiddy inWales, UK.
4 A BLUE LAGOON FUNCTION
Figure 5. The Blue Lagoon in Iceland.
Figure 6. The Blue Lagoon at Abereiddy in Wales, UK.
3. Analysis
Any straight line through p = (0, 0) may be parametrized as follows
Lw : r(t) = ( t cos(w), t sin(w) ) for t ∈ R and w ∈[−π
2,π
2
].
When restricting f to Lw we get the restricted function:
g(t) = f(r(t)) = f( t cos(w), t sin(w) ) = t2(8 cos2(w)−6t cos(w)+t2) .
These restricted functions are displayed in Figure 7 for a couple ofw−values. It is clear from this inspection, that at least for w 6= ±π/2 ,
A BLUE LAGOON FUNCTION 5
w = Pi/3 w=Pi/5 w=Pi/12
t
0 1 2
g t
K1
1
2
Figure 7. The line-restricted functions g(t).
every g has a local minimum along Lw at p corresponding to t = 0 .This also follows precisely from the derivatives of g at t = 0 :
(3.1) g′(0) = 0 and g′′(0) = 16 cos2(w) > 0 .
For the special values w = ±π/2 (corresponding to Lw being thev−axis), we get g(t) = t4 . This shows that the restriction of f to thev−axis also has a strict local minimum at p.
The yellow circle in Figure 1 appears as the locus of local max-ima (on the green ’island’) of g along the straight lines Lw for w ∈[−π/2, π/2 ]. The blue circle in Figure 1 is correspondingly the locusof local minima (in the blue ’lagoon’) of g along the lines. Indeed,g′(t) = 2t(−9t cos(w) + 2t2 + 8 cos2(w)). Thus g′(t) = 0 for t = 0 ,t = (1/4)(9−√17) cos(w) , and for t = (1/4)(9+
√17) cos(w) . When
inserted into r(t) this gives the point p and the two circles, respectively.
In particular we note, that the values of f along the blue circle are,as a function of the direction angle w ∈ [−π/2, π/2 ] from the point p :
h(w) = − cos4(w)(107 + 51√
17)/32 .
This function is clearly negative, except at p - corresponding to w =± π/2 - and it is clearly decreasing when w moves away from thesevalues of w - corresponding to walking (or rather diving) away from palong the blue circle in Figure 2, as claimed on page 1.
Department of Mathematics, Technical University of Denmark.