Is It Structural Change, or Is Capital’s Compensation Outpacing Labor’s across More Industries?: The Case of U.S. Labor Productivity, 1982-1997 Erik Dietzenbacher, Michael L. Lahr, and Bart Los 1. Introduction A book in memory of Wassily Leontief would hardly be complete without some piece on the structure of the American economy. After all Professor Leontief had developed his first input-out table using U.S. data and subsequently published his first three books with the purpose of examining the structure of the American economy (1941, 1951, 1953). 1 It was with this in mind that the editors of this book, along with Bart Los, teamed up to put new trimmings on some of the pioneering work laid out by our esteemed predecessor. The team seemed particularly well equipped with Dietzenbacher and Los having made prior investigations into structural decomposition analysis (Dietzenbacher, 2001; Dietzenbacher, Hoehn, and Los, 2000; Dietzenbacher and Los 2000, 1998, 1997) and with Lahr well attuned to U.S. industry trends and the availability and nature of American national accounts data. According to BEA fugures, the annual growth of real U.S. gross product originating (GPO) declined since 1980. While it averaged near 7.5 percent during the 1980s, it dipped to something closer to 5.1 percent in the 1990s. A cursory decomposition reveals that labor compensation’s share of GPO simultaneously edged downward, from an decadal average 58.5 percent in the 1980s to 58.0 percent in the 1990s, a perceptible if 1 The well-known Leontief Paradox also stemmed from his examination of the structure of American trade (Leontief, 1956, 1958). He had also published an article on this topic in Scientific American in 1965.
Transcript
Is It Structural Change, or Is Capital’s Compensation Outpacing Labor’s across More Industries?: The Case of U.S. Labor Productivity, 1982-1997 Erik Dietzenbacher, Michael L. Lahr, and Bart Los
1. Introduction A book in memory of Wassily Leontief would hardly be complete without some
piece on the structure of the American economy. After all Professor Leontief had
developed his first input-out table using U.S. data and subsequently published his first
three books with the purpose of examining the structure of the American economy (1941,
1951, 1953).1 It was with this in mind that the editors of this book, along with Bart Los,
teamed up to put new trimmings on some of the pioneering work laid out by our
esteemed predecessor. The team seemed particularly well equipped with Dietzenbacher
and Los having made prior investigations into structural decomposition analysis
(Dietzenbacher, 2001; Dietzenbacher, Hoehn, and Los, 2000; Dietzenbacher and Los
2000, 1998, 1997) and with Lahr well attuned to U.S. industry trends and the availability
and nature of American national accounts data.
According to BEA fugures, the annual growth of real U.S. gross product
originating (GPO) declined since 1980. While it averaged near 7.5 percent during the
1980s, it dipped to something closer to 5.1 percent in the 1990s. A cursory decomposition
reveals that labor compensation’s share of GPO simultaneously edged downward, from
an decadal average 58.5 percent in the 1980s to 58.0 percent in the 1990s, a perceptible if
1 The well-known Leontief Paradox also stemmed from his examination of the structure of American trade (Leontief, 1956, 1958). He had also published an article on this topic in Scientific American in 1965.
not precipitous fall. Indeed, U.S. labor costs did not parallel those in other G-7 nations,
despite rather similar patterns in productivity growth (Cobet and Wilson, 2002).
Analysts have clamored to figure out what caused such dramatic changes in the
U.S. economy. Various rationales have been put forward, the most viable being the end
of the Breton Woods system of controlled exchange rates fortified by two major oil price
shocks and the “Plaza Accord,” an international agreement that lowered the value of U.S.
currency (Cobet and Wilson, 2002). In any case, it became immediately clear that the
pre-existing trend of the economy to shift out of manufacturing and into a more service-
based mode of operation was a partial intermediate cause for both of the deleterious
trends in GPO of the 1990s.
Certainly, much of the shift out of goods-producing industries can be attributed to
the increasing ease of transferring capital across national boundaries toward lower-priced
semi-skilled labor surely encouraged by new bilateral trade agreements—GATT and
NAFTA (Bordo, Eichengreen, and Irwin, 1999). BEA data show that in 1970
manufacturing jobs comprised 21.5 percent of the workforce. In contrast, by 1980,
manufacturing’s share of employment had reduced to 14.1 percent, and by 2000 to 11.4
percent. At the same time the service industries grew rapidly. From 63.9 percent in 1970
to 70.2 percent in 1980 and 79.2 percent in 2000. Although some of the service jobs
created were in high-paying “symbolic analytic services,”2 evidence suggests that the
many part-time retail-based jobs also added likely counteracted and overwhelmed the
surge in this new type of service-industry labor.
2 Reich (1991) seems to have been the first to recognize the fundamental composition of this new branch of the U.S. labor force.
From 1973 to 1990 labor costs rose on average by 4.1 percent annually in nominal
terms (Cobet and Wilson, 2002). Nonetheless, many researchers have documented the
relative stagnancy of average real compensation per worker during the period. Nearly
three decades of rapid income growth and narrowing income differentials stopped
abruptly in the 1970s. Real incomes not only started to grow more slowly,3 but they also
became more unequally distributed (Blank, 1997; Danziger and Gotschalk, 1995; Levy
and Murnane, 1992; Harrison and Bluestone, 1990). In summary, it would seem during
the past decade or so U.S. labor has not been reaping its usual share of the benefits of
productivity growth.
This led us to follow up on Leontief’s suggestion that “it would very be
interesting to see how modern technological change has affected the demand for labor”
(Foley, 1998, p. 127), something toward which much of his professional life was
apparently devoted. Unlike the case of capital, there are limits to the how much the
demand for labor can be reduced. This reduction limit makes the examination of labor’s
demand particularly interesting from a social research perspective. As suggested by
Leontief later in his interview with Duncan Foley, when the demand for labor approaches
the economy’s minimum tolerable limit, household-level social problems crop up with
greater frequency within that economy. Indeed, this symptom of labor demand’s lower
bound is reflects the concern expressed by researchers who found that U.S. labor income
per worker had stagnated in the 1980s. Moreover, advances in the analysis of economic
3 Gordon (1997) suggests that in the 1970s and 1980s the influx of many new labor market entrants (women, baby boomers, and immigrants—the latter both legal and illegal) affected the productivity of service industries in much the same way that immigrants did between 1890-1913. That is their presence may have dampened real wages and delayed the introduction of some labor-saving devices.
structural change during the past decade or so afforded new ways of examining some of
Leontief’s goals.
So why did capital apparently benefit from enhanced productivity at the expense
of U.S. workers during the 1990s? Did technological change, indeed, play a role as
Leontief might suppose? Could a new regime in the structure of U.S. final demand be a
cause? Or is it simply that the U.S. economy is divesting into industries that are more
laden with property-type income than labor compensation? In order to investigate the
answers to these questions, we opted to structurally decompose U.S. labor productivity
along the lines recently applied by Dietzenbacher, Hoen, and Los (2000) in the Journal of
Regional Science. To address our main policy concern, we decompose labor
compensation’s share of value added into effects due to trends (labor compensation and
nonlabor income) at the sector level and effects due to structural change (final demand
and technology).
We lay out the description of our research approach and results as follows. In the
next section we describe some methodological aspects of structural decompositions,
including how they can be related to certain well-known index number types. In Section
3, we propose a very specific decomposition of compensation’s share of value added that
enables us to analyze, over time, compensation per hour worked as well as value added
per hour worked as well as the structural effects of technology and final demand change.
We propose using a Fisher-type index in the our empirical analysis. In Section 4, we
describe the data we used and how we prepared it for the application at hand. In Section
5, we analyze and discuss the results of the decompositions. This is followed by a set of
research conclusions.
2. Methodological aspects of structural decompositions
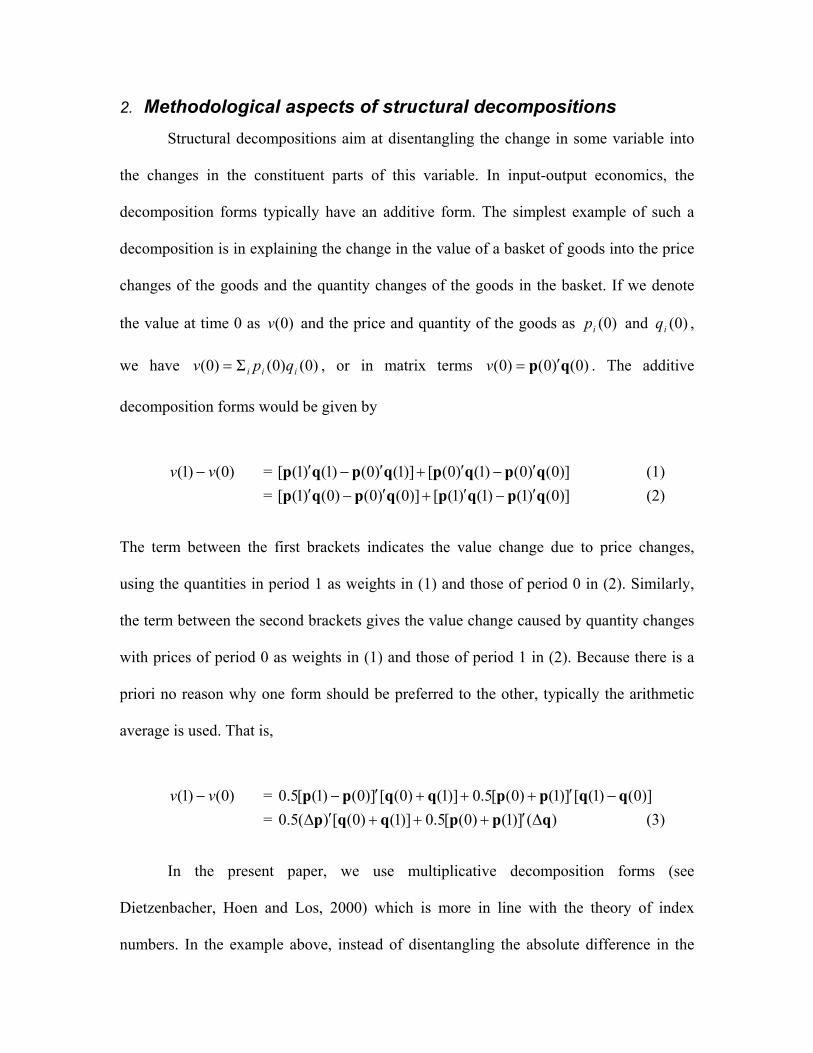
Structural decompositions aim at disentangling the change in some variable into
the changes in the constituent parts of this variable. In input-output economics, the
decomposition forms typically have an additive form. The simplest example of such a
decomposition is in explaining the change in the value of a basket of goods into the price
changes of the goods and the quantity changes of the goods in the basket. If we denote
the value at time 0 as and the price and quantity of the goods as and ,
In the present paper, we use multiplicative decomposition forms (see
Dietzenbacher, Hoen and Los, 2000) which is more in line with the theory of index
numbers. In the example above, instead of disentangling the absolute difference in the
values, the relative change in the values is to be examined. Similar to equations (1) and
(2), we now have
)0()1(
vv =
)0()0()1()0(
)1()0()1()1(
qpqp
qpq
′′
′′
p (4)
= )0()1()1()1(
)0()0()0()1(
qpqp
qpq
′′
′′
p (5)
Note that the first term on the right hand side of (4) equals the Paasche price index, while
the second term gives the Laspeyres quantity index. Similarly, the first term in (5) is the
Laspeyres price index and the second term is the Paasche quantity index. In the same way
as we did in (3) we take the average of the two decompositions. However, instead of
using the arithmetic average, now the geometric average should be used. That is,
)0()1(
vv =
5.05.0
)0()1()1()1(
)0()0()1()0(
)0()0()0()1(
)1()0()1()1(
′′
′′
′′
′′
qpqp
qpqp
qpqp
qpqp (6)
The first term on the right hand side is the Fisher price index and the second term is the
Fisher quantity index.
As is well known, Fisher indexes satisfy certain desirable properties, of which we
discuss three. First, the factor reversal test requires that if the price index is multiplied by
the quantity index the value index, i.e. , is obtained. Equation (6) immediately
shows that this holds for the Fisher indexes, in contrast to the Lapeyres or the Paasche
indexes, for example. Second, the time reversal test requires that the index for period 1
with period 0 as its base multiplied with its reverse (i.e. the same index for period 0 with
period 1 as its base), equals one. If we take the Fisher price index (i.e. the first term in
)0(/)1( vv
(6)) as an example, we have to multiply it with the index that is obtained by replacing all
0’s by 1’s (and vice versa). It is easily seen that this yields one. Again, in contrast to the
Fisher indexes, the Laspeyres and the Paasche indexes do not satisfy the time reversal
test. Third, the test for symmetry requires that the price index becomes the corresponding
quantity index, once p and are replaced by q and , respectively, and vice
versa. The Laspeyres, the Paasche and the Fisher indexes satisfy this test for symmetry.
)1( )0(p )1( )0(q
The discussion above, where the value change has been decomposed into a
component reflecting the effect of price changes and another component indicative of the
quantity changes, is an example of the simplest possible decomposition. That is, it is a
decomposition where the variable under consideration (i.e. the value of a basket of
goods) consists of just two underlying determinants (viz. prices and quantities of the
goods). In most structural decomposition studies in input-output economics, the variable
under consideration consists of a much larger number of determinants. This also
increases the number of possible decomposition forms tremendously. The forms that have
been used the most are the so-called polar decompositions (see Dietzenbacher and Los,
1998). For the ease of exposition, suppose the change in the scalar z is to be decomposed
into its three constituent parts, based on Bca ′=z , where a and c are vectors and B is a
matrix. The two polar decompositions in a multiplicative format are as follows.
)0()1(
zz =
)0()0()0()1()0()0(
)1()0()0()1()1()0(
)1()1()0()1()1()1(
cBacBa
cBacBa
cBacB
′a ′
′′
′′
(7)
= )0()1()1()1()1()1(
)0()0()1()0()1()1(
)0()0()0()0()0()1(
cBacBa
cBacBa
cBacB
′a ′
′′
′′
(8)
Note that the polar decomposition in (7) can be viewed as an approach “from left to
right”. That is, starting from )1()1()1()1( cBa ′=z , first change into a , next
change B(1) into B(0), and finally change c(1) into c(0). The decomposition in (8)
reflects an approach “from right to left”, where first c is changed, then B and finally a
)1( ′a )0( ′
′ .
Just as we did with the forms in (4) and (5), we again take the geometric average,
which yields the Fisher-type of indexes.
)0()1(
zz = ×
′′
′′
′′
′′
5.05.0
)0()0()1()0()1()1(
)1()0()0()1()1()0(
)0()0()0()0()0()1(
)1()1()0()1()1()1(
cBacBa
cBacBa
cBacBa
cBacBa
5.0
)0()1()1()1()1()1(
)0()0()0()1()0()0(
′′
′′
cBacBa
cBacBa
(9)
The first term on the right hand side, which we call the a-index, reflects the change in z
brought about by the change in the vector a. Similarly, the second and third term indicate
the change in z due to the change in the matrix B and vector c, respectively. They will be
termed the B-index and the c-index.
Note that these indexes satisfy the factor reversal and the time reversal test. The
factor reversal test requires that the a-index multiplied by the B-index and by the c-index
equals , which exactly is what equation (9) expresses. The a-index above is the
index for period 1 with period 0 as its base. Replacing the 0’s by 1’s and vice versa,
yields the a-index for period 0 with period 1 as its base. The time reversal test requires
that if these two different a-indexes are multiplied the answer should be equal to one. The
test for symmetry needs to be extended first. For example, we say that the a-index is
symmetric to the B-index if replacing
)0(/)1( zz
)1( ′a and )0( ′a by B(1) and B(0), respectively, and
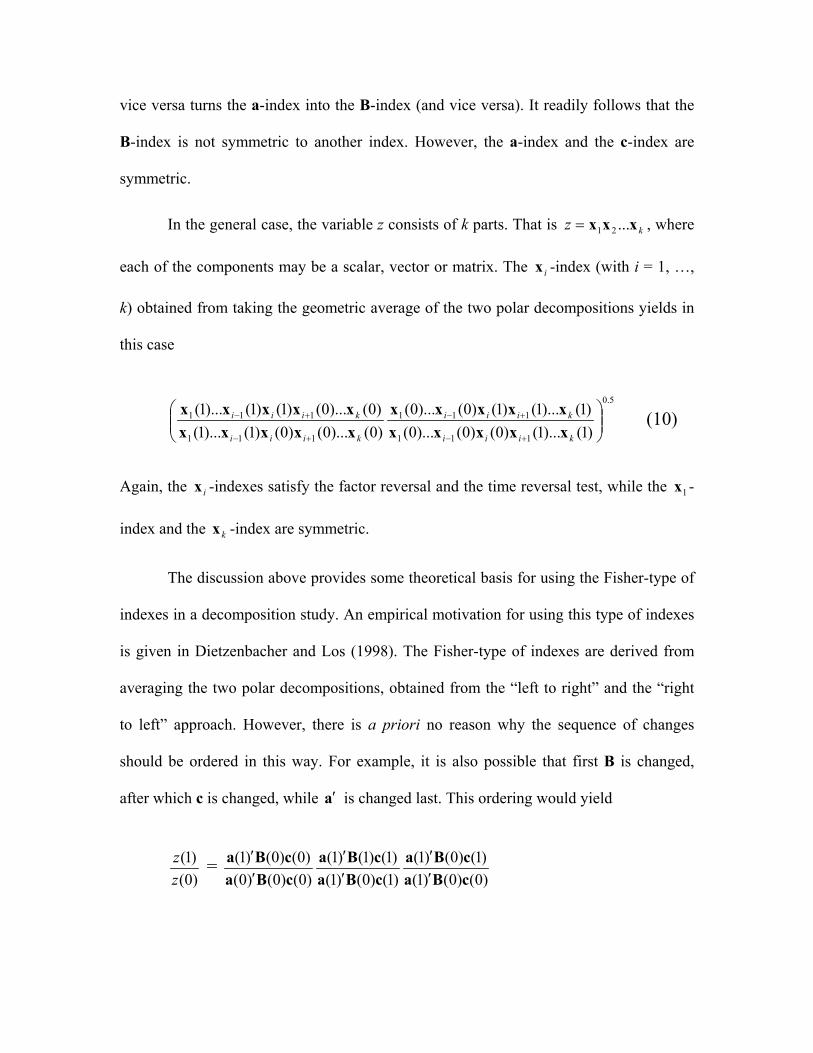
vice versa turns the a-index into the B-index (and vice versa). It readily follows that the
B-index is not symmetric to another index. However, the a-index and the c-index are
symmetric.
In the general case, the variable z consists of k parts. That is , where
each of the components may be a scalar, vector or matrix. The -index (with i = 1, …,
k) obtained from taking the geometric average of the two polar decompositions yields in
this case
kz xxx ...21=
ix
5.0
111
111
111
111
)1()...1()0()0()...0()1()...1()1()0()...0(
)0()...0()0()1()...1()0()...0()1()1()...1(
+−
+−
+−
+−
kiii
kiii
kiii
kiii xxxxxxxxxx
xxxxxxxxxx (10)
Again, the x -indexes satisfy the factor reversal and the time reversal test, while the x -
index and the -index are symmetric.
i 1
kx
The discussion above provides some theoretical basis for using the Fisher-type of
indexes in a decomposition study. An empirical motivation for using this type of indexes
is given in Dietzenbacher and Los (1998). The Fisher-type of indexes are derived from
averaging the two polar decompositions, obtained from the “left to right” and the “right
to left” approach. However, there is a priori no reason why the sequence of changes
should be ordered in this way. For example, it is also possible that first B is changed,
after which c is changed, while a′ is changed last. This ordering would yield
)0()1(
zz =
)0()0()1()1()0()1(
)1()0()1()1()1()1(
)0()0()0()0()0()1(
cBacBa
cBacBa
cBacBa
′′
′′
′′
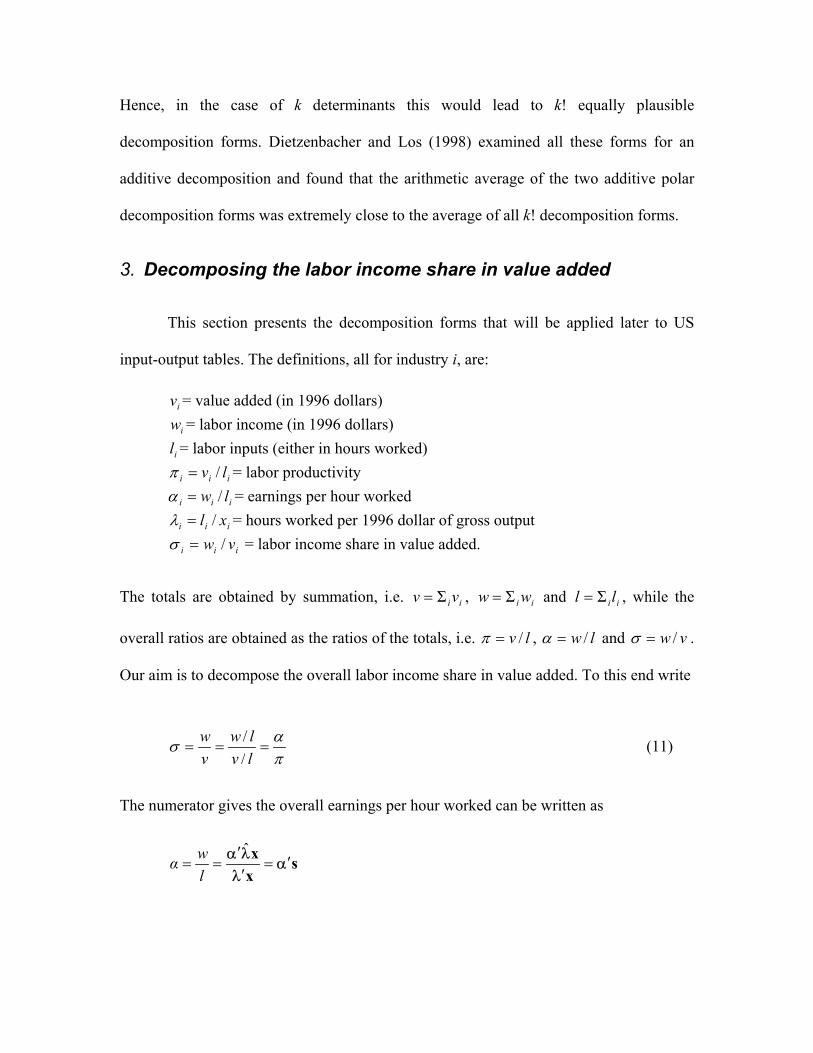
Hence, in the case of k determinants this would lead to k! equally plausible
decomposition forms. Dietzenbacher and Los (1998) examined all these forms for an
additive decomposition and found that the arithmetic average of the two additive polar
decomposition forms was extremely close to the average of all k! decomposition forms.
3. Decomposing the labor income share in value added
This section presents the decomposition forms that will be applied later to US
input-output tables. The definitions, all for industry i, are:
= value added (in 1996 dollars) iv = labor income (in 1996 dollars) iw = labor inputs (either in hours worked) il iii lv /=π = labor productivity
iii lw /=α = earnings per hour worked iii xl /=λ = hours worked per 1996 dollar of gross output iii vw /=σ = labor income share in value added.
The totals are obtained by summation, i.e. iivv Σ= , ii ww Σ= and , while the
overall ratios are obtained as the ratios of the totals, i.e.
ii ll Σ=
lv /=π , lw /=α and vw /=σ .
Our aim is to decompose the overall labor income share in value added. To this end write
πασ ===
lvlw
vw
// (11)
The numerator gives the overall earnings per hour worked can be written as
sxx
αλ
λα ′=′′
==ˆ
lwα
so that the overall ratio α is the weighted average of the sectoral ratios iα . The vector of
weights is given by s , where denotes the sectoral labor input as a share of
the total labor inputs (i.e.
x)λx)/( ′=
is
λ(ˆis
iΣ iiiiiii llxx Σ// == λλ ). Further, x ,
where A denotes the matrix of input coefficients, f the final demand vector, and
the Leontief inverse. Substitution yields
LffA) ≡− −1(I=
1)( −−= AIL
LfλeLfλ
ˆˆ
′′
=αα ,
where denotes the row summation vector, i.e. (1,…,1). In the same way we find that
the denominator in (11), i.e. the overall labor productivity, can be written as
e′
LfeLfs
xλx
λλπ
πλπ
ˆˆˆ
′′
=′=′
′==
lvπ .
The overall labor productivity is the weighted average of sectoral labor productivities,
again using sectoral labor input shares (in total labor inputs) as weights. This implies for
the ratio of aggregate labor income to value added
LfλLfλ
ˆˆ
πα
′′
=vw .
The two polar decompositions now yield that 01 /σσ equals
′
′
′
′
′
′
′
′
′
′
′
′
′
′
′
′
1000
0000
0000
1000
1100
1000
1000
1100
1110
1100
1100
1110
1111
1110
1110
1111
ˆˆ
ˆˆ
ˆˆ
ˆˆ
ˆˆ
ˆˆ
ˆˆ
ˆˆ
fLfL
fLfL
fLfL
fLfL
fLfL
fLfL
fLfL
fLfL
λπ
λπ
λα
λα
λπ
λπ
λα
λα
λπ
λπ
λα
λα
λπ
λπ
λα
λα
and
′
′
′
′
′
′
′
′
′
′
′
′
′
′
′
′
1111
0111
0111
1111
0111
0011
0011
0111
0011
0001
0001
0011
0001
0000
0000
0001
ˆˆ
ˆˆ
ˆˆ
ˆˆ
ˆˆ
ˆˆ
ˆˆ
ˆˆ
fLfL
fLfL
fLfL
fLfL
fLfL
fLfL
fLfL
fLfL
λπ
λπ
λα
λα
λπ
λπ
λα
λα
λπ
λπ
λα
λα
λπ
λπ
λα
λα
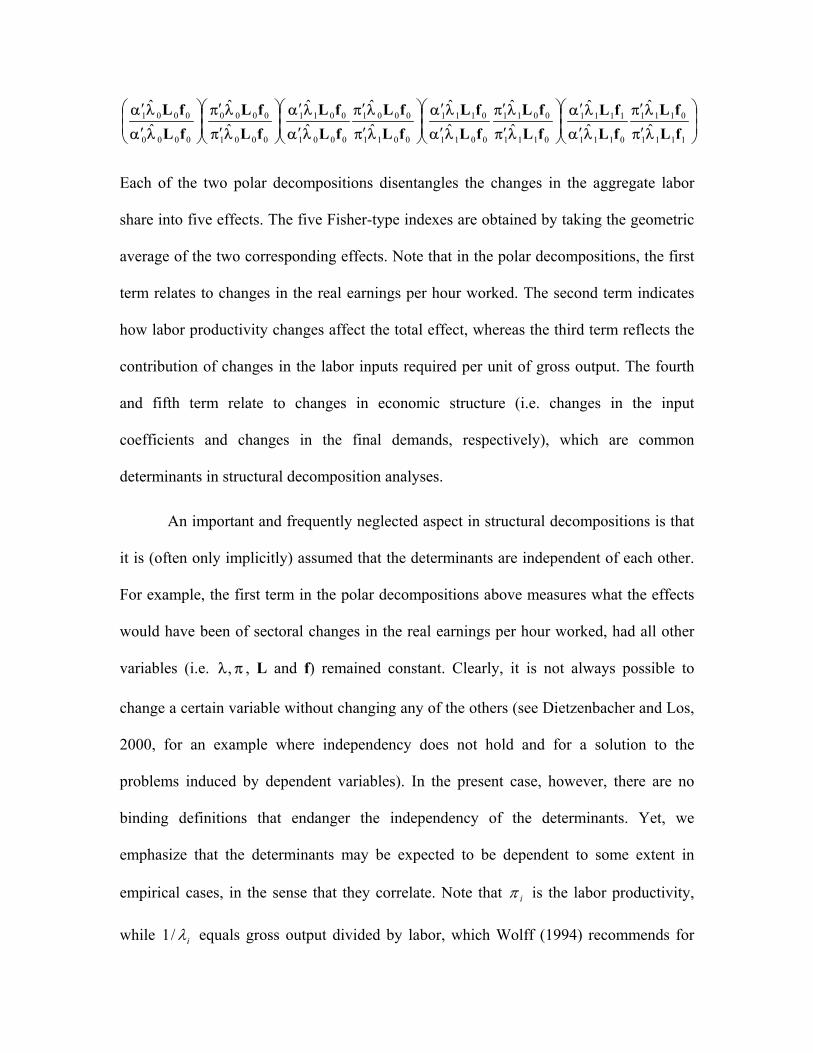
Each of the two polar decompositions disentangles the changes in the aggregate labor
share into five effects. The five Fisher-type indexes are obtained by taking the geometric
average of the two corresponding effects. Note that in the polar decompositions, the first
term relates to changes in the real earnings per hour worked. The second term indicates
how labor productivity changes affect the total effect, whereas the third term reflects the
contribution of changes in the labor inputs required per unit of gross output. The fourth
and fifth term relate to changes in economic structure (i.e. changes in the input
coefficients and changes in the final demands, respectively), which are common
determinants in structural decomposition analyses.
An important and frequently neglected aspect in structural decompositions is that
it is (often only implicitly) assumed that the determinants are independent of each other.
For example, the first term in the polar decompositions above measures what the effects
would have been of sectoral changes in the real earnings per hour worked, had all other
variables (i.e. , L and f) remained constant. Clearly, it is not always possible to
change a certain variable without changing any of the others (see Dietzenbacher and Los,
2000, for an example where independency does not hold and for a solution to the
problems induced by dependent variables). In the present case, however, there are no
binding definitions that endanger the independency of the determinants. Yet, we
emphasize that the determinants may be expected to be dependent to some extent in
empirical cases, in the sense that they correlate. Note that
πλ ,
iπ is the labor productivity,
while iλ/1 equals gross output divided by labor, which Wolff (1994) recommends for
measuring labor productivity. Also note that the real rate of labor compensation
iii lw /=α is included in labor productivity iii lv /=π , the difference between and w
being all non-labor income in sector i. So, an increase in labor productivity will induce an
increase in the real rate of labor compensation and/or nonlabor income per hour worked.
The relationship between the variables is that
iv i
)i( ii απλ − equals the share of nonlabor
income in the gross output value.
industry industry
gi
Iα
λ̂=
Iπ
I ασ =
So far, we have examined the decomposition of the overall labor income share in
value added. Similar results are obtained when we are interested in the contributions to
labor share changes for a group of aggregated sectors (say all manufacturing industries
taken together, or all service industries consolidated). To this end define the following
aggregation vector = (1,…,1, 0,…,0), or g′
=aggregate theofpart not is if 0
aggregate theofpart is if 1
ii
For the earnings per hour worked in the aggregate industry I, we then have
sgLfgLfg
αλλα ˆˆˆˆ
′=′
′=
where s . In the same way, we have for the labor productivity x)gx/( λ̂′
sgLfgLfg
πλλπ ˆˆˆˆ
′=′
′=
and II π/ . The rest of the analysis is similar to the analysis for the changes in the
overall labor share in value added.
4. Description of the Data Used To test the approach described at the end of the previous section, we elected to
use a recent series of U.S. national input-output tables. In particular, we decided to
analyze the effect of structural change on U.S. productivity with the benchmark tables for
1982, 1987, and 1992 produced by the U.S. Bureau of Economic Analysis (BEA). We
also opted to use BEA’s 1997 annual table to this series in lieu of the impending
benchmark table for that same year. BEA’s benchmark and 1997 annual tables contain
498 sectors. While other U.S. interindustry tables for intermediate years, these tables
alone reflect best the prevailing average national technology.
One of the issues in performing decomposition analyses with interindustry tables
is that their cell values are in terms of the nominal value of shipments. Hence, changes
over time in any interindustry coefficients can reflect price changes, technological
changes, or both. Therefore in order to isolate technology change, the values in the
interindustry tables should be set in constant value terms. Fortunately the U.S. Bureau of
Labor Statistics (BLS) has developed an annual series of input-output accounts in
constant value terms (presently, 1996 dollars) for the years 1983 to 1998. These accounts
have 192 sectors, including government. The BLS accounts also include estimates of
employment (in terms of jobs) and hours worked by sector for each year.
The problem with using the BLS accounts alone is that the technology inherent in
the interindustry portion of them is strictly that from the 1992 BEA benchmark table.
Indeed, the annual real margins of the BLS tables (the finals demands, imports, value
added and output accounts) along with the 1992 BEA Make and Use tables were
employed by BLS to produce their constant dollar series of input-output accounts. Hence,
we opted to follow BLS’s lead and employed their margin accounts to aggregated version
of three BEA benchmarks plus an annual table. Like van der Linden and Dietzenbacher
(2001), we used RAS to “double deflate” the BEA tables into constant 1996 U.S. dollars.
In the case of the 1982 BEA table, we applied 1983 BLS margins, understanding that this
adjustment while imprecise is the best that can be done given the available data.
The only account that we used that was not provided within the context of BLS’s
or BEA’s input-output accounts were those for national labor income. We produced them
using techniques similar to those described by Lahr (2001) for regions. That is, for a
given year, estimates of detailed industry payrolls were obtained from the U.S. Bureau of
Census’s County Business Patterns data. These then were enhanced using nominal data
on the compensation of employees by industry from more-aggregate gross product
accounts. We next calculated labor income-output ratios in nominal terms. These same
ratios were assumed to hold in real terms.
5. Causes of Labor’s Declining Share of Value Added
Decomposition of the aggregate economy
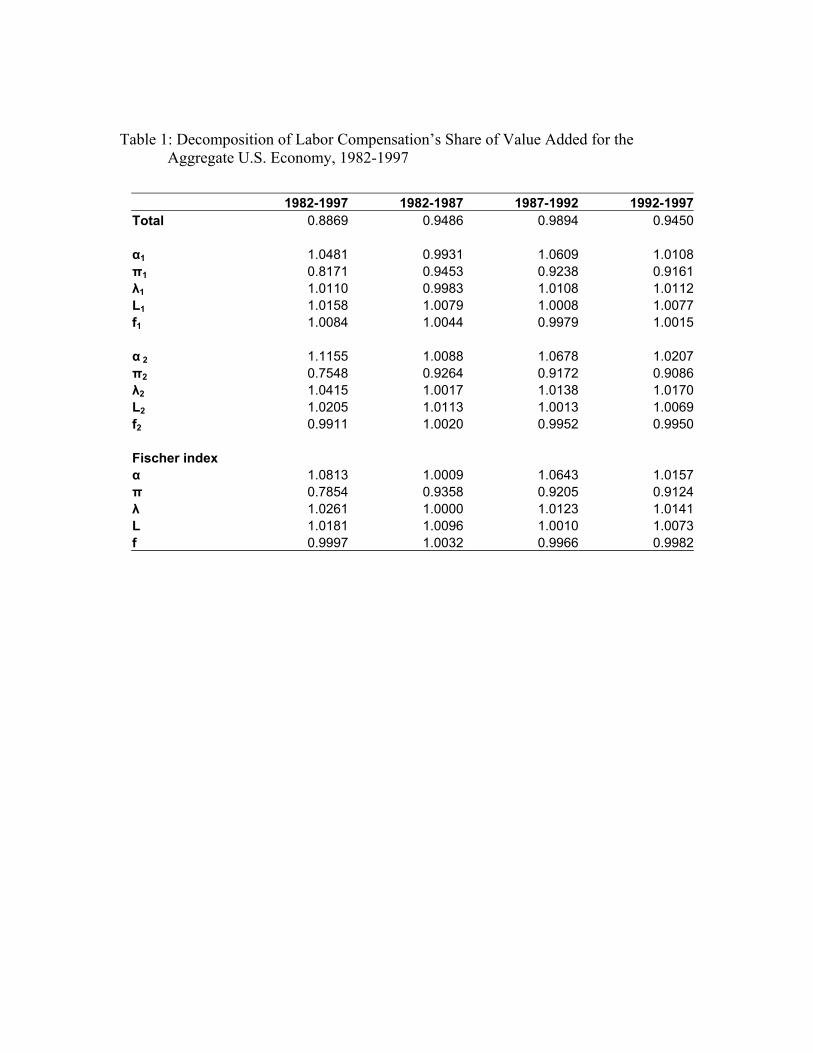
Table 1 shows the aggregate results of our decomposition. The figures in the
column labeled “Total” show that by 1997 labor’s share of value added for
nongovernment sectors at 55.1 percent had declined to 88.7 percent of its 1982 share of
62.1 percent. This compares to BEA’s measured modest decline from 59.5 to 57.8
percent (a decline in share of 2.9 percent) for all sectors, including government, for the
same years. Further since the value of “Total” is less than one for each successive period,
we can gather that the decline has been a rather steady one over the entire study period,
although things may have leveled off somewhat between 1987 and 1992, a period when
U.S. wages were rising somewhat more steeply compared to other portions of the last two
decades.
That the components of change for the second decomposition are typically
stronger show that trends in industry mix change have enhanced the effects of the
components of change in labor compensation’s share of value added. On the whole,
however, the components of the two polar decompositions provide similar findings.
Although they conflict with regard to the general direction of the effect, they
concur that final demand provided little impetus for change in labor compensation’s share
of value added. Because of the conflicting directions, the Fisher Index shows f inducing
even less change.
The remaining components demonstrate stronger similarities across the two
decompositions. Because of this, we confine the balance of the discussion of our results
for the entire economy to the Fisher Index only.
Did the change in input mix influence the demand for labor? Well, it seems that
while input mix consistently had a deleterious effect on the labor share of value added
over the period of study in any case. Its influence seems to have been not so strong,
however, on the order of only 0.2 percent annually over the entire study period. This
influence was virtually nonexistent between 1987 and 1992. Professor Leontief would
have been disappointed by this finding.
For all industries together, the inverse of productivity, the π term, enhanced its
downward pressure on compensation’s share of value added at an annual average rate of
1.6 percent from 1982 to 1997. Indeed, productivity’s negative influence accelerated
during each successive subperiod, from 1982 to 1987 it exerted a downward influence on
the order of 1.3 percent annually, from 1987 to 1992 the influence was 1.7 percent
annually, and from 1992 to 1997 it was 1.9 percent annually. This term’s influence is
negative because productivity forms the denominator of the ratio represented by
compensation’s share of value added.
The numerator of that ratio is real compensation per hour worked, α. Hence, it
should not be surprising that after π, α is the next most influential variable on
compensation share of value added. The influence of hourly compensation on the change
in compensation’s share of value added rose at a rate of 0.5 percent annually. Most of its
influence was wielded during a period the wage inflation just prior to the recession of the
early 1990s (i.e., between 1987 and 1992), when it rose at a rate of 1.2 percent annually.
During the five years just prior to that period, there was no measurable effect of the
hourly rate of compensation on compensation’s share of value added. During the five
years following 1992, its effectual stagnancy returned.
Decomposition by major sector
The changes by major sector (primary, manufacturing, and services) were
generally quite similar to those of the aggregate economy. There were some differences,
however, so we recount them here.
Not surprisingly, however, most of the differences appear in primary industries,
which are quite erratic because their behavior is motivated (dampened) by weather
(agriculture) and labor strife (mining). It therefore is characterized by heavily cyclicity,
which may not be well captured by an analysis undertaken on five-year intervals. In any
case, Table 2 shows that labor compensation actually improved its share of valued added
by 21.8 percent in the primary industries between 1982 and 1987: in our analysis it is the
only industry in any period to show any improvement. Its share edged downward,
however, during each subsequent five-year period.
Perhaps more significant is that structural components had a relatively strong
effect on compensation’s share in the primary industries. Their directions were no
different from that of the aggregate economy, however. Final demand change had a
particularly heavy negative effect on compensation’s share between 1982 and 1987. Its
negative effect moderated somewhat between 1987 and 1992 and then actually gave a lift
to compensation’s share of value added between 1992 and 1997, essentially
compensating for the losses it caused of the prior five years.
Hourly compensation and productivity generally had much stronger effects in the
primary industries than in either of the other two major sectors. This phenomenon could
be due to the retirement of less productive mines and agricultural land as the nation’s
less-developed trade partners were able to enter the market.
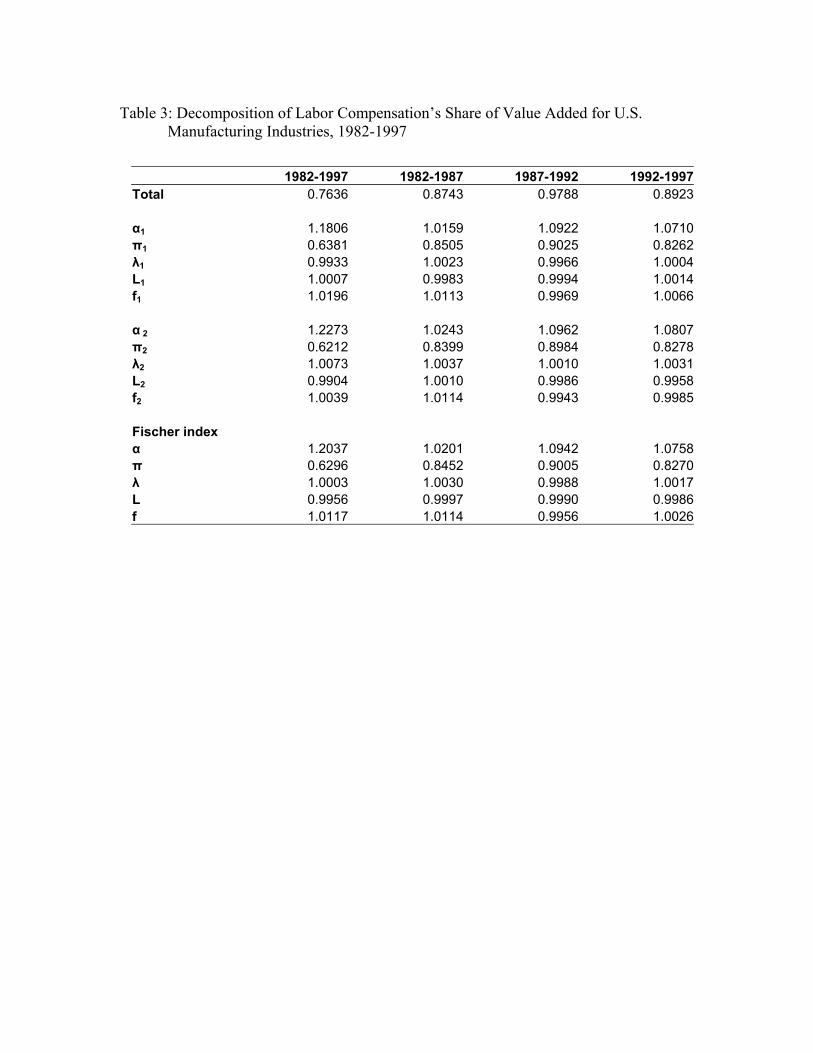
The results for Manufacturing and Services sectors (Tables 3 and 4, respectively)
had far fewer unique trends worth reporting. For Manufacturing sectors the most
interesting new thing that can be said is that the structural change components had even
less influence on compensation’s share of value added than they did for the aggregate
economy. Indeed, they were all almost negligible. In the case of the Service sectors, the
productivity and hourly compensation components were the smallest of the three major
sectors examined. Indeed, the share deteriorated by only 9.1 percent during the study
period compared to a fall of 23.6 percent for Manufacturing and a net rise of 17.5 percent
for the primary industries.
6. Conclusions So, in answer the question set out in the title of this paper, capital’s compensation
has been outpacing labor’s across more industries. While we cannot identify why this is
so, we have demonstrated that structure change and changes in industry mix have not
been main causes. Naturally one can hypothesize that it can be any one or a combination
of a number of factors such as:
• A decline of union membership;
• A strengthened mandate to get return to stockholders; or
• A recent trend in co-option of labor in the ownership of capital through retirement and mutual funds.
From prior studies of technology change, we might have hypothesized that input
mix would have little effect on compensation’s share of value added during a 15-year
span. And there were only a few notable changes in the composition of final demand
during the period. On the other hand, the U.S. experienced a wholesale shift in the
economy from a manufacturing base to a service one during the study period. Hence, we
were somewhat surprised by the very small effect of industry mix across all three major
industries.
References Blank, Rebecca. 1997. It Takes a Nation; A New Agenda to Fight Poverty. Princeton, NJ:
Princeton University Press.
Bordo, Michael D., Barry Eichengreen, and Douglas A. Irwin. 1999. Is globalization today really different than globalization a hundred years ago? NBER Working Paper No. 7195. Cambridge, MA: National Bureau of Economic Research. June.
Cobet, Aaron E. and Gregory A. Wilson. 2002. Comparing 50 years of labor productivity in U.S. and foreign manufacturing, Monthly Labor Review, June, pp. 51-65.
Danziger, Sheldon H. and Peter Gottschalk. 1995. America Unequal. New York and Cambridge, MA: Russell Sage Foundation and Harvard University Press.
Dietzenbacher, Erik. 2001. An intercountry decomposition of output growth in EC countries, in: M. L. Lahr and E. Dietzenbacher (eds) Input-Output Analysis: Frontiers and Extensions, (London, Palgrave), pp. 121-142.
Dietzenbacher, Erik, Alex E.Hoehn, and Bart Los. 2000. Labor productivity in Western Europe 1975-1985: An intercountry, interindustry comparison, Journal of Regional Science, 40, pp. 425-452.
Dietzenbacher, Erik and Bart Los. 2000. Structural decomposition with dependent determinants, Economic Systems Research, 12, pp. 498-514.
_____. 1998. Structural decomposition techniques: Sense and sensitivity, Economic Systems Research, 10, pp. 307-323.
_____. 1997. Analyzing decomposition analysis, in A. Simonovits and A. E. Steenge (eds) Prices Growth and Cycles (London, Macmillan), pp. 108-131.
Foley, Duncan K. 1998. An interview with Wassily Leontief, Macroeconomic Dynamics, 2, pp. 116-140.
Gordon, Robert J. 1997. Is there a tradeoff between unemployment and productivity?, In D. Snower and G. de la Dehesa, eds., Unemployment Policy: Government Options for the Labour Market. (Cambridge, U.K.: Cambridge University Press), pp. 433-463.
Lahr, Michael L. 2001. Reconciling domestication techniques, the notion of re-exports, and some comments on regional accounting,” Economic Systems Research, 13, 165-179
Leontief, Wassily. 1941. The Structure of American Economy, 1919-1929. (Cambridge, MA: Harvard University Press).
_____. 1951. The Structure of American Economy, 1919-1939: An Empirical Application of Equilibrium Analysis.(New York: Oxford University Press)
_____. 1953. Studies in the Structure of the American Economy.(New York: Oxford University Press).
______. 1956. Factor proportions and the structure of American trade: Further theoretical and applied analysis, Review of Economics and Statistics, 38, 386-407.
_____. 1965. Structure of the U.S. economy, Scientific American, 212, 25-35.
Linden, Jan A. van der and Erik Dietzenbacher. 2000. “The Determinants of Structural Change in the European Union: A New Application of RAS,” Environment and Planning A, 32, 2205-2229.
Reich, Robert B. 1991. The Work of Nations: Preparing Ourselves for 21st Century Capitalism. (New York: Alfred A. Knopf), pp. 178-179.
Wolff. 1994.
Table 1: Decomposition of Labor Compensation’s Share of Value Added for the Aggregate U.S. Economy, 1982-1997