A calibration-free ammonia breath sensor using a quantum cascade laser with WMS 2f/1f Kyle Owen • Aamir Farooq Received: 14 June 2013 / Accepted: 16 October 2013 Ó Springer-Verlag Berlin Heidelberg 2013 Abstract The amount of ammonia in exhaled breath has been linked to a variety of adverse medical conditions, including chronic kidney disease (CKD). The development of accurate, reliable breath sensors has the potential to improve medical care. Wavelength modulation spectros- copy with second harmonic normalized by the first har- monic (WMS 2f/1f) is a sensitive technique used in the development of calibration-free sensors. An ammonia gas sensor is designed and developed that uses a quantum cascade laser operating near 1,103.44 cm -1 and a multi- pass cell with an effective path length of 76.45 m. The sensor has a 7 ppbv detection limit and 5 % total uncer- tainty for breath measurements. The sensor was success- fully used to detect ammonia in exhaled breath and compare healthy patients to patients diagnosed with CKD. 1 Introduction The medical significance of the presence of ammonia in breath has been studied previously, demonstrating the usefulness of an ammonia sensor to diagnose and monitor a variety of medical conditions, including chronic kidney disease (CKD) [1], Helicobacter pylori infection [2], and encephalopathy [3]. Ammonia is a naturally occurring species in exhaled breath. Healthy individuals typically have a few hundred parts per billion by volume (ppbv) ammonia in their breath, while patients diagnosed with CKD, for example, could have over one part per million by volume (ppmv) ammonia in their breath [4]. Based on the established link between ammonia breath concentration and adverse medical conditions, the development of accurate sensors can improve medical treatment, providing beneficial diagnostic and monitoring tools. Laser-based sensors show great potential as they can achieve high sensitivity, provide real-time analysis, and their size makes them portable. Table 1 summarizes recent developments in laser-based ammonia breath sensors as well as the sensor developed in this work. All of these sensors were developed using strong absorption features in ammonia’s m 2 vibrational band, seen in Fig. 1. Carbon dioxide and water vapor, typically found in exhaled breath to be about 5 % and 6 % of the total gas mixture, respectively, also absorb in this wavelength region. The sensors described in Table 1 utilize strong ammonia transitions that have minimal interference from carbon dioxide and water vapor. The absorption feature near 1,103.44 cm -1 was chosen for this work because it has the least interference; \ 1 % of the absorbance at the ammonia peak is due to absorption from other species. Figure 2 shows a comparison between three ammonia absorption features and the interference from carbon dioxide and water vapor. This is the first ammonia breath sensor developed using this low interference feature; however, an ammonia sensor for atmospheric measurements using the same feature has been developed previously [9]. Our sensor is also unique in that it is calibration free and therefore does not require a reference cell or a correlation based on previous calibration experiments. The WMS 2f/1f method enables calibration- free detection as long as the spectroscopic parameters of the absorption feature are known. These parameters are typically taken from the HITRAN database [8]; however, breath composition is different from air so the broadening K. Owen A. Farooq (&) Clean Combustion Research Center, Division of Physical Sciences and Engineering, King Abdullah University of Science and Technology (KAUST), Thuwal 23955-6900, Saudi Arabia e-mail: [email protected]K. Owen e-mail: [email protected]123 Appl. Phys. B DOI 10.1007/s00340-013-5701-1
Transcript
A calibration-free ammonia breath sensor using a quantumcascade laser with WMS 2f/1f
Kyle Owen • Aamir Farooq
Received: 14 June 2013 / Accepted: 16 October 2013
� Springer-Verlag Berlin Heidelberg 2013
Abstract The amount of ammonia in exhaled breath has
been linked to a variety of adverse medical conditions,
including chronic kidney disease (CKD). The development
of accurate, reliable breath sensors has the potential to
improve medical care. Wavelength modulation spectros-
copy with second harmonic normalized by the first har-
monic (WMS 2f/1f) is a sensitive technique used in the
development of calibration-free sensors. An ammonia gas
sensor is designed and developed that uses a quantum
cascade laser operating near 1,103.44 cm-1 and a multi-
pass cell with an effective path length of 76.45 m. The
sensor has a 7 ppbv detection limit and 5 % total uncer-
tainty for breath measurements. The sensor was success-
fully used to detect ammonia in exhaled breath and
compare healthy patients to patients diagnosed with CKD.
1 Introduction
The medical significance of the presence of ammonia in
breath has been studied previously, demonstrating the
usefulness of an ammonia sensor to diagnose and monitor a
variety of medical conditions, including chronic kidney
disease (CKD) [1], Helicobacter pylori infection [2], and
encephalopathy [3]. Ammonia is a naturally occurring
species in exhaled breath. Healthy individuals typically
have a few hundred parts per billion by volume (ppbv)
ammonia in their breath, while patients diagnosed with
CKD, for example, could have over one part per million by
volume (ppmv) ammonia in their breath [4]. Based on the
established link between ammonia breath concentration
and adverse medical conditions, the development of
accurate sensors can improve medical treatment, providing
beneficial diagnostic and monitoring tools. Laser-based
sensors show great potential as they can achieve high
sensitivity, provide real-time analysis, and their size makes
them portable.
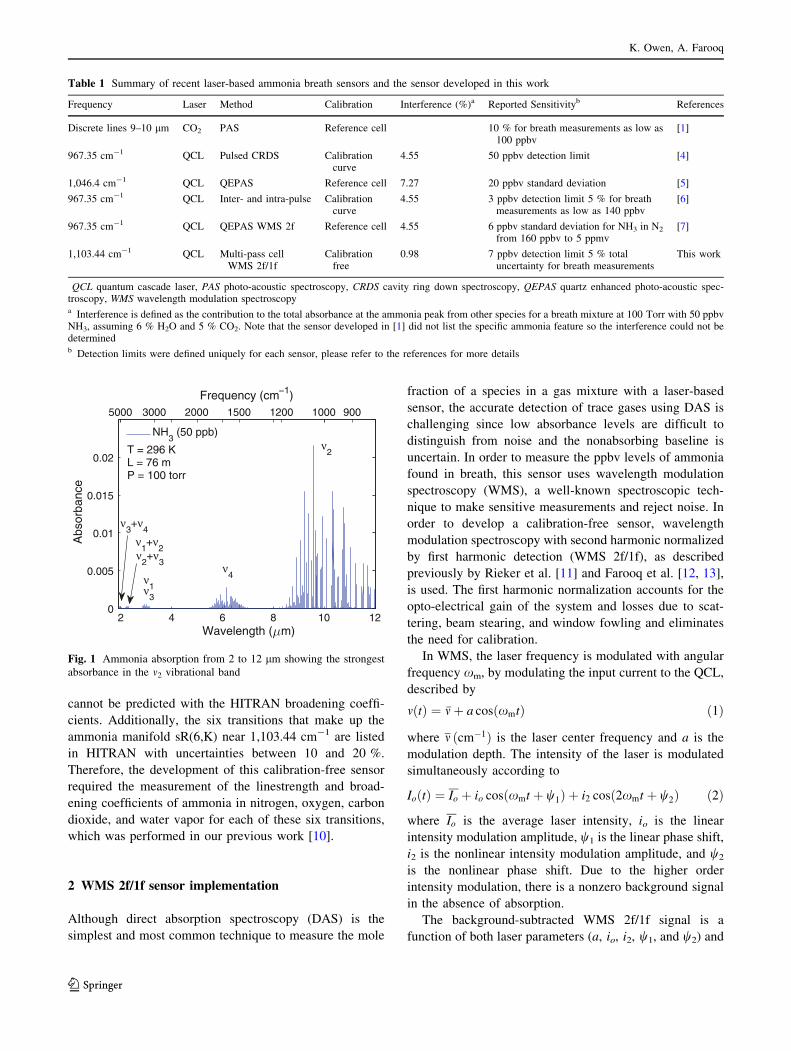
Table 1 summarizes recent developments in laser-based
ammonia breath sensors as well as the sensor developed in
this work. All of these sensors were developed using strong
absorption features in ammonia’s m2 vibrational band, seen
in Fig. 1. Carbon dioxide and water vapor, typically found in
exhaled breath to be about 5 % and 6 % of the total gas
mixture, respectively, also absorb in this wavelength region.
The sensors described in Table 1 utilize strong ammonia
transitions that have minimal interference from carbon
dioxide and water vapor. The absorption feature near
1,103.44 cm-1 was chosen for this work because it has the
least interference;\1 % of the absorbance at the ammonia
peak is due to absorption from other species. Figure 2 shows
a comparison between three ammonia absorption features
and the interference from carbon dioxide and water vapor.
This is the first ammonia breath sensor developed using
this low interference feature; however, an ammonia sensor
for atmospheric measurements using the same feature has
been developed previously [9]. Our sensor is also unique in
that it is calibration free and therefore does not require a
reference cell or a correlation based on previous calibration
experiments. The WMS 2f/1f method enables calibration-
free detection as long as the spectroscopic parameters of
the absorption feature are known. These parameters are
typically taken from the HITRAN database [8]; however,
breath composition is different from air so the broadening
K. Owen � A. Farooq (&)
Clean Combustion Research Center, Division of Physical
Sciences and Engineering, King Abdullah University of Science
and Technology (KAUST), Thuwal 23955-6900, Saudi Arabia
QCL quantum cascade laser, PAS photo-acoustic spectroscopy, CRDS cavity ring down spectroscopy, QEPAS quartz enhanced photo-acoustic spec-troscopy, WMS wavelength modulation spectroscopya Interference is defined as the contribution to the total absorbance at the ammonia peak from other species for a breath mixture at 100 Torr with 50 ppbvNH3, assuming 6 % H2O and 5 % CO2. Note that the sensor developed in [1] did not list the specific ammonia feature so the interference could not bedeterminedb Detection limits were defined uniquely for each sensor, please refer to the references for more details
2 4 6 8 10 120
0.005
0.01
0.015
0.02
Wavelength ( m)
Abs
orba
nce
NH3 (50 ppb)
5000 3000 2000 1500 1200 1000 900
Frequency (cm−1)
T = 296 KL = 76 mP = 100 torr
µ
ν1
ν2
ν3
ν4
ν1+ν
2ν
2+ν
3
ν3+ν
4
Fig. 1 Ammonia absorption from 2 to 12 lm showing the strongest
absorbance in the m2 vibrational band
K. Owen, A. Farooq
123
gas parameters (P, T, L, S, /, and Xi). The laser parame-
ters can be determined before the measurements, according
to the method described by Li et al. [14], and therefore, the
sensor can be used to measure one of the gas parameters if
others are known. This strategy is called ‘‘calibration free’’
because it allows for the measurement of concentration
without the need to calibrate the signal to a known mixture
as is necessary with traditional WMS [11].
The laser parameters were measured for different laser
settings (injection current, temperature, and wavelength)
and over time. It was found that there was some variation
in the exact values of the laser parameters from day to
day, but the changes were negligible when using the
sensor in a single day. Therefore, the laser parameters
were measured each day before using the sensor to reduce
the uncertainty in the measurement; typical values are
given in Table 2.
With measurements of the pressure, temperature, and
path length, the spectroscopic parameters determined
previously [10], and the laser parameters, an in-house
simulation code was used to calculate the WMS 2f/1f
signal. The simulated background signal was found by
running the simulation with ammonia mole fraction set to
zero. A guessed ammonia mole fraction was then used to
determine the simulated background-subtracted WMS 2f/
1f signal and the peak value of this signal. The simulated
peak value was used to calculate the actual mole fraction
of ammonia by comparison with the measured peak
value.
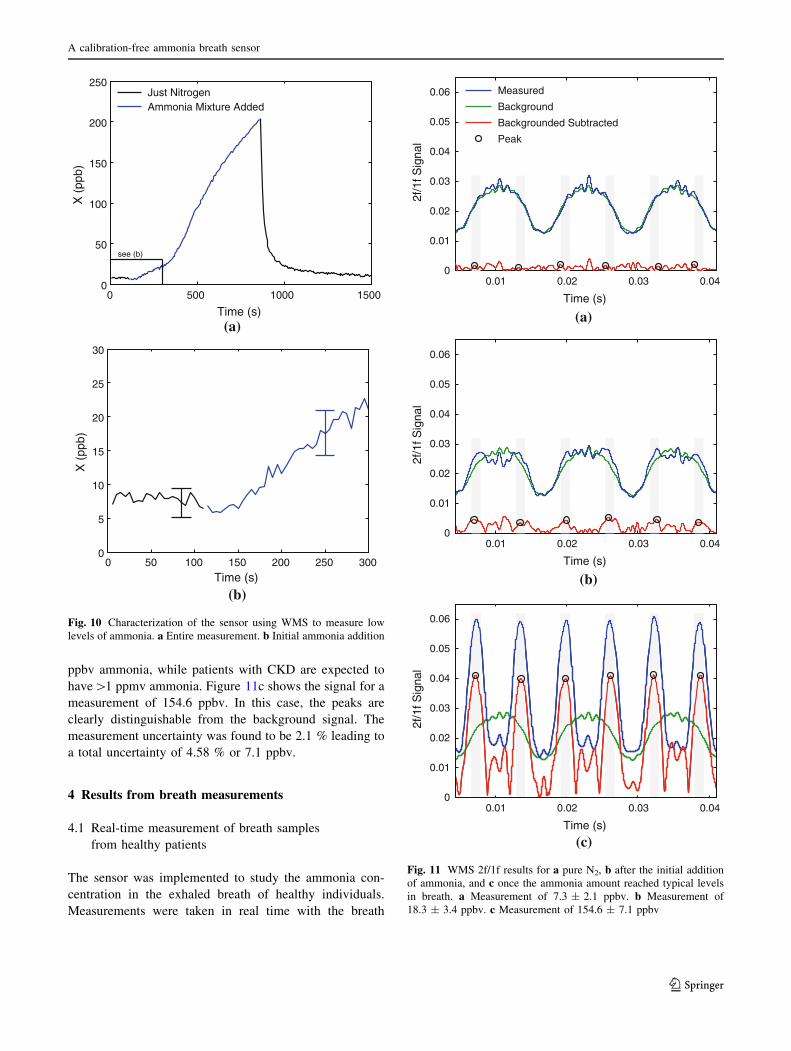
The measurements were performed using a continuous-
wave quantum cascade laser (cw-QCL), model sbcw2006,
from Alpes Lasers (Neuchatel, Switzerland; http://www.
alpeslasers.ch/), which was chosen since it is tunable over
1,100.4–1,108.2 cm-1 by adjusting the laser temperature
and injection current. The laser temperature was varied
using a TCU200 temperature controller supplied by Alpes
Lasers, while the current was controlled using an ILX
Lightwave LDX 3232 high compliance laser diode driver.
The QCL was mounted in a laboratory laser housing, which
included a thermoelectric cooler. Stronger absorbance
levels were achieved by using an AMAC-76 astigmatic
967.2 967.3 967.4 967.50
0.005
0.01
0.015
0.02
Frequency (cm−1)
Abs
orba
nce
Interference = 4.55%T = 296 KL = 76 mP = 100 torr
NH3 (50 ppb)CO2 (5%)H2O (6%)Total
(a)
1046.2 1046.3 1046.4 1046.5 1046.60
0.01
0.02
0.03
0.04
Abs
orba
nce
Interference = 7.27%T = 296 KL = 76 mP = 100 torr
NH3 (50 ppb)CO2 (5%)H2O (6%)Total
(b)
1103.3 1103.4 1103.5 1103.60
0.003
0.006
0.009
0.012
Abs
orba
nce
Interference = 0.98%T = 296 KL = 76 mP = 100 torr
NH3 (50 ppb)CO2 (5%)H2O (6%)Total
(c)
Frequency (cm−1)
Frequency (cm−1)
bFig. 2 Simulations of the interference from carbon dioxide (5 %) and
water vapor (6 %) on low levels of ammonia (50 ppb), comparing the
ammonia features used for previous sensors to the feature selected for
this sensor. The interference, defined as (Total - NH3)/Total
absorbance at the ammonia peak, is lowest for the ammonia feature
selected for this sensor. The spectrum for each individual species was
calculated from parameters in HITRAN 2008 [8]. a Previous sensors
[4, 6, 7] utilized the ammonia feature centered at 967.35 cm-1. b A
previous sensor [5] utilized the ammonia feature centered at
1,046.4 cm-1. c This sensor utilizes the ammonia feature centered
at 1,103.44 cm-1
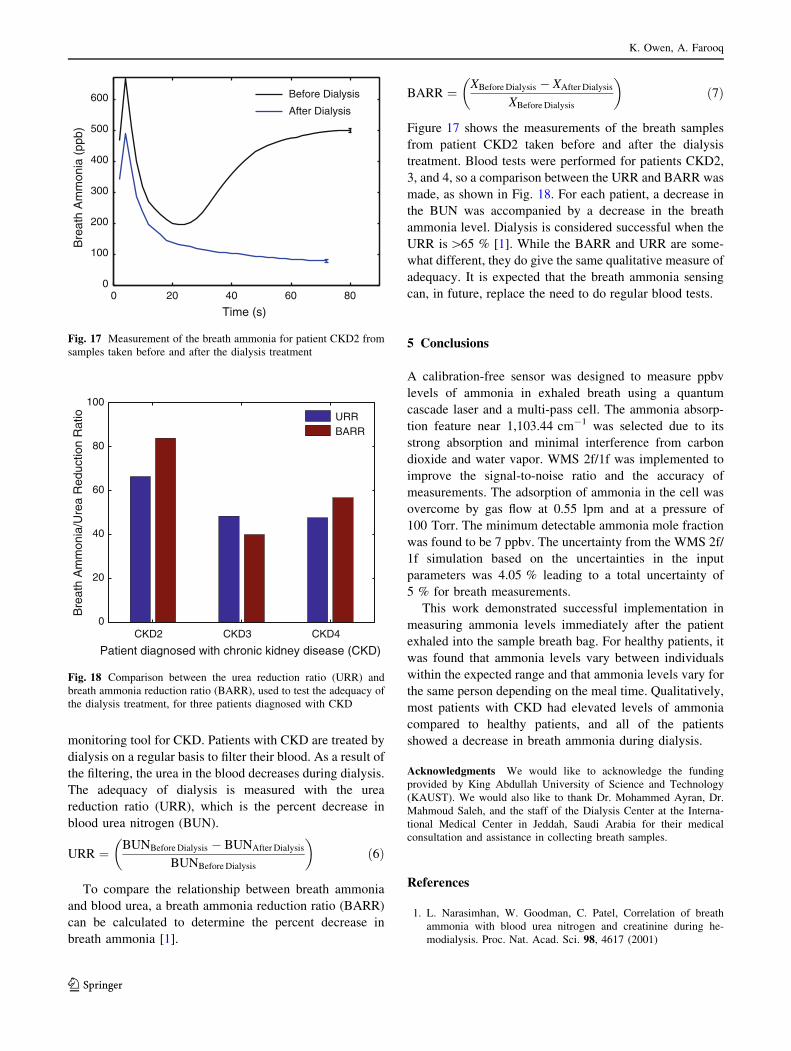
Table 2 Typical laser parameters at a modulation frequency of