The Astrophysical Journal, 779:135 (16pp), 2013 December 20 doi:10.1088/0004-637X/779/2/135 C 2013. The American Astronomical Society. All rights reserved. Printed in the U.S.A. A CANDELS–3D-HST SYNERGY: RESOLVED STARFORMATION PATTERNS AT 0.7 <z< 1.5 Stijn Wuyts 1 , Natascha M. F ¨ orster Schreiber 1 , Erica J. Nelson 2 , Pieter G. van Dokkum 2 , Gabe Brammer 3 , Yu-Yen Chang 4 , Sandra M. Faber 5 , Henry C. Ferguson 6 , Marijn Franx 7 , Mattia Fumagalli 7 , Reinhard Genzel 1 , Norman A. Grogin 6 , Dale D. Kocevski 8 , Anton M. Koekemoer 6 , Britt Lundgren 9 , Dieter Lutz 1 , Elizabeth J. McGrath 10 , Ivelina Momcheva 2 , David Rosario 1 , Rosalind E. Skelton 11 , Linda J. Tacconi 1 , Arjen van der Wel 4 , and Katherine E. Whitaker 12 1 Max-Planck-Institut f¨ ur extraterrestrische Physik, Postfach 1312, Giessenbachstr., D-85741 Garching, Germany; [email protected]2 Astronomy Department, Yale University, New Haven, CT 06511, USA 3 European Southern Observatory, Alonson de C´ ordova 3107, Casilla 19001, Vitacura, Santiago, Chile 4 Max-Planck-Institut f¨ ur Astronomie, K ¨ onigstuhl 17, D-69117 Heidelberg, Germany 5 UCO/Lick Observatory, Department of Astronomy and Astrophysics, University of California, Santa Cruz, CA 95064, USA 6 Space Telescope Science Institute, 3700 San Martin Drive, Baltimore, MD 21218, USA 7 Leiden Observatory, Leiden University, P.O. Box 9513, 2300 RA Leiden, The Netherlands 8 Department of Physics and Astronomy, University of Kentucky, Lexington, KY 40506, USA 9 Department of Astronomy, University of Wisconsin-Madison, Madison, WI 53706, USA 10 Department of Physics and Astronomy, Colby College, Waterville, ME 0490, USA 11 South African Astronomical Observatory, Observatory Road, 7925 Cape Town, South Africa 12 Astrophysics Science Division, Goddard Space Flight Center, Greenbelt, MD 20771, USA Received 2013 July 1; accepted 2013 October 18; published 2013 December 3 ABSTRACT We analyze the resolved stellar populations of 473 massive star-forming galaxies at 0.7 <z< 1.5, with multi- wavelength broadband imaging from CANDELS and Hα surface brightness profiles at the same kiloparsec resolution from 3D-HST. Together, this unique data set sheds light on how the assembled stellar mass is distributed within galaxies, and where new stars are being formed. We find the Hα morphologies to resemble more closely those observed in the ACS I band than in the WFC3 H band, especially for the larger systems. We next derive a novel prescription for Hα dust corrections, which accounts for extra extinction toward H ii regions. The prescription leads to consistent star formation rate (SFR) estimates and reproduces the observed relation between the Hα/UV luminosity ratio and visual extinction, on both a pixel-by-pixel and a galaxy-integrated level. We find the surface density of star formation to correlate with the surface density of assembled stellar mass for spatially resolved regions within galaxies, akin to the so-called “main sequence of star formation” established on a galaxy-integrated level. Deviations from this relation toward lower equivalent widths are found in the inner regions of galaxies. Clumps and spiral features, on the other hand, are associated with enhanced Hα equivalent widths, bluer colors, and higher specific SFRs compared to the underlying disk. Their Hα/UV luminosity ratio is lower than that of the underlying disk, suggesting that the ACS clump selection preferentially picks up those regions of elevated star formation activity that are the least obscured by dust. Our analysis emphasizes that monochromatic studies of galaxy structure can be severely limited by mass-to-light ratio variations due to dust and spatially inhomogeneous star formation histories. Key words: galaxies: high-redshift – galaxies: stellar content – galaxies: structure – stars: formation Online-only material: color figures 1. INTRODUCTION Studies of galaxy evolution from the peak of cosmic star formation to the present day have matured tremendously over the past two decades. Initially, efforts focused on the detection and selection of distant blobs of light by means of color selec- tions (Steidel et al. 1996; Franx et al. 2003; Daddi et al. 2004), of which generally brighter subsets were confirmed spectro- scopically. Gradually, galaxy-integrated photometry over ever increasing wavelength baselines, from the rest-frame UV to infrared (IR), enabled inferences of the global stellar popula- tion properties such as stellar mass, age, and star formation rate (SFR; Papovich et al. 2001; F¨ orster Schreiber et al. 2004; Shapley et al. 2005). Alongside developments on the stellar pop- ulation front, deep-field observations carried out with the Hubble Space Telescope (HST) have played a pivotal role in opening up the distant universe for resolved, morphological analyses (e.g., Williams et al. 1996; Giavalisco et al. 2004; Rix et al. 2004; Koekemoer et al. 2007). Initially, such look-back surveys were predominantly monochromatic, or at most spanning a limited number of bands probing the rest-frame UV emission, which is dominated by young O and B stars. The first HST-based extensions into the rest-frame optical of high-redshift galaxies already date back more than a decade (Thompson et al. 1999; Dickinson et al. 2000), but until recently were limited to small sample sizes due to the small field of view of the NICMOS camera. The installment of the Wide Field Camera 3 (WFC3) during Servicing Mission 4 changed the situation dramatically. Benefiting from WFC3’s enhanced sensitivity and larger field of view, the Cosmic Assembly Near-infrared Deep Extragalactic Legacy Survey (CANDELS; Grogin et al. 2011; Koekemoer et al. 2011) has been mapping the rest-optical properties of galaxies since the peak of cosmic star formation at high resolution in five disjoint fields on the sky (GOODS-South, GOODS-North, COSMOS, UDS, EGS). Exploiting initial subsets of the CANDELS legacy data 1 https://ntrs.nasa.gov/search.jsp?R=20140008680 2018-07-29T23:35:18+00:00Z
A CANDELS–3D-HST SYNERGY: RESOLVED STAR FORMATION PATTERNS AT 0.7 < z < 1.5
Stijn Wuyts1, Natascha M. Forster Schreiber1, Erica J. Nelson2, Pieter G. van Dokkum2, Gabe Brammer3,Yu-Yen Chang4, Sandra M. Faber5, Henry C. Ferguson6, Marijn Franx7, Mattia Fumagalli7, Reinhard Genzel1,
Norman A. Grogin6, Dale D. Kocevski8, Anton M. Koekemoer6, Britt Lundgren9, Dieter Lutz1,Elizabeth J. McGrath10, Ivelina Momcheva2, David Rosario1, Rosalind E. Skelton11, Linda J. Tacconi1,
Arjen van der Wel4, and Katherine E. Whitaker121 Max-Planck-Institut fur extraterrestrische Physik, Postfach 1312, Giessenbachstr., D-85741 Garching, Germany; [email protected]
2 Astronomy Department, Yale University, New Haven, CT 06511, USA3 European Southern Observatory, Alonson de Cordova 3107, Casilla 19001, Vitacura, Santiago, Chile
4 Max-Planck-Institut fur Astronomie, Konigstuhl 17, D-69117 Heidelberg, Germany5 UCO/Lick Observatory, Department of Astronomy and Astrophysics, University of California, Santa Cruz, CA 95064, USA
6 Space Telescope Science Institute, 3700 San Martin Drive, Baltimore, MD 21218, USA7 Leiden Observatory, Leiden University, P.O. Box 9513, 2300 RA Leiden, The Netherlands
8 Department of Physics and Astronomy, University of Kentucky, Lexington, KY 40506, USA9 Department of Astronomy, University of Wisconsin-Madison, Madison, WI 53706, USA
10 Department of Physics and Astronomy, Colby College, Waterville, ME 0490, USA11 South African Astronomical Observatory, Observatory Road, 7925 Cape Town, South Africa
12 Astrophysics Science Division, Goddard Space Flight Center, Greenbelt, MD 20771, USAReceived 2013 July 1; accepted 2013 October 18; published 2013 December 3
ABSTRACT
We analyze the resolved stellar populations of 473 massive star-forming galaxies at 0.7 < z < 1.5, with multi-wavelength broadband imaging from CANDELS and Hα surface brightness profiles at the same kiloparsec resolutionfrom 3D-HST. Together, this unique data set sheds light on how the assembled stellar mass is distributed withingalaxies, and where new stars are being formed. We find the Hα morphologies to resemble more closely thoseobserved in the ACS I band than in the WFC3 H band, especially for the larger systems. We next derive a novelprescription for Hα dust corrections, which accounts for extra extinction toward H ii regions. The prescriptionleads to consistent star formation rate (SFR) estimates and reproduces the observed relation between the Hα/UVluminosity ratio and visual extinction, on both a pixel-by-pixel and a galaxy-integrated level. We find the surfacedensity of star formation to correlate with the surface density of assembled stellar mass for spatially resolved regionswithin galaxies, akin to the so-called “main sequence of star formation” established on a galaxy-integrated level.Deviations from this relation toward lower equivalent widths are found in the inner regions of galaxies. Clumpsand spiral features, on the other hand, are associated with enhanced Hα equivalent widths, bluer colors, and higherspecific SFRs compared to the underlying disk. Their Hα/UV luminosity ratio is lower than that of the underlyingdisk, suggesting that the ACS clump selection preferentially picks up those regions of elevated star formationactivity that are the least obscured by dust. Our analysis emphasizes that monochromatic studies of galaxy structurecan be severely limited by mass-to-light ratio variations due to dust and spatially inhomogeneous star formationhistories.
Studies of galaxy evolution from the peak of cosmic starformation to the present day have matured tremendously overthe past two decades. Initially, efforts focused on the detectionand selection of distant blobs of light by means of color selec-tions (Steidel et al. 1996; Franx et al. 2003; Daddi et al. 2004),of which generally brighter subsets were confirmed spectro-scopically. Gradually, galaxy-integrated photometry over everincreasing wavelength baselines, from the rest-frame UV toinfrared (IR), enabled inferences of the global stellar popula-tion properties such as stellar mass, age, and star formationrate (SFR; Papovich et al. 2001; Forster Schreiber et al. 2004;Shapley et al. 2005). Alongside developments on the stellar pop-ulation front, deep-field observations carried out with the HubbleSpace Telescope (HST) have played a pivotal role in opening upthe distant universe for resolved, morphological analyses (e.g.,Williams et al. 1996; Giavalisco et al. 2004; Rix et al. 2004;
Koekemoer et al. 2007). Initially, such look-back surveys werepredominantly monochromatic, or at most spanning a limitednumber of bands probing the rest-frame UV emission, which isdominated by young O and B stars.
The first HST-based extensions into the rest-frame opticalof high-redshift galaxies already date back more than a decade(Thompson et al. 1999; Dickinson et al. 2000), but until recentlywere limited to small sample sizes due to the small field ofview of the NICMOS camera. The installment of the WideField Camera 3 (WFC3) during Servicing Mission 4 changedthe situation dramatically. Benefiting from WFC3’s enhancedsensitivity and larger field of view, the Cosmic AssemblyNear-infrared Deep Extragalactic Legacy Survey (CANDELS;Grogin et al. 2011; Koekemoer et al. 2011) has been mappingthe rest-optical properties of galaxies since the peak of cosmicstar formation at high resolution in five disjoint fields onthe sky (GOODS-South, GOODS-North, COSMOS, UDS,EGS). Exploiting initial subsets of the CANDELS legacy data
The Astrophysical Journal, 779:135 (16pp), 2013 December 20 Wuyts et al.
set, several works have contrasted monochromatic structuralmeasurements to galaxy-integrated stellar population properties(Wuyts et al. 2011b; Weinzirl et al. 2011; Szomoru et al.2011; Bell et al. 2012; Wang et al. 2012; Kartaltepe et al.2012; Bruce et al. 2012). Overall, these authors found strongcorrelations between structure and stellar populations (i.e., a“Hubble sequence”) to be present out to at least z ∼ 2.5 (seealso Franx et al. 2008; Kriek et al. 2009a). Star-forming galaxies(SFGs) residing on the SFR–mass “main sequence” relation(Noeske et al. 2007; Elbaz et al. 2007, 2011; Daddi et al. 2007)tend to be the largest at their mass, and are best characterized byexponential disk profiles, while quiescent galaxies lying belowthe main sequence have higher Sersic indices, i.e., are morebulge-dominated (Wuyts et al. 2011b; although see Barro et al.2013 for interesting sub-populations deviating from this overalltrend). This implies bulge growth and quenching are intimatelyconnected.
The molecular gas content of normal SFGs is known to in-crease rapidly with look-back time, to gas mass fractions of∼0.33 (0.47) at z ∼ 1.2 (2.2) (Tacconi et al. 2010, 2013;Daddi et al. 2010). Simple stability arguments predict such gas-rich systems to be prone to gravitational collapse on scales of∼1 kpc. Indeed, such features, and more generally irregular mor-phologies, have been abundantly reported in high-redshift SFGs(albeit on monochromatic, and often rest-UV or Hα images; see,e.g., Elmegreen et al. 2004, 2009b; Genzel et al. 2008, 2011).Analytic work as well as hydrodynamic simulations have pro-posed that the giant clumps may migrate inward via dynamicalfriction and tidal torques, thereby providing an alternative chan-nel to bulge formation to the conventional merger scenario (e.g.,Noguchi 1999; Immeli et al. 2004a, 2004b; Bournaud et al. 2007;Dekel et al. 2009). In part, the efficiency of such violent diskinstabilities in driving significant bulge growth is subject to thelongevity of the clumps, which may be limited by vigorous out-flows driven by internal star formation (e.g., Newman et al. 2012;Genel et al. 2012; Hopkins et al. 2012). However, several studiesargued that even if the clumps do not remain bound, torques inunstable disks will still lead to an enhanced gas inflow rate withrespect to stable configurations (Krumholz & Burkert 2010;Bournaud et al. 2011; Genel et al. 2012; Cacciato et al. 2012).
Additional clues on the emergence of bulges and the role ornature of clumps can come from studies of the resolved stellarpopulations within galaxies. Here too, Advanced Camera forSurveys (ACS) + WFC3 imaging from CANDELS and pre-existing campaigns offer the capability to expand sensitively onpioneering work by, e.g., Abraham et al. (1999), Elmegreenet al. (2009a), and Forster Schreiber et al. (2011a, 2011b).Wuyts et al. (2012) carried out seven-band stellar populationmodeling on a (binned) pixel-by-pixel basis for 649 massive(log M∗ > 10) SFGs at 0.5 < z < 2.5, the largest andonly mass-complete sample of SFGs subject to such a detailedanalysis to date. Translating the internal variations in intensityand color to spatial distributions of more physically relevantquantities such as stellar mass, SFR, age, and extinction, theseauthors found high-redshift SFGs to be smoother and morecompact in mass than in light, with color variations driven bya combination of radial extinction gradients and spatial (short-term) fluctuations in the star formation history (see also ForsterSchreiber et al. 2011a, 2011b; Guo et al. 2012; Lanyon-Fosteret al. 2012; Szomoru et al. 2013). In particular, Wuyts et al.(2012) and Guo et al. (2012) found regions with enhancedsurface brightness with respect to the underlying disk to becharacterized by enhanced levels of star formation and younger
ages than interclump regions at the same galactocentric distance.Typical inferred clump ages of 100–200 Myr at z ∼ 2 imply thatthe clumps correspond to short-lived star-forming phenomena,possibly limited in lifetime by stellar feedback. If inward clumpmigration is taking place, this should happen efficiently ontimescales similar to the orbital timescale. Radial age gradientsof clumps (Forster Schreiber et al. 2011b; Guo et al. 2012) maysignal such migrational processes to be at play. At z ∼ 1, whichis the epoch we focus on in this paper, the physics leading toregions of excess surface brightness and locally enhanced starformation may be a mix of the above violent disk instabilitiesfrequently studied at z ∼ 2 and more conventional processesknown from nearby SFGs. That is, gas fractions can still besufficiently high to cause gravitational collapse while timescalesbecome long enough for other instabilities, such as spiral densitywaves, to arise (the latter are only in rare cases seen at z ∼ 2;see Law et al. 2012). We note, as we did in our previous work,that while for simplicity we occasionally use the same short-hand “clump” terminology as Wuyts et al. (2012), the specificdiagnostic identifying enhanced surface brightness regions doesnot discriminate between round knots or spiral features.
Despite the richness of the HST broadband data sets, themulti-wavelength sampling available at high resolution is stillmodest in comparison to state-of-the-art spectral energy distri-butions (SEDs) on a galaxy-integrated level. The latter span upto 30+ medium and broad bands from 0.3 to 8 μm (e.g., Ilbertet al. 2009; Whitaker et al. 2011; Spitler et al. 2012), com-plemented further by mid-IR-to-far-IR photometry, and probedust-obscured star formation within at least the more massiveSFGs (e.g., Magnelli et al. 2013). The performance and lim-itations of broadband SED modeling as a tool to infer stellarpopulation properties have been abundantly tested on syntheticobservations of simulated galaxies (Wuyts et al. 2009; Lee et al.2009; Pforr et al. 2012; Mitchell et al. 2013). It is clear that,while four to seven HST broad bands may be sufficient to re-construct stellar mass distributions,13 some level of degeneracy(e.g., between age and dust extinction) will be inherent to theinferences made on a pixel-by-pixel basis when SEDs span therelatively narrow wavelength range from observed B to H band.Additional empirical constraints would allow us to test and buildon the more model-sensitive findings from Wuyts et al. (2012).
The 3D-HST legacy program (van Dokkum et al. 2011;Brammer et al. 2012) and GOODS-North grism survey GO-11600 (PI: B. Weiner), together covering all five CANDELSfields, provide two such empirical constraints. First, the grismdata yields spectroscopic redshifts for thousands of galaxies,eliminating an important source of uncertainty that propagates inall derived stellar population properties. Second, each dispersedgalaxy image can be considered as a continuum with superposedresolved line emission maps at HST resolution. After subtractingthe continuum underlying the Hα emission of z ∼ 1 galaxies, weare therefore left with an independent SFR diagnostic probingthe same kiloparsec scales as the CANDELS multi-wavelengthbroadband imaging. The additional information furthermoreallows us to better constrain the effects of extinction. Nelsonet al. (2012, 2013) demonstrated the power of this technique bycontrasting the stacked one-dimensional Hα and H-band surfacebrightness profiles. They found the extent of the ionized gas and
13 Stellar mass estimates to an accuracy of ∼0.2 dex can arguably even beobtained on the basis of two broad bands, provided they bracket theBalmer/4000 Å break (Bell & de Jong 2001; Taylor et al. 2011; and seeForster Schreiber et al. 2011a for an application of this technique to theresolved mass distribution in a z ∼ 2 galaxy).
2
The Astrophysical Journal, 779:135 (16pp), 2013 December 20 Wuyts et al.
stellar light profiles to be similar for small galaxies. The ionizedgas component of the larger galaxies, on the other hand, exhibitlarger scale lengths than the stellar component, consistent withan inside-out growth scenario. As is the case for rest-opticallight profiles, the Hα emission of SFGs in their sample is bestcharacterized by an exponential disk profile.
In this paper, we build on the analyses by Nelson et al.(2012, 2013) and Wuyts et al. (2012) by combining the re-solved Hα information on z ∼ 1 SFGs with pixel-by-pixel stel-lar population modeling of their multi-wavelength broadbandphotometry. The present work has strong connections to a verycomprehensive exploration of Hα and SFR profiles throughoutthe two-dimensional (2D) SFR–mass space (E. Nelson et al.in preparation). While restricting the analysis to systems withwell-detected line emission, we expand the sample with respectto previous work by exploiting the data in all five CANDELS/3D-HST fields (see the sample description in Section 2). Wediscuss the methodology to derive stellar population propertiessuch as star formation and surface mass density in Section 3.Here, we place a special emphasis on dust corrections, and inparticular extra extinction toward the H ii regions from whichthe Hα line emission originates, using UV+IR based SFRs as anadditional calibrator. After a visual impression of characteristicfeatures in the Hα and broadband images (Section 4), we quan-tify the correspondence between Hα and broadband morpholo-gies at different wavelengths (Section 5.1), compare emissionline diagnostics to stellar population properties derived frombroadband information alone (Section 5.2), and finally contrastthe Hα and corresponding star formation properties of galaxycenters, clumps/spiral arms, and underlying disks within oursample of SFGs with log M∗ > 10 (Section 5.3).
Throughout this paper, we quote magnitudes in the AB sys-tem, assume a Chabrier (2003) initial mass function (IMF) andadopt the following cosmological parameters: (ΩM, ΩΛ, h) =(0.3, 0.7, 0.7).
2. OBSERVATIONS AND SAMPLE
HST broadband imaging from CANDELS and pre-existingsurveys, together with HST grism spectroscopy from 3D-HST,form the core data set on which this paper is based. In addition,our sample definition makes use of the wealth of ancillarydata collected in the five CANDELS/3D-HST fields, includingmultiple medium-band and broadband imaging campaigns fromthe ground, and space-based photometry from Spitzer/IRAC,Spitzer/MIPS, and Herschel/PACS. We derived the galaxy-integrated stellar masses and SFRs based thereupon followingidentical procedures to Wuyts et al. (2011b). That is, the SFRsthat enter the sample selection criteria are based on a ladder ofSFR indicators, using UV+PACS for PACS-detected galaxiesand UV+MIPS 24 μm for MIPS-detected galaxies; SFRs fromSED modeling (which also yield the stellar masses) are usedfor sources without IR detection. The 3D-HST catalogs withconsistent multi-wavelength photometry that serve as input tothe galaxy-integrated SED modeling are presented by R. Skeltonet al. (in preparation).
2.1. CANDELS HST Imaging
CANDELS provides deep WFC3 imaging of five disjointfields on the sky: GOODS-South, GOODS-North, COSMOS,UDS, and EGS, totaling approximately 800 arcmin2. Point-source limiting depths vary from H = 27.0 mag in CANDELS/Wide to H = 27.7 mag in CANDELS/Deep (the central halves
of the GOODS fields). We refer the reader to Grogin et al.(2011) for an overview of the survey layout and Koekemoeret al. (2011) for details on the data reduction. Other HSTimaging that enters our analysis includes the GOODS ACScampaigns (Giavalisco et al. 2004) and subsequent ACS epochstaken as part of the HST supernovae search, COSMOS/ACS(Koekemoer et al. 2007), AEGIS/ACS (Davis et al. 2007), andERS/WFC3 (PI: O’Connell) observations. Together, these yieldB435V606i775z850J125H160 photometry in the GOODS fields,with an additional Y098 coverage of the ERS region (top thirdof GOODS-South), and Y105 coverage of the CANDELS/Deep regions. For the remaining fields, SEDs are sampled byV606I814J125H160 photometry.
2.2. 3D-HST Grism Spectroscopy
Brammer et al. (2012) describe in detail the specifications ofthe 3D-HST legacy program. Briefly, 3D-HST14 covers threequarters (625 arcmin2) of the CANDELS treasury survey area,and naturally our sample will be drawn from the region wherethe two data sets overlap. In this paper, we make use of thetwo orbit depth WFC3/G141 grism exposures, but note thatin parallel two to four orbits of ACS/G800L grism data weretaken as part of the program. The WFC3/G141 grism data reacha 5σ emission-line sensitivity of ∼5 × 10⁻¹⁷ erg s−1 cm−2 andcover a wavelength range from 1.1 to 1.6 μm. We make useof the v2.1 internal release by the 3D-HST team, which differsmost significantly from the data handling described by Brammeret al. (2012) in that the half-pixel dithered exposures arecombined by interlacing rather than drizzling, thereby reducingthe correlated noise. The extraction of grism spectra followedthe steps outlined by Brammer et al. (2012). As part of theextraction pipeline, a spectral model is constructed that, onceconvolved with the F140W pre-image of the galaxy that serves asa template, best fits the observed grism spectrum. In this process,neighbors are treated simultaneously to reduce contaminationeffects. Redshifts are fitted to the combination of availablebroadband and grism information. In practice, for the sampleof line-emitting galaxies analyzed in this paper, the ancillarybroadband data only serves in the redshift determination toprevent line misidentifications.
2.3. Sample Definition
The adopted redshift range of 0.7 < z < 1.5 for our sampleis dictated by the requirement that the Hα emission falls withinthe WFC3/G141 wavelength coverage. We next apply the samebasic criteria to select massive SFGs as Wuyts et al. (2012),namely log M∗ > 10 and a specific SFR (SSFR) > 1/tHubble.The depth of the H-band selected parent catalogs guaranteescompleteness down to this mass limit (and in fact more thanan order of magnitude below). Over the entire CANDELS/3D-HST area with coverage by the G141 grism spectroscopy and atleast four HST broad bands, this amounts to 1844 massive z ∼ 1SFGs.
Subsequent selection criteria serve to optimize the qualityof our inferences on resolved Hα properties at the expense ofcompromising the mass completeness of our SFG sample. Forour final sample, we require galaxies to have secure redshiftswith well-covered Hα emission detected at the 8σ significancelevel. We furthermore apply a conservative screening against
14 The G141 grism coverage of the GOODS-North field from programGO-11600 (PI: B. Weiner) is incorporated into 3D-HST as the observationalstrategy is nearly identical to that of 3D-HST.
3
The Astrophysical Journal, 779:135 (16pp), 2013 December 20 Wuyts et al.
Table 1Sample Selection of Massive SFGs at 0.7 < z < 1.5 with Hα Maps from 3D-HST
Selection N (Total) N (GOODS-S) N (GOODS-N) N (EGS) N (UDS) N (COSMOS)
Note. a Compact or heavily point-source-dominated sources with an X-ray counterpart are excluded from the final sample.
objects whose grism spectra are contaminated by neighboringsources, as identified based on products of the 3D-HST pipeline,supplemented with a visual inspection. In this step, we also weedout a small number of sources with prominent residuals overthe full wavelength range after subtraction of the continuummodel produced by the 3D-HST extraction and fitting pipeline.Finally, we exclude 33 bright X-ray detected objects for whichthe compact nature of their HST imaging could hint at asignificant non-stellar contribution to both the broadband andthe Hα line emission. Before the latter cut, the overall fraction ofX-ray detected sources in the Hα sample exceeds the respectiveX-ray detected fraction determined for the complete parentsample of massive SFGs by a factor of 1.5 (∼12% versus∼8%15). A possible explanation for this difference may be atendency for actively star-forming, line-emitting galaxies tomore frequently host active galactic nucleus (AGN) activity(e.g., Santini et al. 2012; Trump et al. 2013). In addition, sincethe Hα and [N ii] emission lines are blended in the WFC3 grismdata (see Section 3.2), the enhanced [N ii]/Hα ratios of AGN-hosting galaxies may push more of them over the signal-to-noisethreshold for line emission. In our final sample, the only X-raydetected sources remaining are located in GOODS-South (16)and GOODS-North (7). We note that in these deep X-ray fields(4 Ms and 2 Ms exposure, respectively), not all X-ray detectedsources are necessarily AGNs. Moreover, no evidence for pointsource contamination is seen in their HST imaging. We breakdown our final sample and the intermediate selection steps byfield in Table 1.
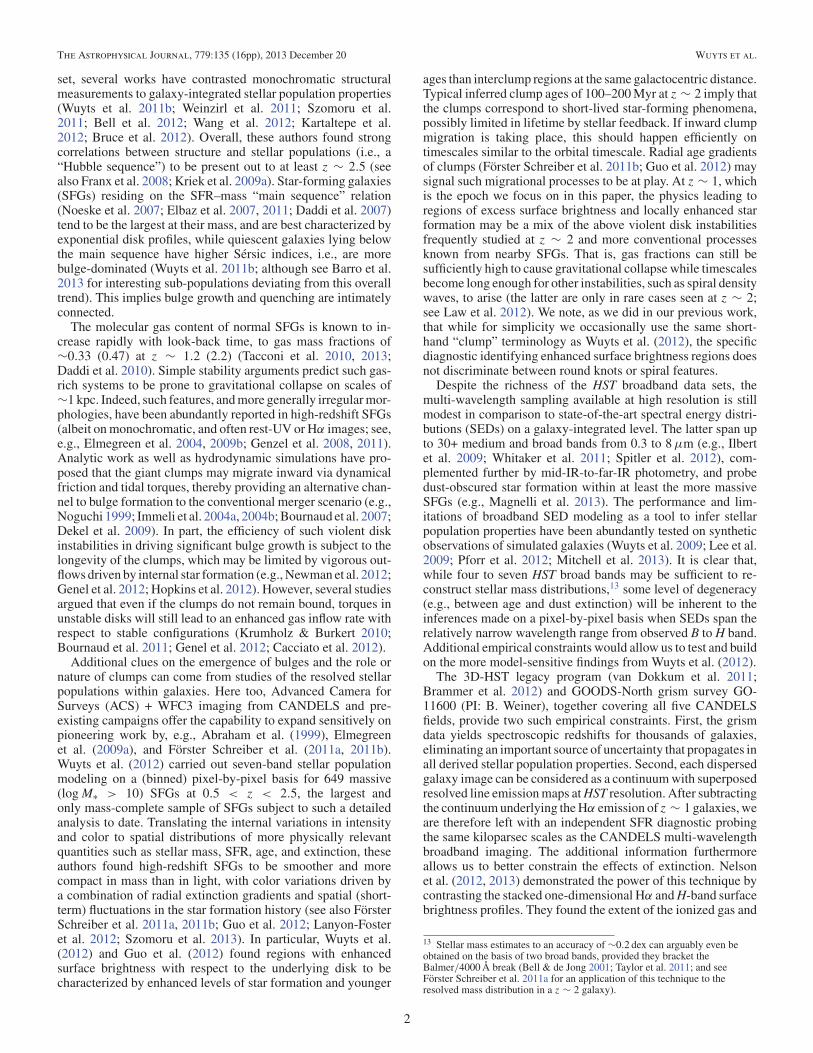
It is important to note that our final sample of 473 massiveSFGs spans the entire range in mass and SFR of typical main-sequence galaxies above log(M∗) = 10 (see Figure 1). The insetpanels in Figure 1 present a closer look at the relation betweenthe Hα sample and the underlying complete parent populationof massive SFGs at 0.7 < z < 1.5. At first glance, the samplesare well matched in redshift, mass, star formation activity,obscuration (SFRIR/SFRUV), axial ratio, and size, in terms ofdynamic range spanned as well as the distribution within thatrange. In more detail, the Hα sample shows subtle biases againstthe lowest SSFR systems, against the most obscured galaxiesat a given SFR, and, related, against the most edge-on galaxies.The similarity between the two samples is encouraging, as itimplies that the analysis of the Hα sample presented in thispaper can reveal generic insights for the entire massive SFGpopulation during the transition from the peak of cosmic starformation to the initial phases of its decline.
15 The percentages quoted are for the sum of all five CANDELS/3D-HSTfields. While the absolute percentages are field-dependent due to varying depthof the X-ray imaging, the relative factor of 1.5 between the Hα and parentsample is similar for all fields.
Figure 1. Location of our massive SFG sample (red) in SFR–mass space,overplotted on the distribution of the overall galaxy population at 0.7 < z < 1.5.Crosses mark X-ray-detected sources. Inset panels show the distribution inredshift, stellar mass ([M�]), specific SFR ([yr−1]), and obscuration level(SFRIR/SFRUV) for the Hα sample analyzed in this paper (red) comparedto the complete sample of SFGs above log M∗ = 10 (black).
(A color version of this figure is available in the online journal.)
3. METHODOLOGY
3.1. Modeling of the Broadband SEDs
The three basic steps toward resolved SED modeling arepoint-spread function (PSF) matching, pixel binning, and stellarpopulation synthesis modeling of the individual spatial bins.Each of these steps is described in depth by Wuyts et al. (2012).Briefly, we work at the WFC3 H160 resolution of 0.′′18 and usedthe Iraf PSFMATCH algorithm to build kernels to bring allshorter wavelength images to the same PSF width and shape.We next applied the Voronoi binning scheme by Cappellari &Copin (2003) to group neighboring pixels together in bins so asto achieve a minimum signal-to-noise level of 10 per bin. Weapplied the Voronoi binning scheme to the WFC3 H160 maps.Photometry in the other (PSF-matched) ACS and WFC3 bandswas measured within the identical bins of grouped pixels inorder to guarantee that the colors entering our analysis probeconsistently the same physical regions. The resulting multi-wavelength photometry per spatial bin is then fed to EAZY(Brammer et al. 2008) to derive rest-frame photometry andFAST (Kriek et al. 2009b) to fit stellar population synthesismodels from Bruzual & Charlot (2003) with identical settings
4
The Astrophysical Journal, 779:135 (16pp), 2013 December 20 Wuyts et al.
to Wuyts et al. (2011b, 2012). Since all galaxies in our samplehave spectroscopically confirmed redshifts from the Hα linedetection in the grism data (and in half of the cases confirmedindependently by ground-based spectroscopic campaigns), wefix the redshift to its spectroscopically determined value in ourSED fitting, hence reducing the number of free parametersby one. In addition, we assume the stars have a fixed, solarmetallicity. While this assumption is frequently adopted in theliterature on stellar populations of massive z ∼ 1 galaxies, wecaution that additional constraints and further investigations areneeded to address the validity and impact of this assumptionfor resolved studies on kiloparsec scales. We follow Salimet al. (2007) in adopting parameter values marginalized over themulti-dimensional grid explored in SED fitting, as this approachproved most robust (compared to, e.g., adopting the least squaressolution) in the limit of poorly sampled SEDs. Additional noteson the reliability of the broadband SED modeling and its impacton the results presented in this paper are discussed in theAppendix.
3.2. Extracting Hα Emission Line Maps
In order to extract Hα emission line maps, we follow Nelsonet al. (2012, 2013), and subtract the continuum model fromthe observed 2D grism spectrum. The resulting residual imageis then mapped to the CANDELS frame using redshift andastrometric information, and contains the emission line surfacebrightness distribution without imposed prior on its morphology.At the spectral resolution of δv ≈ 1000 km s−1, Hα and [N ii]λλ6548+6583 are blended. As we lack additional constraints,we apply throughout the paper a simple downscaling of theobserved emission line flux by a factor of 1.2, and refer tothis quantity as the Hα flux. In reality, [N ii]/Hα ratios mayvary between galaxies as well as spatially within galaxies (see,e.g., Liu et al. 2008; Yuan et al. 2012, 2013; Queyrel et al.2012; Swinbank et al. 2012; Jones et al. 2013; N. M. ForsterSchreiber et al. in preparation). However, restricting the abovespectroscopic samples to the same redshift range as adoptedin this paper, the scatter in [N ii]/Hα is substantial comparedto any systematic trend, if present, with galaxy mass abovelog(M∗) = 10. Furthermore, the [N ii]/Hα gradients reportedbased on adaptive optics assisted observations are typicallyshallow (N. M. Forster Schreiber et al. in preparation). Weconclude that a higher order correction than the uniform scalingfactor we apply is not justified by the present data.
Again following Nelson et al. (2013), we apply a wedge-shaped mask to regions that could potentially be affected by[S ii] λλ6716+6731 line emission (redward from Hα along thedispersion axis), which can mimic the appearance of an off-center clump in the Hα maps.
3.3. Dust Corrections to the Hα Emission
3.3.1. Birth Clouds and Diffuse Interstellar Dust
Proper extinction corrections are critical for the physicalinterpretation of dust-sensitive SFR tracers. This applies toshort wavelength (rest-UV) broadband indicators, motivating toa large extent programs such as CANDELS. While at the longer,rest-optical wavelengths, attenuation laws predict a significantlysuppressed impact by dust; this may not be the case for the Hαemission at 6563 Å, depending on the geometry of dust andstars. Hα emission originates from H ii regions immediatelysurrounding young star-forming regions, which are known tobe often associated with enhanced levels of obscuring material.
As such, the nebular emission emerging near massive O starsthat have not yet dispersed or escaped from their dust-richbirth clouds will be subject to extra extinction with respect tocontinuum light at the same wavelength that is produced by thebulk of the stars (no longer embedded in the molecular cloudsin which they once formed). The observed (i.e., attenuated) Hαflux then relates to the intrinsic flux FHα,int as
FHα,obs = FHα,int 10−0.4Acont 10−0.4Aextra , (1)
where Acont represents the attenuation by diffuse dust in thegalaxy and Aextra represents the attenuation happening locallyin the birth cloud. The latter have a negligible covering factorand therefore affect no other galaxy light than that emergingfrom the respective star-forming region itself. The geometricalpicture sketched here relates intimately to the framework of theCharlot & Fall (2000) model and subsequent refinements by,e.g., Wild et al. (2011), Pacifici et al. (2012), and Chevallardet al. (2013).
Empirical evidence for the need of an extra extinctioncorrection to Hα (i.e., Aextra �= 0) was first presented for a sampleof nearby starburst galaxies by Calzetti et al. (1994, 2000). Alsoat larger look-back times, evidence for differential extinctionbetween nebular regions and the bulk of the stars has beenmounting, from arguments based on the observed Hα equivalentwidths (EWs; van Dokkum et al. 2004; Forster Schreiber et al.2009), comparisons of multi-wavelength SFR indicators (Wuytset al. 2011a; Mancini et al. 2011), and measurements of theBalmer decrement (Ly et al. 2012; Price et al. 2013). Whileshowing a median consistency with the local calibration byCalzetti et al. (2000; Aextra = 1.27Acont), the uncertainties andsample sizes used in those studies did not allow the authors todiscriminate between a constant Aextra (i.e., constant birth cloudproperties independent of the optical depth from the diffusecomponent) and one that scales proportionally with the diffusecolumn as Aextra ∝ Acont. Conceptually, one can think of thediffuse attenuation as being determined by the galaxy’s gasfraction, dust-to-gas ratio, large-scale geometry, and orientation.The attenuation from birth clouds is expected to share some ofthese dependencies (e.g., dust-to-gas ratio), but not others (e.g.,orientation, as demonstrated by Wild et al. 2011). If the gasfraction of a galaxy increases, all other properties remaining thesame, nothing will change to Aextra if this results merely in anincreased number of star-forming clouds, each with identicalconditions. If the mass of individual clouds does increase withgalaxy-integrated gas fraction, it depends on the cloud scalingrelations whether this impacts Aextra (e.g., for a Larson 1981scaling relation ρcloud ∼ r−1 the optical depth would remainunaffected).
From these considerations, we conclude that the precise func-tional form of Aextra may not be a constant or proportional toAcont, but rather a hybrid form between those two extremes (i.e.,Aextra saturating with increasing Acont). By lack of other directconstraints at z ∼ 1, we take an empirical approach to cap-ture this behavior and define a prescription that yields a smallscatter and negligible systematic offset between two sets ofgalaxy-integrated SFR measurements. As reference, we adoptthe ladder of SFR indicators from Wuyts et al. (2011b), whichis based on UV+IR emission, or SED modeling in cases where
5
The Astrophysical Journal, 779:135 (16pp), 2013 December 20 Wuyts et al.
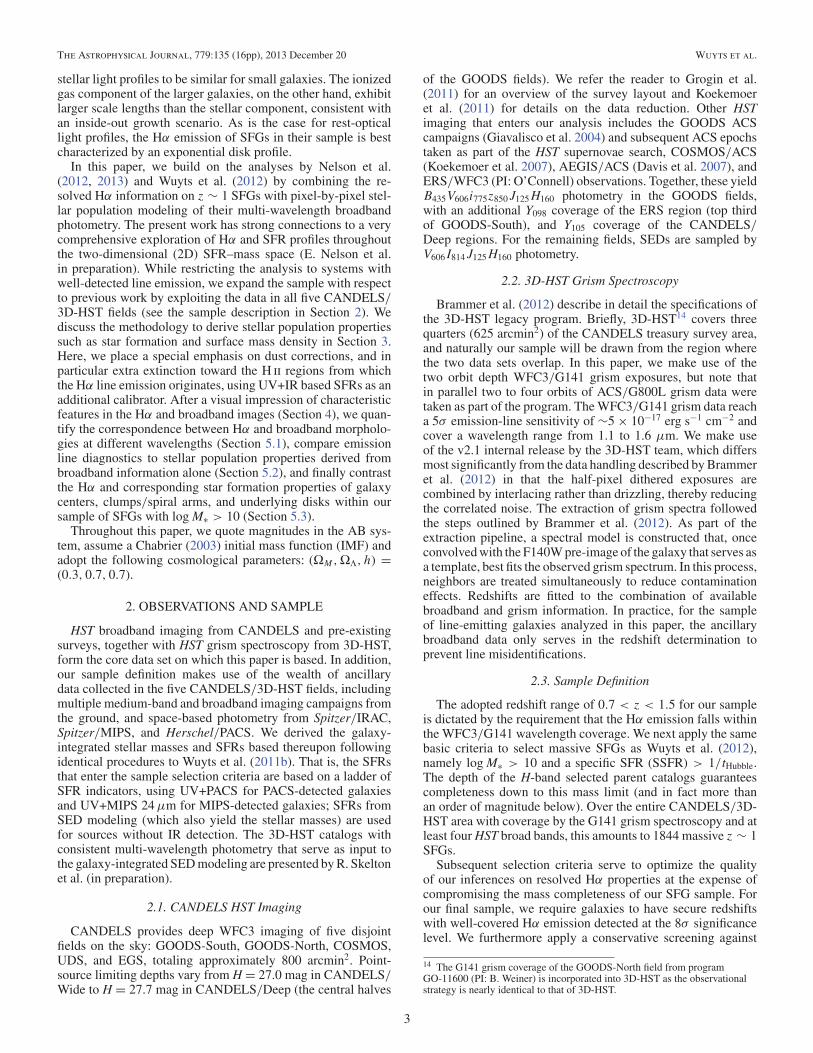
Figure 2. Comparison of Hα-based SFR estimates to the reference ladderof SFR indicators from Wuyts et al. (2011b), in order of priority based onUV + Herschel/PACS, or Spitzer/MIPS 24 μm, or U-to-8 μm SED modeling.We mark UV+IR-based SFRs in red and indicate galaxies without IR detectionswith gray circles. Crowded regions of the diagram are displayed with a darkerhue. Hα SFRs need to be corrected for dust extinction to avoid underestimates(top panel). Applying an extinction correction corresponding to what is inferredfrom SED modeling is insufficient (middle panel). Accounting for extraextinction toward H ii regions, we find a good correspondence to the referenceSFRs with modest scatter and without systematic offsets (bottom panel).
(A color version of this figure is available in the online journal.)
no IR detection is available (see Section 2). Figure 2 contrastsHα-based SFRs from 3D-HST to the reference SFRs. The toppanel iterates the obvious necessity for dust corrections to theHα emission. The large sample statistics exploited here alsodemonstrate unambiguously the presence of additional extinc-tion toward the nebular regions (middle panel of Figure 2, whereAextra = 0 is assumed and significant systematic underestimatesfor highly star-forming systems are evident). Finally, the bottompanel of Figure 2 shows the improved agreement between the
SFR measurements once differential extinction is accounted for.The adopted prescription,
Aextra = 0.9Acont − 0.15A2cont, (2)
yields a scatter of 0.227 dex and a negligible systematic offsetof −0.035 dex. We note that applying the Calzetti et al. (2000)prescription for extra extinction (corresponding to AHα =Acont/0.44, or equivalently Aextra = 1.27Acont) leads to a slightlyhigher systematic offset of 0.066 dex and produces a largerscatter of 0.284 dex. If we were to adopt the Calzetti et al.(2000) prescription, all objects with high inferred AV valuesfrom broadband SED modeling would have dust-corrected HαSFRs systematically in excess of the reference indicator. Wenote that the need for an extra extinction correction is a resultthat is largely driven by the more actively SFGs. For mostof them, UV+IR (i.e., bolometric, rather than dust corrected)measurements of the SFR are available. Those galaxies that lackIR detections in the CANDELS/3D-HST fields generally sufferless obscuration and are therefore less sensitive to the precisedust correction applied (although applying a constant Aextra,even to sources with Acont near zero, would lead to overestimatedHα SFRs at the low-SFR end).
3.3.3. Hα/UV Ratios
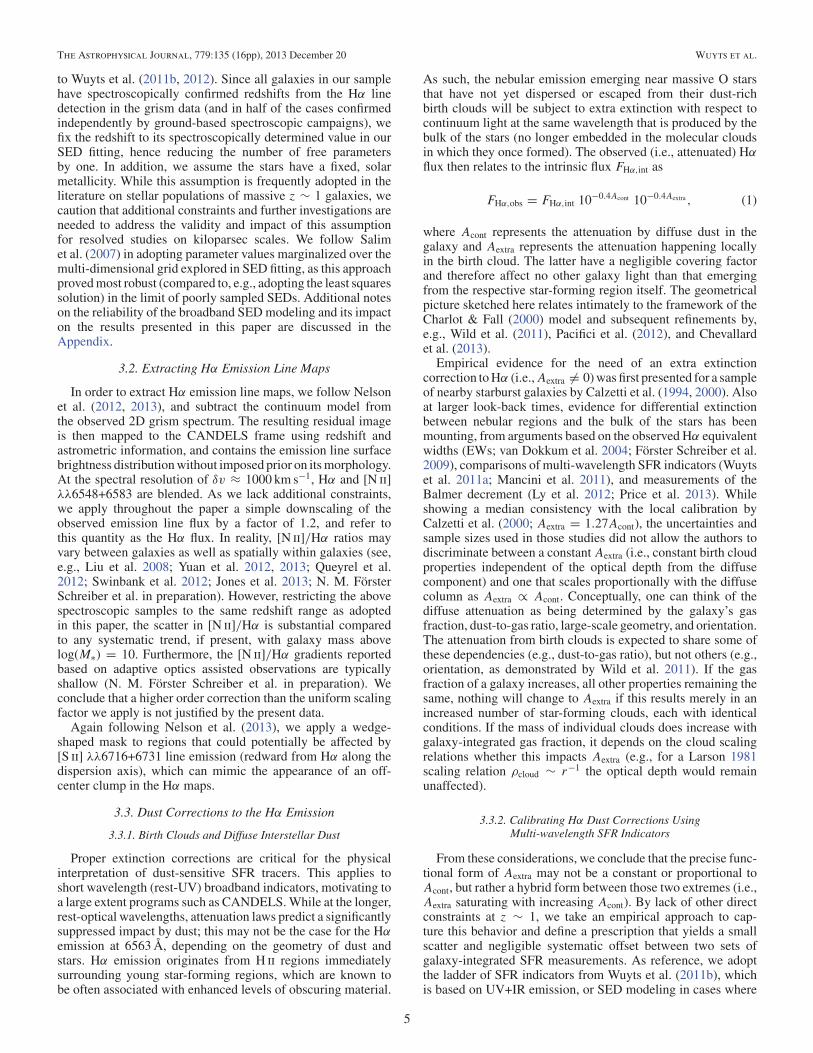
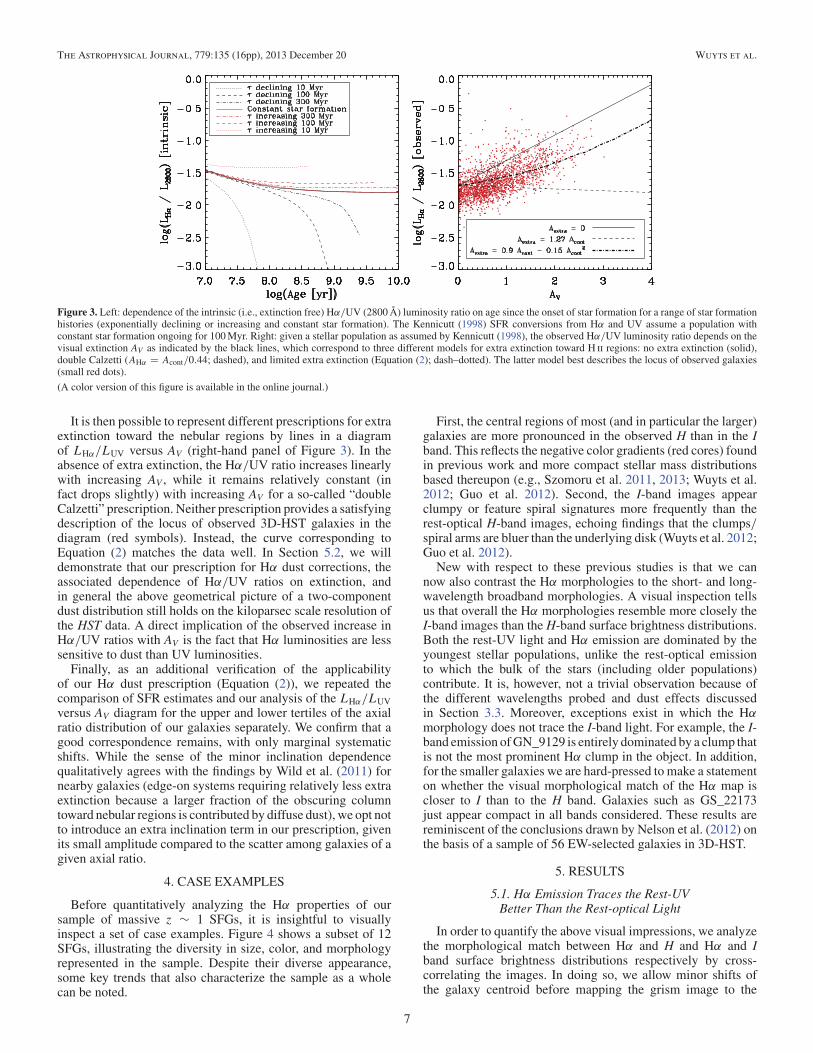
We now assess the validity of the calibration to correct Hαfor dust extinction (Equation (2)) by considering an independentdust-sensitive diagnostic, namely the Hα/UV luminosity ratio.Here, we define the UV luminosity as the rest-frame luminosityL2800 ≡ νLν(2800 Å), which we compute with EAZY. Inprinciple, the LHα/LUV ratio is not uniquely dependent ondust extinction, but may also vary among galaxies that differin their relative number of O and B stars due to differencesin the star formation history or initial stellar mass function(see, e.g., Meurer et al. 2009). The reason is that the Hαemission is powered by the ionizing radiation from O stars(with typical lifetimes of ∼7 Myr), while the rest-frame UVlight receives its major contributions from both O and B stars(i.e., stellar lifetimes up to ∼300 Myr). The left-hand panelof Figure 3 visualizes the evolution in LHα/LUV for a set ofBC03 stellar populations models with varying star formationhistories. Here, we calculated the intrinsic Hα luminosities fromthe rate of H ionizing photons in the BC03 models. Applying therecombination coefficients for case B from Hummer & Storey(1987) for an electron temperature of Te = 104 K and densityof ne = 104 cm−3, this gives
log(LHα[erg s−1]) = log(NLyc[s−1]) − 11.87 (3)
where NLyc is the production rate of Lyman continuum photonsfrom the stars. It is noticeable that, except for very young stellarpopulations or abruptly declining star formation histories, thebalance between the intrinsic (i.e., unattenuated) Hα and UVemission quickly converges to a value of around −1.7. We re-mind the reader that the frequently used Kennicutt (1998) SFRconversions, which assume a 100 Myr old constant star forma-tion population, correspond to the same ratio. In the following,we adopt log(LHα/LUV) = −1.7 as the expected intrinsic ra-tio in the absence of dust. We make the plausible assumptionthat any observed variation in LHα/LUV will be dominated byextinction effects, and that any (minor) contributions from IMFvariations or short-term fluctuations in the star formation historydo not depend systematically on AV .
6
The Astrophysical Journal, 779:135 (16pp), 2013 December 20 Wuyts et al.
Figure 3. Left: dependence of the intrinsic (i.e., extinction free) Hα/UV (2800 Å) luminosity ratio on age since the onset of star formation for a range of star formationhistories (exponentially declining or increasing and constant star formation). The Kennicutt (1998) SFR conversions from Hα and UV assume a population withconstant star formation ongoing for 100 Myr. Right: given a stellar population as assumed by Kennicutt (1998), the observed Hα/UV luminosity ratio depends on thevisual extinction AV as indicated by the black lines, which correspond to three different models for extra extinction toward H ii regions: no extra extinction (solid),double Calzetti (AHα = Acont/0.44; dashed), and limited extra extinction (Equation (2); dash–dotted). The latter model best describes the locus of observed galaxies(small red dots).
(A color version of this figure is available in the online journal.)
It is then possible to represent different prescriptions for extraextinction toward the nebular regions by lines in a diagramof LHα/LUV versus AV (right-hand panel of Figure 3). In theabsence of extra extinction, the Hα/UV ratio increases linearlywith increasing AV , while it remains relatively constant (infact drops slightly) with increasing AV for a so-called “doubleCalzetti” prescription. Neither prescription provides a satisfyingdescription of the locus of observed 3D-HST galaxies in thediagram (red symbols). Instead, the curve corresponding toEquation (2) matches the data well. In Section 5.2, we willdemonstrate that our prescription for Hα dust corrections, theassociated dependence of Hα/UV ratios on extinction, andin general the above geometrical picture of a two-componentdust distribution still holds on the kiloparsec scale resolution ofthe HST data. A direct implication of the observed increase inHα/UV ratios with AV is the fact that Hα luminosities are lesssensitive to dust than UV luminosities.
Finally, as an additional verification of the applicabilityof our Hα dust prescription (Equation (2)), we repeated thecomparison of SFR estimates and our analysis of the LHα/LUVversus AV diagram for the upper and lower tertiles of the axialratio distribution of our galaxies separately. We confirm that agood correspondence remains, with only marginal systematicshifts. While the sense of the minor inclination dependencequalitatively agrees with the findings by Wild et al. (2011) fornearby galaxies (edge-on systems requiring relatively less extraextinction because a larger fraction of the obscuring columntoward nebular regions is contributed by diffuse dust), we opt notto introduce an extra inclination term in our prescription, givenits small amplitude compared to the scatter among galaxies of agiven axial ratio.
4. CASE EXAMPLES
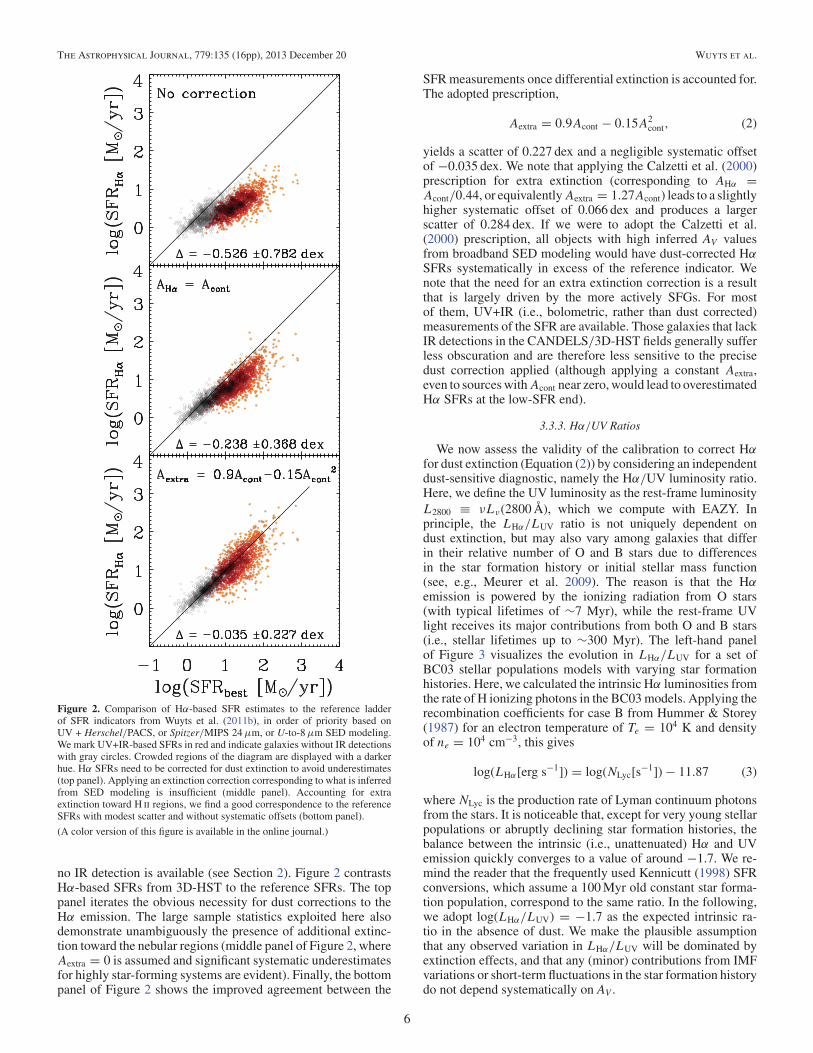
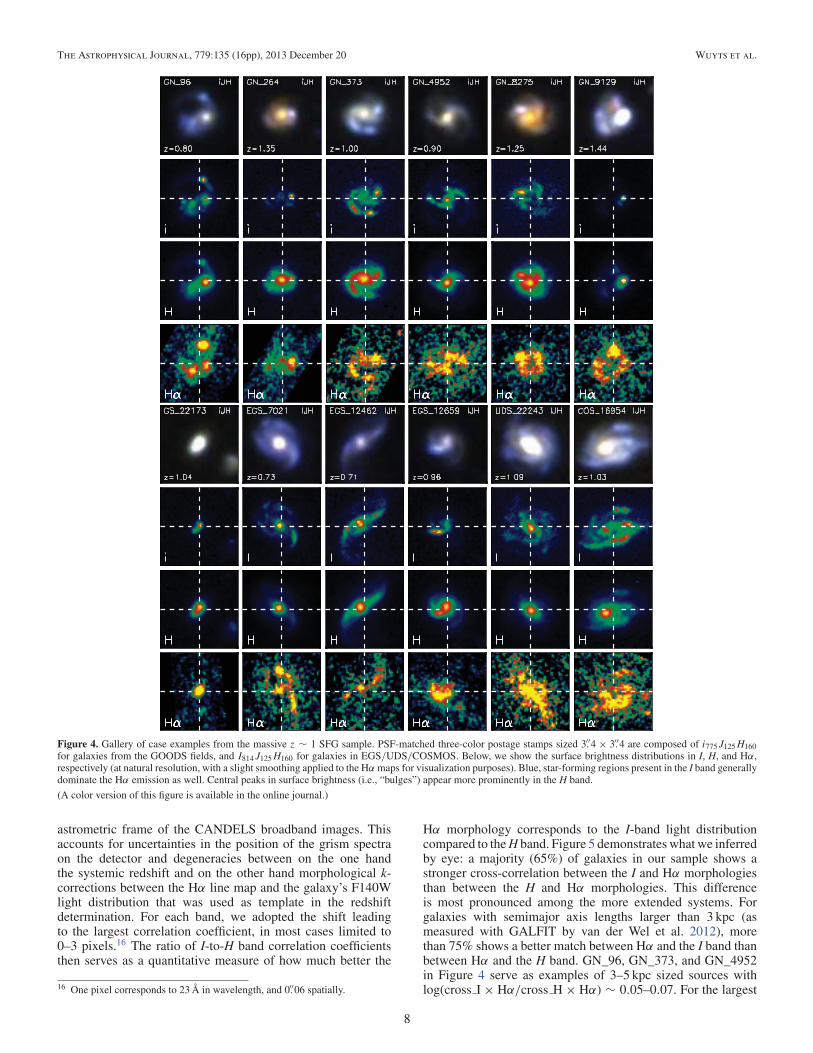
Before quantitatively analyzing the Hα properties of oursample of massive z ∼ 1 SFGs, it is insightful to visuallyinspect a set of case examples. Figure 4 shows a subset of 12SFGs, illustrating the diversity in size, color, and morphologyrepresented in the sample. Despite their diverse appearance,some key trends that also characterize the sample as a wholecan be noted.
First, the central regions of most (and in particular the larger)galaxies are more pronounced in the observed H than in the Iband. This reflects the negative color gradients (red cores) foundin previous work and more compact stellar mass distributionsbased thereupon (e.g., Szomoru et al. 2011, 2013; Wuyts et al.2012; Guo et al. 2012). Second, the I-band images appearclumpy or feature spiral signatures more frequently than therest-optical H-band images, echoing findings that the clumps/spiral arms are bluer than the underlying disk (Wuyts et al. 2012;Guo et al. 2012).
New with respect to these previous studies is that we cannow also contrast the Hα morphologies to the short- and long-wavelength broadband morphologies. A visual inspection tellsus that overall the Hα morphologies resemble more closely theI-band images than the H-band surface brightness distributions.Both the rest-UV light and Hα emission are dominated by theyoungest stellar populations, unlike the rest-optical emissionto which the bulk of the stars (including older populations)contribute. It is, however, not a trivial observation because ofthe different wavelengths probed and dust effects discussedin Section 3.3. Moreover, exceptions exist in which the Hαmorphology does not trace the I-band light. For example, the I-band emission of GN_9129 is entirely dominated by a clump thatis not the most prominent Hα clump in the object. In addition,for the smaller galaxies we are hard-pressed to make a statementon whether the visual morphological match of the Hα map iscloser to I than to the H band. Galaxies such as GS_22173just appear compact in all bands considered. These results arereminiscent of the conclusions drawn by Nelson et al. (2012) onthe basis of a sample of 56 EW-selected galaxies in 3D-HST.
5. RESULTS
5.1. Hα Emission Traces the Rest-UVBetter Than the Rest-optical Light
In order to quantify the above visual impressions, we analyzethe morphological match between Hα and H and Hα and Iband surface brightness distributions respectively by cross-correlating the images. In doing so, we allow minor shifts ofthe galaxy centroid before mapping the grism image to the
7
The Astrophysical Journal, 779:135 (16pp), 2013 December 20 Wuyts et al.
Figure 4. Gallery of case examples from the massive z ∼ 1 SFG sample. PSF-matched three-color postage stamps sized 3.′′4 × 3.′′4 are composed of i775J125H160for galaxies from the GOODS fields, and I814J125H160 for galaxies in EGS/UDS/COSMOS. Below, we show the surface brightness distributions in I, H, and Hα,respectively (at natural resolution, with a slight smoothing applied to the Hα maps for visualization purposes). Blue, star-forming regions present in the I band generallydominate the Hα emission as well. Central peaks in surface brightness (i.e., “bulges”) appear more prominently in the H band.
(A color version of this figure is available in the online journal.)
astrometric frame of the CANDELS broadband images. Thisaccounts for uncertainties in the position of the grism spectraon the detector and degeneracies between on the one handthe systemic redshift and on the other hand morphological k-corrections between the Hα line map and the galaxy’s F140Wlight distribution that was used as template in the redshiftdetermination. For each band, we adopted the shift leadingto the largest correlation coefficient, in most cases limited to0–3 pixels.16 The ratio of I-to-H band correlation coefficientsthen serves as a quantitative measure of how much better the
16 One pixel corresponds to 23 Å in wavelength, and 0.′′06 spatially.
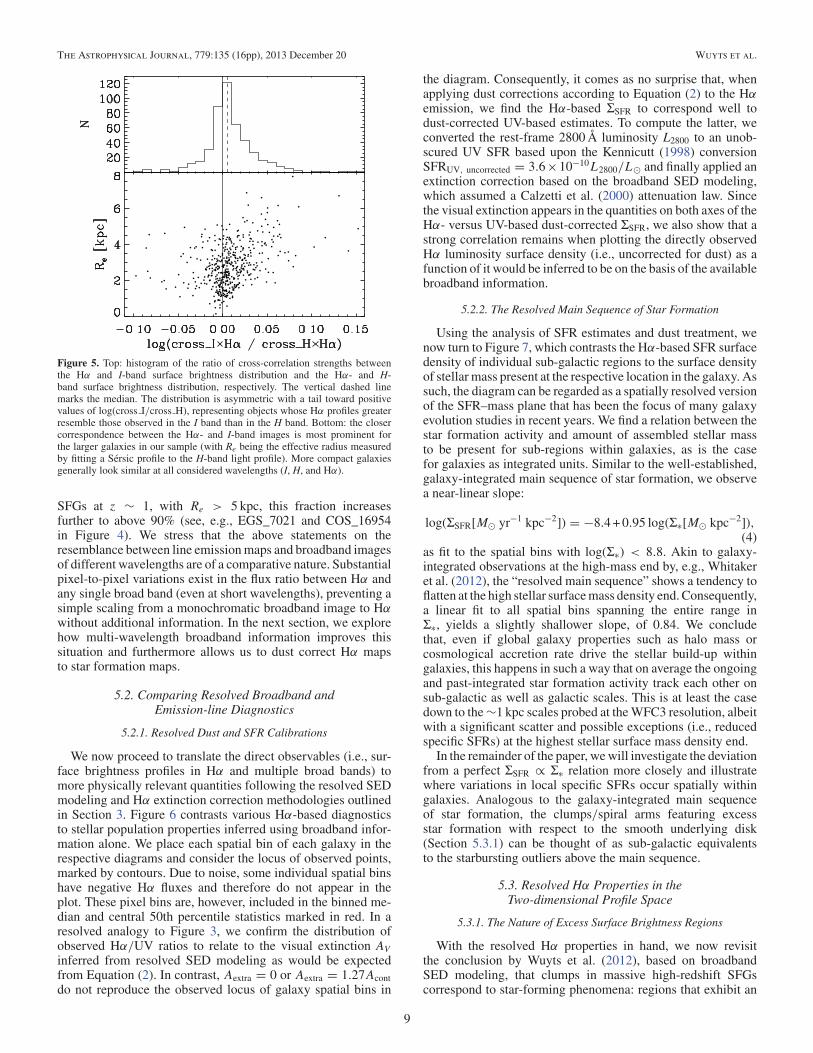
Hα morphology corresponds to the I-band light distributioncompared to the H band. Figure 5 demonstrates what we inferredby eye: a majority (65%) of galaxies in our sample shows astronger cross-correlation between the I and Hα morphologiesthan between the H and Hα morphologies. This differenceis most pronounced among the more extended systems. Forgalaxies with semimajor axis lengths larger than 3 kpc (asmeasured with GALFIT by van der Wel et al. 2012), morethan 75% shows a better match between Hα and the I band thanbetween Hα and the H band. GN_96, GN_373, and GN_4952in Figure 4 serve as examples of 3–5 kpc sized sources withlog(cross I × Hα/cross H × Hα) ∼ 0.05–0.07. For the largest
8
The Astrophysical Journal, 779:135 (16pp), 2013 December 20 Wuyts et al.
Figure 5. Top: histogram of the ratio of cross-correlation strengths betweenthe Hα and I-band surface brightness distribution and the Hα- and H-band surface brightness distribution, respectively. The vertical dashed linemarks the median. The distribution is asymmetric with a tail toward positivevalues of log(cross I/cross H), representing objects whose Hα profiles greaterresemble those observed in the I band than in the H band. Bottom: the closercorrespondence between the Hα- and I-band images is most prominent forthe larger galaxies in our sample (with Re being the effective radius measuredby fitting a Sersic profile to the H-band light profile). More compact galaxiesgenerally look similar at all considered wavelengths (I, H, and Hα).
SFGs at z ∼ 1, with Re > 5 kpc, this fraction increasesfurther to above 90% (see, e.g., EGS_7021 and COS_16954in Figure 4). We stress that the above statements on theresemblance between line emission maps and broadband imagesof different wavelengths are of a comparative nature. Substantialpixel-to-pixel variations exist in the flux ratio between Hα andany single broad band (even at short wavelengths), preventing asimple scaling from a monochromatic broadband image to Hαwithout additional information. In the next section, we explorehow multi-wavelength broadband information improves thissituation and furthermore allows us to dust correct Hα mapsto star formation maps.
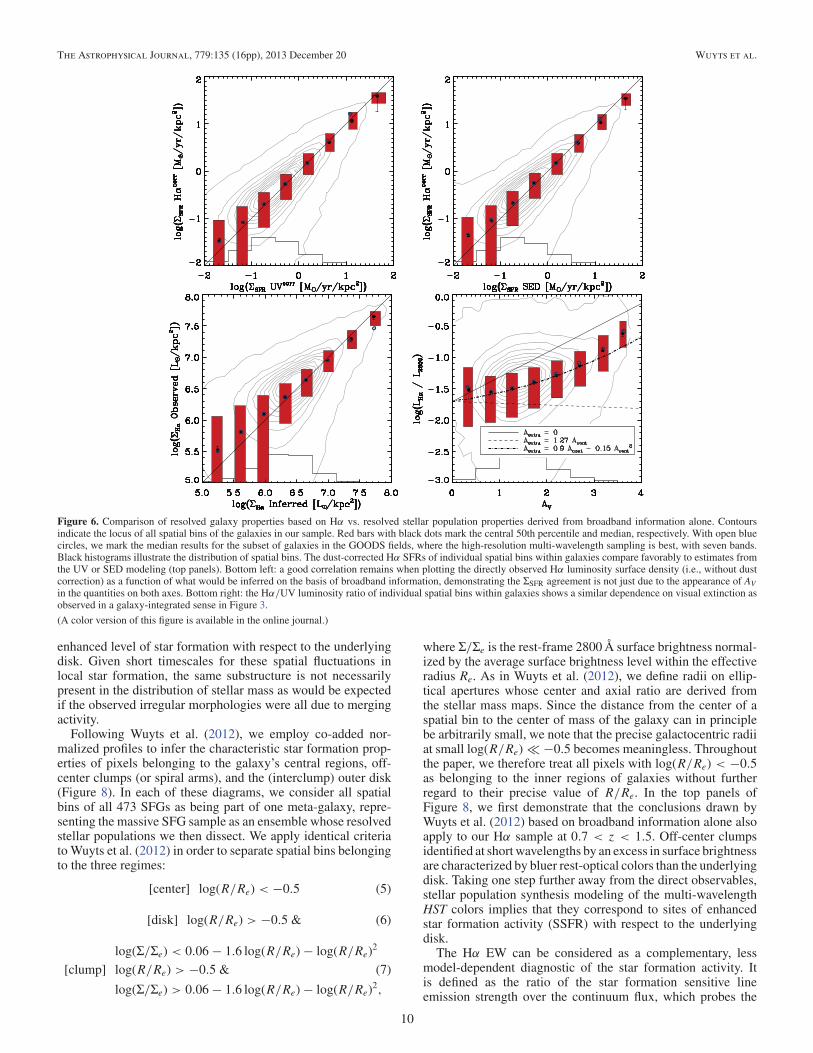
We now proceed to translate the direct observables (i.e., sur-face brightness profiles in Hα and multiple broad bands) tomore physically relevant quantities following the resolved SEDmodeling and Hα extinction correction methodologies outlinedin Section 3. Figure 6 contrasts various Hα-based diagnosticsto stellar population properties inferred using broadband infor-mation alone. We place each spatial bin of each galaxy in therespective diagrams and consider the locus of observed points,marked by contours. Due to noise, some individual spatial binshave negative Hα fluxes and therefore do not appear in theplot. These pixel bins are, however, included in the binned me-dian and central 50th percentile statistics marked in red. In aresolved analogy to Figure 3, we confirm the distribution ofobserved Hα/UV ratios to relate to the visual extinction AVinferred from resolved SED modeling as would be expectedfrom Equation (2). In contrast, Aextra = 0 or Aextra = 1.27Acontdo not reproduce the observed locus of galaxy spatial bins in
the diagram. Consequently, it comes as no surprise that, whenapplying dust corrections according to Equation (2) to the Hαemission, we find the Hα-based ΣSFR to correspond well todust-corrected UV-based estimates. To compute the latter, weconverted the rest-frame 2800 Å luminosity L2800 to an unob-scured UV SFR based upon the Kennicutt (1998) conversionSFRUV, uncorrected = 3.6×10⁻¹⁰L2800/L� and finally applied anextinction correction based on the broadband SED modeling,which assumed a Calzetti et al. (2000) attenuation law. Sincethe visual extinction appears in the quantities on both axes of theHα- versus UV-based dust-corrected ΣSFR, we also show that astrong correlation remains when plotting the directly observedHα luminosity surface density (i.e., uncorrected for dust) as afunction of it would be inferred to be on the basis of the availablebroadband information.
5.2.2. The Resolved Main Sequence of Star Formation
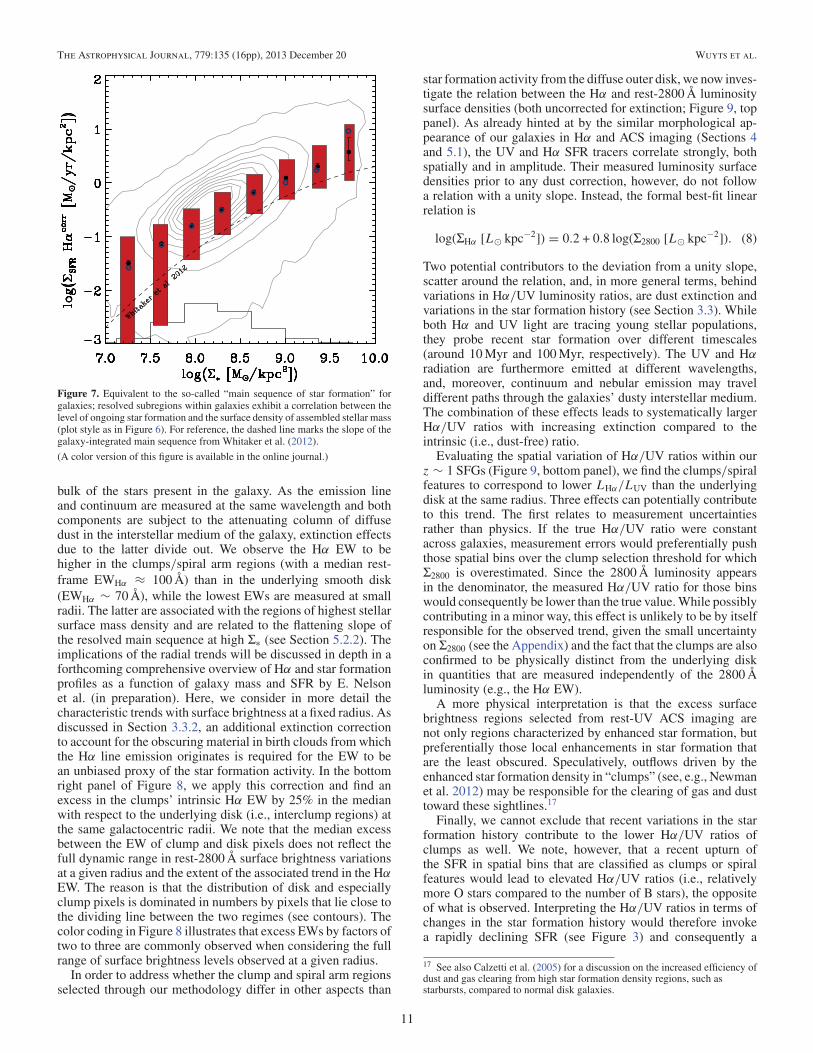
Using the analysis of SFR estimates and dust treatment, wenow turn to Figure 7, which contrasts the Hα-based SFR surfacedensity of individual sub-galactic regions to the surface densityof stellar mass present at the respective location in the galaxy. Assuch, the diagram can be regarded as a spatially resolved versionof the SFR–mass plane that has been the focus of many galaxyevolution studies in recent years. We find a relation between thestar formation activity and amount of assembled stellar massto be present for sub-regions within galaxies, as is the casefor galaxies as integrated units. Similar to the well-established,galaxy-integrated main sequence of star formation, we observea near-linear slope:
as fit to the spatial bins with log(Σ∗) < 8.8. Akin to galaxy-integrated observations at the high-mass end by, e.g., Whitakeret al. (2012), the “resolved main sequence” shows a tendency toflatten at the high stellar surface mass density end. Consequently,a linear fit to all spatial bins spanning the entire range inΣ∗, yields a slightly shallower slope, of 0.84. We concludethat, even if global galaxy properties such as halo mass orcosmological accretion rate drive the stellar build-up withingalaxies, this happens in such a way that on average the ongoingand past-integrated star formation activity track each other onsub-galactic as well as galactic scales. This is at least the casedown to the ∼1 kpc scales probed at the WFC3 resolution, albeitwith a significant scatter and possible exceptions (i.e., reducedspecific SFRs) at the highest stellar surface mass density end.
In the remainder of the paper, we will investigate the deviationfrom a perfect ΣSFR ∝ Σ∗ relation more closely and illustratewhere variations in local specific SFRs occur spatially withingalaxies. Analogous to the galaxy-integrated main sequenceof star formation, the clumps/spiral arms featuring excessstar formation with respect to the smooth underlying disk(Section 5.3.1) can be thought of as sub-galactic equivalentsto the starbursting outliers above the main sequence.
5.3. Resolved Hα Properties in theTwo-dimensional Profile Space
5.3.1. The Nature of Excess Surface Brightness Regions
With the resolved Hα properties in hand, we now revisitthe conclusion by Wuyts et al. (2012), based on broadbandSED modeling, that clumps in massive high-redshift SFGscorrespond to star-forming phenomena: regions that exhibit an
9
The Astrophysical Journal, 779:135 (16pp), 2013 December 20 Wuyts et al.
Figure 6. Comparison of resolved galaxy properties based on Hα vs. resolved stellar population properties derived from broadband information alone. Contoursindicate the locus of all spatial bins of the galaxies in our sample. Red bars with black dots mark the central 50th percentile and median, respectively. With open bluecircles, we mark the median results for the subset of galaxies in the GOODS fields, where the high-resolution multi-wavelength sampling is best, with seven bands.Black histograms illustrate the distribution of spatial bins. The dust-corrected Hα SFRs of individual spatial bins within galaxies compare favorably to estimates fromthe UV or SED modeling (top panels). Bottom left: a good correlation remains when plotting the directly observed Hα luminosity surface density (i.e., without dustcorrection) as a function of what would be inferred on the basis of broadband information, demonstrating the ΣSFR agreement is not just due to the appearance of AVin the quantities on both axes. Bottom right: the Hα/UV luminosity ratio of individual spatial bins within galaxies shows a similar dependence on visual extinction asobserved in a galaxy-integrated sense in Figure 3.
(A color version of this figure is available in the online journal.)
enhanced level of star formation with respect to the underlyingdisk. Given short timescales for these spatial fluctuations inlocal star formation, the same substructure is not necessarilypresent in the distribution of stellar mass as would be expectedif the observed irregular morphologies were all due to mergingactivity.
Following Wuyts et al. (2012), we employ co-added nor-malized profiles to infer the characteristic star formation prop-erties of pixels belonging to the galaxy’s central regions, off-center clumps (or spiral arms), and the (interclump) outer disk(Figure 8). In each of these diagrams, we consider all spatialbins of all 473 SFGs as being part of one meta-galaxy, repre-senting the massive SFG sample as an ensemble whose resolvedstellar populations we then dissect. We apply identical criteriato Wuyts et al. (2012) in order to separate spatial bins belongingto the three regimes:
[center] log(R/Re) < −0.5 (5)
[disk] log(R/Re) > −0.5 & (6)
log(Σ/Σe) < 0.06 − 1.6 log(R/Re) − log(R/Re)2
[clump] log(R/Re) > −0.5 & (7)
log(Σ/Σe) > 0.06 − 1.6 log(R/Re) − log(R/Re)2,
where Σ/Σe is the rest-frame 2800 Å surface brightness normal-ized by the average surface brightness level within the effectiveradius Re. As in Wuyts et al. (2012), we define radii on ellip-tical apertures whose center and axial ratio are derived fromthe stellar mass maps. Since the distance from the center of aspatial bin to the center of mass of the galaxy can in principlebe arbitrarily small, we note that the precise galactocentric radiiat small log(R/Re) � −0.5 becomes meaningless. Throughoutthe paper, we therefore treat all pixels with log(R/Re) < −0.5as belonging to the inner regions of galaxies without furtherregard to their precise value of R/Re. In the top panels ofFigure 8, we first demonstrate that the conclusions drawn byWuyts et al. (2012) based on broadband information alone alsoapply to our Hα sample at 0.7 < z < 1.5. Off-center clumpsidentified at short wavelengths by an excess in surface brightnessare characterized by bluer rest-optical colors than the underlyingdisk. Taking one step further away from the direct observables,stellar population synthesis modeling of the multi-wavelengthHST colors implies that they correspond to sites of enhancedstar formation activity (SSFR) with respect to the underlyingdisk.
The Hα EW can be considered as a complementary, lessmodel-dependent diagnostic of the star formation activity. Itis defined as the ratio of the star formation sensitive lineemission strength over the continuum flux, which probes the
10
The Astrophysical Journal, 779:135 (16pp), 2013 December 20 Wuyts et al.
Figure 7. Equivalent to the so-called “main sequence of star formation” forgalaxies; resolved subregions within galaxies exhibit a correlation between thelevel of ongoing star formation and the surface density of assembled stellar mass(plot style as in Figure 6). For reference, the dashed line marks the slope of thegalaxy-integrated main sequence from Whitaker et al. (2012).
(A color version of this figure is available in the online journal.)
bulk of the stars present in the galaxy. As the emission lineand continuum are measured at the same wavelength and bothcomponents are subject to the attenuating column of diffusedust in the interstellar medium of the galaxy, extinction effectsdue to the latter divide out. We observe the Hα EW to behigher in the clumps/spiral arm regions (with a median rest-frame EWHα ≈ 100 Å) than in the underlying smooth disk(EWHα ∼ 70 Å), while the lowest EWs are measured at smallradii. The latter are associated with the regions of highest stellarsurface mass density and are related to the flattening slope ofthe resolved main sequence at high Σ∗ (see Section 5.2.2). Theimplications of the radial trends will be discussed in depth in aforthcoming comprehensive overview of Hα and star formationprofiles as a function of galaxy mass and SFR by E. Nelsonet al. (in preparation). Here, we consider in more detail thecharacteristic trends with surface brightness at a fixed radius. Asdiscussed in Section 3.3.2, an additional extinction correctionto account for the obscuring material in birth clouds from whichthe Hα line emission originates is required for the EW to bean unbiased proxy of the star formation activity. In the bottomright panel of Figure 8, we apply this correction and find anexcess in the clumps’ intrinsic Hα EW by 25% in the medianwith respect to the underlying disk (i.e., interclump regions) atthe same galactocentric radii. We note that the median excessbetween the EW of clump and disk pixels does not reflect thefull dynamic range in rest-2800 Å surface brightness variationsat a given radius and the extent of the associated trend in the HαEW. The reason is that the distribution of disk and especiallyclump pixels is dominated in numbers by pixels that lie close tothe dividing line between the two regimes (see contours). Thecolor coding in Figure 8 illustrates that excess EWs by factors oftwo to three are commonly observed when considering the fullrange of surface brightness levels observed at a given radius.
In order to address whether the clump and spiral arm regionsselected through our methodology differ in other aspects than
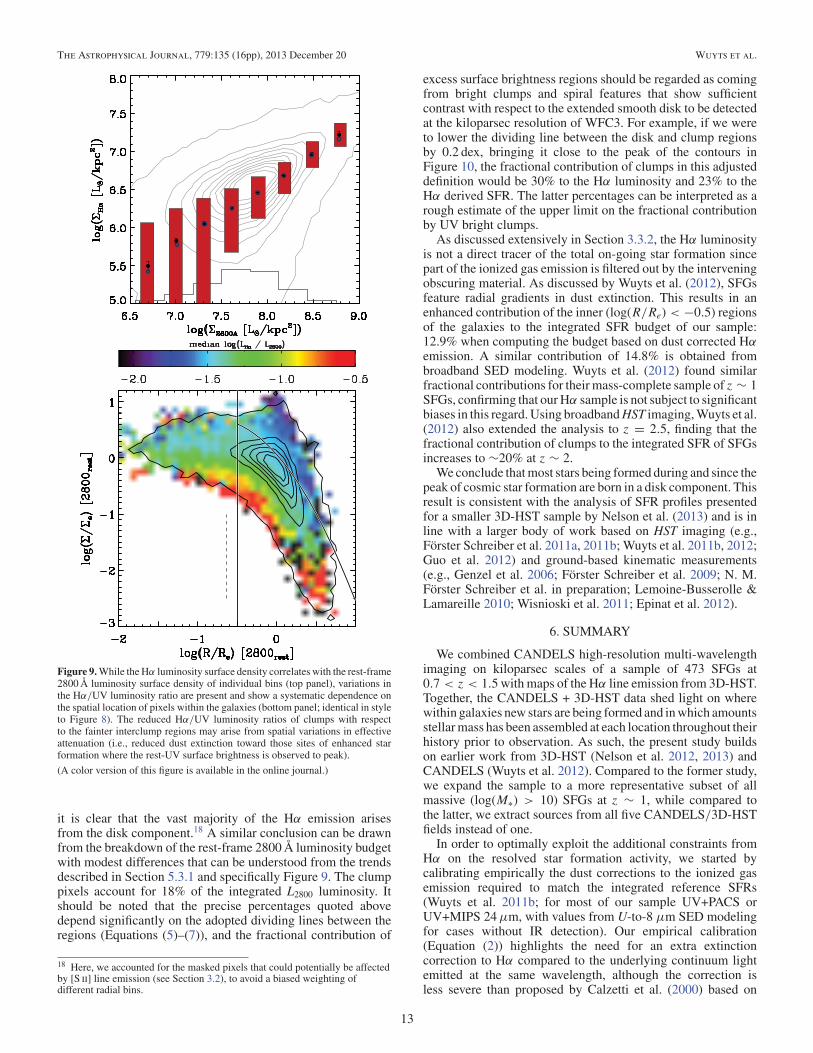
star formation activity from the diffuse outer disk, we now inves-tigate the relation between the Hα and rest-2800 Å luminositysurface densities (both uncorrected for extinction; Figure 9, toppanel). As already hinted at by the similar morphological ap-pearance of our galaxies in Hα and ACS imaging (Sections 4and 5.1), the UV and Hα SFR tracers correlate strongly, bothspatially and in amplitude. Their measured luminosity surfacedensities prior to any dust correction, however, do not followa relation with a unity slope. Instead, the formal best-fit linearrelation is
Two potential contributors to the deviation from a unity slope,scatter around the relation, and, in more general terms, behindvariations in Hα/UV luminosity ratios, are dust extinction andvariations in the star formation history (see Section 3.3). Whileboth Hα and UV light are tracing young stellar populations,they probe recent star formation over different timescales(around 10 Myr and 100 Myr, respectively). The UV and Hαradiation are furthermore emitted at different wavelengths,and, moreover, continuum and nebular emission may traveldifferent paths through the galaxies’ dusty interstellar medium.The combination of these effects leads to systematically largerHα/UV ratios with increasing extinction compared to theintrinsic (i.e., dust-free) ratio.
Evaluating the spatial variation of Hα/UV ratios within ourz ∼ 1 SFGs (Figure 9, bottom panel), we find the clumps/spiralfeatures to correspond to lower LHα/LUV than the underlyingdisk at the same radius. Three effects can potentially contributeto this trend. The first relates to measurement uncertaintiesrather than physics. If the true Hα/UV ratio were constantacross galaxies, measurement errors would preferentially pushthose spatial bins over the clump selection threshold for whichΣ2800 is overestimated. Since the 2800 Å luminosity appearsin the denominator, the measured Hα/UV ratio for those binswould consequently be lower than the true value. While possiblycontributing in a minor way, this effect is unlikely to be by itselfresponsible for the observed trend, given the small uncertaintyon Σ2800 (see the Appendix) and the fact that the clumps are alsoconfirmed to be physically distinct from the underlying diskin quantities that are measured independently of the 2800 Åluminosity (e.g., the Hα EW).
A more physical interpretation is that the excess surfacebrightness regions selected from rest-UV ACS imaging arenot only regions characterized by enhanced star formation, butpreferentially those local enhancements in star formation thatare the least obscured. Speculatively, outflows driven by theenhanced star formation density in “clumps” (see, e.g., Newmanet al. 2012) may be responsible for the clearing of gas and dusttoward these sightlines.17
Finally, we cannot exclude that recent variations in the starformation history contribute to the lower Hα/UV ratios ofclumps as well. We note, however, that a recent upturn ofthe SFR in spatial bins that are classified as clumps or spiralfeatures would lead to elevated Hα/UV ratios (i.e., relativelymore O stars compared to the number of B stars), the oppositeof what is observed. Interpreting the Hα/UV ratios in terms ofchanges in the star formation history would therefore invokea rapidly declining SFR (see Figure 3) and consequently a
17 See also Calzetti et al. (2005) for a discussion on the increased efficiency ofdust and gas clearing from high star formation density regions, such asstarbursts, compared to normal disk galaxies.
11
The Astrophysical Journal, 779:135 (16pp), 2013 December 20 Wuyts et al.
Figure 8. Co-added normalized rest-UV surface brightness profile of the SFGs in our sample. The vertical dashed line indicates the typical resolution. Contoursdenote the density of spatial bins. The top panels are color-coded by purely broadband-based quantities, namely the rest-frame optical color (U − V )rest (top left)and the specific SFR inferred from resolved stellar population modeling (top right). The color-coding in the bottom panels marks the Hα rest-frame equivalent widthas observed directly (bottom left) and after correction for extra extinction toward the nebular regions (bottom right). Solid lines separate the central, outer disk, andclump/spiral arm regimes. Spatial bins in the clump/spiral arm regime are characterized by bluer broadband colors and higher Hα EWs, consistent with the elevatedSSFR with respect to the underlying disk inferred from the resolved SED modeling.
(A color version of this figure is available in the online journal.)
prior (possibly very short-lived) phase of even more intensestar formation. The latter phase necessarily would have to beembedded, since otherwise it would itself be picked up bythe UV clump selection. As such, both physical explanationscould go hand in hand, in a scenario where outflows quicklyclear the gas and dust from clumps, simultaneously reducingtheir star formation activity and obscuration, and consequentlylowering the observed Hα/UV ratio. If true, this would implythat resolved observations at longer wavelengths with ALMAor Plateau de Bure Interferometer (PdBI)/NOEMA may revealnew/different clumps that correspond to an earlier, embeddedevolutionary stage of star-forming regions.
5.3.2. Where Do the Stars Form in z ∼ 1 SFGs?
While the analysis in Section 5.3.1 sheds light on how starformation activity (SSFR or EW) varies depending on thelocation within galaxies, it does not reveal how much of the SFRintegrated over all galaxies is contributed by the center, clump,and disk regimes, respectively. Figure 10 serves to address thisquestion. We first consider the integrated Hα luminosity of allgalaxies in the sample, irrespective of whether they have spatialbins in the clump regime or not. With 8.3%/79.1%/12.6% ofthe integrated Hα luminosity budget being contributed by thecentral/disk/clump regions (as defined by Equations (5)–(7)),
12
The Astrophysical Journal, 779:135 (16pp), 2013 December 20 Wuyts et al.
Figure 9. While the Hα luminosity surface density correlates with the rest-frame2800 Å luminosity surface density of individual bins (top panel), variations inthe Hα/UV luminosity ratio are present and show a systematic dependence onthe spatial location of pixels within the galaxies (bottom panel; identical in styleto Figure 8). The reduced Hα/UV luminosity ratios of clumps with respectto the fainter interclump regions may arise from spatial variations in effectiveattenuation (i.e., reduced dust extinction toward those sites of enhanced starformation where the rest-UV surface brightness is observed to peak).
(A color version of this figure is available in the online journal.)
it is clear that the vast majority of the Hα emission arisesfrom the disk component.18 A similar conclusion can be drawnfrom the breakdown of the rest-frame 2800 Å luminosity budgetwith modest differences that can be understood from the trendsdescribed in Section 5.3.1 and specifically Figure 9. The clumppixels account for 18% of the integrated L2800 luminosity. Itshould be noted that the precise percentages quoted abovedepend significantly on the adopted dividing lines between theregions (Equations (5)–(7)), and the fractional contribution of
18 Here, we accounted for the masked pixels that could potentially be affectedby [S ii] line emission (see Section 3.2), to avoid a biased weighting ofdifferent radial bins.
excess surface brightness regions should be regarded as comingfrom bright clumps and spiral features that show sufficientcontrast with respect to the extended smooth disk to be detectedat the kiloparsec resolution of WFC3. For example, if we wereto lower the dividing line between the disk and clump regionsby 0.2 dex, bringing it close to the peak of the contours inFigure 10, the fractional contribution of clumps in this adjusteddefinition would be 30% to the Hα luminosity and 23% to theHα derived SFR. The latter percentages can be interpreted as arough estimate of the upper limit on the fractional contributionby UV bright clumps.
As discussed extensively in Section 3.3.2, the Hα luminosityis not a direct tracer of the total on-going star formation sincepart of the ionized gas emission is filtered out by the interveningobscuring material. As discussed by Wuyts et al. (2012), SFGsfeature radial gradients in dust extinction. This results in anenhanced contribution of the inner (log(R/Re) < −0.5) regionsof the galaxies to the integrated SFR budget of our sample:12.9% when computing the budget based on dust corrected Hαemission. A similar contribution of 14.8% is obtained frombroadband SED modeling. Wuyts et al. (2012) found similarfractional contributions for their mass-complete sample of z ∼ 1SFGs, confirming that our Hα sample is not subject to significantbiases in this regard. Using broadband HST imaging, Wuyts et al.(2012) also extended the analysis to z = 2.5, finding that thefractional contribution of clumps to the integrated SFR of SFGsincreases to ∼20% at z ∼ 2.
We conclude that most stars being formed during and since thepeak of cosmic star formation are born in a disk component. Thisresult is consistent with the analysis of SFR profiles presentedfor a smaller 3D-HST sample by Nelson et al. (2013) and is inline with a larger body of work based on HST imaging (e.g.,Forster Schreiber et al. 2011a, 2011b; Wuyts et al. 2011b, 2012;Guo et al. 2012) and ground-based kinematic measurements(e.g., Genzel et al. 2006; Forster Schreiber et al. 2009; N. M.Forster Schreiber et al. in preparation; Lemoine-Busserolle &Lamareille 2010; Wisnioski et al. 2011; Epinat et al. 2012).
6. SUMMARY
We combined CANDELS high-resolution multi-wavelengthimaging on kiloparsec scales of a sample of 473 SFGs at0.7 < z < 1.5 with maps of the Hα line emission from 3D-HST.Together, the CANDELS + 3D-HST data shed light on wherewithin galaxies new stars are being formed and in which amountsstellar mass has been assembled at each location throughout theirhistory prior to observation. As such, the present study buildson earlier work from 3D-HST (Nelson et al. 2012, 2013) andCANDELS (Wuyts et al. 2012). Compared to the former study,we expand the sample to a more representative subset of allmassive (log(M∗) > 10) SFGs at z ∼ 1, while compared tothe latter, we extract sources from all five CANDELS/3D-HSTfields instead of one.
In order to optimally exploit the additional constraints fromHα on the resolved star formation activity, we started bycalibrating empirically the dust corrections to the ionized gasemission required to match the integrated reference SFRs(Wuyts et al. 2011b; for most of our sample UV+PACS orUV+MIPS 24 μm, with values from U-to-8 μm SED modelingfor cases without IR detection). Our empirical calibration(Equation (2)) highlights the need for an extra extinctioncorrection to Hα compared to the underlying continuum lightemitted at the same wavelength, although the correction isless severe than proposed by Calzetti et al. (2000) based on
13
The Astrophysical Journal, 779:135 (16pp), 2013 December 20 Wuyts et al.
Figure 10. Co-added normalized rest-UV surface brightness profile of the SFGs in our sample (identical in style to Figure 8). The color-coding of each bin in thediagram indicates the percentage of the total integrated Hα luminosity (left panel) or dust-corrected SFR based thereupon (right panel) summed up from all massiveSFGs in our sample, originating from the respective region in 2D profile space (i.e., galactocentric radius and rest-2800 Å surface brightness level). Differencesbetween the fractional contribution to the cosmically integrated Hα luminosity and SFR arise from inhomogeneous dust distributions within galaxies: thicker dustcolumns toward the center and slightly reduced obscuration of the rest-UV-selected clumps. The vast majority of newborn stars in z ∼ 1 galaxies are being formed inthe disk.
(A color version of this figure is available in the online journal.)
nearby starburst galaxies. Our findings fit in the context of atwo-component geometrical dust model in which the ionized gasemission surrounding young star-forming regions is obscuredby dust from the birth cloud itself in addition to the column ofdiffuse material spread throughout the galaxy that also affectsthe bulk of galaxy light emitted by older stars (see also Charlot& Fall 2000; Wild et al. 2011; Pacifici et al. 2012; Chevallardet al. 2013). As an independent test, we confirmed that thisprescription for extra extinction toward H ii regions reproducesthe relation between the observed Hα/UV luminosity ratio andthe effective visual extinction inferred from broadband SEDmodeling. The fact that the observed Hα/UV luminosity ratiorises with increasing visual extinction directly implies that Hαis a less dust-sensitive SFR tracer than UV emission.
From our resolved stellar population analysis, we draw thefollowing conclusions.
1. The Hα morphologies of z ∼ 1 SFGs resemble moreclosely the ACS I-band morphologies than those observedin the WFC3 H band, particularly in the case of largegalaxies.
2. The Hα and rest-frame 2800 Å luminosities correlate on apixel-by-pixel basis, and after proper dust corrections areapplied, the SFR estimates based thereupon are internallyconsistent. The Hα/UV luminosity ratios of individualspatial bins also relate to the visual extinction inferred frommulti-band HST photometry in a manner that is consistentwith the applied correction for extra extinction toward theH ii regions.
3. We find evidence for the existence of a resolved main se-quence of star formation: the rate of ongoing star formationper unit area tracks the amount of stellar mass assembledover the same area. Its near-linear slope is consistent withthe one measured for the galaxy-integrated main sequence,including an apparent flattening at the high-mass densityend, associated with the low-EW inner regions of the mostmassive galaxies.
4. Off-center clumps (or spiral features that show up similarlyas regions with excess surface brightness) are character-ized by enhanced Hα EWs, bluer broadband colors, andcorrespondingly higher SSFRs than the underlying disk,implying that they are a star formation phenomenon. Phys-ically, they may correspond to regions with elevated gasfractions and/or star formation efficiencies (Tacconi et al.2013), where part of the global gas disk collapsed throughgravitational instabilities (see, e.g., Bournaud et al. 2008;Genzel et al. 2008; Dekel et al. 2009), although at z ∼ 1 sec-ular processes on longer timescales, such as spiral densitywaves, are also likely to contribute. In an integrated sense,however, the contribution of excess surface brightness re-gions to the total amount of star formation taking placewithin z ∼ 1 SFGs is limited to 10%–15%, depending onthe tracer. Most stars being formed between z = 1.5 andz = 0.7 are formed in the disk component (see also ForsterSchreiber et al. 2009; N. M. Forster Schreiber et al. in prepa-ration; Nelson et al. 2013). Wuyts et al. (2012) demonstratedthat this conclusion holds out to z ∼ 2, where the fractionof total star formation in off-center clumps increases, butdoes not exceed ∼20%.
5. Aside from spatial fluctuations in the star formation activity,an inhomogeneous dust distribution can lead to spatialmass-to-light ratio variations, and consequently a range insurface brightness levels at a given radius, even for smoothstellar mass distributions. The visual extinction gradientinferred from broadband SED modeling is to first orderradial. We furthermore find clumps/spiral features selectedfrom ACS imaging to exhibit lower Hα/UV luminosityratios than the underlying disk. Interpreting the Hα/UVratio as a tracer of extinction, this implies that the clumps/spiral features selected in our study are not just regions ofincreased star formation activity, but preferentially thoseobserved through a smaller column of obscuring material.
In the past decade, deep HST imaging has transformed ourview of high-redshift galaxies from a zoo of faint blobs of light
14
The Astrophysical Journal, 779:135 (16pp), 2013 December 20 Wuyts et al.
into resolved species whose structure and stellar populationcontent exhibit strong correlations throughout cosmic time(e.g., Franx et al. 2008; Williams et al. 2009; Wuyts et al.2011b). More recently, multi-band HST imaging has enabledus to translate the distribution of light within galaxies to morephysically relevant distributions of, e.g., stellar mass or starformation (e.g., Wuyts et al. 2012; Guo et al. 2012; Szomoruet al. 2013). In this paper, we demonstrated that a more completecensus of the distribution of baryons within distant galaxies,including the ionized gas as traced by Hα (see also Nelsonet al. 2012, 2013), helps to constrain spatial variations in starformation activity and dust extinction. Despite the significantstrides forward, especially through the synergy between theCANDELS and 3D-HST legacy programs, a significant fractionof the total baryonic mass budget remains missing from theseresolved studies.
In a galaxy-integrated sense, the PHIBSS survey carried outwith the PdBI revealed that cold molecular gas traced by COaccounts for a third of the baryonic mass within z ∼ 1.2 SFGs,with molecular gas mass fractions increasing further out tohigher redshifts (Tacconi et al. 2010, 2013; see also Daddiet al. 2010). Knowing how the molecular gas is distributedwithin galaxies is crucial to interpret the continuing growthof structure: by quantifying the star formation efficiency in thecentral, outer disk, and clump/spiral arm regimes separately,identifying the regions with enhanced columns of obscuringmaterial, and finally contrasting the total (gas + stellar) baryonicmass profiles to the available constraints on enclosed mass fromkinematics.
Exploiting the first resolved data set of a distant galaxyconsisting of three-dimensional (3D) CO and Hα data cubesas well as multi-band HST imaging, Genzel et al. (2013)demonstrates the power of such a synergy. These authorsfind a correlation between the column of CO line emissionand the visual extinction inferred from the HST colors, anear-linear resolved Kennicutt–Schmidt relation, and consistentkinematics of the ionized and molecular gas components.The superior sensitivity provided by ALMA and the NOEMAextension to PdBI promises to advance this field even furtherthrough systematically mapping the spatial variations in COline emission as well as the dust-sensitive mm continuum forgalaxies spanning a wide dynamic range along and across themain sequence of star formation.
S.W. acknowledges helpful interactions with Eric F. Bell,Mauro Giavalisco, and Benjamin J. Weiner. We also thank theanonymous referee for his/her constructive comments. Supportfor Program number HST-GO-12060 and HST-GO-12177 wasprovided by NASA through a grant from the Space TelescopeScience Institute, which is operated by the Association ofUniversities for Research in Astronomy, Incorporated, underNASA contract NAS5-26555.
APPENDIX A
ROBUSTNESS OF THE RESOLVED SED MODELING
As described in Section 2.1, the available high-resolution HSTimagery in the CANDELS/3D-HST fields varies from seven-band BVizYJH photometry in the GOODS fields, contributing46% of our sample, to a more modest sampling of the SED, inVIJH, for EGS, UDS, and COSMOS (objects with less coveragewere excluded from the sample). Our choice to also include thelatter three fields in the analysis is therefore necessarily a trade-
off between having the richest possible set of information perobject, and maximizing the sample statistics.
We verify the validity of our approach in two ways. First,we repeat our entire analysis five times, each time using thedata set of an individual field separately. We revisit the relationbetween Hα and broadband derived properties (Section 5.2), thevariation of stellar population properties across the co-addedrest-UV surface brightness profiles (Section 5.3.1), as well asthe fractional contributions to the Hα luminosity and integratedSFR by the central/disk/clump regions (Section 5.3.2). Doingso, we confirm that the same generic behavior is seen in each ofthe fields separately, albeit naturally based on smaller numberstatistics. This test boosts our confidence that the conclusionsdrawn in this paper are not driven by just a limited subset of theobjects entering our analysis. For example, the relative fractionalcontributions of galaxy centers, disks, and clumps or spiral arms,vary by at most a few percent between fields.
Second, we tested the impact of having four rather than sevenflux points per spatial bin, by repeating the analysis for theGOODS-South field using only the ViJH resolved photometry.We found that the best convergence between solutions of four-and seven-band fitting is obtained when assigning a weightwi = e−χ2
i /2 to each grid cell and marginalizing over the multi-dimensional parameter space explored in the fitting process (seeSalim et al. 2007 for an extensive discussion). We thereforechose to follow this approach throughout the paper, but note thatconsistent conclusions are reached when using the minimum χ2
value. Comparing the four- to seven-band fitting, we reproducethe overall lessons learned on resolved star formation patterns atz ∼ 1 presented in this paper: the existence of a resolved mainsequence of star formation with similar slope as the galaxy-integrated version, and excursions from this relation in the formof off-center regions with excess star formation, or low EWregions in galaxy centers. Quantitatively, the stellar surfacemass density, rest-frame 2800 Å surface brightness, and rest-frame (U − V )rest color are least affected by the transitionfrom seven to four bands, inducing less than 0.07 dex scatterand no systematic offsets. The absence of systematics is mostcrucial, as throughout the paper we never treat individual spatialbins separately, but instead always consider statistics averagedover large numbers of spatial bins taken from all objects in thesample.
Unsurprisingly, the inferred age, SFR, and visual extinctionare less well constrained by 4-band SEDs, with scatter in thefour- to seven-band comparison of 0.18 dex, 0.20 dex, and 0.32mag, respectively, and strong (anti-)correlations between theoffsets. However, also for these parameters we measure onlyminor systematic offsets with amplitudes that are a factor sixsmaller than the observed scatter. This propagates to variationsin the co-added surface brightness profiles and resolved mainsequence of comparable or even smaller amplitude than thevariations seen from field to field.
We conclude that, to the level of detail presented in this paper,the above tests support the robustness of our results. However,in order to push the study of resolved stellar populations at highredshift further, toward extensive analyses on a per object basis,additional means to better disentangle age and dust effects wouldbe desirable. Two possible avenues are the inclusion of WFC3UVIS data (Teplitz et al. 2013), providing access to resolvedmaps of the UV slope β, and the upcoming James Webb SpaceTelescope/NIRCam mission, which will enable the applicationof the UVJ diagnostic technique (Wuyts et al. 2007) on sub-galactic scales.
15
The Astrophysical Journal, 779:135 (16pp), 2013 December 20 Wuyts et al.
REFERENCES
Abraham, R. G., Ellis, R. S., Fabian, A. C., Tanvir, N., & Glazebrook, K.1999, MNRAS, 303, 641
Barro, G., Faber, S. M., Perez-Gonzalez, P. G., et al. 2013, ApJ, 765, 104Bell, E. F., & de Jong, R. S. 2001, ApJ, 550, 212Bell, E. F., van der Wel, A., Papovich, C., et al. 2012, ApJ, 753, 167Bournaud, F., Daddi, E., Elmegreen, B. G., et al. 2008, A&A, 486, 741Bournaud, F., Dekel, A., Teyssier, R., et al. 2011, ApJ, 741, 33Bournaud, F., Elmegreen, B. G., & Elmegreen, D. M. 2007, ApJ, 670, 237Brammer, G. B., van Dokkum, P. G., & Coppi, P. 2008, ApJ, 686, 1503Brammer, G. B., van Dokkum, P. G., Franx, M., et al. 2012, ApJS, 200, 13Bruce, V. A., Dunlop, J. S., Cirasuolo, M., et al. 2012, MNRAS, 427, 1666Bruzual, G., & Charlot, S. 2003, MNRAS, 344, 1000Cacciato, M., Dekel, A., & Genel, S. 2012, MNRAS, 421, 818Calzetti, D., Armus, L., Bohlin, R. C., et al. 2000, ApJ, 533, 682Calzetti, D., Kenicutt, R. C., Bianchi, L., et al. 2005, ApJ, 633, 871Calzetti, D., Kinney, A. L., & Storchi-Bergmann, T. 1994, ApJ, 429, 582Cappellari, M., & Copin, Y. 2003, MNRAS, 342, 345Chabrier, G. 2003, PASP, 115, 763Charlot, S., & Fall, S. M. 2000, ApJ, 539, 718Chevallard, J., Charlot, S., Wandelt, B., & Wild, V. 2013, MNRAS, 432, 2061Daddi, E., Bournaud, F., Walter, F., et al. 2010, ApJ, 713, 686Daddi, E., Cimatti, A., Renzini, A., et al. 2004, ApJ, 617, 746Daddi, E., Dickinson, M., Morrison, G., et al. 2007, ApJ, 670, 156Davis, M., Guhathakurta, P., Konidaris, N. P., et al. 2007, ApJ, 660, 1Dekel, A., Sari, R., & Ceverino, D. 2009, ApJ, 703, 785Dickinson, M., Hanley, C., Elston, R., et al. 2000, ApJ, 531, 624Elbaz, D., Daddi, E., Le Borgne, D., et al. 2007, A&A, 468, 33Elbaz, D., Dickinson, M., Hwang, H. S., et al. 2011, A&A, 533, 119Elmegreen, B. G., Elmegreen, D. M., Fernandez, M. X., & Lemonias, J. J.
2009a, ApJ, 692, 12Elmegreen, D. M., Elmegreen, B. G., & Hirst, A. C. 2004, ApJ, 604, 21Elmegreen, D. M., Elmegreen, B. G., Marcus, M. T., et al. 2009b, ApJ, 701, 306Epinat, B., Tasca, L., Amram, P., et al. 2012, A&A, 539, 92Forster Schreiber, N. M., Genzel, R., Bouche, N., et al. 2009, ApJ, 706, 1364Forster Schreiber, N. M., Shapley, A. E., & Erb, D. K. 2011a, ApJ, 731, 65Forster Schreiber, N. M., Shapley, A. E., Genzel, R., et al. 2011b, ApJ, 739, 45Forster Schreiber, N. M., van Dokkum, P. G., Franx, M., et al. 2004, ApJ,
616, 40Franx, M., Labbe, I., Rudnick, G., et al. 2003, ApJ, 587, 79Franx, M., van Dokkum, P. G., Forster Schreiber, N. M., et al. 2008, ApJ, 688,
770Genel, S., Naab, T., Genzel, R., et al. 2012, ApJ, 745, 11Genzel, R., Burkert, A., Bouche, N., et al. 2008, ApJ, 687, 59Genzel, R., Newman, S., Jones, T., et al. 2011, ApJ, 733, 101Genzel, R., Tacconi, L. J., Eisenhauer, F., et al. 2006, Natur, 442, 786Genzel, R., Tacconi, L. J., Kurk, J., et al. 2013, ApJ, 773, 68Giavalisco, M., Ferguson, H. C., Koekemoer, A. M., et al. 2004, ApJ, 600, 93Grogin, N. A., Kocevski, D. D., Faber, S. M., et al. 2011, ApJS, 197, 35Guo, Y., Giavalisco, M., Ferguson, H. C., Cassata, P., & Koekemoer, A. M.
2012, ApJ, 757, 120Hopkins, P. F., Keres, D., Murray, N., Quataert, E., & Hernquist, L.
2012, MNRAS, 427, 968Hummer, D. G., & Storey, P. J. 1987, MNRAS, 224, 801Ilbert, O., Capak, P., Salvato, M., et al. 2009, ApJ, 690, 1236Immeli, A., Samland, M., Gerhard, O., & Westera, P. 2004a, A&A, 413, 547Immeli, A., Samland, M., Westera, P., & Gerhard, O. 2004b, ApJ, 611, 20Jones, T., Ellis, R. S., Richard, J., & Jullo, E. 2013, ApJ, 765, 48Kartaltepe, J. S., Dickinson, M., Alexander, D. M., et al. 2012, ApJ, 757, 23Kennicutt, R. C. 1998, ARA&A, 36, 189Koekemoer, A. M., Aussel, H., Calzetti, D., et al. 2007, ApJS, 172, 196Koekemoer, A. M., Faber, S. M., & Ferguson, H. C. 2011, ApJS, 197, 36Kriek, M., van Dokkum, P. G., Franx, M., Illingworth, G. D., & Magee, D. K.
2009a, ApJ, 705, 71
Kriek, M., van Dokkum, P. G., Labbe, I., et al. 2009b, ApJ, 700, 221Krumholz, M., & Burkert, A. 2010, ApJ, 724, 895Lanyon-Foster, M. M., Conselice, C. J., & Merrifield, M. R. 2012, MNRAS,
424, 1852Larson, R. B. 1981, MNRAS, 194, 809Law, D. R., Shapley, A. E., Steidel, C. C., et al. 2012, Natur, 487, 338Lee, S.-K., Idzi, R., Ferguson, H. C., et al. 2009, ApJS, 184, 100Lemoine-Busserolle, M., & Lamareille, F. 2010, MNRAS, 402, 2291Liu, X., Shapley, A. E., Coil, A. L., Brinchmann, J., & Ma, C.-P. 2008, ApJ,
678, 758Ly, C., Malkan, M. A., Kashikawa, N., et al. 2012, ApJ, 747, 16Magnelli, B., Popesso, P., Berta, S., et al. 2013, A&A, 553, 132Mancini, C., Forster Schreiber, N. M., Renzini, A., et al. 2011, ApJ, 743, 86Meurer, G. R., Wong, O. I., Kim, J. H., et al. 2009, ApJ, 695, 765Mitchell, P. D., Lacey, C. G., Baugh, C. M., & Cole, S. 2013, MNRAS, 435, 87Nelson, E. J., van Dokkum, P. G., Brammer, G., et al. 2012, ApJ, 747, 28Nelson, E. J., van Dokkum, P. G., Momcheva, I., et al. 2013, ApJ, 763, 16Newman, S. F., Shapiro Griffin, K., Genzel, R., et al. 2012, ApJ, 752, 111Noeske, K. G., Weiner, B. J., Faber, S. M., et al. 2007, ApJ, 660, 43Noguchi, M. 1999, ApJ, 514, 77Pacifici, C., Charlot, S., Blaizot, J., & Brinchmann, J. 2012, MNRAS, 421, 2002Papovich, C., Dickinson, M., & Ferguson, H. C. 2001, ApJ, 559, 620Pforr, J., Maraston, C., & Tonini, C. 2012, MNRAS, 422, 3285Price, S. H., Kriek, M., Brammer, G. B., et al. 2013, ApJ, submitted
(arXiv:1310.4177)Queyrel, J., Contini, T., Kissler-Patig, M., et al. 2012, A&A, 539, 93Rix, H.-W., Barden, M., Beckwith, S. V. W., et al. 2004, ApJS, 152, 163Salim, S., Rich, R. M., Charlot, S., et al. 2007, ApJS, 173, 267Santini, P., Rosario, D. J., Shao, L., et al. 2012, A&A, 540, 109Shapley, A. E., Steidel, C. C., Erb, D. K., et al. 2005, ApJ, 626, 698Spitler, L. R., Labbe, I., Glazebrook, K., et al. 2012, ApJ, 748, 21Steidel, C. C., Giavalisco, M., Pettini, M., Dickinson, M., & Adelberger, K. L.
1996, ApJ, 462, 17Swinbank, A. M., Sobral, D., Smail, I., et al. 2012, MNRAS, 426, 935Szomoru, D., Franx, M., Bouwens, R. J., et al. 2011, ApJ, 735, 22Szomoru, D., Franx, M., van Dokkum, P. G., et al. 2013, ApJ, 763, 73Tacconi, L. J., Genzel, R., Neri, R., et al. 2010, Natur, 463, 781Tacconi, L. J., Neri, R., Genzel, R., et al. 2013, ApJ, 768, 74Taylor, E. N., Hopkins, A. M., Baldry, I. K., et al. 2011, MNRAS, 418, 1587Teplitz, H. I., Rafelski, M., Kurczynski, P., et al. 2013, AJ, 146, 159Thompson, R. I., Storrie-Lombardi, L. J., Weymann, R. J., et al. 1999, AJ,
117, 17Trump, J. R., Konidaris, N. P., Barro, G., et al. 2013, ApJ, 763, 6van der Wel, A., Bell, E. F., Haussler, B., et al. 2012, ApJS, 203, 24van Dokkum, P. G., Brammer, G., Fumagalli, M., et al. 2011, ApJ, 743, 15van Dokkum, P. G., Franx, M., Forster Schreiber, N. M., et al. 2004, ApJ,
611, 703Wang, T., Huang, J., Faber, S. M., et al. 2012, ApJ, 752, 134Weinzirl, T., Jogee, S., Conselice, C. J., et al. 2011, ApJ, 743, 87Whitaker, K. E., Labbe, I., van Dokkum, P. G., et al. 2011, ApJ, 735, 86Whitaker, K. E., van Dokkum, P. G., Brammer, G., & Franx, M. 2012, ApJ,
754, 29Wild, V., Charlot, S., Brinchmann, J., et al. 2011, MNRAS, 417, 1760Williams, R. E., Blacker, B., Dickinson, M., et al. 1996, AJ, 112, 1335Williams, R. J., Quadri, R. F., Franx, M., van Dokkum, P. G., & Labbe, I.
2009, ApJ, 691, 1879Wisnioski, E., Glazebrook, K., Blake, C., et al. 2011, MNRAS, 417, 2601Wuyts, S., Forster Schreiber, N. M., Genzel, R., et al. 2012, ApJ, 753, 114Wuyts, S., Forster Schreiber, N. M., Lutz, D., et al. 2011a, ApJ, 738, 106Wuyts, S., Forster Schreiber, N. M., van der Wel, A., et al. 2011b, ApJ,
742, 96Wuyts, S., Franx, M., Cox, T. J., et al. 2009, ApJ, 696, 348Wuyts, S., Labbe, I., Franx, M., et al. 2007, ApJ, 655, 51Yuan, T.-T., Kewley, L. J., & Richard, J. 2013, ApJ, 763, 9Yuan, T.-T., Kewley, L. J., Swinbank, A. M., & Richard, J. 2012, ApJ, 759, 66