51
EUROPEAN ASSOCIATION OF REMOTE SENSING COMPANIES Copernicus Sentinels’ Products Economic Value: A Case Study of Forest Management in Sweden January 2016
EUROPEAN ASSOCIATION OF REMOTE SENSING COMPANIES
Copernicus Sentinels’
Products Economic Value:
A Case Study
of
Forest Management in Sweden
January 2016

Study Report: Case of Forest Management in Sweden
Page 2 31st January 2016
Client: ESA
Client Representative: Alessandra Tassa
Date of Report: 31st January 2016
Version: Final
Authors:
EARSC: Geoff Sawyer, Ariane Dubost
The Greenland BV: Marc de Vries
Version Date Change
Draft November 2015 Draft
First Issue January 2016 First Issue
This activity was undertaken under a programme of, and funded by, the European Space Agency (ESA)
(Contract Number 4000113261/15/I-LG).
The views expressed in this publication are those of the Authors and can in no way be taken to reflect the
official opinion of the European Space Agency.

Study Report: Case of Forest Management in Sweden
Page 3 31st January 2016
Contents:
1 Introduction and Scope ........................................................................................................................... 7
2 Forest Management in Sweden .............................................................................................................. 9
2.1 Description of the Case ................................................................................................................... 9
2.2 Forestry is Big in Sweden .............................................................................................................. 10
2.3 The Policy Context of Forest Management in Sweden ................................................................. 13
2.4 Forest Management Practises ...................................................................................................... 15
2.5 The Use of Clear-cut Maps ............................................................................................................ 18
3 The Value Chain .................................................................................................................................... 19
3.1 Description of the Value Chain ..................................................................................................... 19
3.2 The Swedish Forest Agency - Tier 1 & Tier 2 ................................................................................. 20
3.3 Tier 2: Other users of clear-cut maps ........................................................................................... 21
3.4 Tier 3: Beneficiaries of added value services ................................................................................ 24
3.5 Tier 4: Citizens and the Local Economy......................................................................................... 26
4 The use of Satellite Imagery .................................................................................................................. 28
5 Linking Economics to Reality ................................................................................................................. 31
5.1 The transaction costs model of governmental regulation ............................................................ 31
5.2 The benefit perspective on government regulation ..................................................................... 34
6 The Economic Assessment .................................................................................................................... 36
6.1 The Core Value Chain – Direct Economic Benefits........................................................................ 36
6.1.1 Benefits to the Swedish Forest Agency ................................................................................. 36
6.1.2 Tier 3: The Private Forest Owners ......................................................................................... 38
6.1.3 Tier 3: The Forest Companies ............................................................................................... 41
6.1.4 Tier 4: Citizens and the Local Economy ................................................................................. 42
6.2 The Collateral Benefits .................................................................................................................. 43
6.3 Non-Economic Impacts ................................................................................................................. 45
6.4 Total Economic Return .................................................................................................................. 45
7 Summary of Findings ............................................................................................................................. 47
7.1 General Approach and Methodology ........................................................................................... 47
7.2 Economic Benefit to Forest Management in Sweden .................................................................. 47
7.3 The Impact of the Imagery ............................................................................................................ 48
7.4 Conclusions ................................................................................................................................... 48
Annex 1: Sources ........................................................................................................................................... 49
Annex 2: List of abbreviations ....................................................................................................................... 51

Study Report: Case of Forest Management in Sweden
Page 4 31st January 2016
List of Figures:
Figure 2-1: Ownership structure of Swedish Forest Land ............................................................................... 9
Figure 2-2: Sweden's share of the world's market for timber products ....................................................... 10
Figure 2-3: Employment in the forest and timber products industries. ....................................................... 11
Figure 2-4: World's top exporters of forest products. .................................................................................. 12
Figure 2-5: Exports and Imports of Forest Industry products 2013 (billion SEK) .......................................... 12
Figure 2-6: Swedish County and Region Structure ....................................................................................... 14
Figure 2-7 : Forest Timber Volumes (1955-2015) ......................................................................................... 17
Figure 3-1: Value-chain concerning Forest Management in Sweden ........................................................... 19
Figure 3-2: Reindeer herding in N Sweden ................................................................................................... 27
Figure 4-1 : Complete coverage of Sweden using Optical Imagery .............................................................. 28
Figure 4-2 : Detection of Clear-Cut areas. ..................................................................................................... 29
Figure 6-1 : Value of Forest with age and pre-commercial thinning ............................................................ 40
List of Tables:
Table 5-1 : overview of regulation transaction costs .................................................................................... 33
Table 5-2 : Application of the Transaction cost model to the Forestry Case ................................................ 34
Table 6-1 : Per hectare yield (no pre-commercial thinning) ......................................................................... 39
Table 6-2 : Per hectare yield (1 pre-commercial thinning) ........................................................................... 39
Table 6-3 : Per hectare yield (2 pre-commercial thinning’s) ........................................................................ 39
Table 6-4 : Total gains (€k) from following best practise. ............................................................................. 41
Table 6-5 : Summary of the Economic Value ................................................................................................ 46

Study Report: Case of Forest Management in Sweden
Page 5 31st January 2016
Executive Summary
In this case, the second performed by EARSC and The Greenland under contract to ESA, we examine the
impact of the use of satellite imagery on forest management in Sweden. In each case, the goal is to look at
the impact that one particular satellite-derived product has on an operational value-chain.
In 2012, The Swedish Forest Agency wrote to nearly 70,000 private forest owners1 reminding them of their
obligation according to the 1993 forestry act to replant the forest land which they had cleared in the
previous years. As a result, some 10,000 hectares of forest was subsequently replanted which it is
considered would not otherwise have been the case.
Sweden is a country dominated by forests. It contains just below 1% of the world’s commercial forest area,
but provides 10% of the world´s sawn timber. Forest covers roughly 70% of Sweden, extending over 28
million hectares (ha). Of this area almost 23 million ha are productive forest land. Forest products generate
an export value of €12 Billion and gives employment to about 90,000 people. Every year the forestland of
1 Swedish Forest Agency, 2013,Internal report. Effekter på röjningsaktiviteten av riktad rådgivning via brev till skogsägare med röjningsbehov, Influence on pre-commercial thinning activity based on written advice to forest owners with remotely-sensed identified needs for pre-commercial thinning.,PM-2013-02-04.
The letter had arrived this morning. From the forest agency, it reminded her that she should consider
re-planting the forest which she had harvested 3 years before. Hannele thought about the wedding.
Only yesterday she had lunched with her daughter and lovely grandson. Was it really already 4 years
since they had needed the money to pay for the wedding? They had all sat around this very same dinner
table to talk about the guests they should invite, the reception they had all enjoyed and together they
had taken the family decision to cut down “grandpa’s wood”. They had enjoyed playing there so much
as children that it hurt to cut it but it had been the only way to raise the money needed for the wedding;
and after all they could replant it so that in 10 years it would already be a place for the next generation
to enjoy. But then after the wedding, money was tight and they had put off the decision to replant and
now it was already 3 years ago!
The Forest Agency reminded her that she had a duty to replant (and to perform a first thinning of the
land within 10 years) and that each year of delay would lose them almost as much as much as the cost
she was putting off! She sighed, she would go to the bank tomorrow and talk to them about a small
loan; it was her inheritance that she was wasting and the pleasure that one day would come to her
new grandson’s family when he was her age. One day maybe they would have a wedding to pay for
and grandpa’s wood would become grandma’s wood! She took another sip of coffee and smiled to
herself at the thought.
Study Report: Case of Forest Management in Sweden
Page 6 31st January 2016
Sweden produces a total of around 121 million m3 of wood. Around 50% of Swedish forests are owned by
over 300,000 individuals or families; the other half by the government and industry.
The current Swedish forestry Act, which took effect in 1994, has two main goals: one for production and
one for safeguarding biodiversity. The Swedish Forest Agency (SFA) is responsible for ensuring effective
implementation of this policy in what has become known as “The Swedish Forestry Model”2. The result has
been increasing forest and timber reserves whilst at the same time preserved natural forest land increasing
its value for leisure and recreation pursuits. This light legislative approach is referred to as “freedom with
responsibility”.
Information on the forests is essential for the SFA to be able to both detect and control illegal activities and
to educate the forest owners in best management practises. As Hannele found in the imagined story above,
whilst current forest owners can reap the benefits of their land, they have a responsibility to manage it
correctly; both for their next generation but also for the Swedish State. Since 2000, information coming
from satellite imagery has allowed the detection of illegal cutting (now quite rare) and of poor management
practise (lack of immediate re-planting and lack of pre-commercial thinning).
Through the use of clear-cut maps, ie maps showing where forest has been cleared for harvest, the SFA can
check whether this clearing was allowed under law and can take action where appropriate. But most
importantly, the forest owners know that the SFA can monitor their land which has improved compliance
with the law. As a consequence of the availability of the imagery, the area of forest cleared “illegally” has
fallen from around 10% of harvested forest each year (in 1998) to less than 0.5% (according to a 2003 study
carried out internally by the SFA).
The gathering and use of the imagery and the clear-cut maps cost very little (€64k) whilst the benefits are
quite large. The core benefits are related to the compliance costs savings and the long term value increase
as a result of higher timber production and enhanced quality. On top of that, as the clear-cut maps
produced by the SFA are made available as open data, other additional positive externalities accrue in the
form of more social-economic value (wild life preservation, forest diversity protection). All together we
estimate that the use of imagery brings a total direct economic benefit to Sweden of between €16.1m and
€21.6m per annum.
2 Forests and Forestry in Sweden. Royal Swedish Academy of Forest and Agriculture, August 2015. http://www.skogsstyrelsen.se/Global/upptack-skogen/Presentationsmaterial/Forests-and-Forestry-in-Sweden_2015.pdf

Study Report: Case of Forest Management in Sweden
Page 7 31st January 2016
1 Introduction and Scope
This report describes part of the outcomes obtained in the frame of the study “Assessing the detailed
economic benefits derived from Copernicus Earth Observation (EO) data within selected value chains”,
undertaken by the European Association of Remote Sensing Companies (EARSC), in collaboration with the
Green Land BV, under an assignment from the European Space Agency (ESA). The goal of the study was to
gather quantitative evidence that the usage of Copernicus Sentinel data provides an effective and
convenient support to various market applications. As part of it, we defined and applied a new
methodology to assess the full benefits (direct and indirect) stemming from the use of EO-derived geo-
spatial information, in a way which has not been tackled before.
We examined how the benefits of using these data either do or can affect a full value chain by starting from
the primary usage and then following the related impact down various identified tiers in the value chain.
The new methodology was applied to three use cases, which have been selected considering the maturity
of the application as well as the feasibility for the sake of the study. This is the second case to be published3.
The results are captured in separate, dedicated reports which are written to benefit policy makers, in
Europe as well as in ESA/EU Member States, who are concerned with (EO) space programmes. However,
each single report should also be of interest for the private industries, public authorities and policy makers
involved at any level in any of the specific applications described therein.
We examined each case using a specific methodology developed and applied and tested through the 3
cases. This starts with a defined product which is being used operationally to support a process within an
organisation (which can be private or public). We then define a value chain linking the various users which
is constructed in tiers where the type of information used by each tier differs. It uses a model to link the
reality of the operation to the economics of the case, it uses an assessment of the role that satellite imagery
plays before we make an analysis of the economic benefit being created at each stage of use. Assumptions
are used in many cases which are there to be challenged by experts.
The current report describes the results obtained for the second of these cases; the case of Forest
Management in Sweden where satellite imagery is used to support Swedish Forest Agency to monitor and
process clear-cutting. The analysis differs from previous ones (for example that carried out in the GSE Forest
project4) because it looks in detail at the extended use of the clear-cut maps by those involved not just in
the forest and timber industry but also in related organisations which benefit from the product.
The case hinges on effective and efficient compliance with the legislation applicable to the owners of forest
land which allows a fairly open regime based on transparency and even trust between the SFA and forest
owners. Forest is a national asset in Sweden which contributes over €12b in exports each year and employs
16,000 people directly in forestry and 73,000 in the forestry and timber industry5. Hence the management
3 Case 1: Copernicus Sentinel’s Products Economic Value: A case study of Winter Navigation in the Baltic, EARSC and The Greenland, September 2015. 4 GAF / Ecorys, Cost Benefit Analysis of GSE Forests Service Analysis, Report for ESA-ESRIN, 2004. 5 Forest facts. Swedish Forest Industries Association; www.forestindustries.se/

Study Report: Case of Forest Management in Sweden
Page 8 31st January 2016
of the forests has a strategic importance for the nation due to its overall economic importance. It also has
a strong environmental dimension linked to the recreational use of the forests.
The report is based on research and interviews with persons in Sweden who are directly involved in clear-
cuts and forest management as well as considerable background research to provide back-up numbers.
Since direct information is not available for some of the parameters we are looking to analyse, some of the
analysis is based on assumptions which are clearly declared. We shall welcome further discussion on these
assumptions and/or the opportunity to refine the analysis in the future. In the meantime, this analysis
shows significant economic benefits to the economy of Sweden.
We should like to thank the following people for their assistance in preparing this report:
Erik Willén: The Forest Research Institute of Sweden, Skogforsk
Anders Persson, Patrick André: Swedish Forest Agency (SFA)
Ola Inghe, Ninni Boren: Swedish Environment Protection Agency
Sandra Wennberg, Peter Svedberg, Erik Sjoberg: Metria
Johan Viklund: SCA Skog (forest company)
Stellan Torshage: Holmen (forest company)
Johanna Ehlin : County Administration Board, Länsstyrelsen Gävleborg

Study Report: Case of Forest Management in Sweden
Page 9 31st January 2016
2 Forest Management in Sweden
2.1 Description of the Case
This case is all about the use of satellite imagery to monitor the Swedish forests for “clear-cuts”. Clear-cuts
are areas of the forest of (normally) between 0.25 and 25ha in size which are cut taking habitats and
environmental and cultural considerations into account. For example, for areas greater than 3ha, owners
are required to leave some trees which may be particular species (ie broad-leafed), are marking boundaries
or which are near water bodies. They are also required to leave some groups of trees including some dead
trees (particularly rich in habitats important for biodiversity). Clearing of a particular area will take place
every 60-80 years in Southern Sweden and around 100 years in the Northern areas of Sweden. Clear-cutting
is controlled by legislation (see section 2.3) although much relies on good management practise.
The case hinges on compliance: the observation by forest owners of the legislation on clear-cutting and the
ability of the SFA to monitor and enforce these rules. When a forest owner wishes to fell an area of forest
over 0.3ha in size they are obliged to notify the SFA of their intention to do so at least 6 weeks prior to
taking the axe (or more accurately deploying the heavy machinery). Afterwards the owner has 3 years in
which to harvest the timber. The SFA has no means to know directly whether the forest area has been
cleared or not and, when it has been, whether the area conforms to the notification or not.
Figure 2-1: Ownership structure of Swedish Forest Land6
6 Swedish Forest Agency Statistics: http://www.skogsstyrelsen.se/en/AUTHORITY/Statistics/

Study Report: Case of Forest Management in Sweden
Page 10 31st January 2016
Management of the forests in Sweden is of national importance. As shown in Figure 2-1 around 50% of the
forest in Sweden is owned by private individuals or families. Another 25% is owned by large industrial
players like Holmen and a further 25% is state-owned at different administrative levels. Mostly, the state
owned, productive forests are managed by a state-owned company: Sveaskog. The total of over 300,000
forest owners in Sweden comprises almost completely of individuals or families.
This spread of ownership gives rise to different issues. The companies, whether state-owned or private,
have an interest to manage their forests wisely to give maximum long term returns, while complying with
regulations. All are certified by the Forest Stewardship Council (FSC) or the Programme for the
Endorsement of Forest Certification (PEFC) which requires them to follow sustainable practices. Private
individuals owning forests, however, are facing a classical dilemma: short term optimisation of returns
versus long term profitability based on sound asset management. Human nature often drives the short
term goals generating all sorts of negative externalities (washing out of soil, losing bio diversity etc.). Often
investment decisions will be deferred, possibly in favour of other projects or for environmental reasons,
and hence these owners need to be encouraged and even taught to manage their assets better.
2.2 Forestry is Big in Sweden
Forestry is a strategic industry for Sweden. Despite only having 1% of the world’s boreal forests, Sweden
manages to produce 5% of the global production of timber and its exports represent 10% of the global
turnover. This success is attributed to what is known as “The Swedish Model”. Some 50% of the Swedish
territory is covered in forest with the vast majority managed.
source: Swedish Forest Industries Federation.
Figure 2-2: Sweden's share of the world's market for timber products

Study Report: Case of Forest Management in Sweden
Page 11 31st January 2016
Around 73,000 people work directly in the forest and timber industries; 27,800 in wood and wood products,
29,000 in paper and paper products7 and a further 16,000 in forestry.
Exports of 120bSEK (€12.5b) for timber and timber products represents some 9% of the country’s total. In
total, including transportation, forest operations and sub-contractors, some 200,000 jobs are provided by
the sector. In some counties, the industry accounts for 20% of the industrial employment8. Sweden is the
third largest exporter of wood products after Canada and the US. The country is the fourth largest exporter
of pulp, the third largest exporter of paper and the second largest exporter of sawn timber9.
source: Swedish Forest Industries Federation.
Figure 2-3: Employment in the forest and timber products industries.
According to the Swedish Royal Academy of Agriculture and Forestry, there are some 50 pulp and paper
manufacturers and around 115 sawmills in Sweden but few of the industrial companies are vertically
integrated to own forest land as well. Mostly they rely on buying timber from family owners; a practise
which is supported by a software package called Timberwebb marketed by Metria.
7 Swedish Forest Agency statistics; http://www.skogsstyrelsen.se/en/AUTHORITY/Statistics/Subject-Areas/Education-and-Labour-Force/Education-and-Labour-Force/ 8 Forest and Forestry in Sweden; Royal Swedish Academy of Agriculture and Forestry, August 2015. 9 Nordic Family Forestry: http://www.nordicforestry.org/facts/Sweden.asp#Sju

Study Report: Case of Forest Management in Sweden
Page 12 31st January 2016
Figure 2-4: World's top exporters of forest products.
The industry includes the forest managers, the timber mills, the paper mills as well as the contractors which
clear and transport the timber; but other sectors are concerned also. Wood is used extensively for
sustainable energy generation in Sweden which has the highest figure in Europe (44%) for the percentage
of its energy needs which are met from renewable resources of which wood plays the largest part (53%)10.
Timber also plays a strong role in construction and is an important market for the machinery industry.
Figure 2-5: Exports and Imports of Forest Industry products 2013 (billion SEK)
10 Swedish Forest Sector Outlook Study; UN Economic Commission for Europe; 2011.

Study Report: Case of Forest Management in Sweden
Page 13 31st January 2016
But forests are not just important as a source of timber; they have a strong social dimension also. One of
the most popular outdoor activities in Sweden according to opinion polls is “forest walking”8. But other
activities have both a social and an economic importance such as hunting, fishing, reindeer herding (by the
Sami), mushroom foraging etc. These activities have further economic consequences through the rise of
nature tourism and an impact on the housing market where second homes in natural forest land become
more attractive for city dwellers in Sweden and from other countries.
2.3 The Policy Context of Forest Management in Sweden
In 1903, Sweden became the first country in the world to introduce legislation with the goal to improve
forest management practises. Before this, large areas of forest were being cleared for industrial use and
for construction and stocks became heavily depleted. The focus of the act was regeneration and was backed
up by establishing a forest authority in each county with the legal power to monitor and control the actions
of the land-owners. In 1923 a first inventory was made of all the forested land and further legislation was
steadily introduced giving more protection to young forests.
The policy was a success and has led to an increase in Swedish timber stocks of around 85% since the
inventory. Nevertheless, the emphasis was on control with a focus on production and as environmental
concerns began to increase in the last 20th century a new Forest act was introduced in 1994. This placed
equal emphasis on production, sustainability and environmental protection and reduced the legislation to
be less controlling; often referred to as “freedom with responsibility”.
The 1903 act introduced the obligation to replant after a section of forest had been cleared. The 1994 act
removed this as an obligation although it remained as an expectation. It introduced the clear-cut
notification system whereby the forest owner is obliged to notify the authority of their intention to harvest.
Monitoring and compliance is managed by the SFA based in Jonkoping in the south of Sweden but with
employees in each county. It is also backed up by certification schemes like that of the Forest Stewardship
Council (FSC)11 formed in 1994 and the Programme for the Endorsement of Forest Certification (PEFC) to
provide guidance on sustainable forestry and more importantly a scheme which companies could follow
whereby they could be certified as providing timber grown to sustainable standards.
11 The Forest Stewardship Council A.C. (FSC) has the mission to “promote environmentally appropriate, socially beneficial, and economically viable management of the world's forests”. https://ic.fsc.org/

Study Report: Case of Forest Management in Sweden
Page 14 31st January 2016
Figure 2-6: Swedish Forest Agency and District and Regional Structure
In 2008 a further act was introduced placing even stronger responsibility on owners for good management
practise for the social value of the forest. A further influence has been the increased international focus on
sustainability often backed up by EU directives such as the EU Timber Regulation12, the Habitats Directive13
and the Water Framework Directive14 and by International conventions for example the Convention on
12 Regulation (EU) No 995/2010 of the European Parliament and of the Council of 20 October 2010 laying down the obligations of operators who place timber and timber products on the market Text with EEA relevance 13 Council Directive 92/43/EEC of 21 May 1992 on the conservation of natural habitats and of wild fauna and flora. 14 Directive 2000/60/EC of the European Parliament and of the Council of 23 October 2000 establishing a framework for Community action in the field of water policy

Study Report: Case of Forest Management in Sweden
Page 15 31st January 2016
Biodiversity15 and the UN Framework Convention on Climate Change16. These pressures also led to the
introduction of certification of timber as being drawn from sustainable stocks and the schemes mentioned
above.
This light legislation is the hallmark of the modern forest management policy much lauded in Sweden
(although also criticised by some environmental bodies which would like to see it under better control).
But, due to human nature, light regulation only works if enforcement works and bending or breaking the
rules makes no sense. And this is exactly what the introduction of the use of satellite imagery did: it allowed
the light system to work.
Clear-cutting as a practise started in the 1940’s as pressure to increase the harvest from the forests became
stronger. This led to controlled cutting which, according to the 1903 act, should be replanted immediately.
But, industrialisation of this process led to inappropriate planting with poor quality seedlings and improper
species being planted immediately after the clearing took place.
A best practise was required which could also be reflected in the legislation. Efforts were increased to
research forest practise and to improve seedlings and the Forestry Research Institute of Sweden
(Skogsforsk) was established in the 1930’s funded jointly by the industry and the government17.
Skogforsk’s goal is to provide Swedish forestry with knowledge, services and products that contributes to
a profitable and sustainable forestry. The demand-driven applied research includes a wide variety of fields,
such as forest technology, raw-material utilization, environmental impact and conservation, forest tree
breeding, logistics, forest bioenergy and silviculture.
Of the Institute’s staff of about 100, some 60 are researchers. Because of the rich diversity of background,
education and experience, Skogforsk’s collective skills, expertise, knowledge and competence span a wide
range of disciplines and specialist fields.
2.4 Forest Management Practises
The active management of the clear-cut process was started around 20 years ago (following the 1994 act)
and since then around 25% of the total forest area in Sweden has been through the process which is
described.
In effect the process starts with a clear-cutting or final felling of an area of the forest. As noted earlier, the
owner is required to notify the SFA when they intend to perform a clear-cut. Once a forest area has been
cleared, under Swedish law the owner should replant within 3 years. Within 10 years of re-planting, a first
thinning ought to take place. This is called “pre-commercial thinning” since the trees are small and there is
no timber value, and the cuttings are left in place to benefit the habitat. Sometimes, 2 pre-commercial
15 Convention on Biodiversity: https://www.cbd.int/convention/text/ 16 UN Framework Convention on Climate Change. http://unfccc.int/2860.php 17 About Skogforsk; http://www.skogforsk.se/english/about-skogforsk/

Study Report: Case of Forest Management in Sweden
Page 16 31st January 2016
thinning’s will take place within the 10 year period with a small increase in the overall value of the final
harvest.
After a further 20 years, ie 30 years after re-planting, the first commercial thinning takes place. This will
extract a percentage of the trees in order to allow the rest to develop more fully. The yield of the first
commercial thinning is nominally around 50m3 per hectare. After a further 25 years the second commercial
thinning takes place. This will yield around 100m3 per hectare.
The final harvesting will occur after around 80 years (in Southern Sweden but longer in the north) when an
average harvest of 300m3 is obtained meaning that for each hectare a nominal 450m3 is harvested and the
net yield is around €11.5k per hectare. More details on this can be found in chapter 6.
These are nominal numbers for the south of Sweden and the final clear-cut yield can vary between 200m3
and 600m3 per hectare. For each year that re-planting is delayed, about 1.25% of the potential timber yield
is lost (ie one year out of 80). Hence the SFA have a clear interest (and accordingly a duty under law) to
monitor where replanting has not taken place or where thinning has been delayed so as to maximise the
overall production and benefit to the Swedish economy.
The success of this policy can be seen in Figure 2-7 which shows a number of the forest / timber statistics
since 1955. The line “total drain” represents the total volume of timber lost each year due to harvesting
(total harvest) and to natural wastage (e.g. after storms), while the line "Total increment" represents the
increase in forests stocks. The total increment being always greater than the total drain, it shows that over-
all stocks have been increasing and hence the success of the policy. The peak losses in 1971 and in 2005
were caused by particularly severe winter storms.
The figure also shows the contributions to the total harvest coming from thinning, final felling (clear-cut-
ting) and "other harvest" (which might include harvesting following storms).

Study Report: Case of Forest Management in Sweden
Page 17 31st January 2016
Figure 2-7 : Forest Timber Volumes (1955-2015)18
The figure also shows the effect of changing policy. As is reported in the Royal Swedish Academy for
Forestry and Agriculture publication8, the forestry management practises in the mid-century and after the
end of the second world war, caused a great deal of timber to be lost. As farming methods were rationalised
and later pasture and poor-quality arable land were planted with forest trees, the volume of timber
increased. New legislation in the late 1970’s consolidated this, and the total increment each year increased.
The time-lag necessary of 80 years means that the benefits of this are starting to be felt today and the total
standing volume has grown by 50% between 1950 and 20158.
The companies whether state owned or private have a strong interest to manage their land for maximum
yield. Whilst this can but rarely does cause tension between possible conflicting objectives, the role of the
SFA is quite co-operative even if they are obliged to monitor the company activities. However, the private
owners are less efficient and will often delay the re-planting since the short term benefit to them is zero
and a heavy up-front investment is needed from which the current owner will not see a return – only his
children or grand-children. Hence one role of the SFA is to intervene and “encourage” these owners –
remember who are holding over 50% of the forest assets! – to replant as soon as possible.
18 Sweden National Forest Inventory

Study Report: Case of Forest Management in Sweden
Page 18 31st January 2016
2.5 The Use of Clear-cut Maps
When satellite imagery became readily available in the late 80’s and early 90’s, research projects were
conducted to look at how this could be applied to forest management. A project called Enforma19 was
instrumental in showing how it could be combined with the then emerging GIS technology to help the SFA
in the performance of its tasks.
Enforma proved that satellite imagery can be used to identify cleared areas of forest (for other uses see
chapter 4). By 1998, the SFA had established a country-wide system (called Kotten) to share and integrate
geographic, administrative data. In 1997, the Enforma project was started which integrated the satellite
imagery coming from the SPOT satellites with other forest data. The process of establishing a centralised
repository was catalysed by the fact that gathering country-wide optical image sets is not easy in northern
countries where cloud is prevalent and it can take many passes to get cloud-free maps. When Enforma
finished in 2000, the use of satellite imagery had been proven and steps were taken to integrate the
imagery and the clear-cut maps into the Kotten system.
At that time, the SFA believed that they had good knowledge of where the cutting was taking place through
the notification system and by virtue of having “a lot of people in the forest”! However, the imagery was
quite revealing: it showed that nearly 10% of the clear-cut areas were not cut in accordance with the
notifications; equivalent to around 25,000 hectares. Mostly this was due to a difference in the area which
had been cut compared to the notification ie the boundaries of the cut area were not as they were
supposed to be according to the notification.
As a result of this discovery, imagery offering whole country coverage was ordered for the following year
by the SFA which continued alone to purchase whole country coverage up until 2003. Later, in 2008, this
had another benefit as it led to the creation of the Saccess image archive where all the imagery ordered by
Sweden is placed and is available to all public users in the country. It has provoked a central government
procurement funded by various agencies. This is seen as a great national asset which has certainly also
helped the uptake and use of satellite imagery for other purposes.
So the satellite images provided much better information on when the cutting had been taking place and
the shape and size of the actually cut area. Obviously, this allowed follow-up actions to be much better
targeted without needing to spend time on the ground performing specific surveys.
Accordingly, the SFA relying on the imagery was able suddenly to fully monitor compliance. Estimates are
that the 10% illegal clear cutting has now dropped spectacularly to around 0.5% per annum and is normally
due to error and not a deliberate attempt at evasion.
19 http://cordis.europa.eu/project/rcn/38844_en.html Enforma (Integration of EO Data Enforcing National Legislation for Forest Management) was an FP4 project19 running from 1997 – 2000. It was led by the Swedish Space Corporation and included forest administrations from Sweden, Finland and Austria. It had the goal to demonstrate the use of satellite data to support forest management operations and led to the software which is used by SFA and others to generate classified maps of the forest area. The software is still known as Enforma.
Study Report: Case of Forest Management in Sweden
Page 19 31st January 2016
3 The Value Chain
3.1 Description of the Value Chain The first step in our methodology is to construct a value-chain of the activity. Having analysed and
understood the system for forest management in Sweden and having seen the main players, our next step
is to try to place the various stakeholders in place as a value-chain. In this case, compared to Case 1 for the
Ice-breaking services, the value-chain is much more diverse. The result is shown in Figure 3-1 where the
core value chain is shown in darker blue.
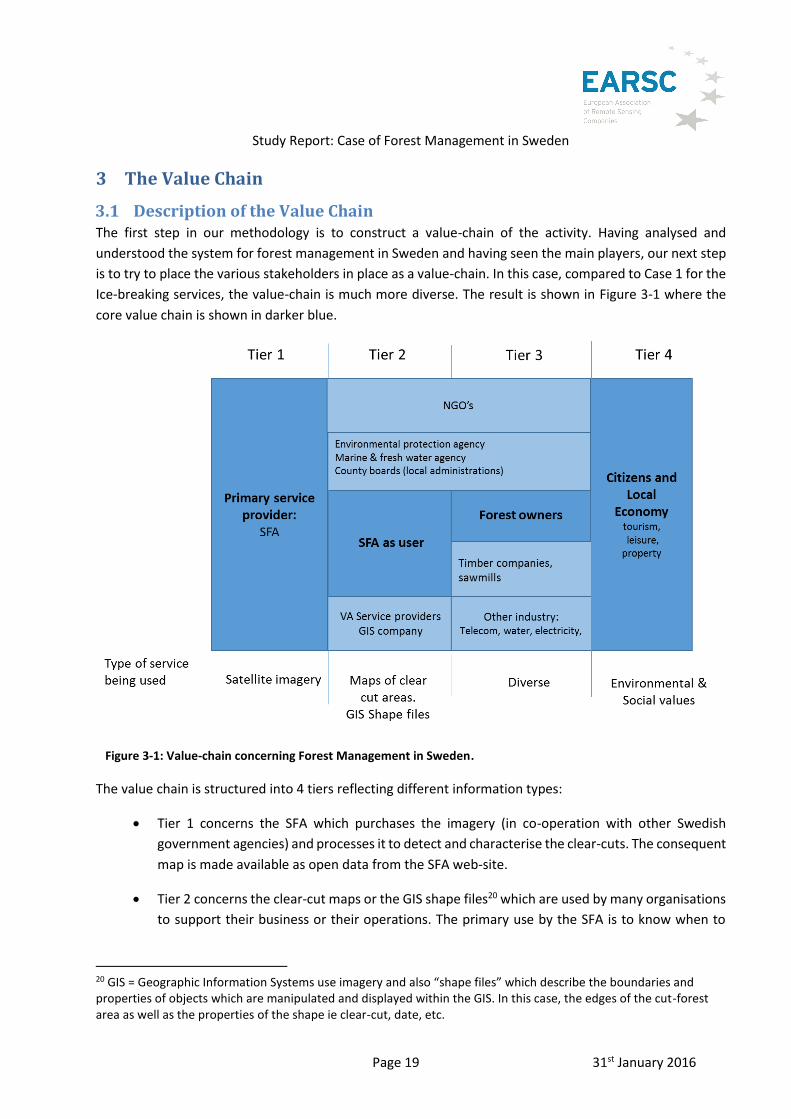
Figure 3-1: Value-chain concerning Forest Management in Sweden.
The value chain is structured into 4 tiers reflecting different information types:
Tier 1 concerns the SFA which purchases the imagery (in co-operation with other Swedish
government agencies) and processes it to detect and characterise the clear-cuts. The consequent
map is made available as open data from the SFA web-site.
Tier 2 concerns the clear-cut maps or the GIS shape files20 which are used by many organisations
to support their business or their operations. The primary use by the SFA is to know when to
20 GIS = Geographic Information Systems use imagery and also “shape files” which describe the boundaries and properties of objects which are manipulated and displayed within the GIS. In this case, the edges of the cut-forest area as well as the properties of the shape ie clear-cut, date, etc.

Study Report: Case of Forest Management in Sweden
Page 20 31st January 2016
contact and advise private owners of forest land. But many other organisations also use the maps
directly as we shall describe later.
Tier 3 concerns diverse information of relevance to private forest owners and several industrial
sectors. These are the secondary beneficiaries of the clear-cut maps and the information relevant
to them is quite diverse. In each case it concerns the maximising of value to the
individual/company by supporting their operational process either short or long term.
Tier 4 concerns the citizens and the local economy which benefit through various environmental
and social values. Improvements in the forest environment feed into more wildlife, better nature
which in turn gives rise to tourism and leisure activities. The increased attraction to the
countryside also increases property value which has several positive impacts on the local
economy.
The core value – cutting across the entire chain (marked in dark blue) - concerns the SFA and the forest
owners where overall production is enhanced (through having better clear-cut information) as the SFA is
able to rely on a low cost highly efficient compliance model, which would not be feasible and enforceable
without having the satellite data at its disposal. In addition, many other organisations are able to benefit
from using the clear-cut maps which are addressed under the term “collateral benefits”.
3.2 The Swedish Forest Agency - Tier 1 & Tier 2
The SFA is both the service provider of the clear-cut maps and the primary user. It is the mission of
the SFA to promote the management of Swedish woodland in such a way that the goals set by the
Swedish parliament are met. This means sustainably managed forests.
For production issues, “the most significant production effects are achieved by good
management on over larger areas, through forest owners regenerating, manage and protect
their woodland in a sensible way. To achieve a high and sustainable production over time the
quality within the following activities must be improved, forest regeneration, stand
management, environmental consideration and forest protection.”
For environment issues, “the Swedish Forest Agency works with both ecosystems and species.
We identify woodland key habitats, which are ecosystems that contain rare and threatened
species. We have identified a list of indicator species which can be used to determine
ecosystems with high conservation value. We also work with monitoring biodiversity and are
actively involved in recovery plans for some of Sweden’s most threatened forest dwelling
species”.21
The SFA is responsible for ensuring compliance with the legislation as well as training and making
information available to forest owners. It is at the heart of the process for the use of satellite imagery. It
21 Swedish Forest Agency; http://www.skogsstyrelsen.se/en/AUTHORITY/Forest-and-environment/Biodiversity/

Study Report: Case of Forest Management in Sweden
Page 21 31st January 2016
drives the procurement of the satellite imagery and generate the clear-cut maps themselves. Currently, it
employs around 1000 people in total of which 100 are involved in the notification and clear-cut process.
Most of these are distributed throughout Sweden with nominally 2 GIS/forest experts in each SFA districts
– of which there are 26.
The SFA receives between 50,000 and 60,000 notifications each year which are published on their web-site
each Monday morning. The latest clear-cut map from the satellite imagery is also published there as open
data which may be downloaded and used by anyone.
The SFA works with several other government agencies and it would appear that the light legislative system
has been a strong factor in encouraging them to work together. The sharing of GIS underpinned by the
satellite imagery provides a strong glue to enable the exchange of information and hence co-operation.
Satellite imagery was first used to map the clear-cut areas in 1998-2000 within the Enforma project.
Following Enforma, the software was integrated with the GIS package (Kotten) developed by the SFA
becoming fully operational in 2000, with full-scale integration by 2003.
SFA started buying the satellite imagery from SPOT in 1998 and acquired full country coverage from 1999
onwards. From 2003, the costs were shared with other government agencies which continued up to 2007.
In 2008, the image archive Saccess was set up.
SFA analyses the images for changes in the forest. This is done by the district officers situated in the 26
offices of the agency in districts throughout Sweden, who know the local forest and its owners. The changes
detected are correlated with the notifications to identify whether the cutting has taken place and whether
it corresponds to the area notified. In some case, especially in the early years, cut areas were detected
which have not been notified.
The maps are also used to identify areas which have been recently cut and whether they have been
replanted as is required by the law. Where replanting has taken place, the SFA monitors the images for
evidence of pre-commercial thinning, the timing of which can have a significant impact on the total volume
of wood which will eventually be harvested.
3.3 Tier 2: Other users of clear-cut maps In addition to the SFA, other organisations also use the clear-cut maps or the GIS shape files delineating the
clear-cut areas. The main beneficiaries here are:
1. Other government departments (agencies)
2. County Boards
3. NGO’s
4. EO/GI Service providers

Study Report: Case of Forest Management in Sweden
Page 22 31st January 2016
Other Government Departments (agencies)
The Lantmateriet22 is the cadastral property agency for Sweden, belonging to the Ministry of Enterprise
and Innovation and providing the national mapping service, the cadastre for registering land ownership
and geographic information on the country. In common with many cadastral and survey bodies, around
70% of the revenues come from selling products and services whilst 30% comes from government grants.
The Lantmateriet performs aerial surveys to update their maps once every 5 years with satellite data being
used in the interim. Imagery is bought in co-operation with other government departments ie SFA and is
made available for general use through the Saccess database.
In 2010, the commercial division including the remote sensing and GIS department of Lantmateriet was
separated into a trading entity which then became the company called Metria.
The Swedish Environmental Protection Agency (SEPA) is the body with overall responsibility for
maintaining the environment in Sweden. They work very closely with the County boards where most of the
policies are implemented. SEPA provides information to the Swedish government, advises on policy impacts
and co-ordinates the actions with other agencies in Sweden and internationally. As such for forests it relies
mainly on data coming from the SFA and is not so much directly concerned with the clear-cut mapping.
However, the open legislative approach in Sweden which benefits the population and keeps policy costs
low, is a direct result of SEPA activity.
The Swedish Agency for Marine and Water Management (SwAM23), is “a government agency that works
for flourishing seas, lakes and streams for the benefit and enjoyment of all”. A key concern for water
management is the leaching of soils causing eutrophication and acidification of lakes and rivers. Leaching
occurs more rapidly where forests have been cleared and/or where machinery has been working. The
SwAM works with the SFA to understand where clear-cutting has or will take place to help manage the
fresh water resources.
The County Boards
There are 21 County Boards (CB’s) in Sweden which make up the local administration layer. The CB’s
provide the link between people, the municipalities and the national government managing local priorities,
promoting the county interests and co-ordinating between different policies at the county level.
For the Gavleborg County Board which helped us with information, the most important use of the forest
clear-cut information from the SFA is as a complement to digital aerial photos. Those may be some years
old. Digital aerial photos, in turn, are used extensively for different purposes in nature conservation:
preliminary assessment of conservation value; preliminary assessment of vegetation type; support for field
work. More sporadic uses of the clear-cut information include the production of statistics on clear-cutting
in (unprotected) areas with known conservation value, and statistics on forestry close to lakes and streams.
22 http://www.lantmateriet.se/en/About-Lantmateriet/ 23 https://www.havochvatten.se/en/start.html

Study Report: Case of Forest Management in Sweden
Page 23 31st January 2016
If Gavleborg wishes to create a new nature reserve it will notify the forest owner offering 2 possibilities:
1. the CB will buy the land from the owner. The CB will normally prefer this as it avoids any
complications regarding responsibilities and insurance.
2. the CB will compensate the owner with a long-term, one-off fee but which leaves the owner
with hunting / fishing rights. Owners will sometimes prefer this option to receive a lower
amount but retaining hunting rights.
The Gavleborg county uses the information in several ways:
1. to make any decision regarding a clear-cut notification referred to them by the SFA. If there is a
nature reserve or sensitive area adjacent to the clear-cut notification, then the CB will write
informing the SFA which will inform the forest owner not to encroach on this in any way.
2. to help in decisions regarding new nature reserves. For example, if there is an adjacent area which
has been cleared, then much of the biodiversity value will have been lost and they will not waste
time evaluating the new notification.
3. to inform the SEPA which will ask the CB for an annual update on the sensitive areas. Whilst SEPA
will already know the nature reserves and the areas under surveillance, only the county knows if
there are further areas which maybe under consideration. Hence the CB provides an updated map
to SEPA showing any new such areas.
4. After storms the CB will assess any damage which is near to or within sensitive areas. If there is an
adjacent clear-cut then the damage risk is much higher. The CB will sometimes order imagery to
assist in the damage assessment. This needs to be high resolution (about 0.5m) so will be of small
areas and coming from commercial suppliers (not Sentinels).
NGO’s
A number of NGO’s in Sweden area concerned with forests as being such an important part of the Swedish
environment. NGO’s are using the clear-cut maps to monitor the forest felling and to inform on
conservation areas; particularly with relevance for older forested areas with broadleaf trees. The most
important NGO’s are:
Swedish Society for Nature Conservation (SSNC)24 “is a charitable environmental organisation ………..
spread knowledge, chart environmental threats, propose solutions and influence politicians and authorities,
both nationally and internationally…….. working regionally in 24 county branches and locally in 270
community branches. With regard to forests it seeks to see the conservation of old forests where multi-
species flourish promoting biodiversity and better cultural values.
24 http://www.naturskyddsforeningen.se/in-english/about-us

Study Report: Case of Forest Management in Sweden
Page 24 31st January 2016
The Swedish Society for Nature Conservation is an active pressure group with more than 200,000
members. It aims to increase the area of protected forest and especially the preservation of old forests in
Sweden as well as globally.
World Wildlife Fund (WWF) has a branch in Sweden whose primary focus is to preserve biodiversity and
to ensure the sustainable use of natural resources, both within Sweden and globally.
The European Outdoor Conservation Association (EOCA)25 is an international body also focused on the
preservation of old-forest in Sweden.
EO/GI Service Providers
The EO services value-adding industry comprises those companies which are using satellite EO data as part
of their products offered to customers. Whilst the SFA uses the imagery directly to generate the clear-cut
maps, the value adding industry benefits by being able to use them as part of the data which is supplied to
their customers. We talked with Metria to understand this process but they are not the only company that
benefits.
A number of other industry sectors are interested in the forests and need information concerning them.
Metria and other service providers profit by adding it into the mix of data on which they base products.
The sectors include telecommunications mobile operators, power companies managing overhead power
lines and water companies discussed further in the next section.
3.4 Tier 3: Beneficiaries of added value services
Both family/individual forest owners of which there are some 300,000 in Sweden and other industry sectors
are the beneficiaries of added-value services based on the clear-cut maps. The first are supplied by the SFA
whilst the second are served as clients by EO value-adding service providers.
Private Forest Owners:
The private forest owners are less likely than forest companies to manage their assets to deliver longer-
term, high-production. Other priorities feature in their decision making since the investment required to
replant will not generate much yield in their lifetime. Similarly private owners are more likely to delay the
pre-commercial thinning which both increases the cost of the operation whilst reducing the final yield. So
the objectives and decisions taken by individual owners are not in line with the national interests to grow
production long-term.
It is not the case for all the owners, but around 50% do need to be contacted and reminded by the SFA to
perform the management operations in a timely manner. Since there are over 300,000 private owners this
leaves a lot of work to be done; letters to send and / or owners to contact.
25 http://www.outdoorconservation.eu/project-detail.cfm?projectid=819

Study Report: Case of Forest Management in Sweden
Page 25 31st January 2016
Forest Companies
It seems that the forest companies do not make direct use of the clear-cut maps. However, they use them
indirectly through the Timberwebb system. We also found that they make use of satellite imagery directly
and foresee increased use in the future. Notwithstanding, the forest companies benefit from the light
Swedish legislation in 2 ways:
1. Firstly the increase in standing timber volume and quality feeds directly into their businesses as
they are the purchasers of the forest to be cleared. The overall value of the timber stocks drives
directly the business volume of the industry.
2. The light regulation keeps costs on the industry low. Some environmental costs are incurred but
this would happen in any case. They avoid a heavy, legal system which would require SFA to
approve the cutting of timber and which would drive up the cost base of the whole industry. This
benefits the whole economy as the price of wood products is kept more competitive and helps
Swedish industry to compete internationally.
We talked with 2 forest companies during our series of meetings; SCA Skog and Holmen. Neither make
direct use of the clear-cut maps/GIS shape files but do use procure and use other satellite imagery which is
described in chapter 4.
Other Industries
EO companies like Metria and GI companies like Cartesia make use of the clear-cut maps to complete
dossiers which are made for clients in a number of industrial sectors.
Telecommunications. The mobile telecoms industry has used EO data for many years to give up to
date propagation maps based on the terrain height and landcover. With the advent of 3g and 4G
networks, as well as population and urban changes, the networks need to be maintained and
updated. Propagation maps are required every 3 to 5 years and the forest growth affects the
placing of towers and antennas. The clear-cut map therefore forms one layer of data amongst many
others which is provided to the telecoms companies for planning purposes.
Power Companies. Power lines are laid through the forests and are affected by forest growth.
When a clear-cut is made, nearby trees are exposed to the winds and can be toppled by strong
gusts. The presence of clear-cuts near to power lines is monitored to establish where the risk of
this happening is greater.
Water companies. Run-off from fertiliser use into water catchments causes additional treatment
to be necessary of reservoirs where the water is collected. Clear-cut areas where re-planting has
taken place are a source of run-off and hence are used as one input into models supplied to the
water companies.
Study Report: Case of Forest Management in Sweden
Page 26 31st January 2016
3.5 Tier 4: Citizens and the Local Economy. The Swedish citizens benefit from the increased economic activity that arises from the forest management
practise and from the improved forest natural environment. They enjoy a wide range of leisure activities
around forests; hiking, swimming, nature watching as well many diverse sports. The utility of the forests to
the Swedish citizen is quite high and is guaranteed by the legislative system.
Hunting: there are close to 300,000 registered hunters in Sweden and is an important source of
recreation and leisure tourism. Moose and deer are the main targets which has the side benefit of
controlling the population and reducing the induced damage to trees.
Sweden has nearly 100,000 lakes over 2 acres in extent26 and fishing is a major recreational activity
which appeals to the Swedish citizen as well as being an important tourist activity.
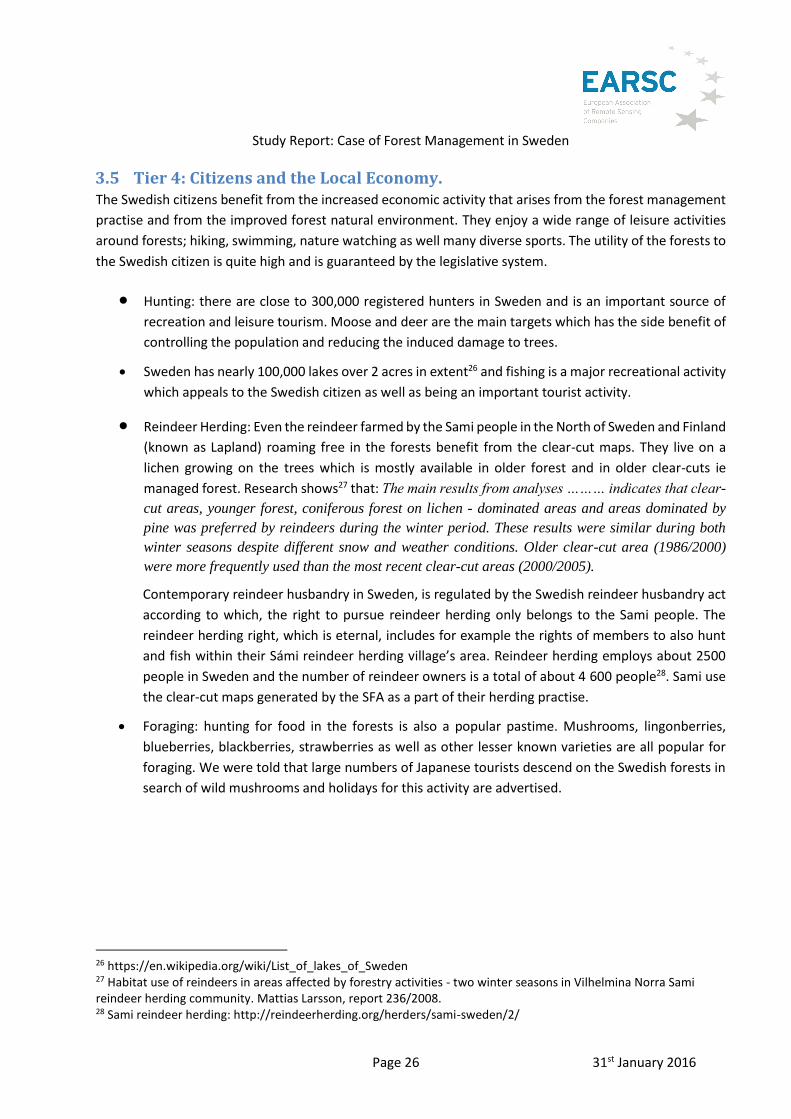
Reindeer Herding: Even the reindeer farmed by the Sami people in the North of Sweden and Finland
(known as Lapland) roaming free in the forests benefit from the clear-cut maps. They live on a
lichen growing on the trees which is mostly available in older forest and in older clear-cuts ie
managed forest. Research shows27 that: The main results from analyses ……… indicates that clear-
cut areas, younger forest, coniferous forest on lichen - dominated areas and areas dominated by
pine was preferred by reindeers during the winter period. These results were similar during both
winter seasons despite different snow and weather conditions. Older clear-cut area (1986/2000)
were more frequently used than the most recent clear-cut areas (2000/2005).
Contemporary reindeer husbandry in Sweden, is regulated by the Swedish reindeer husbandry act
according to which, the right to pursue reindeer herding only belongs to the Sami people. The
reindeer herding right, which is eternal, includes for example the rights of members to also hunt
and fish within their Sámi reindeer herding village’s area. Reindeer herding employs about 2500
people in Sweden and the number of reindeer owners is a total of about 4 600 people28. Sami use
the clear-cut maps generated by the SFA as a part of their herding practise.
Foraging: hunting for food in the forests is also a popular pastime. Mushrooms, lingonberries,
blueberries, blackberries, strawberries as well as other lesser known varieties are all popular for
foraging. We were told that large numbers of Japanese tourists descend on the Swedish forests in
search of wild mushrooms and holidays for this activity are advertised.
26 https://en.wikipedia.org/wiki/List_of_lakes_of_Sweden 27 Habitat use of reindeers in areas affected by forestry activities - two winter seasons in Vilhelmina Norra Sami reindeer herding community. Mattias Larsson, report 236/2008. 28 Sami reindeer herding: http://reindeerherding.org/herders/sami-sweden/2/

Study Report: Case of Forest Management in Sweden
Page 27 31st January 2016
Figure 3-2: Reindeer herding in N Sweden29
Tourism: Eco-tourism is a rapidly growing sector of the tourism industry. Firms are springing up
offering adventure holidays, and trekking and the widespread accessibility of forest areas is
certainly playing a part in this. According to research: “During the last decades, there has been a shift
towards a more demand driven commercial sector, including nature-based tourism, eco-tourism, adventure
tourism and a prospering outdoor retail industry. This commercialization is driven by the invention of new
outdoor recreation activities, and more equipment intensive activities and increased guiding, among others.
The Swedish market for outdoor recreation equipment almost doubled from 1.3 billion SEK in 2001 to 2.3
billion SEK 2006 and a review of the nature-base tourism supply among regional tourism organizations
identified almost 5000 nature-based products in Sweden30.”
Housing: the close proximity and relatively low cost of houses in rural forested areas is driving the
increase in purchases of second homes both by Swedish city dwellers and non-Swedes alike. We
were told, anecdotally of a surge of purchases from German and Dutch nationals. It seems that
houses built on forest land have been valued by their timber production value with little added
value for the house costs. New owners are valuing the recreation offered by the forest and hence
driving property values up. We considered including this element in our economic assessment.
29 Way-up-North.com : http://way-up-north.com/category/nature/animals/mammals/reindeers/ 30 Outdoor recreation – A necessity or a luxury? Boman, Fredman, Lundmark, Ericsson; Journal of Outdoor Recreation and Tourism 12/2013

Study Report: Case of Forest Management in Sweden
Page 28 31st January 2016
4 The use of Satellite Imagery
Satellite imagery is used for several purposes linked to forest management in Sweden:
1. Validation of forest stands: the forest industry download ortho-rectified optical images (typically
Landsat or SPOT) to verify that stands which they are about to deal in do exist. The image is linked
to the cadastral and typically a company will look at stands close to where it is currently working.
2. Storm damage: Various bodies look at imagery typically Pleiades after a storm to see where trees
are fallen and clearing should take place.
3. Clear-cutting; used by the Swedish Forest Agency as described in this case.
4. Swedish Environment Protection Agency use classifications of spruce, broad leaf, pine etc to control
or allow counties to control where parts of the forest can be protected.
For this case we chose to concentrate on the third of these; clear-cut mapping as it is the most operational
of the uses. The others are all more event or project driven whilst its use for clear-cut mapping is embedded
into the processes of the SFA.
Optical imagery is used at moderate resolution coming from SPOT or Landsat satellites. The original use of
Spot 4 data was at around 10m although Landsat data is also used at around 20m resolution. In the future,
Sentinel 2 data will be used. The short-wave infra-red channel is necessary for the monitoring. Since 1999,
imagery with full coverage of Sweden has been collected each summer see Figure 4-1.
Figure 4-1 : Complete coverage of Sweden using Optical Imagery
Study Report: Case of Forest Management in Sweden
Page 29 31st January 2016
The biggest challenge is to get cloud free coverage which requires a number of passes over several days.
For clear-cut mapping, the fact that images are taken at intervals is not so important. Sentinel 2 data will
be used as it becomes available and will help with its wider swath coverage and more frequent opportunity
for updates.
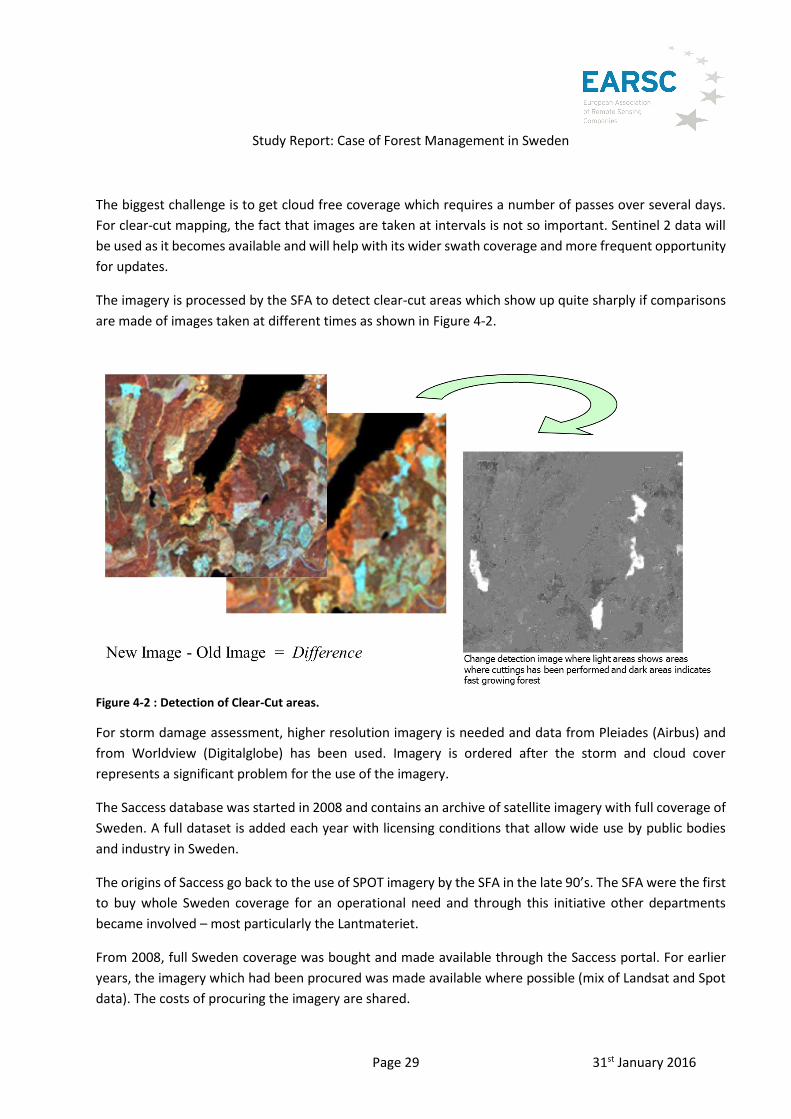
The imagery is processed by the SFA to detect clear-cut areas which show up quite sharply if comparisons
are made of images taken at different times as shown in Figure 4-2.
Figure 4-2 : Detection of Clear-Cut areas.
For storm damage assessment, higher resolution imagery is needed and data from Pleiades (Airbus) and
from Worldview (Digitalglobe) has been used. Imagery is ordered after the storm and cloud cover
represents a significant problem for the use of the imagery.
The Saccess database was started in 2008 and contains an archive of satellite imagery with full coverage of
Sweden. A full dataset is added each year with licensing conditions that allow wide use by public bodies
and industry in Sweden.
The origins of Saccess go back to the use of SPOT imagery by the SFA in the late 90’s. The SFA were the first
to buy whole Sweden coverage for an operational need and through this initiative other departments
became involved – most particularly the Lantmateriet.
From 2008, full Sweden coverage was bought and made available through the Saccess portal. For earlier
years, the imagery which had been procured was made available where possible (mix of Landsat and Spot
data). The costs of procuring the imagery are shared.

Study Report: Case of Forest Management in Sweden
Page 30 31st January 2016
Other imagery:
In our research we talked with 2 forest companies. The major use by both companies was to get a rapid
update to the forest map after severe storms. Both companies have bought high resolution imagery to 2m
or better resolution to look in more detail at storm damage.
SCA reported 4 uses of satellite imagery to support their activities:
To look for areas of potential fallen timber due to the storm. They use this to contact forest owners
in those areas to see if they can purchase the fallen timber. Linked to this are risk maps which are
generated based partly on clear-cut maps to identify where timber may be at risk of storm damage.
They will use this as a “marketing tool” to send to forest owners with the intention to be in a better
position to purchase the timber when an owners decides to sell.
Improvement of Lidar surveys. The timber companies use the Lidar survey conducted by
Lantmateriet to help improve their decision making for the purchase of timber stands. The Lidar
survey has been conducted once and could be re-conducted after 5 years. In the meantime,
satellite imagery can help improve the measurements. It is not used for the companies own forests
rather for those in which SCA could be interested to purchase.
Base mapping. The Lantmateriet provides the national map which is updated every 3 to 5 years
depending on the location. Satellite imagery is used by SCA to update the base map over specific
areas of interest.
The disposition of the clear cuts also helps SCA with their long term strategic planning in terms of
throughput through specific mills etc.
Holmen:
The main use of imagery by Holmen is after storms. They recently bought high resolution imagery (Pleiades,
2m) to map the damage after a storm in 2014. These are used to delineate the storm damage and map the
fallen timber to the land owners with a view to purchase the timber.
Both companies consider that the advent of Sentinel 2 data will increase their use of satellite imagery.

Study Report: Case of Forest Management in Sweden
Page 31 31st January 2016
5 Linking Economics to Reality
In this chapter we are trying to take the information which is derived from the satellite imagery and linking
it to the economics of the case. This will set the basis for our more detailed assessment of the economic
value in chapter 6.
So what is the value of the usage of the imagery? Before addressing that question, we first need to establish
which model we can apply measuring that value. Essentially, that value consists of two building blocks: (1)
the savings made within the value chain, in particular in the relationship between the SFA and the forest
owners (2) the down-stream gains resulting from the effectiveness of the (imagery based) SFA policy –
resulting in the much higher level of compliance – materializing in the form of increased yields of the forest
assets (quantity, quality and turn-around time).
Below we will first of all elaborate on the model that relates to the first building block of value: the so called
transaction costs model (5.1). This followed by a brief description of the second building block, which
requires less explanation.
Of course there are is also a third category of value, which is generated by the availability of the imagery
and the forest maps based thereon, as open data. These are ‘collateral values’: externalities that come in
the form of nice side benefits, as we will see in chapter 6.
5.1 The transaction costs model of governmental regulation31 What are transaction costs?
The term transaction costs is used to describe all the costs incurred in setting up, making, and maintaining
a transaction. Such transaction can be a change in property rights on a good or service but also it can be
applied to government regulation: the costs that are made, both by the government as by the business and
citizens, as a result of restrictions to the working of the market mechanism, which do not relate to
production costs.
Effects of transaction costs can be significant: they influence allocation decisions by reducing the
profitability of transactions. Some transactions which would otherwise be utility increasing may not occur
when transaction costs exist. Furthermore, they also cause a distortion of optimal allocation – that is why
it is important to keep transaction costs as low as possible – and can be seen as the consequence of the
coordination which is needed to increase regulation effectiveness.
Classifying governmental regulation transaction costs
31 The theoretical background of this part is mainly based on: TI 2009-013/3 Tinbergen Institute Discussion Paper
‘The Transaction Costs Perspective on Costs And Benefits of Government Regulation: Extending The Standard Cost
Model’, Frank A.G. den Butter, Marc de Graaf, André Nijsen, Faculty of Economics & Business Administration, VU
University Amsterdam.

Study Report: Case of Forest Management in Sweden
Page 32 31st January 2016
Transaction costs of government regulation can be split in direct or ‘hard’ transaction costs and indirect or
‘soft’ transaction costs. Hard transaction costs relate to costs that are readily perceptible and quantifiable,
such as transport charges, import levies and customs authorities’ tariffs. Soft transaction costs are much
more difficult to observe and measure. One can think of information costs, costs of communication failures,
costs associated with risks and with rules and regulation in order to reduce risks, security requirements etc.
This distinction between hard and soft transaction costs is of particular relevance for costs of government
regulation, as the hard transaction costs (and benefits) mainly relate to the direct financial costs (and
benefits like subsidies) and the soft transactions costs to the administrative burden (information
compliance costs) and substantive compliance costs (and benefits) of regulations.
The principal/agent perspective on transaction costs
The relationship between the government and the business sector in case of regulatory requirements can
be seen as a principal/agent relationship, where the regulatory authority is the principal, and the businesses
and citizens which have to comply with the regulations, are the agents. In the principal/agent (agency)
relation in the implementation of government regulation three types of costs can be distinguished which
are all part of the total transaction costs of this regulation.
a. The costs for the government itself. These are, in the principal/agent terminology, the monitoring costs. Parts of these are
administration or enforcing costs, but there are also additional costs which come with the design
of the regulatory measures. Therefore, the implementation or enforcing costs for the government
are generally considerably higher than the amounts which appear in the budget (payment of
subsidies, receipts of levies). The additional costs include salaries of the civil servants engaged in
policy preparation, implementation of regulatory measures and other monitoring activities. Costs
also relate to subsidies which are not granted, and allowances for tax exemptions. Whereas the
costs that appear explicitly in the budget can be seen as ‘hard’ transaction costs, the other costs
are more difficult to quantify and can be seen as ‘soft’ transaction costs. They may, by the way,
also appear in the budget, but implicitly.
b. The bonding costs for the citizens and businesses. These consist mainly of compliance costs. Here all compliance costs of the norm addressees as a
consequence of the government regulation should be taken into account. They are the direct
financial costs such as levies, but also capital investments and all other remaining costs needed to
meet the obligations of laws and legislation. These compliance costs also include the costs of
informing the government (sheer bonding costs).
c. The societal costs of the residual loss. These arise because the reaction of the agents to government regulation will never be in complete
agreement with the objectives of the government. The difference is the residual loss.
Principal/agents contracts should be designed in such a way that the total agency costs (monitoring
costs, bonding costs and residual loss) are minimized. It implies that agency contracts should not
Study Report: Case of Forest Management in Sweden
Page 33 31st January 2016
focus on reducing only one particular type of costs, but there should be a good balance between
all three types of costs.
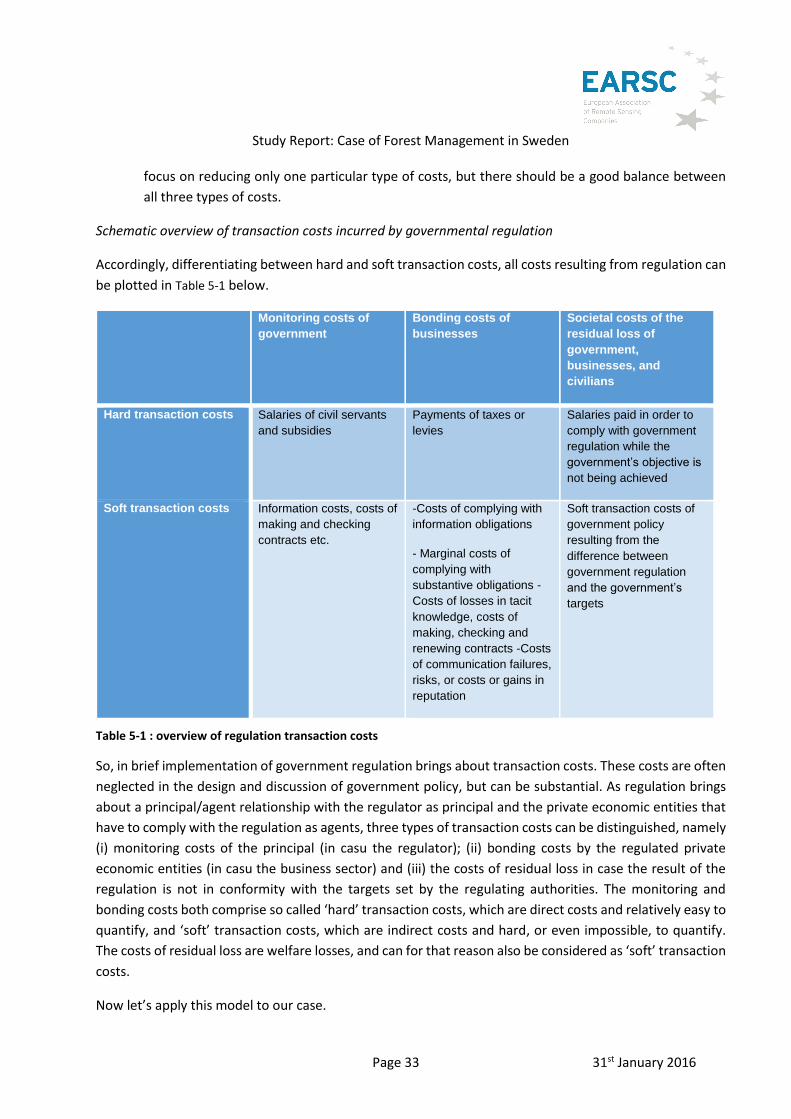
Schematic overview of transaction costs incurred by governmental regulation
Accordingly, differentiating between hard and soft transaction costs, all costs resulting from regulation can
be plotted in Table 5-1 below.
Monitoring costs of
government
Bonding costs of
businesses
Societal costs of the
residual loss of
government,
businesses, and
civilians
Hard transaction costs Salaries of civil servants
and subsidies
Payments of taxes or
levies
Salaries paid in order to
comply with government
regulation while the
government’s objective is
not being achieved
Soft transaction costs Information costs, costs of
making and checking
contracts etc.
-Costs of complying with
information obligations
- Marginal costs of
complying with
substantive obligations -
Costs of losses in tacit
knowledge, costs of
making, checking and
renewing contracts -Costs
of communication failures,
risks, or costs or gains in
reputation
Soft transaction costs of
government policy
resulting from the
difference between
government regulation
and the government’s
targets
Table 5-1 : overview of regulation transaction costs
So, in brief implementation of government regulation brings about transaction costs. These costs are often
neglected in the design and discussion of government policy, but can be substantial. As regulation brings
about a principal/agent relationship with the regulator as principal and the private economic entities that
have to comply with the regulation as agents, three types of transaction costs can be distinguished, namely
(i) monitoring costs of the principal (in casu the regulator); (ii) bonding costs by the regulated private
economic entities (in casu the business sector) and (iii) the costs of residual loss in case the result of the
regulation is not in conformity with the targets set by the regulating authorities. The monitoring and
bonding costs both comprise so called ‘hard’ transaction costs, which are direct costs and relatively easy to
quantify, and ‘soft’ transaction costs, which are indirect costs and hard, or even impossible, to quantify.
The costs of residual loss are welfare losses, and can for that reason also be considered as ‘soft’ transaction
costs.
Now let’s apply this model to our case.
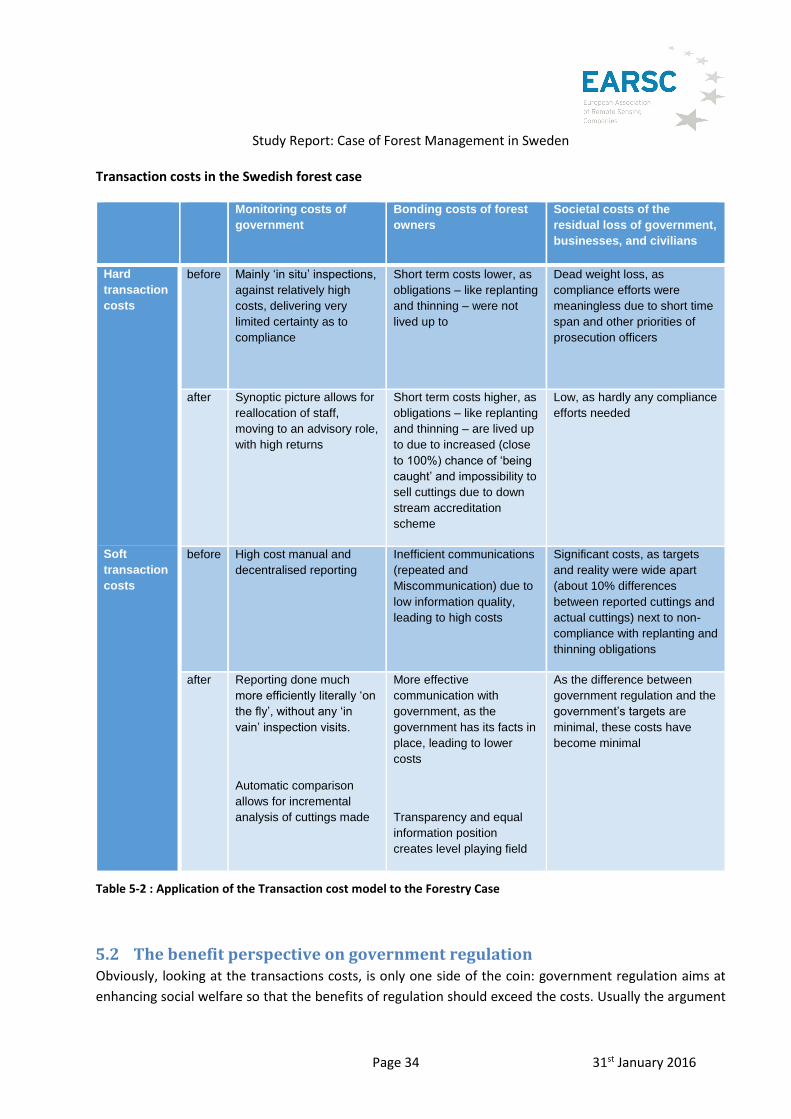
Study Report: Case of Forest Management in Sweden
Page 34 31st January 2016
Transaction costs in the Swedish forest case
Monitoring costs of
government
Bonding costs of forest
owners
Societal costs of the
residual loss of government,
businesses, and civilians
Hard
transaction
costs
before Mainly ‘in situ’ inspections,
against relatively high
costs, delivering very
limited certainty as to
compliance
Short term costs lower, as
obligations – like replanting
and thinning – were not
lived up to
Dead weight loss, as
compliance efforts were
meaningless due to short time
span and other priorities of
prosecution officers
after Synoptic picture allows for
reallocation of staff,
moving to an advisory role,
with high returns
Short term costs higher, as
obligations – like replanting
and thinning – are lived up
to due to increased (close
to 100%) chance of ‘being
caught’ and impossibility to
sell cuttings due to down
stream accreditation
scheme
Low, as hardly any compliance
efforts needed
Soft
transaction
costs
before High cost manual and
decentralised reporting
Inefficient communications
(repeated and
Miscommunication) due to
low information quality,
leading to high costs
Significant costs, as targets
and reality were wide apart
(about 10% differences
between reported cuttings and
actual cuttings) next to non-
compliance with replanting and
thinning obligations
after Reporting done much
more efficiently literally ‘on
the fly’, without any ‘in
vain’ inspection visits.
Automatic comparison
allows for incremental
analysis of cuttings made
More effective
communication with
government, as the
government has its facts in
place, leading to lower
costs
Transparency and equal
information position
creates level playing field
As the difference between
government regulation and the
government’s targets are
minimal, these costs have
become minimal
Table 5-2 : Application of the Transaction cost model to the Forestry Case
5.2 The benefit perspective on government regulation Obviously, looking at the transactions costs, is only one side of the coin: government regulation aims at
enhancing social welfare so that the benefits of regulation should exceed the costs. Usually the argument

Study Report: Case of Forest Management in Sweden
Page 35 31st January 2016
for government regulation is to repair market failure. The problem here is of course that benefits are always
harder to measure than costs. Benefits, frequently, are not always directly visible and often relate to long
term benefits for society, whereas costs are more tangible, and are borne by specific stakeholders: the
forest owners (possibly passing it on downstream).
The obligation to comply with the regulatory standards – the size of the plot to be cleared, the compulsory
replanting and thinning - does not bring any short term benefits for the owners. However, they are set by
the government in order to prevent negative external effects, which would otherwise be harmful to society,
and in an indirect way, also for the business sector.
Benefits of government regulation for the forest owners
Government regulation may, in spite of the costs involved, bring benefits to the business sector, as it may
enhance positive externalities and reduce negative externalities. The benefits brought about by the usage
of the satellite data in the monitoring of compliance are paramount:
1. Enhancing long term profitability by defying perverse short term behaviour 2. Strengthening economic structure of the sector through shake out of cheating players 3. Enhancement of reputation and competitiveness of the Swedish timber sector
Benefits of government regulation for society
The most obvious benefits of government regulation are to be found with the society, as the main argument
for regulation is to internalize external effects. Clear benefits are:
1. Better quality of life due to environmental richness 2. Better quality (timber based) products for consumers 3. Higher returns of the sector lead to positive macro-economic effects and tax returns
The availability and usage of the satellite imagery by the SFA has created an intrinsic motivation to comply
with the regulation as opposed to the previous ‘compliance model’ which was much more driven by
extrinsic motivation through strict monitoring and possible sanctions, which in practice were both
ineffective and non-deterrent.
So far so good. Let us now apply these more theoretical observations to the actual case, allowing us to put
a price tag on the cost savings and the other benefits brought about by the usage of the imagery. As we
shall see in the next chapter, they are substantial!

Study Report: Case of Forest Management in Sweden
Page 36 31st January 2016
6 The Economic Assessment
In this chapter we bring together the information of the previous chapters to analyse the economic benefit
arising from the use of the satellite imagery. It is divided into 2 parts; the core of the value chain where the
direct benefit of the clear-cut mapping is realised and then the collateral benefits arising through the use
of the clear-cut maps by others. In addition, we consider some implications of the non-economic benefits
which, although difficult to value, can be considered relevant.
6.1 The Core Value Chain – Direct Economic Benefits In essence the availability of the imagery has allowed for a diametrical change in forest management by
the SFA, more particularly the compliance model applied. Breaking the rules – previously amounting to
around 10% of all clear-cuts – does no longer make sense: the SFA will notice and, consequently, the value
of the illegally cut timber will be close to zero as no professional buyer (the timber mills and companies)
will be willing to take such risk.
This fact of life – effectively pushing forest owners to comply and do the right thing – triggers another set
of benefits: replanting and pre-commercial thinning is (largely) done in accordance with the rules, which
are based on optimizing long term returns of the forest assets, in the end bringing more value to the forest
owners, the Swedish timber sector as a whole and, at macroeconomic level, enhanced competitive power
and, ultimately at higher tax incomes for the Swedish Treasury.
Assessing the first category of benefits we will rely on the theory of the transaction costs we described in
the previous chapter, seeking to assess the decrease thereof resulting from the availability of the imagery
by comparing the results thereof (the high level of compliance) with the situation that the same results
were to be achieved, without having the imagery.
The second category can be assessed fairly straight forward: the enhanced compliance leads to long term
higher returns as the yields of the forest assets increase.
6.1.1 Benefits to the Swedish Forest Agency
The SFA has organisational benefits through the use of the satellite data. How much is this worth?
When the imagery was first introduced in 1998/2000, whilst the practises of the SFA changed, it is felt that
this did not yield any direct savings. What it did do was to underpin the new legislative environment and
make the light regulation possible. One way to calculate the benefit is to assess how much it would have
cost the SFA to achieve the same level of compliance if it would not have had the imagery at its disposal.
Put differently: what costs would have been incurred if the SFA would have sought to reach the results that
have been achieved based on the availability of the imagery?
Based on our discussions with the SFA and its stakeholders and our subsequent analysis, we have identified
3 ways in which an equivalent situation could have been achieved:
Study Report: Case of Forest Management in Sweden
Page 37 31st January 2016
(a) The SFA could have employed enough staff to inspect all the notified clear-cut areas directly (ie
boots in the forest). This is complicated by the lack of knowledge as to when cutting has taken place
meaning that some forests would need to be inspected several times.
Taking the current mean figure of 55,000 notifications received yearly by the SFA and assuming
that 1 member of staff can make 2 inspections per day and works a 200 day year out of the office
(ie an assumption that 10% of the inspectors time would be in the office), then we arrive at a total
number of 137 inspectors being required and a total cost of around €11m per annum. This could
be reduced by only inspecting the notifications from private, non-company forest owners but
would also be increased to account for the need to inspect each plot more than once.
(b) The imagery could have been obtained by using aircraft. The Lantmateriet organise aircraft surveys
over Sweden collecting imagery. Each year they image around 1/3rd of the country with some areas
being covered twice such that the whole-country, aerial, photogrammetry mapping is updated
once every 4 to 5 years. The cost each year is around €3m including the processing costs so a whole
country image each year would cost around €9m.
(c) Thirdly – this was suggested during one of the interviews we had - the SFA could rely on an
alternative system based on permits to clear rather than the simple notifications. The cost to
process such a permit would be similar to that if permission is being sought to build a house.
The cost of a housing permit in Sweden is about €4000 which we assume is set at a level to cover
the administrative costs of processing the building application. Applying this same figure to the
55,000 notifications would yield a cost of €220m! Clearly this would not be good for the industry
and we can safely assume that such a regime would not be implemented.
Hence taking the first two ways as reasonable estimates of the costs that the SFA would have had to incur
to reach an equivalent information position that would allow for the same level of compliance suggests an
annual benefit of some €10m, resulting from the availability of the imagery.32
Obviously, the costs associated with the acquisition and use of the imagery need to be deducted from this
€10m. According to estimates from the SFA, preparing the clear-cut maps, around €450k was spent each
year to purchase the satellite imagery. On top of that, processing the imagery into the clear-cut maps is
estimated to require 5 man days for each region of the SFA. There are 32 regions and hence at the day rate
of €400 which we are using, this yields a total labour cost to SFA of €64k.
So the total costs for the SFA relying on the imagery amount to a little over € 0.5m. Interestingly, this cost
will fall to a much lower figure in the future as Sentinel 2 data is used which will be free of charge; only
32 Of course it would have been the question whether, given such level of resources needed, the Swedish government would have been prepared to allocate such an amount to this policy objective, but that is beside the point: what we are doing is trying to put a price tag on the fact that these policy objectives can be met now and compare that with the scenario that the Swedish government would have decided that these objectives were to be met, whatever the resources needed.

Study Report: Case of Forest Management in Sweden
Page 38 31st January 2016
additional, high-resolution imagery would need to be paid for. This is brings us to an estimate of a net
benefit of around €9.5m for the SFA.
6.1.2 Tier 3: The Private Forest Owners
Now that we have identified the drop in transaction costs, let’s look at the second effect of the availability
of the imagery: the higher long term returns from the forest assets.
As we said above, private persons owning forests face a dilemma: minimizing the costs in the short term
versus maximizing returns in the long run. Replanting and pre-commercial thinning lead to costs which will
not be incurred if the owner fails to undertake these actions. Then again, the yields from the commercial
thinning’s and the final clear-cut will be significantly lower, next to taking longer to accrue. Since the
availability of the imagery, the SFA is perfectly capable of identifying whether replanting and pre-
commercial thinning is actually done in accordance with the rules set, which, ultimately lead to highest
returns.
Based on Swedish statistics we can put a fairly concise price tag on the financial value of this behavioural
change of the private forest owners, by comparing the returns of the forest owners in the situation of
compliance versus the situation of non-compliance.
Sweden has around 23m hectares of managed forest land. Around 1.25% of this is harvested each year
(mean cycle of 80 years) meaning that the total area of forest which is cleared in any one year is about 280k
hectares. Improved management practise is increasing the stock of timber and its value to the forest
owners. The data we have used to calculate the benefits comes from a reference study33 into the impact of
pre-commercial thinning on the forest timber yield. It compares (through a simulation) the difference in
yield between none, one or two pre-commercial thinning’s.
Tables 6-1 through 6-3 show the per hectare forest yield under the conditions of no pre-commercial
thinning, 1 thinning and 2 thinning’s.
In all situations, the planting costs are the same at €500 per hectare. In each case, thinning’s with a
commercial yield take place after 30 years and 55 years and the final clearing takes place after 80 years.
The timber volume refers to wood and does not include pulp which is produced in addition. The value of
the pulp is included in the total value used in the calculation.
The summary of the results is shown in Figure 6-1. Skr have been converted to Euro at the rate of 10:1.
33 ”Rosvall, O., Bergström, R., Jacobson, S., Pettersson, F., Rosén, K., Thor, M., Weslien, Jan-Olov. 2004. Increased production in the family forestry (in Swedish). Report no 574

Study Report: Case of Forest Management in Sweden
Page 39 31st January 2016
With no pre-commercial
thinning
Timber
Volume
(m3)
Cost
(€)
Value
(€)
Net
Value
(€)
T0 - Planting 0 500 (500)
T0+10 - Pre-commercial thinning 0 0 0 0
T0+30 First thinning after 30 years 54 1250 580 (670)
T0+55 Second thinning after 55 years 101 1150 2270 1120
T0+80 Final clear-cut 364 2320 10700 8380
Total 519 8380
Per annum over 80 year average cycle 104
Table 6-1 : Per hectare yield (no pre-commercial thinning)
With 1 pre-commercial thinning Timber
Volume
(m3)
Cost
(€)
Value (€) Net
Value (€)
T0 - Planting 0 500 (500)
T0+10 - Pre-commercial thinning 0 220 0 (220)
T0+30 First thinning after 30 years 48 910 760 (150)
T0+55 Second thinning after 55 years 106 950 2920 1970
T0+80 Final clear-cut 367 1980 13790 11810
Total 521 12880
Per annum over 80 year average cycle 161
Table 6-2 : Per hectare yield (1 pre-commercial thinning)
With 2 pre-commercial
thinning’s
Timber
Volume
(m3)
Cost
(€)
Value
(€)
Net Value
(€)
T0 - Planting 0 500 (500)
T0+10 - Pre-commercial thinning 0 130 (130)
T0+30 First thinning after 30 years 39 130 690 (130)
T0+55 Second thinning after 55 years 99 810 3110 2300
T0+80 Final clear-cut 349 1770 15200 13430
Total 487 15060
Per annum over 80 year average cycle 188
Table 6-3 : Per hectare yield (2 pre-commercial thinning’s)

Study Report: Case of Forest Management in Sweden
Page 40 31st January 2016
Figure 6-1 : Value of Forest (€ per hectare) with age and pre-commercial thinning
Figure 6-1 shows the cumulative value of the harvest or the cost of the operation at each point in the forest
life-cycle. The benefit of 1 or 2 pre-commercial thinning’s is clear. However for the landowner, there is a
shorter term outlay where the benefit is not seen for more than 80 years. Each generation of forest owner
will see at most one final harvest on his land.
These figures nicely underpin the dilemma: there is a strong incentive for the forest owner, to play a short
term game. He cuts the forest, sells the timber and then leaves it fallow so avoiding further investment
costs. The replanting, for instance, costs €250 per hectare. But each one year delay in replanting, is one
year’s production lost from that land ie €160 per hectare - but only realised after 80 years.
Similarly, the cost of pre-commercial thinning is a further €220 and €480 to reach the full benefit. So an
upfront cost of €730 is required for a return of some €5000 but 80 years in the future34. No wonder that
some individual owners delay this investment. Yet the cumulative loss to the Swedish nation is great hence
there is a divergent interest for the forest owner to delay investment in replanting and in early thinning
whilst for the state there is a strong interest for him to invest early and maximise the national resources.
The interplay between the light legislation and the counselling role of the SFA is where the satellite imagery
has its greatest impact. In 2012, the SFA sent letters out to nearly 70,000 forest owner reminding them of
34 This value is not discounted to calculate an NPV since we are in the end comparing the case of with and without imagery. Furthermore, the land is harvested each year and hence is a continuous cycle.

Study Report: Case of Forest Management in Sweden
Page 41 31st January 2016
the advantages to perform a pre-commercial thinning of recently replanted forest land35. This was
considered to have an impact such that 10,000ha (3.5% of the annual cleared forest) were cleaned as a
direct result of the letter. The total mailing cost was estimated at €350k.
The letters were only sent in 4 counties of Sweden. Not all the forest owners were identified as having
forest which needed attention. Mostly they were contacted because their land was affected by a severe
storm in 2005. In future a more targeted effort will be conducted using the information coming from the
satellite imagery and it will be extended to cover the whole of Sweden. Based on this the impact for the
whole of Sweden we take as being around 10%.
However, these are only the visible effects of the letter and the total impact on owners from knowing that
the SFA have direct information on their forest will be much greater. It is an objective of the SFA to
encourage the owners to become more self-policing in this respect by producing and publishing the
updated clear-cut maps on a more regular basis – so shortening the time between actual clearing and
seeing the evidence in the maps. Considering this, we take a figure of 20% as a more likely measure of the
amount of forest land impacted each year.
As we know, 280,000 ha are cleared each year but we do not have a figure for how much forest land is
replanted or pre-commercially thinned each year. Hence, in Table 6-4 below, we calculate the impact for
between 10% and 20% of the forest land being managed better ie replanted or thinned each year.
Value Gain 10% 20%
Replanting €104 €104 €3,073k €6,146k
1st Pre-commercial thinning €161 €57 €1,670k €3,340k
2nd pre-commercial thinning €188 €84 €0,765k €1,530k
Table 6-4 : Total additional revenue (€k) from following each best practise.
The table shows the annual gain36 if 10% or 20% of the privately-owned forest is managed following the
practise defined (replanting or 1 or 2 pre-commercial thinning’s) that would not have been the case if they
knew that the SFA was unable to monitor them. So if 10% replant without delay, this yields an annual gain
of €3,073k. If 10% also perform a 1st pre-commercial thinning then the gain increases to €4,743k
(€3,073+€1,670). If they also perform a 2nd pre-commercial thinning then the gain becomes €5,508k.
6.1.3 Tier 3: The Forest Companies
The forest companies benefit from the “Swedish Model” in 2 ways:
35 Swedish Forest Agency. 2013. Internal report. Effekter på röjningsaktiviteten av riktad rådgivning via brev till skogsägare med röjningsbehov. Influence on pre-commercial thinning activity based on written advice to forest owners with remotely-sensed identified needs for pre-commercial thinning. PM-2013-02-04. 36 The gain is per hectare, per year taken from the tables 6-1 to 6-3. The gain for 1st pre-commercial thinning is calculated by the difference between per hectare yield in tables 6-1 and 6-2 and divided by 80 years.
Study Report: Case of Forest Management in Sweden
Page 42 31st January 2016
1. The steadily increasing volume and quality of timber is increasing their market. As is shown in Figure
2-7, the volume of timber is increasing each year. Not shown is that also the quality is getting higher
through higher yields of timber from the same volume and hence the overall value is increasing.
So, whilst the increase is being driven by the family forest owners, the timber industry which
purchases from them also benefits significantly from their application of best practise methods.
2. The light legislation reduces the costs to the industry and improves competitiveness. In 6.1.1 (c),
we looked at the cost of an alternative controlling method for the industry concluding that it was
too high to be realistic. Nevertheless, if such a legislative environment were to be imposed, costs
to the industry would run at some €200m to €400m per annum over and above those which are
borne today. It is clear that the extra costs would be passed down the value chain to consumers in
Sweden and elsewhere making the Swedish industry less competitive relative to other timber
producing countries.
We wanted to try to get a measure of how much this is worth to the industry and spoke with the Swedish
Forest Industries Federation37. Skogs Industriana has an economist in the team dealing with facts and
figures who was unaware of any figures which could show either the elasticity of timber sales ie the
sensitivity of sales to changes in price, nor figures which could show the relative performance of exports
from Sweden and other countries. Whilst the latter could be examined (although historical figures do not
seem to be readily available), the cost base driven by legislation is only one of many factors which affect
the export competitiveness of the industry. Currency changes, the pattern of ownership, national
certification schemes (sustainable production), environmental factors and the importance with which they
are considered all play a part in determining competitiveness. This analysis has not been done and would
require a major effort to untangle the various factors. Hence we are left with the knowledge that the forest
industry is benefiting from the light regulatory environment but we cannot assess this quantitatively.
Of course one could argue that, provided there is sufficient competition on the Swedish wholesale market
for timber, these benefits would be (partly) pushed even further downstream and materialize in the form
of higher value-for-money products which will (a) generate more happy Swedish consumers on the
domestic market - also because they can spend the money they save elsewhere - and (b) higher exports
of Swedish products based on timber. However, apart from the question whether this can be really
calculated – there are lots of other factors impacting industry success! – this would leave us with the
question whether how far these benefits are passed on downstream. We found that introducing such
large uncertainties would weaken the case, so these are not accounted for in this study.
6.1.4 Tier 4: Citizens and the Local Economy
The citizens benefit from the forests in many ways; we have seen some of them in chapter 4 but placing an
economic value on this is rather difficult. In this respect we should concentrate on the ecotourism industry
37 Skogs Industriana. http://www.forestindustries.se/

Study Report: Case of Forest Management in Sweden
Page 43 31st January 2016
where the natural environment plays a strong role and the increase in housing values. Within the scope of
the study we have been unable to investigate these elements further.
We could make a thought experiment (as we did in the Baltic Ice Navigation case38) to assess how much
Swedish citizens would be prepared to pay for the utility of access to the forests? If each would pay €1 p.a
the value would be €9.6m. In all likelihood, this utility is worth much more as we see that forest access
plays a very strong part in leisure activities, but the difficulty for us is to assess the marginal value coming
from the additional utility derived from the satellite imagery and the clear-cut mapping since the forest
would exist but the quality and the extent would be reduced.
Let’s nevertheless, play with some numbers. So, how much would each Swedish citizen be prepared to pay
to ensure that the forests remain available for their leisure activities? Certainly €10 per annum, most
probably €100 pa, possibly even €1000 each year. Marc, one of the authors, pays a subscription of €20 per
annum to help maintain open public land in the Netherlands. If we take this value and make the assumption
that the legislative regime contributes 10% of the value and that the satellite imagery contributes 5% of
this, we end up with the value of €0.1 per annum per citizen or just about €1m per annum in total.
We are conscious that this methodology is quite rough and that the numbers are not so very reliable. A
much more detailed survey would be needed on the value placed by Swedish citizens on the forests. It only
applies where the value being created comes from a public utility and we can make no attempt to look at
the way this value is collected (in most cases it will be through taxation and paid for out of unattributed
government finances). But it does provide an additional tool to consider the value which is being created
and hence we consider it a useful extension to the general approach, providing in doing so, it does not
dominate more direct assessments of value. In this case, it represents around €1m of value compared to
the base assessment of around €15m, ie around 7%.
6.2 The Collateral Benefits Being made available as open data, the clear-cut maps are used not just by the SFA but also by other players
both public and private. As introduced in chapter 4, the clear cut maps are made available as open data to
be used not just by SFA but also by other players both public and private. This activates some "parallel value
chains" bringing additional "collateral benefits". The value of such benefits could not be evaluated in the
frame of the current activity however we found it beneficial to describe and assess some of these benefits
although in a rather anecdotal way.
Other public bodies in Sweden are making use of the information provided by the SFA. The SEPA, SWAM,
SMHI use the information to support their activities as do the County Boards. In the course of the study we
talked with both agencies plus one County Board (Gavleborg).
38 Copernicus Sentinel’s Products Economic Value: A case study of Winter Navigation in the Baltic, EARSC and The Greenland, September 2015.: http://earsc.org/library/

Study Report: Case of Forest Management in Sweden
Page 44 31st January 2016
For the County Board, it is estimated that the use of the clear cut maps saves a few days each year through
making it easier to identify where nature reserves may be implicated or where a new protected area should
be designated.
The officer will need to go and make field inspections when a notification risks infringing a sensitive area.
If the biodiversity has already been compromised through an earlier clear-cut then there is no need to go
and perform an inspection. Some 2 or 3 inspections may be saved each year which translates into 2 or 3
days of work. Further time is saved on the other tasks through having the up-to-date maps of the forests
and, overall some 5 to 8 days could be saved each year. The updated maps also provide reassurance that
the latest picture is available to inform the decision making. No specific value can be attached to this
reassurance but it is a soft benefit. Further savings are made after storms when more precise knowledge is
required of where to look for damage.
Overall, the use of the clear-cut maps (or shape files) will save the CB around 10 days per year. If we assume
a daily cost of employment of €400 then the Gavleborg County is saving approx €4k per annum through
the use of the SFA data. Scaling this through the 21 CB’s gives a total saving of around €80k per annum.
The clear-cut maps are available as open data and as such are used by EO service providers such as Metria,
Spacemetric and Cartesia as data to support other work. We discussed this with Metria who serve several
commercial customers:
power companies to assess and monitor sediment build up in reservoirs
electricity distribution to monitor risk of trees falling on power lines
telecommunication companies for propagation models to support network design
water companies on water quality (leaching)
SMHI39 also on water quality due to soil leaching which occurs more heavily in felled areas.
In all cases, the clear cut data is used along with other Geographic Information layers.
The value of these is not available and in any case the clear-cut layer is only a small portion. In our
assessment we assign a total economic value of €50k for this re-use of the clear cut layers although in terms
of business for the service providers the value will be much higher. We have no information on the value
of the products to the end user companies which would require further study to establish.
No specific information on the savings made by other organisations is available to us at this time.
We also learned that some citizens are benefiting from the use of the clear-cut maps. Specifically cited were
the Sami people which use it to support their planning for the herding and pasturing of their reindeer and
the Japanese mushroom pickers coming to Sweden to forage in the autumn.
39 Swedish Meteorological and Hydrological Institute, http://www.smhi.se/en
Study Report: Case of Forest Management in Sweden
Page 45 31st January 2016
6.3 Non-Economic Impacts There are also many benefits arising which are not directly economic ones.
The creation of the Saccess image archive has enabled new users to access satellite data. The value of
Saccess has not been evaluated but it is considered to be a significant success in Sweden which is directly
due to the take up of the imagery by SFA after the Enforma project in the 1990’s. The image archive is being
extended in co-operation with Denmark.
A second non-economic benefit is coming from the improved inter-agency co-operation. It is an effect
which we have noted in other examples of the use of EO products. It seems to arise because of the wide-
ranging nature of the imagery and derived maps which cover many geographical regions and hence expose
features which would otherwise rest dormant.
Here we have the example of the County Boards and the SEPA working together to identify areas of land
which should be protected for environmental reasons. The availability of the clear-cut map generated by a
third agency becomes the cohesive factor which helps all three exchange for the benefit of each one. Very
difficult to place a value on, this effect has wide ranging benefits if different parts of the public sector are
able to communicate better and even establish a common language to do so.
6.4 Total Economic Return Taking the totals calculated at each step we find a total direct economic benefit of €16.0m to €21.5m per
annum. Part of this is coming from the assumption about achieving an equivalence of information and the
second part through the benefit to family forest owners of increasing their assets by replanting earlier than
they would otherwise do. The summary is shown below.

Study Report: Case of Forest Management in Sweden
Page 46 31st January 2016
Total Core Value
SFA Establish Information Equivalence €10.0m
Cost of preparing clear-cut maps (0.5m)
Private Owners Percentage of land affected 10% 20%
Benefit from Earlier replanting €3.07m €6.14m
Benefit of 1st pre-commercial thinning €1.67m €3.34m
Benefit of 2nd pre-commercial thinning €0.76m €1.53m
Forest Companies TBC
Citizens €1m
Total Direct €16.0m €21.5m
Total Collateral Benefit
County Boards €80k
EO Service providers €50k
SEPA, SMHI, SWAM TBC
NGO’s TBC
Spin-off from SACCESS TBC
Total Collateral Value €130k
Table 6-5 : Summary of the Economic Value
The total economic benefit of around €16.1m per annum compares with a cost of production of just €500k
which is a cost benefit ratio of over 32:1.
In addition to the direct return we have found a significant re-use of the clear-cut maps through an open
data policy. Both private sector and public sector organisations benefit and through our limited
examination of this effect we find an indirect benefit of €130k. This is surely an under-estimate but even
so gives a net cost-benefit ratio of 2:1 (noting that the use of open data is not strictly costed since it is
justified by other public sector action and responsibility).
Study Report: Case of Forest Management in Sweden
Page 47 31st January 2016
7 Summary of Findings
7.1 General Approach and Methodology
This study introduces a new approach to evaluating the economic benefit coming from the use of satellite
imagery. Our approach is to trace the impact coming from a single product generated using satellite
imagery through a value chain. Consequently, defining the value chain and how the information being used
flows through it is at the heart of our methodology.
Once we have a detailed understanding of who is using the products, through a series of interviews we
develop our understanding of how their processes are changed by the imagery and derived products. This
then leads to an economic assessment of the value which is being generated. This can be quite different
for each situation as we have seen for the first case40 of Winter Navigation in the Baltic.
In this instance we focus on the application to forest management in Sweden but it has the potential to be
extended into other countries with Boreal forests and similar legislation to that in Sweden. Having said that,
we learned that even in Finland, the legislative environment and the agency set-up differs from that in
Sweden so modifications to the methodology would be required even in this case of a close neighbour.
7.2 Economic Benefit to Forest Management in Sweden
The economic benefits have been assessed based on the transaction costs associated with government
regulation. Since forestry is a strategic industry in Sweden the legislation covering it has a significant
economic effect. We do not try to assess this broader issue but to focus on the role that the satellite imagery
is having.
In this respect, it allows the responsible agency, the SFA, to gather country-wide information on a
systematic basis. The availability of satellite data in the late ‘90’s came at exactly the right time for Sweden
since the legislation had been changed just a few years earlier (in 1994) to move from a controlling regime
to one which was much lighter and placing greater responsibility in the hands of the forest owners.
The arrival of the imagery and its integration into the SFA process, ensured that action could be taken when
it was felt necessary. The imagery showed that action was required given the large amount of illegal cutting
and the clear-cut product generated by the SFA showed the owners that their action (or inaction) could be
detected.
The result leads to a significant economic benefit of between €16.1m to €21.6m per annum.
40 Copernicus Sentinel’s Products Economic Value: A case study of Winter Navigation in the Baltic, EARSC and The Greenland, September 2015.

Study Report: Case of Forest Management in Sweden
Page 48 31st January 2016
7.3 The Impact of the Imagery
The imagery makes the detection of illegal activity possible but also to see where owners are not following
what would be considered as “best practise”. This includes the replanting of the land within 3 years (which
is a legal requirement) and the application of pre-commercial thinning (either once or twice) which
significantly improves the timber yield and hence value.
Without the satellite information, we consider that the SFA would have needed to take find alternative
means to gather the knowledge on the forests which would have cost much more. Consequently, the use
of the imagery reduces the transaction costs for the government agency and hence the legislative cost on
the industry.
It also has the benefit of providing common information which other agencies can use and hence which
improves communication and inter-agency co-operation.
7.4 Conclusions The use of the satellite imagery by the SFA to generate clear-cut maps has been shown to have considerable
benefit to the Swedish economy. As for the first case in this series, in carrying out the study we have found
several areas where a deeper assessment would, in our opinion, lead to exposing larger benefits. However,
due to the overall limitations we are not able to develop these lines of analysis:
The benefit to the timber companies coming from the increased competitiveness as a result of the
light legislation and the dramatic fall in transaction costs (as explained in chapter 5) at the side of
suppliers on the wholesale market for timber41.
The collateral benefit coming from the use by other government departments (for example the
Swedish agency for marine and water management), by NGO’s and by industry.
The benefit to the individual citizens coming from enhanced leisure possibilities from a better
managed forest environment.
Nevertheless, the benefit we have assessed is significant and already several times higher than was
envisaged at the start of the project.
41 We noted that, it will be likely that provided there is sufficient competition on this market, these benefits will be pushed on (partly) downstream
and materialize in the form of higher value for money products which will (a) generate more happy Swedish consumers on the domestic market,
also because they can spend the money they safe elsewhere and (b) higher exports of Swedish products based on timber.

Study Report: Case of Forest Management in Sweden
Page 49 31st January 2016
Annex 1: Sources
Sources used in the main text of this report
Copernicus Sentinel’s Products Economic Value: A case study of Winter Navigation in the Baltic, EARSC
and The Greenland, September 2015.
Council Directive 92/43/EEC of 21 May 1992 on the conservation of natural habitats and of wild fauna and
flora.
Directive 2000/60/EC of the European Parliament and of the Council of 23 October 2000 establishing a
framework for Community action in the field of water policy.
EU Regulation No 995/2010 of the European Parliament and of the Council of 20 October 2010 laying
down the obligations of operators who place timber and timber products on the market Text with EEA
relevance
Forest and Forestry in Sweden; Royal Swedish Academy of Agriculture and Forestry, August 2015.
GAF / Ecorys, Cost Benefit Analysis of GSE Forests Service Analysis, Report for ESA-ESRIN, 2004.
Habitat use of reindeers in areas affected by forestry activities - two winter seasons in Vilhelmina Norra
Sami reindeer herding community. Mattias Larsson, report 236/2008.
Increased production in the family forestry (in Swedish), Rosvall, O., Bergström, R., Jacobson, S.,
Pettersson, F., Rosén, K., Thor, M., Weslien, Jan-Olov.; 2004, Report no 574.
Increasing Challenges with the Swedish Forestry Model http://governmentgazette.eu/?p=5756
Nordic Family Forestry: http://www.nordicforestry.org/facts/Sweden.asp#Sju
Outdoor recreation – A necessity or a luxury? Boman, Fredman, Lundmark, Ericsson; Journal of Outdoor
Recreation and Tourism 12/2013
Sami reindeer herding: http://reindeerherding.org/herders/sami-sweden/2/
Way-up-North.com : http://way-up-north.com/category/nature/animals/mammals/reindeers/
Swedish Forest Agency Statistics: http://www.skogsstyrelsen.se/en/AUTHORITY/Statistics/
Swedish Forest Agency Internal report: Effekter på röjningsaktiviteten av riktad rådgivning via brev till
skogsägare med röjningsbehov. Influence on pre-commercial thinning activity based on written advice to

Study Report: Case of Forest Management in Sweden
Page 50 31st January 2016
forest owners with remotely-sensed identified needs for pre-commercial thinning, Swedish Forest
Agency, 2013, PM-2013-02-04.
Swedish Forestry Model; Åke Barklund, Royal Swedish Academy of Agriculture and Forestry, 2009.
Swedish Forest Sector Outlook Study; UN Economic Commission for Europe; 2011.
Tinbergen Institute Discussion Paper ‘The Transaction Costs Perspective on Costs And Benefits of
Government Regulation: Extending The Standard Cost Model’, Frank A.G. den Butter, Marc de Graaf,
André Nijsen, Faculty of Economics & Business Administration, VU University Amsterdam, TI 2009-013/3.
Way-up-North.com : http://way-up-north.com/category/nature/animals/mammals/reindeers/

Study Report: Case of Forest Management in Sweden
Page 51 31st January 2016
Annex 2: List of abbreviations
C(S)EVS - Copernicus (Sentinels’) Economic Value Study
EARSC – European Association of Remote Sensing Companies
EOCA - European Outdoor Conservation Association
ESA – European Space Agency
FSC - Forest Stewardship Council
PEFC - Programme for the Endorsement of Forest Certification
SEPA - Swedish Environmental Protection Agency
SFA – Swedish Forest Agency / Skogsstyrelsen
SMHI - Swedish Meteorological and Hydrological Institute
SSNC - Swedish Society for Nature Conservation
SwAM - Swedish Agency for Marine and Water Management
WWF - World Wildlife Fund


