University of Nebraska - Lincoln DigitalCommons@University of Nebraska - Lincoln Architectural Engineering -- Faculty Publications Architectural Engineering 2017 A Case Study of Upper-Room UVGI in Densely- Occupied Elementary Classrooms by Real-Time Fluorescent Bioaerosol Measurements Chunxiao Su University of Nebraska-Lincoln, [email protected]Josephine Lau University of Nebraska-Lincoln, [email protected]Fang Yu University of Nebraska Medical Center, [email protected]Follow this and additional works at: hp://digitalcommons.unl.edu/archengfacpub Part of the Architectural Engineering Commons , Construction Engineering Commons , Environmental Design Commons , and the Other Engineering Commons is Article is brought to you for free and open access by the Architectural Engineering at DigitalCommons@University of Nebraska - Lincoln. It has been accepted for inclusion in Architectural Engineering -- Faculty Publications by an authorized administrator of DigitalCommons@University of Nebraska - Lincoln. Su, Chunxiao; Lau, Josephine; and Yu, Fang, "A Case Study of Upper-Room UVGI in Densely-Occupied Elementary Classrooms by Real-Time Fluorescent Bioaerosol Measurements" (2017). Architectural Engineering -- Faculty Publications. 102. hp://digitalcommons.unl.edu/archengfacpub/102
Transcript
University of Nebraska - LincolnDigitalCommons@University of Nebraska - Lincoln
A Case Study of Upper-Room UVGI in Densely-Occupied Elementary Classrooms by Real-TimeFluorescent Bioaerosol MeasurementsChunxiao SuUniversity of Nebraska-Lincoln, [email protected]
Follow this and additional works at: http://digitalcommons.unl.edu/archengfacpub
Part of the Architectural Engineering Commons, Construction Engineering Commons,Environmental Design Commons, and the Other Engineering Commons
This Article is brought to you for free and open access by the Architectural Engineering at DigitalCommons@University of Nebraska - Lincoln. It hasbeen accepted for inclusion in Architectural Engineering -- Faculty Publications by an authorized administrator of DigitalCommons@University ofNebraska - Lincoln.
Su, Chunxiao; Lau, Josephine; and Yu, Fang, "A Case Study of Upper-Room UVGI in Densely-Occupied Elementary Classrooms byReal-Time Fluorescent Bioaerosol Measurements" (2017). Architectural Engineering -- Faculty Publications. 102.http://digitalcommons.unl.edu/archengfacpub/102
A Case Study of Upper-Room UVGI inDensely-Occupied Elementary Classrooms byReal-Time Fluorescent Bioaerosol MeasurementsChunxiao Su 1, Josephine Lau 1,* and Fang Yu 2
1 Durham School of Architecture Engineering and Construction, University of Nebraska-Lincoln,1110 S 67th Street, Omaha, NE 68182, USA; [email protected]
2 Department of Biostatistics, College of Public Health, University of Nebraska Medical Center,984375 Nebraska Medical Center, Omaha, NE 68198, USA; [email protected]
Academic Editors: Daniela Haluza, Stana Simic and Hanns MoshammerReceived: 4 October 2016; Accepted: 30 December 2016; Published: 8 January 2017
Abstract: Recently, the requirement to continuously collect bioaerosol samples using shorter responsetimes has called for the use of real-time detection. The decreased cost of this technology makesit available for a wider application than military use, and makes it accessible to pharmaceuticaland academic research. In this case study, real-time bioaerosol monitors (RBMs) were applied inelementary school classrooms—a densely occupied environment—along with upper-room ultravioletgermicidal irradiation (UVGI) devices. The classrooms were separated into a UVGI group anda non-UVGI control group. Fluorescent bioaerosol counts (FBCs) were monitored on 20 visitingdays over a four-month period. The classroom with upper-room UVGI showed significantly lowerconcentrations of fine size (<3 µm) and total FBCs than the control classroom during 13 of the20 visiting days. The results of the study indicate that the upper-room UVGI could be effective inreducing FBCs in the school environment, and RBMs may be applicable in reflecting the transientconditions of the classrooms due to the dynamic activity levels of the students and teachers.
Bioaerosols are biological aerosol particles suspended in air. This subset of aerosols containsfungi, viruses, bacteria, spores, and pollen. Bioaerosols in indoor environments—especially at highconcentration—have been associated over the last several decades with a wide range of adverse healtheffects, such as inflammatory, respiratory, and allergic reactions [1–5]. Research has been carried outin schools and childcare environments, which are usually densely occupied. When an increase inmicrobiological contaminants was identified together with excessive dampness, Bornehag [6] andZuraimi [7] found that there were negative impacts on the attendance of students/children.
Upper-room ultraviolet germicidal irradiation (UVGI) with a wavelength range of 100–280 nm(UV-C) has been verified to efficiently disinfect airborne microbial organisms by inhibiting their abilityto replicate [8–13]. In these research studies, Bacillus atrophaeus and Escherichia coli were nebulized.There are studies which found the concentration of indoor aerosols is positively associated withincidences of tuberculosis (TB), especially for people with a greater health risk [14,15]. UVGI has beenproven to successfully reduce the spread of TB in high-risk settings [16,17]. The on-site performance ofupper-room UVGI was evaluated by the transmission of tuberculosis to guinea pigs. The TB infectionof the guinea pigs in the UVGI group was reduced to 9.5%, compared to 35% of those in the controlgroup [18]. The methods of bioaerosol collections applied in the UVGI studies above were all based on
Int. J. Environ. Res. Public Health 2017, 14, 51; doi:10.3390/ijerph14010051 www.mdpi.com/journal/ijerph
Int. J. Environ. Res. Public Health 2017, 14, 51 2 of 11
traditional culturing and sampling methods, such as impactors and impingers. Alternatively, rapiddetection of airborne microorganisms could provide a sufficient amount of data to draw a completepicture of transient bioaerosol levels over an extended time period. The upper limit of detection offluorescence-based real-time bioaerosol monitoring devices could reach around 6 × 10⁷ number/m3 inthe laboratory environment [19]. The devices had been tested on different species of airborne fungiunder controlled laboratory conditions [20,21]. Additionally, limited tests with this technology havebeen undertaken in occupied indoor environments, including hospitals [22], university classrooms [23],and cleanroom areas [24,25]. The development of on-line techniques as real-time bioaerosol monitors(RBMs) has brought the possibility to evaluate the bioaerosol removal effects by air cleaning devices atproper time resolution and cost.
The objective of this study was to evaluate the effect of upper-room UVGI air cleaners onfluorescent bioaerosol counts (FBCs) in elementary classrooms. Based on our knowledge, it is one ofthe first studies to evaluate the performance of UVGI devices in a field study with RBMs on a broadrange of fluorescent bioaerosols. By continuously monitoring fluorescent bioaerosol concentrations inUVGI and control classrooms, a detailed observation of the change in FBCs over time was obtained.A proper procedure for the application of RBMs in environments such as classrooms and data analysisis applied in the methodology, and the result is discussed.
2. Methodology
2.1. Location
The public elementary school tested is located in the U.S. Midwest. Two classrooms (one used forreading and one for math) with the same floor area of 85 m2 and with the same class schedules wereselected. The class sizes were between 25 and 30 students. Each classroom has a separate ventilationsystem with no shared recirculation pathways.
2.2. Experiment Design and Procedures
For the study, one classroom was installed with four units of upper-room UVGI air cleaners andthe other one was set as the non-UVGI control room. Samples of fluorescent bioaerosols were collectedand measured over a four-month period from October 2012 to January 2013. Two RBMs were placed ineach of the tested classrooms. The sampling points were located close to the returning air grille becausethe air would be well-mixed at the returning grille as compared to other spaces in the classrooms [26].Figure 1 shows the location of the RBMs in each classroom.
Int. J. Environ. Res. Public Health 2017, 14, 51 2 of 11
those in the control group [18]. The methods of bioaerosol collections applied in the UVGI studies
above were all based on traditional culturing and sampling methods, such as impactors and
impingers. Alternatively, rapid detection of airborne microorganisms could provide a sufficient
amount of data to draw a complete picture of transient bioaerosol levels over an extended time
period. The upper limit of detection of fluorescence-based real-time bioaerosol monitoring devices
could reach around 6 × 10⁷ number/m3 in the laboratory environment [19]. The devices had been
tested on different species of airborne fungi under controlled laboratory conditions [20,21].
Additionally, limited tests with this technology have been undertaken in occupied indoor
environments, including hospitals [22], university classrooms [23], and cleanroom areas [24,25]. The
development of on-line techniques as real-time bioaerosol monitors (RBMs) has brought the
possibility to evaluate the bioaerosol removal effects by air cleaning devices at proper time resolution
and cost.
The objective of this study was to evaluate the effect of upper-room UVGI air cleaners on
fluorescent bioaerosol counts (FBCs) in elementary classrooms. Based on our knowledge, it is one of
the first studies to evaluate the performance of UVGI devices in a field study with RBMs on a broad
range of fluorescent bioaerosols. By continuously monitoring fluorescent bioaerosol concentrations
in UVGI and control classrooms, a detailed observation of the change in FBCs over time was obtained.
A proper procedure for the application of RBMs in environments such as classrooms and data
analysis is applied in the methodology, and the result is discussed.
2. Methodology
2.1. Location
The public elementary school tested is located in the US Midwest. Two classrooms (one used for
reading and one for math) with the same floor area of 85 m2 and with the same class schedules were
selected. The class sizes were between 25 and 30 students. Each classroom has a separate ventilation
system with no shared recirculation pathways.
2.2. Experiment Design and Procedures
For the study, one classroom was installed with four units of upper-room UVGI air cleaners and
the other one was set as the non-UVGI control room. Samples of fluorescent bioaerosols were
collected and measured over a four-month period from October 2012 to January 2013. Two RBMs
were placed in each of the tested classrooms. The sampling points were located close to the returning
air grille because the air would be well-mixed at the returning grille as compared to other spaces in
the classrooms [26]. Figure 1 shows the location of the RBMs in each classroom.
Figure 1. Floor plan of the classroom and location of the real-time bioaerosol monitors (RBMs) (a)
Lay-out plan of the tested classrooms with locations of UV devices and RBM. (b) Section drawing of
the tested classrooms showing the heights of UV devices and RBM. UV: ultraviolet.
Figure 1. Floor plan of the classroom and location of the real-time bioaerosol monitors (RBMs)(a) Lay-out plan of the tested classrooms with locations of UV devices and RBM; (b) Section drawing ofthe tested classrooms showing the heights of UV devices and RBM. UV: ultraviolet.
Int. J. Environ. Res. Public Health 2017, 14, 51 3 of 11
The RBMs were placed in the classrooms prior to the students’ entry to ensure that the FBCswould start recording before the room was occupied. The fluorescent bioaerosols were continuouslymonitored through an entire day until one hour after student dismissal. In October and November,the classrooms were monitored for one day in each month. In December and January, the RBMs wereplaced in the classrooms for two weeks to collect data for multiple days.
There are four supply air inlets and one exhaust air outlet in each classroom. The airflow rates of inlets and outlets were tested by an ALONOR air flow hood (TSI, Inc.,Shoreview, MN, USA). Temperature and relative humidity were measured monthly by an OMEGAOM-73 (OMEGA Engineering Inc., Stamford, CT, USA) temperature/humidity data logger. TheRBM tests were carried out monthly, concurrently with the traditional culture-based method.Upper-room UVGI units were installed in two selected classrooms. In each classroom, four UVGI units(Lumalier WM-136, Lumalier Corporation, Memphis, TN, USA), each with a 36 W ultraviolet (UV)lamp, were installed on four walls as shown in Figure 1a. The UVGI units were installed above 2.4 m inheight to fulfill the safety requirement for occupants (0.2 µw/cm2) [27]. A radiometer (Model IL 1700Awith SED 240 detector, International Light Inc., Newburyport, MA, USA) was used to measure the UVirradiance of upper-room UVGI units in the field. The UV irradiance measurements were discussed ina previous study [28]. The UV lamps ran continuously during both occupied and unoccupied times,and were replaced after 8000 running hours.
2.3. Fluorescent Bioaerosols
The RBM model used in this study was the IMD-A series manufactured by BioVigilant.(BioVigilant Systems Inc., Tucson, AZ, USA).
A complete RBM system includes two main components: one particle size detector determiningthe size of each individual particle, and one fluorescence detector deciding if the particle is biologicalor inert by the presence or absence of intrinsic fluorescence. Inside the monitors, UV illumination isused to concurrently examine each particle for the presence of the metabolites nicotinamide adeninedinucleotide (NADH) and riboflavin, which are necessary intermediates for the metabolism of a livingorganism and therefore exist in microbes such as bacteria and fungi [22,23]. The system can detect andquantify particles within a range of 0.5–10 µm. The RBMs categorizes the particles into three groups:biological, inert, and total particles. The biological particle is the same as the fluorescent bioaerosolused in this paper. The number of total aerosols is a parameter directly measured by the particle sizedetector inside the RBM, similar to a reading of an optical counter that reflects the total number ofaerosols. The number of inert aerosols is calculated by subtracting the FBCs from the total particles.
The RBMs kept the flow rate constant at 1.15 L/min, which ensured that the sampling pumpsin the devices ran quietly and would not distract the occupants from daily activities. The data wasstored on an 80 GB hard drive, which fulfills the requirement for a long running time. The unit ofconcentration was converted to number per cubic meters (number/m3).
2.4. Data Analysis
RBMs record three categories of aerosols: bioaerosol, inert aerosol, and total aerosol. The threecategories were obtained in six channels from size 0.5 µm to 10 µm. These channels were grouped intoseveral ranges. The fluorescent bioaerosols from 0.5–3 µm were summarized as fine size A (<3 µm),0.5–7 µm as fine size B (<7 µm), and the 10 µm and above as coarse size. Fine size A is the size rangethat dominated in the classroom collected by the RBM. Fine size B is comparable to the size range ofbioaerosol samples by the second stage of the two-stage Andersen samplers.
In this study, the data were divided into two time periods: occupied and unoccupied time.The analysis focused on the data collected from occupied time. The occupied periods were picked as08:20–09:20, 10:10–12:00, and 12:45–15:15, which matched with the class schedules for both the UVGIand control classrooms. A curve of continuously measured bioaerosols during one visiting day isshown in Figure 2 to demonstrate the three occupied periods.
Int. J. Environ. Res. Public Health 2017, 14, 51 4 of 11Int. J. Environ. Res. Public Health 2017, 14, 51 4 of 11
Figure 2. The figure shows a selection of occupied periods fluorescent bioaerosol counts (FBCs) at fine
size A (0.5–3 μm) in the non-ultraviolet germicidal irradiation (UVGI) classroom from a typical
sampling day.
To reflect the aerosol generated by occupant-related activities, an average concentration during
the unoccupied period was subtracted from the occupied concentrations at each data point. This
adjustment helps to minimize the influence of classroom settings on the samples. The unoccupied
period was selected as from 20:00 to 23:00 for each visiting day. Since the RBMs were not monitoring
the classrooms for a 24-hour period during the first two months, only the data from the latter two
months are shown in this paper. The mean of concentrations during the unoccupied period was
calculated as 𝐶𝑢𝑛𝑜𝑐𝑐𝑢𝑝𝑖𝑒𝑑 . Starting with each data point from the occupied period , 𝐶𝑜𝑐𝑐𝑢𝑝𝑖𝑒𝑑,𝑡 , and
subtracting the mean number of the unoccupied period, 𝐶𝑢𝑛𝑜𝑐𝑐𝑢𝑝𝑖𝑒𝑑 , obtains a new data for the same
time point , 𝐶𝑜𝑐𝑐𝑢𝑝𝑖𝑒𝑑,𝑡′ , as shown in Equation (1). This procedure of adding adjustment was also
applied to the fractions of fluorescent bioaerosols to total aerosol.
𝐶𝑜𝑐𝑐𝑢𝑝𝑖𝑒𝑑,𝑡′ = 𝐶𝑜𝑐𝑐𝑢𝑝𝑖𝑒𝑑,𝑡 − 𝐶𝑢𝑛𝑜𝑐𝑐𝑢𝑝𝑖𝑒𝑑 (1)
The raw data were first reorganized in Excel 2013 (Microsoft Inc. Redmond, WA, USA), then
averaged as 1-min interval data to reduce the number of data points to 1/6 of the original amount.
The non-parametric Wilcoxon signed ranks test was applied to determine if differences in
concentrations existed between UVGI and non-UVGI control classrooms. SPSS version 21 (IBM
Corporation, Armonk, NY, USA) was used to conduct the statistical analysis.
3. Result
The results of FBCs measurement in the classrooms are presented in the following paragraphs.
The effect of the unoccupied background adjustment was also explored.
3.1. Environmental Parameters
The average indoor temperature and relative humidity for the UVGI and non-UVGI control
classrooms were well-maintained during the measurement. The indoor temperatures fell to a range
of 22.3 °C to 22.7 °C, and the range of relative humidity was 24.1% to 34.6% throughout the entire
testing period. Based on the results of ventilation measurement, the supply air rates and return air
rates were stable throughout the sampling. The supply air and return air rates for the UVGI classroom
were 0.47 m3/s and 0.38 m3/s, respectively. For the control classroom, the supply air and return air
rates were 0.45 m3/s and 0.38 m3/s, respectively. The measurement error of the flow hood was ±0.017
m3/s.
Figure 2. The figure shows a selection of occupied periods fluorescent bioaerosol counts (FBCs) atfine size A (0.5–3 µm) in the non-ultraviolet germicidal irradiation (UVGI) classroom from a typicalsampling day.
To reflect the aerosol generated by occupant-related activities, an average concentrationduring the unoccupied period was subtracted from the occupied concentrations at each data point.This adjustment helps to minimize the influence of classroom settings on the samples. The unoccupiedperiod was selected as from 20:00 to 23:00 for each visiting day. Since the RBMs were not monitoringthe classrooms for a 24 h period during the first two months, only the data from the latter two monthsare shown in this paper. The mean of concentrations during the unoccupied period was calculatedas Cunoccupied. Starting with each data point from the occupied period, Coccupied,t, and subtractingthe mean number of the unoccupied period, Cunoccupied, obtains a new data for the same time point,C′occupied,t, as shown in Equation (1). This procedure of adding adjustment was also applied to thefractions of fluorescent bioaerosols to total aerosol.
C′occupied,t = Coccupied,t − Cunoccupied (1)
The raw data were first reorganized in Excel 2013 (Microsoft Inc. Redmond, WA, USA),then averaged as 1-min interval data to reduce the number of data points to 1/6 of the originalamount. The non-parametric Wilcoxon signed ranks test was applied to determine if differencesin concentrations existed between UVGI and non-UVGI control classrooms. SPSS version 21(IBM Corporation, Armonk, NY, USA) was used to conduct the statistical analysis.
3. Result
The results of FBCs measurement in the classrooms are presented in the following paragraphs.The effect of the unoccupied background adjustment was also explored.
3.1. Environmental Parameters
The average indoor temperature and relative humidity for the UVGI and non-UVGI controlclassrooms were well-maintained during the measurement. The indoor temperatures fell to a range of22.3 ◦C to 22.7 ◦C, and the range of relative humidity was 24.1% to 34.6% throughout the entire testingperiod. Based on the results of ventilation measurement, the supply air rates and return air rates werestable throughout the sampling. The supply air and return air rates for the UVGI classroom were0.47 m3/s and 0.38 m3/s, respectively. For the control classroom, the supply air and return air rateswere 0.45 m3/s and 0.38 m3/s, respectively. The measurement error of the flow hood was ±0.017 m3/s.
Int. J. Environ. Res. Public Health 2017, 14, 51 5 of 11
3.2. Concentrations before Adjustment to Background
The FBCs throughout all twenty visiting days are presented in Table 1. The raw concentrationsof fine size A fluorescent bioaerosols were usually below 300,000 number/m3. For the fluorescentbioaerosols of coarse size (10 µm), the concentrations were generally lower than 100,000 number/m3.
Table 1. Daily average fluorescent bioaerosol count (FBC) (a) fine size A (<3 µm), and (b) coarse size(10 µm).
Month Day UVGI SD Control SD p-Values Proportion (%) of Reduction
Table 1a
October DAY1 115,507 37,662 130,675 68,453 <0.001 11.6%
November DAY2 114,829 42,628 150,561 63,257 <0.001 23.7%
Bold numbers indicate lower FBC in the ultraviolet germicidal irradiation (UVGI) room; Italic numbers indicatestatistically significant higher FBC in the UVGI room; SD: standard deviation.
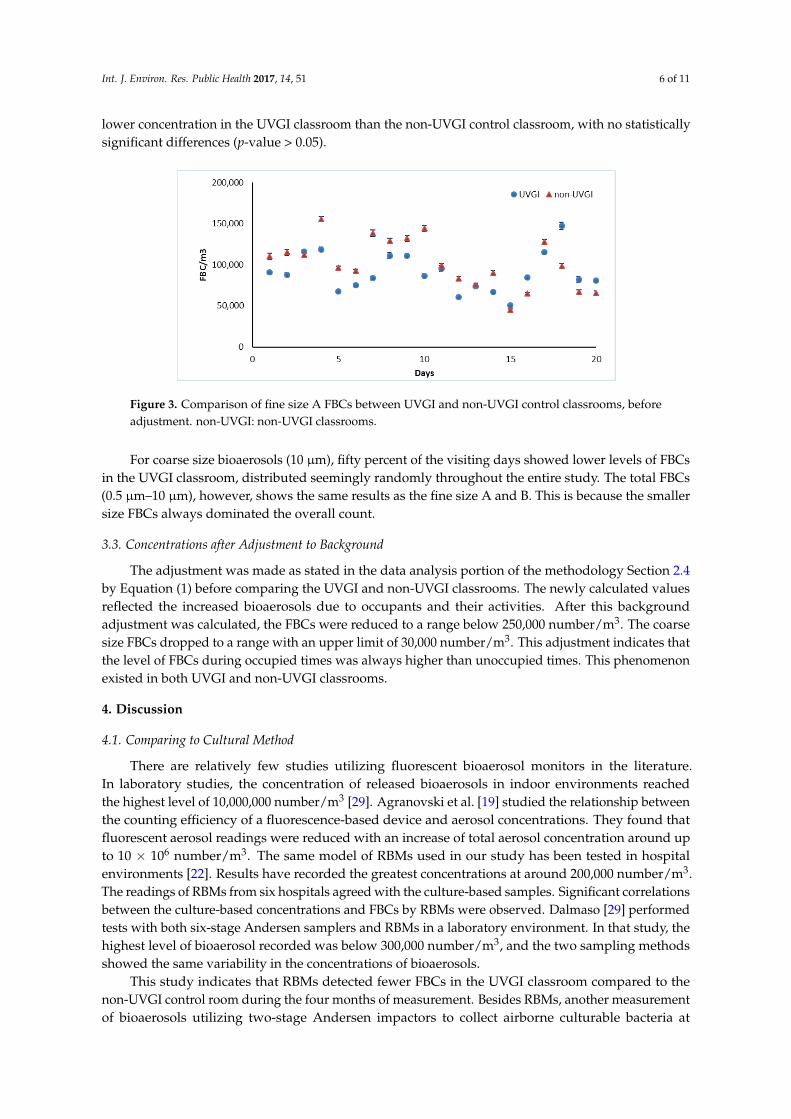
The average FBCs from the non-UVGI control classroom for 12 visiting days were significantlyhigher than those from the UVGI-control classroom (Figure 3). The UVGI and non-UVGI classroomswere compared for each visiting day. The statistical tests show a significant difference betweentwo classrooms (p-values < 0.05). The only exceptions are Day 11 and 13, which showed a slightly
Int. J. Environ. Res. Public Health 2017, 14, 51 6 of 11
lower concentration in the UVGI classroom than the non-UVGI control classroom, with no statisticallysignificant differences (p-value > 0.05).
Int. J. Environ. Res. Public Health 2017, 14, 51 6 of 11
The average FBCs from the non-UVGI control classroom for 12 visiting days were significantly
higher than those from the UVGI-control classroom (Figure 3). The UVGI and non-UVGI classrooms
were compared for each visiting day. The statistical tests show a significant difference between two
classrooms (p-values < 0.05). The only exceptions are Day 11 and 13, which showed a slightly lower
concentration in the UVGI classroom than the non-UVGI control classroom, with no statistically
significant differences (p-value > 0.05).
Figure 3. Comparison of fine size A FBCs between UVGI and non-UVGI control classrooms, before
adjustment. non-UVGI: non-UVGI classrooms.
For coarse size bioaerosols (10 μm), fifty percent of the visiting days showed lower levels of FBCs
in the UVGI classroom, distributed seemingly randomly throughout the entire study. The total FBCs
(0.5 μm–10 μm), however, shows the same results as the fine size A and B. This is because the smaller
size FBCs always dominated the overall count.
3.3. Concentrations after Adjustment to Background
The adjustment was made as stated in the data analysis portion of the methodology Section 2.4
by Equation (1) before comparing the UVGI and non-UVGI classrooms. The newly calculated values
reflected the increased bioaerosols due to occupants and their activities. After this background
adjustment was calculated, the FBCs were reduced to a range below 250,000 number/m3. The coarse
size FBCs dropped to a range with an upper limit of 30,000 number/m3. This adjustment indicates
that the level of FBCs during occupied times was always higher than unoccupied times. This
phenomenon existed in both UVGI and non-UVGI classrooms.
4. Discussion
4.1. Comparing to Cultural Method
There are relatively few studies utilizing fluorescent bioaerosol monitors in the literature. In
laboratory studies, the concentration of released bioaerosols in indoor environments reached the
highest level of 10,000,000 number/m3 [29]. Agranovski et al. [19] studied the relationship between
the counting efficiency of a fluorescence-based device and aerosol concentrations. They found that
fluorescent aerosol readings were reduced with an increase of total aerosol concentration around up
to 10 × 106 number/m3. The same model of RBMs used in our study has been tested in hospital
environments [22]. Results have recorded the greatest concentrations at around 200,000 number/m3.
The readings of RBMs from six hospitals agreed with the culture-based samples. Significant
correlations between the culture-based concentrations and FBCs by RBMs were observed. Dalmaso
[29] performed tests with both six-stage Andersen samplers and RBMs in a laboratory environment.
In that study, the highest level of bioaerosol recorded was below 300,000 number/m3, and the two
sampling methods showed the same variability in the concentrations of bioaerosols.
Figure 3. Comparison of fine size A FBCs between UVGI and non-UVGI control classrooms, beforeadjustment. non-UVGI: non-UVGI classrooms.
For coarse size bioaerosols (10 µm), fifty percent of the visiting days showed lower levels of FBCsin the UVGI classroom, distributed seemingly randomly throughout the entire study. The total FBCs(0.5 µm–10 µm), however, shows the same results as the fine size A and B. This is because the smallersize FBCs always dominated the overall count.
3.3. Concentrations after Adjustment to Background
The adjustment was made as stated in the data analysis portion of the methodology Section 2.4by Equation (1) before comparing the UVGI and non-UVGI classrooms. The newly calculated valuesreflected the increased bioaerosols due to occupants and their activities. After this backgroundadjustment was calculated, the FBCs were reduced to a range below 250,000 number/m3. The coarsesize FBCs dropped to a range with an upper limit of 30,000 number/m3. This adjustment indicates thatthe level of FBCs during occupied times was always higher than unoccupied times. This phenomenonexisted in both UVGI and non-UVGI classrooms.
4. Discussion
4.1. Comparing to Cultural Method
There are relatively few studies utilizing fluorescent bioaerosol monitors in the literature.In laboratory studies, the concentration of released bioaerosols in indoor environments reachedthe highest level of 10,000,000 number/m3 [29]. Agranovski et al. [19] studied the relationship betweenthe counting efficiency of a fluorescence-based device and aerosol concentrations. They found thatfluorescent aerosol readings were reduced with an increase of total aerosol concentration around upto 10 × 106 number/m3. The same model of RBMs used in our study has been tested in hospitalenvironments [22]. Results have recorded the greatest concentrations at around 200,000 number/m3.The readings of RBMs from six hospitals agreed with the culture-based samples. Significant correlationsbetween the culture-based concentrations and FBCs by RBMs were observed. Dalmaso [29] performedtests with both six-stage Andersen samplers and RBMs in a laboratory environment. In that study, thehighest level of bioaerosol recorded was below 300,000 number/m3, and the two sampling methodsshowed the same variability in the concentrations of bioaerosols.
This study indicates that RBMs detected fewer FBCs in the UVGI classroom compared to thenon-UVGI control room during the four months of measurement. Besides RBMs, another measurementof bioaerosols utilizing two-stage Andersen impactors to collect airborne culturable bacteria at
Int. J. Environ. Res. Public Health 2017, 14, 51 7 of 11
0.8 µm–8 µm and >8 µm was reported in a previous study [28]. In that experiment, the cultured sampleswere collected within one to two hours following student dismissal. The data were separated by monthto compare the results of the two sampling methods. Figure 4a shows the results of the fine size AFBCs. Figure 4b shows the results of the traditional culture-based method. The culture-based samplingmethod had the same statistical results as the RBMs when comparing bioaerosol concentrations in theUVGI and non-UVGI control classrooms.
Int. J. Environ. Res. Public Health 2017, 14, 51 7 of 11
This study indicates that RBMs detected fewer FBCs in the UVGI classroom compared to the
non-UVGI control room during the four months of measurement. Besides RBMs, another
measurement of bioaerosols utilizing two-stage Andersen impactors to collect airborne culturable
bacteria at 0.8 μm–8 μm and >8 μm was reported in a previous study [28]. In that experiment, the
cultured samples were collected within one to two hours following student dismissal. The data were
separated by month to compare the results of the two sampling methods. Figure 4a shows the results
of the fine size A FBCs. Figure 4b shows the results of the traditional culture-based method. The
culture-based sampling method had the same statistical results as the RBMs when comparing
bioaerosol concentrations in the UVGI and non-UVGI control classrooms.
Figure 4. Comparison of results from two bioaerosols sampling methods (a) Monthly FBCs RBMs at
fine size B (<7 μm) in UVGI and non-UVGI control classrooms before the adjustment. (b) The monthly
concentration of airborne culturable bacteria using Andersen impactor at the fine size (<8 μm) in the
UVGI and non-UVGI control classrooms. CFU: colony forming units.
Both the RBMs and the traditional method found that the fine size B FBCs (<7 μm) in the UVGI
classroom were statistically significantly lower than the non-UVGI control classrooms during the first
3 months (p-values < 0.05). The RBMs detected higher peak concentrations (20,000 number/m3) for
fine size B FBCs than the readings from the two-stage Andersen samplers (600 CFU/m3). One possible
reason is that the microbial population in the field could be highly heterogeneous. The cultural
method may significantly underestimate the total concentration of viable microorganisms due to the
bacterial competitiveness during cultivation [30]. There are studies that found that only a small
proportion of microorganisms will grow on culture agars [31], raising the concern that using the
cultural method could significantly underestimate the actual concentration. In addition, the
significant time requirement of culture-based methods may limit researchers from detailed
observation of bioaerosols [32−34]. Thus, continuous observations cannot be made quickly. The
traditional method also requires extensive labor time to obtain the data, which may not work well
when sampling an environment requires rapid response and decision making.
Figure 4. Comparison of results from two bioaerosols sampling methods (a) Monthly FBCs RBMs atfine size B (<7 µm) in UVGI and non-UVGI control classrooms before the adjustment; (b) The monthlyconcentration of airborne culturable bacteria using Andersen impactor at the fine size (<8 µm) in theUVGI and non-UVGI control classrooms. CFU: colony forming units.
Both the RBMs and the traditional method found that the fine size B FBCs (<7 µm) in the UVGIclassroom were statistically significantly lower than the non-UVGI control classrooms during the first3 months (p-values < 0.05). The RBMs detected higher peak concentrations (20,000 number/m3) forfine size B FBCs than the readings from the two-stage Andersen samplers (600 CFU/m3). One possiblereason is that the microbial population in the field could be highly heterogeneous. The cultural methodmay significantly underestimate the total concentration of viable microorganisms due to the bacterialcompetitiveness during cultivation [30]. There are studies that found that only a small proportion ofmicroorganisms will grow on culture agars [31], raising the concern that using the cultural methodcould significantly underestimate the actual concentration. In addition, the significant time requirementof culture-based methods may limit researchers from detailed observation of bioaerosols [32–34].Thus, continuous observations cannot be made quickly. The traditional method also requires extensivelabor time to obtain the data, which may not work well when sampling an environment requires rapidresponse and decision making.
4.2. Effect of Adjustment
Although the selected classrooms shared the same floor plan, ventilation system, and classschedule, other (albeit difficult to observe) differences could exist in the classroom settings to createdifferent concentration levels during the unoccupied conditions (as the background difference).
Int. J. Environ. Res. Public Health 2017, 14, 51 8 of 11
The adjustment to occupied time data by unoccupied data must consider both the difference andtiming issues. By adding this adjustment, data points from the same time were paired between theUVGI and non-UVGI control classrooms.
When comparing the concentrations before and after the adjustment, there were the same numberof visiting days showing a statistical significance. The same conclusion can be made for both fine size Aand B FBCs. This may indicate that the adjustment has eliminated part of the differences resulting fromenvironmental factors other than occupants, and could help reduce the bias of comparing two differentclassrooms in the field.
4.3. Occupants and Their Activities Cause the Increase of FBCs (Reflect the Difference between Occupied andUnoccupied Periods)
It has been found that occupants and their activities are a main source of bioaerosols in indoorenvironments [35,36]. High concentration of environmental bioaerosols raised by occupants may berelated to a higher risk of airborne infectious diseases with patients at present. Another study withfluorescence-based devices also revealed significant differences of bioaerosol concentrations betweenthe occupied and unoccupied periods in university classrooms [23]. This usually raises public healthconcerns. So, quick detection of indoor bioaerosols during occupied times in buildings has significantpractical meaning. In our study, airborne culturable bacteria were collected by the culture-basedmethod, and the samples were obtained immediately after the occupied time. The result might notrepresent the actual bioaerosols concentration in the occupied time. In this measurement by RBMs,the sampling period covered both occupied and unoccupied periods. However, due to the operatingprocedure and noise level of the impactors, agar plates could only collect bioaerosols samples rightafter the occupied time, but not exactly at the occupied time. The RBMs filled this gap and provideda complete data map through all visiting days. In addition, RBMs obtained data exactly from theoccupied time, which can more precisely depict the variability of FBCs.
4.4. Scope and Limitations
The scope of this field case study is to find the reduction in bioaerosols by upper-room UVGI witha rapid detection technique such as RBMs. Although lower concentration of FBCs in the UV-irradiatedclassroom were successfully measured, there are several limitations to this study.
The comparison of the concentrations is based on the assumption that the student activities in bothUVGI and non-UVGI control classrooms were within the same levels. Though the number of studentsin two classrooms was very close, the influence on the data generated by undistinguished studentactivities was difficult to determine. We also did not closely monitor the health conditions of thestudents due to the limited of timeframe and budget of this study. Our study focuses on the reductionof FBCs by upper-room UVGI to lower the potential risk on occupants’ health in indoor environmentssuch as a classroom. For occupants like elementary students, further effort will be needed to explorethe relationship between the development of immune systems and natural bioaerosol load, regardingthe hygiene hypothesis developed in recent decades which states the necessity of early childhoodexposure to microorganisms [37].
In addition, there are experimental results that have shown that fungal bioaerosols inactivated bysub-seconds exposure to thermal energy can still produce fluorescence signals [38]. There is no availableresearch about how UV light affects bioaerosols that generate a fluorescence signal. In one study byAgranovski et al. which compared a fluorescent device to culture-based methods measuring threetypes of airborne bacteria, laboratory tests found the physiological condition of bacteria—specificallyinjured cells—was below the sensitivity level of a specific fluorescent device [30]. This indicates thatthe amount of fluorophores within injured bacteria may not trigger the fluorescent signal, makingthem undetected by an RBM.
Int. J. Environ. Res. Public Health 2017, 14, 51 9 of 11
5. Conclusions
This study evaluated the reduction of fluorescent bioaerosols counts by upper-room UVGI inclassrooms with RBMs, and came to the following conclusions:
1. Upper-room UVGI devices can reduce the fluorescent bioaerosols found in an elementaryclassroom. Daily samples collected through a four-month study showed that averageconcentrations of fine size (<3 µm) FBCs in 12 visiting days from the control classroom werestatistically significantly higher than those from the classroom equipped with UVGI devices.The RBMs provided statistically similar results on the performance of upper-room UVGI deviceswhen comparing to a parallel study using the traditional culture-based sampling method.
2. With the RBMs, both FBCs and total aerosols were monitored. Comparing the concentrationsfrom occupied and unoccupied periods found significantly higher FBCs during the occupiedperiods of all visiting days. This result supports the notion that humans and their activities arethe primary cause of an increase of detectable FBCs during occupied periods.
Acknowledgments: We would like to express our appreciation to Lumalier Corporation, Memphis, U. S. A. fortheir generous donation of the UVGI devices and University of Nebraska – Lincoln for the Lament award andDSAEC funding. Special thanks are given to the facilities supervisors and staff in the public school district.
Author Contributions: Chunxiao Su, Josephine Lau and Fang Yu contributed equally to the conception anddesign, acquisition of data, analysis and interpretation of data. Chunxiao Su and Josephine Lau contributed to thedrafting and revising the intellectual content of this paper. They approved the final version to be published.
Conflicts of Interest: While Lumalier Corporation provided the UVGI devices, they did not participate in theexperimental design, drafting of this manuscript, or were made aware of the results of this study.
References
1. Eduard, W.; Heederik, D.; Duchaine, C.; Green, B.J. Bioaerosol exposure assessment in the workplace:The past, present and recent advances. J. Environ. Monit. 2012, 14, 334–339. [CrossRef] [PubMed]
2. Lacey, J.; Crook, B. Fungal and actinomycete spores as pollutants of the workplace and occupational allergens.Ann. Occup. Hyg. 1988, 32, 515–533. [CrossRef] [PubMed]
3. Menzies, D.; Bourbeau, J. Building-Related Illnesses. N. Engl. J. Med. 1997, 337, 1524–1531. [CrossRef][PubMed]
4. Douwes, J.; Thorne, P.; Pearce, N.; Heederik, D. Bioaerosol health effects and exposure assessment:Progress and prospects. Ann. Occup. Hyg. 2003, 47, 187–200. [CrossRef] [PubMed]
5. Perez-Padilla, R.; Schilmann, A.; Riojas-Rodriguez, H. Respiratory health effects of indoor air pollution. Int. J.Tuberc. Lung Dis. 2010, 14, 1079–1086. [PubMed]
6. Bornehag, C.; Sundell, J.; Sigsgaard, T. Dampness in buildings and health (DBH): Report from an ongoingepidemiological investigation on the association between indoor environmental factors and health effectsamong children in Sweden. Indoor Air 2004, 14 (Suppl. S7), 59–66. [CrossRef] [PubMed]
7. Zuraimi, M.S.; Tham, K.W. Indoor air quality and its determinants in tropical child care centers.Atmos. Environ. 2008, 42, 2225–2239. [CrossRef]
8. Miller, S.L.; Macher, J.M. Evaluation of a methodology for quantifying the effect of room air ultravioletgermicidal irradiation on airborne bacteria. Aerosol Sci. Technol. 2000, 33, 274–295. [CrossRef]
9. Peccia, J.; Hernandez, M. Photoreactivation in airborne Mycobacterium parafortuitum. Appl. Environ. Microbiol.2001, 67, 4225–4232. [CrossRef] [PubMed]
10. Green, C.; Scarpino, P. The use of ultraviolet germicidal irradiation (UVGI) in disinfection of airborne bacteria.Environ. Eng. Policy 2002, 3, 101–107. [CrossRef]
11. Ko, G.; First, M.W.; Burge, H.A. The characterization of upper-room ultraviolet germicidal irradiation ininactivating airborne microorganisms. Environ. Health Perspect. 2002, 110, 95–101. [CrossRef] [PubMed]
12. Walker, C.M.; Ko, G. Effect of ultraviolet germicidal irradiation on viral aerosols. Environ. Sci. Technol. 2007,41, 5460–5465. [CrossRef] [PubMed]
13. King, B.; Kesavan, J.; Sagripanti, J.-L. Germicidal UV sensitivity of bacteria in aerosols and on contaminatedsurfaces. Aerosol Sci. Technol. 2011, 45, 645–653. [CrossRef]
Int. J. Environ. Res. Public Health 2017, 14, 51 10 of 11
14. Jensen, P.A.; Lambert, L.A.; Iademarco, M.F.; Ridzon, R. Guidelines for preventing the transmission ofMycobacterium tuberculosis in health-care settings, 2005. MMWR Recomm Rep. 2005, 54, 1–141. [PubMed]
15. Lin, H.-H.; Ezzati, M.; Murray, M. Tobacco smoke, indoor air pollution and tuberculosis: A systematic reviewand meta-analysis. PLoS Med. 2007, 4, e20. [CrossRef] [PubMed]
16. Nardell, E.A.; Brickner, P.W. Tuberculosis in new york city: Focal transmission of an often fatal disease.JAMA 1996, 276, 1259–1260. [CrossRef] [PubMed]
17. Barnes, P.; Yang, Z.; Preston-Martin, S.; Al, E. PAtterns of tuberculosis transmission in central los angeles.JAMA 1997, 278, 1159–1163. [CrossRef] [PubMed]
18. Escombe, A.R.; Moore, D.A.; Gilman, R.H.; Navincopa, M.; Ticona, E.; Mitchell, B.; Noakes, C.; Martínez, C.;Sheen, P.; Ramirez, R.; et al. Upper-room ultraviolet light and negative air ionization to prevent tuberculosistransmission. PLoS Med. 2009, 6, e43. [CrossRef] [PubMed]
19. Agranovski, V.; Ristovski, Z.; Hargreaves, M.; Blackall, P.; Morawska, L. Real-time measurement of bacterialaerosols with the UVAPS: Performance evaluation. J. Aerosol Sci. 2003, 34, 301–317. [CrossRef]
20. Agranovski, V.; Ristovski, Z. Real-time monitoring of viable bioaerosols: Capability of the UVAPS to predictthe amount of individual microorganisms in aerosol particles. J. Aerosol Sci. 2005, 36, 665–676. [CrossRef]
21. Kanaani, H.; Hargreaves, M.; Smith, J.; Ristovski, Z.; Agranovski, V.; Morawska, L. Performance of UVAPSwith respect to detection of airborne fungi. J. Aerosol Sci. 2008, 39, 175–189. [CrossRef]
22. Yanagi, U.; Ikeda, K.; Kagi, N. Application of the IMD in measurement of airborne microbial particles.In International Network for Information on Ventilation and Energy Performance, Proceedings of the6th International Conference on Indoor Air Quality, Ventilation & Energy Conservation in Buildings(IAQVEC 2007), Sendai, Japan, 28–31 October 2007.
23. Bhangar, S.; Huffman, J.A.; Nazaroff, W.W. Size-resolved fluorescent biological aerosol particle concentrationsand occupant emissions in a university classroom. Indoor Air 2014, 24, 604–617. [CrossRef] [PubMed]
24. Bhupathiraju, V.K.; Varnau, B.; Nelson, J.R.; Jiang, J.; Bolotin, C. Evaluation of an instantaneous microbialdetection system in controlled and cleanroom environments. BioPharm Int. 2007, 20, 35–46.
25. Miller, M.J.; Lindsay, H.; Valverde-Ventura, R.; O’Conner, M.J. Evaluation of the BioVigilant IMD-A, a noveloptical spectroscopy technology for the continuous and real-time environmental monitoring of viable andnonviable particles. Part I. Review of the technology and comparative studies with conventional methods.PDA J. Pharm. Sci. Technol. 2009, 63, 245–258. [PubMed]
26. Xu, P.; Kujundzic, E.; Peccia, J.; Schafer, M.P.; Moss, G.; Hernandez, M.; Miller, S.L. Impact of environmentalfactors on efficacy of upper-room air ultraviolet germicidal irradiation for inactivating airborne mycobacteria.Environ. Sci. Technol. 2005, 39, 9656–9664. [CrossRef] [PubMed]
27. Kowalski, W. Ultraviolet Germicidal Irradiation Handbook: UVGI for Air and Surface Disinfection; Springer:New York, NY, USA, 2009.
28. Su, C.; Lau, J.; Gibbs, S. Evaluation of Ultraviolet Germicidal Irradiation in Reducing the Airborne CulturalBacteria Concentrations in an Elementary School in the Midwestern United States. J. Environ. Health 2015,77, 16–21. [PubMed]
29. Dalmaso, G. IMD Technology with an Example of a Successful Application. In Proceedings of the 41 stR3-Nordic Symposium, Dipoli, Espoo, Finland, 25–26 May 2010; p. 39.
30. Agranovski, V.; Ristovski, Z.; Hargreaves, M.; Blackall, P.; Morawska, L. Performance evaluation of theUVAPS: Influence of physiological age of airborne bacteria and bacterial stress. J. Aerosol Sci. 2003, 34,1711–1727. [CrossRef]
31. Amann, R.I.; Ludwig, W.; Schleifer, K.H. Phylogenetic identification and in situ detection of individualmicrobial cells without cultivation. Microbiol. Rev. 1995, 59, 143–169. [PubMed]
32. Jensen, P.A.; Todd, W.F.; Davis, G.N.; Scarpino, P.V. Evaluation of eight bioaerosol samplers challenged withaerosols of free bacteria. Am. Ind. Hyg. Assoc. J. 1992, 53, 660–667. [CrossRef] [PubMed]
33. Eduard, W.; Heederik, D. Methods for quantitative assessment of airborne levels of noninfectiousmicroorganisms in highly contaminated work environments. Am. Ind. Hyg. Assoc. J. 1998, 59, 113–127.[CrossRef] [PubMed]
34. Nevalainen, A.; Pastuszka, J.; Liebhaber, F.; Willeke, K. Performance of bioaerosol samplers: Collectioncharacteristics and sampler design considerations. Atmos. Environ. Part A Gen. Top. 1992, 26, 531–540.[CrossRef]
Int. J. Environ. Res. Public Health 2017, 14, 51 11 of 11
35. Chen, Q.; Hildemann, L.M. The effects of human activities on exposure to particulate matter and bioaerosolsin residential homes. Environ. Sci. Technol. 2009, 43, 4641–4646. [CrossRef] [PubMed]
36. Fox, A.; Harley, W.; Feigley, C.; Salzberg, D.; Sebastian, A.; Larsson, L. Increased levels of bacterial markersand CO2 in occupied school rooms. J. Environ. Monit. 2003, 5, 246–252. [CrossRef] [PubMed]
37. Yazdanbakhsh, M.; Kremsner, P.G.; van Ree, R. Parasites and the hygiene hypothesis: Regulating the immunesystem? Clin. Rev. Allergy Immunol. 2004, 26, 15–24. [CrossRef]
38. Lee, B.U.; Jung, J.H.; Yun, S.H.; Hwang, G.B.; Bae, G.N. Application of UVAPS to real-time detection ofinactivation of fungal bioaerosols due to thermal energy. J. Aerosol Sci. 2010, 41, 694–701. [CrossRef]