Iranian Journal of Oil & Gas Science and Technology, Vol. 4 (2015), No. 3, pp. 77-93 http://ijogst.put.ac.ir A CFD Simulation of the Parameters Affecting the Performance of Downhole De-oiling Hydrocyclone Seyyed Mohsen Hosseini 1 , Khalil Shahbazi 1 , and Mohammad Reza Khosravi Nikou 2* 1 Department of Petroleum Engineering, Petroleum University of Technology, Ahwaz, Iran 2 Department of Gas Engineering, Petroleum University of Technology, Ahwaz, Iran Received: September 09, 2014; revised: October 30, 2014; accepted: December 01, 2014 Abstract Among the all parameters affecting the performance of a downhole de-oiling hydrocyclone, the investigation of internal flow field deserves more attempts especially in the petroleum industry. In this study, the effects of inlet flow rate, inlet oil volume fraction, and oil droplet diameter on the separation efficiency and pressure drop ratio have been investigated along the hydrocyclone body. All the simulations were performed using computational fluid dynamics (CFD) techniques, in which the Eulerian multiphase model and the Reynolds stress turbulent model were employed for the prediction of multiphase and turbulent flow parameters through the hydrocyclone. The velocity component profiles, separation efficiency, pressure drop, and volume fraction are also other parameters which have been considered in this work. The results of the simulations illustrate good agreement with the reported experimental data. Furthermore, the simulations indicate that the separation efficiency almost increases twofold, when the droplet diameter increases from 25 to 50 micron. The effect of inlet flow rate on the separation efficiency is so significant that an increase in inlet flow rate from 5 to 25 l/min causes a sharp increase in the separation efficiency and raises it 2.5 times the initial value. However, the inlet oil volume fraction showed a minor effect on the hydrodynamic flow behavior in the hydrocyclone body compared to the other investigated parameters. Keywords: Separation Efficiency, Computational Fluid Dynamics, Pressure Drop 1. Introduction Hydrocyclones for the separation of solid-liquid, gas-liquid, and liquid-liquid mixtures have been employed for several years. During recent decades, the de-oiling hydrocyclone has been extremely used for the separation of oil-water emulsion in the petroleum industry. In the refining of crude oil or in the offshore platforms, liquid-liquid hydrocyclone can be used as a device for de-oiling and de- watering of produced oil (Belaidi and Thew, 2003; Dvorak, 1989; Gomez, 2001). A new technology of downhole oil-water separators has been developed in the petroleum industry and hydrocyclones have been extensively used for this purpose. In hydrocyclones, the centrifugal force plays an important role in the separation of the dispersed phase from the continuous phase. The inlet velocity and tangential injection of the entering fluid causes swirling motion of two fluids into the hydrocyclone chamber body. The flow pattern consists of two * Corresponding Author: Email: [email protected]
Transcript
Iranian Journal of Oil & Gas Science and Technology, Vol. 4 (2015), No. 3, pp. 77-93 http://ijogst.put.ac.ir
A CFD Simulation of the Parameters Affecting the Performance of Downhole De-oiling Hydrocyclone
Seyyed Mohsen Hosseini1, Khalil Shahbazi1, and Mohammad Reza Khosravi Nikou2*
1 Department of Petroleum Engineering, Petroleum University of Technology, Ahwaz, Iran 2 Department of Gas Engineering, Petroleum University of Technology, Ahwaz, Iran
Received: September 09, 2014; revised: October 30, 2014; accepted: December 01, 2014
Abstract
Among the all parameters affecting the performance of a downhole de-oiling hydrocyclone, the investigation of internal flow field deserves more attempts especially in the petroleum industry. In this study, the effects of inlet flow rate, inlet oil volume fraction, and oil droplet diameter on the separation efficiency and pressure drop ratio have been investigated along the hydrocyclone body. All the simulations were performed using computational fluid dynamics (CFD) techniques, in which the Eulerian multiphase model and the Reynolds stress turbulent model were employed for the prediction of multiphase and turbulent flow parameters through the hydrocyclone. The velocity component profiles, separation efficiency, pressure drop, and volume fraction are also other parameters which have been considered in this work. The results of the simulations illustrate good agreement with the reported experimental data. Furthermore, the simulations indicate that the separation efficiency almost increases twofold, when the droplet diameter increases from 25 to 50 micron. The effect of inlet flow rate on the separation efficiency is so significant that an increase in inlet flow rate from 5 to 25 l/min causes a sharp increase in the separation efficiency and raises it 2.5 times the initial value. However, the inlet oil volume fraction showed a minor effect on the hydrodynamic flow behavior in the hydrocyclone body compared to the other investigated parameters.
Keywords: Separation Efficiency, Computational Fluid Dynamics, Pressure Drop
1. Introduction
Hydrocyclones for the separation of solid-liquid, gas-liquid, and liquid-liquid mixtures have been employed for several years. During recent decades, the de-oiling hydrocyclone has been extremely used for the separation of oil-water emulsion in the petroleum industry. In the refining of crude oil or in the offshore platforms, liquid-liquid hydrocyclone can be used as a device for de-oiling and de-watering of produced oil (Belaidi and Thew, 2003; Dvorak, 1989; Gomez, 2001). A new technology of downhole oil-water separators has been developed in the petroleum industry and hydrocyclones have been extensively used for this purpose.
In hydrocyclones, the centrifugal force plays an important role in the separation of the dispersed phase from the continuous phase. The inlet velocity and tangential injection of the entering fluid causes swirling motion of two fluids into the hydrocyclone chamber body. The flow pattern consists of two
78 Iranian Journal of Oil & Gas Science and Technology, Vol. 4 (2015), No. 3
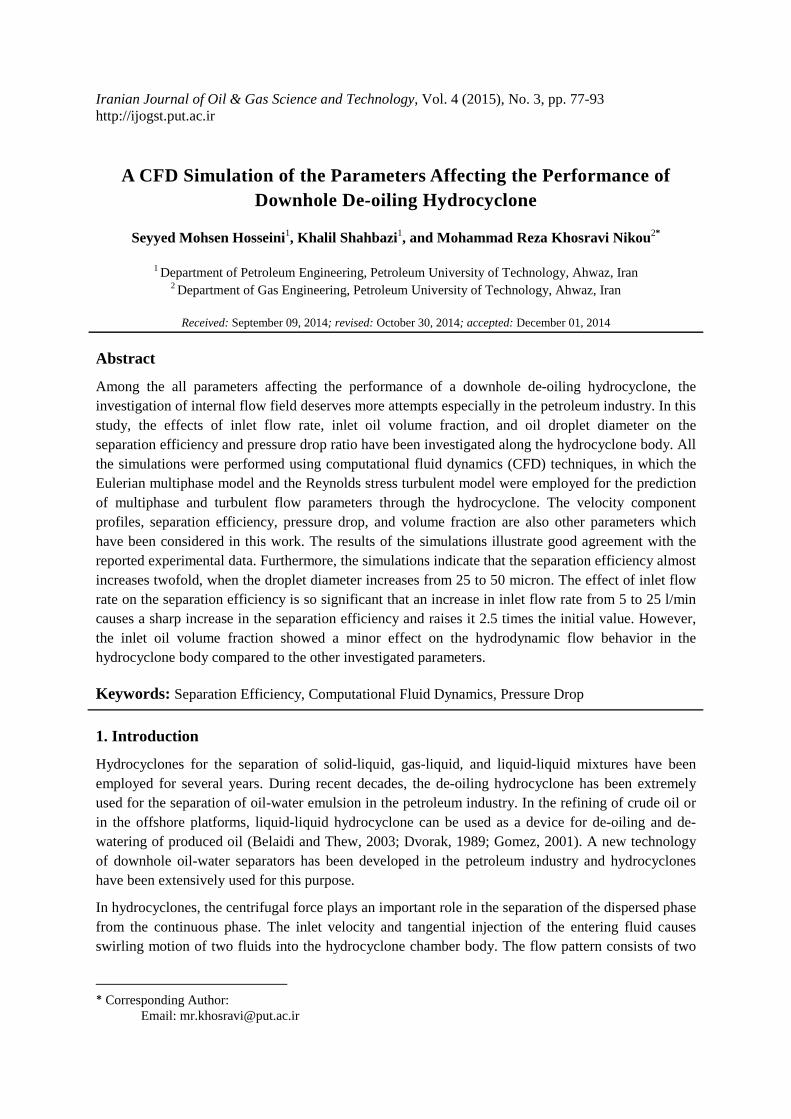
spiral vortices in the tangential direction formed in the hydrocyclone body. The outer vortex carries the higher density fluid into the underflow and the inner vortex pushes the less dense fluid in a reverse direction into the overflow (Figure 1).
Figure 1 A schematic of flow behavior in the hydrocyclone.
Several experimental studies have been done on de-oiling hydrocyclones (Colman and Thew, 1980; Colman and Thew, 1983). Some of them have tried to investigate the effect of different geometrical designs on the separation efficiency (Colman and Thew, 1980; Smyth, et al., 1980; Young, et al., 1994). Belaidi et al. (2003) studied the effect of free gas on cyclonic oil-water separation. Additionally, the effects of gas content, overflow size diameter, and feed pressure were all investigated. They developed a new geometry based on a standard de-oiling hydrocyclone and concluded that the separation efficiency could be improved in the revised geometry. Despite the numerous experimental attempts, there are only few studies which have utilized computational fluid dynamics (CFD) for performance prediction and the flow field characterization of highly swirling streams in the de-oiling hydrocyclone (Grady, et al., 2003; Hargreaves and Silvester, 1990; Paladino, et al., 2005; Petty and Parks, 2004; Small, et al., 1996). Many complex phenomena such as turbulence anisotropy, breakup/coalescence, and high swirling flow caused some difficulty in the CFD simulation of de-oiling hydrocyclone (Brennan, 2006; Hargreaves and Silvester, 1990). For a comprehensive simulation of the flow field in a de-oiling hydrocyclone, an accurate turbulent model such as Reynolds stress model (RSM) and a multiphase model such as Eulerian multiphase model are required (Narasimha, et al., 2007). Similar to the experimental works, the numerical investigation of the influence of geometry on the flow behavior in the hydrocyclones has attracted the attention of some researchers (Noroozi and Hashemabadi, 2009; Noroozi and Hashemabadi, 2011). Noroozi et al. (2009) applied Eulerian-Eulerian three-dimensional CFD model to investigate the effect of different inlet design on the de-oiling hydrocyclone separation efficiency. The RSM turbulence model with a modified drag coefficient for liquid-liquid emulsions with respect to different ranges of Reynolds numbers and viscosity ratios was implemented, and the results were compared with the predicted drag coefficient by the Schiller-Naumann model. The pressure profile, the radial distribution of axial and
S. M. Hosseini et al. / CFD Simulation of the Parameters Affecting the Performance … 79
tangential velocities, and the separation efficiency were also calculated to help them with a better decision. They could reveal that the separation efficiency could be improved by about 10%, when a helical form of inlet was used. Several authors employed RSM model for turbulence modeling and Eulerian-Eulerian approach towards multiphase modeling to simulate the flow field in a de-oiling hydrocyclone (Maddahian, et al., 2011).
In addition, many authors have attempted to choose the appropriate model for describing flow parameters in the hydrocyclone and to provide the best match with experimental reported data (Grady, et al., 2003; Huang, 2005; Liu, et al., 2010; Liu, et al., 2012; Noroozi, et al., 2013; Schütz, et al., 2009; Souza, et al., 2012). Despite the various assessments conducted in this field, further investigations related to the influence of operating conditions still seem necessary.
This study focuses on the effects of inlet oil concentration, oil droplet diameter, and the inlet flow rate on the separation efficiency and flow behavior of a de-oiling hydrocyclone using CFD techniques. The numerical simulations were carried out on two-phase flow of oil and water in a reverse flow hydrocyclone using Reynolds stress model for turbulent modeling and Eulerian multiphase model for considering the interaction between the two phases.
2. 2. Simulation model
In this section, a brief explanation about the governing equations and important parameters of the simulation models are given. In the subsections, the multiphase flow model and turbulent model are stated to describe the interaction between the two phases. Finally, the numerical implementation and the solution strategy are illustrated subsequently.
2.1. Multiphase flow model
For modeling the two-phase flow behavior and interaction between oil droplets and continuous water phase, Eulerian multiphase model is employed in this study. In the Eulerian multiphase modeling, the mass and momentum conservation equations are written for each phase. Therefore, the velocity of each phase may be obtained separately, but a single pressure is shared by all the phases (Rusche, 2002). For incompressible fluids, the continuity and momentum equations for phase k are given in the following equations:
k k k k kvt
∂ (α ρ ) +∇.(α ρ ) = 0 ∂
�
(1)
( )kk k k k k k k k qk k k k lift ,k vm,kv v v p . R g F F Ft
∂ (α ρ ) +∇.(α ρ ) = −α ∇ + ∇ τ + + α ρ + + +∂
� � � �� � � �
(2)
where, ���is the stress-strain tensor of phase k:
2
3T
k k k k k k k kv v v I τ = α µ ∇ + ∇ − ∇. + α τ
� � �ɶ (3)
��, ��, and ��� are the volume fraction, density, and velocity of phase respectively. �� is the
external volume force, ��� �,� is the lift force, and ���,� is the virtual mass force; � stands for the
pressure shared by all the phases and � � represents the unit tensor. The interphase force term can be written as follows:
80 Iranian Journal of Oil & Gas Science and Technology, Vol. 4 (2015), No. 3
( )3
4
k q k D q k q kqk
k
C |v v | v vR
d
α α ρ − −=
� (4)
where, the subscripts “q” and “k” represent the primary and secondary phases respectively. Due to the assumption of no-slip condition on the particle surface, the empirical Schiller-Naumann correlation for the drag coefficient CD can be used in this case (Loth, 2008):
( )0 687241 0 15
0 44
.k
kD
. ReReC
.
+=
Re 1000
Re 1000k
k
≤>
(5)
The virtual mass effect is insignificant in the case of low density difference between the primary and secondary phases and the lift force is usually negligible compared to the drag force (Noroozi and Hashemabadi, 2011). Hence, due to these reasons and high computational costs, these extra terms are omitted. The breakup and coalescence of droplets are assumed to be negligible because of the low volume fraction of the secondary phase (oil) (Noroozi and Hashemabadi, 2009).
2.2. Turbulence Flow Model
The simulation of the high turbulent flow in hydrocyclone requires the basic equations of fluid dynamics combined with an adequate turbulence model to simulate the severe turbulency in the hydrocyclone. High streamline curvature, quick changes in strain rate, severe swirling conditions, and the existence of large eddies in the hydrocyclone cause the selection of the more accurate turbulent model named Reynolds stress turbulent model (RSM) (Mainza, et al., 2006; Souza, et al., 2000). The
turbulence stress tensor (kτɶ ) can be defined by (Grady, et al., 2003):
k k k ,ijRτ = −ρɶ (6)
In definition, Rk,ij represents the average value of the product of velocity fluctuation components in
two perpendicular directions. The differential equation, which is used to solve ,k ijR , is defined as
follows:
( ) ( )ij l ij T ,ij L,ij ij ij ij ijl
R v R D D P Ft x
∂ ∂αρ + αρ = + + + ϕ + ε +∂ ∂
(7)
where, the two terms on the left side of the above equation are the accumulation and conduction terms
respectively. The turbulent diffusion term (T ,ijD ) and molecular diffusion ( L,ijD ) terms are defined
by:
ijtT ,ij
l k l
RD C
x xµ
∂ µ∂= α ∂ σ ∂ (8)
ijL,ij
l l
RD
x x
∂ ∂= αµ ∂ ∂ (9)
where, tµ is the turbulent viscosity, Cµ is a constant, and σk is turbulent Prandtl number. The stress
production term ijP can be expressed as follows:
S. M. Hosseini et al. / CFD Simulation of the Parameters Affecting the Performance … 81
1 11 1
j iij i j
v vP R R
x x
∂ ∂= −ρα + ∂ ∂
(10)
The other terms ijϕ , ijε , and ijF are pressure strain, dissipation, and production of system rotation
respectively. Among the different correlations for pressure strain, the linear pressure strain correlation was used in this work.
3. Problem identification
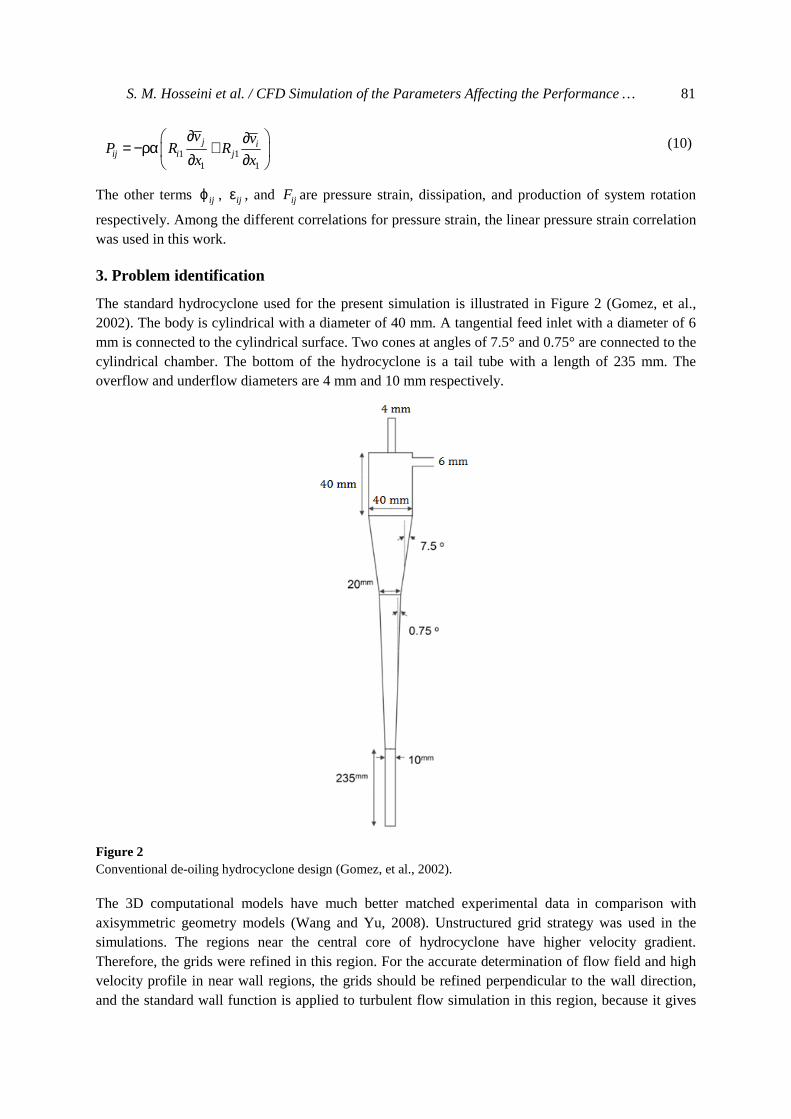
The standard hydrocyclone used for the present simulation is illustrated in Figure 2 (Gomez, et al., 2002). The body is cylindrical with a diameter of 40 mm. A tangential feed inlet with a diameter of 6 mm is connected to the cylindrical surface. Two cones at angles of 7.5° and 0.75° are connected to the cylindrical chamber. The bottom of the hydrocyclone is a tail tube with a length of 235 mm. The overflow and underflow diameters are 4 mm and 10 mm respectively.
Figure 2 Conventional de-oiling hydrocyclone design (Gomez, et al., 2002).
The 3D computational models have much better matched experimental data in comparison with axisymmetric geometry models (Wang and Yu, 2008). Unstructured grid strategy was used in the simulations. The regions near the central core of hydrocyclone have higher velocity gradient. Therefore, the grids were refined in this region. For the accurate determination of flow field and high velocity profile in near wall regions, the grids should be refined perpendicular to the wall direction, and the standard wall function is applied to turbulent flow simulation in this region, because it gives
82 Iranian Journal of Oil & Gas Science and Technology, Vol. 4 (2015), No. 3
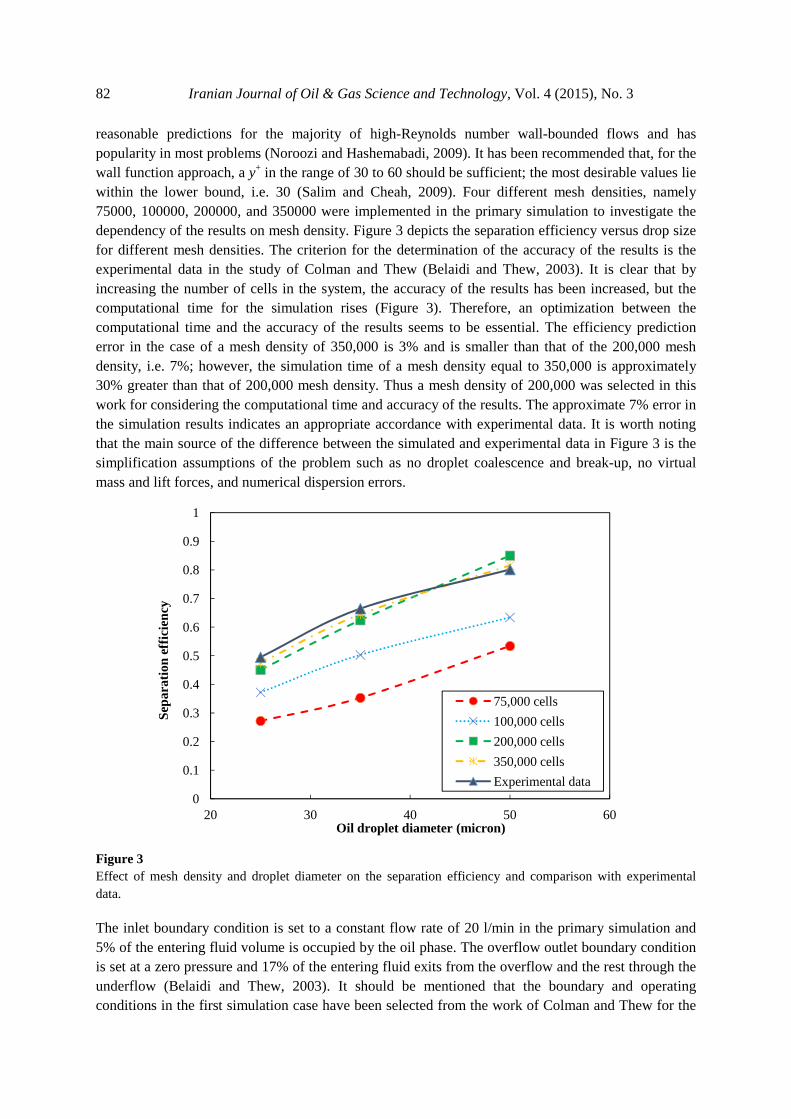
reasonable predictions for the majority of high-Reynolds number wall-bounded flows and has popularity in most problems (Noroozi and Hashemabadi, 2009). It has been recommended that, for the wall function approach, a y+ in the range of 30 to 60 should be sufficient; the most desirable values lie within the lower bound, i.e. 30 (Salim and Cheah, 2009). Four different mesh densities, namely 75000, 100000, 200000, and 350000 were implemented in the primary simulation to investigate the dependency of the results on mesh density. Figure 3 depicts the separation efficiency versus drop size for different mesh densities. The criterion for the determination of the accuracy of the results is the experimental data in the study of Colman and Thew (Belaidi and Thew, 2003). It is clear that by increasing the number of cells in the system, the accuracy of the results has been increased, but the computational time for the simulation rises (Figure 3). Therefore, an optimization between the computational time and the accuracy of the results seems to be essential. The efficiency prediction error in the case of a mesh density of 350,000 is 3% and is smaller than that of the 200,000 mesh density, i.e. 7%; however, the simulation time of a mesh density equal to 350,000 is approximately 30% greater than that of 200,000 mesh density. Thus a mesh density of 200,000 was selected in this work for considering the computational time and accuracy of the results. The approximate 7% error in the simulation results indicates an appropriate accordance with experimental data. It is worth noting that the main source of the difference between the simulated and experimental data in Figure 3 is the simplification assumptions of the problem such as no droplet coalescence and break-up, no virtual mass and lift forces, and numerical dispersion errors.
Figure 3 Effect of mesh density and droplet diameter on the separation efficiency and comparison with experimental data.
The inlet boundary condition is set to a constant flow rate of 20 l/min in the primary simulation and 5% of the entering fluid volume is occupied by the oil phase. The overflow outlet boundary condition is set at a zero pressure and 17% of the entering fluid exits from the overflow and the rest through the underflow (Belaidi and Thew, 2003). It should be mentioned that the boundary and operating conditions in the first simulation case have been selected from the work of Colman and Thew for the
0
0.1
0.2
0.3
0.4
0.5
0.6
0.7
0.8
0.9
1
20 30 40 50 60
Sepa
rati
on e
ffic
ienc
y
Oil droplet diameter (micron)
75,000 cells
100,000 cells
200,000 cells
350,000 cells
Experimental data
S. M. Hosseini et al. / CFD Simulation of the Parameters Affecting the Performance … 83
purpose of validating the results with the experimental data. Finally, no slip condition was assumed for the wall boundary conditions. Table 1 tabulates the inlet fluid specifications at 20 °C.
Table1 Inlet fluid specifications at 20 °C.
Fluid �� ��/�. �� �� ��/��� � ! (%)
Water 0.001 998 95
Oil 0.00332 850 5
For the purpose of investigating the effect of variable inlet conditions on the separation efficiency of the de-oiling hydrocyclone, the effects of different inlet flow rates, oil droplet sizes, and oil volume fractions were studied. All the simulations were conducted for an oil droplet diameter of 50 micron, except for the case of investigating the effect of drop size on the separation efficiency, in which different classes of particle sizes were used. It should be noted that in definition, the ratio of the exited oil volume from the overflow to the value of the inlet oil volume is called separation efficiency. This description is defined for every size classification of oil droplets available in the entering fluid.
4. Simulation strategy
In this paper, the behavior of oil-water two-phase flow was simulated. The simulations were carried out using transient solver due to the unsteady state nature of turbulent flows. Reynolds stress model (RSM) was adopted with the early mentioned considerations. In the numerical solution, the finite volume method was implemented for the discretization of differential equations. The coupling of the continuity and momentum equations was done by the SIMPLE algorithm, and the quadratic upstream interpolation for convective kinetics (QUICK) scheme was used for the interpolation of variables from cell centers to faces due to higher ability to consider swirling flows (Ko, et al., 2006; Udayabhaskar, et al., 2007). It should be mentioned that for better stability and lower computational time, at the beginning, the first order interpolation schemes were used and they were then changed to the second order after the convergence was achieved. The simulations were performed in 50,000-100,000 time steps to maintain the total run time of about 35 sec. The incremental time step was varied between 10-5 and 10-3sec during the simulation. This is due to maintaining the convergence criteria, when the interpolation schemes are altered from the first order accuracy to the second order. The convergence criteria were set to 10-5 for the accurate determination of continuity equation and 10-4 for the others. In addition to these convergence criteria, the oil volume fraction and fluid velocity at the outlets were plotted against time to find the beginning time of a steady state flow. At this time, the simulation variables became unchanged against time. Another important parameter for the determination of the converged results was the magnitude of mass balances, which was in order of 10-
5, when the simulation was stopped.
5. Results and discussion
5.1. First simulation case
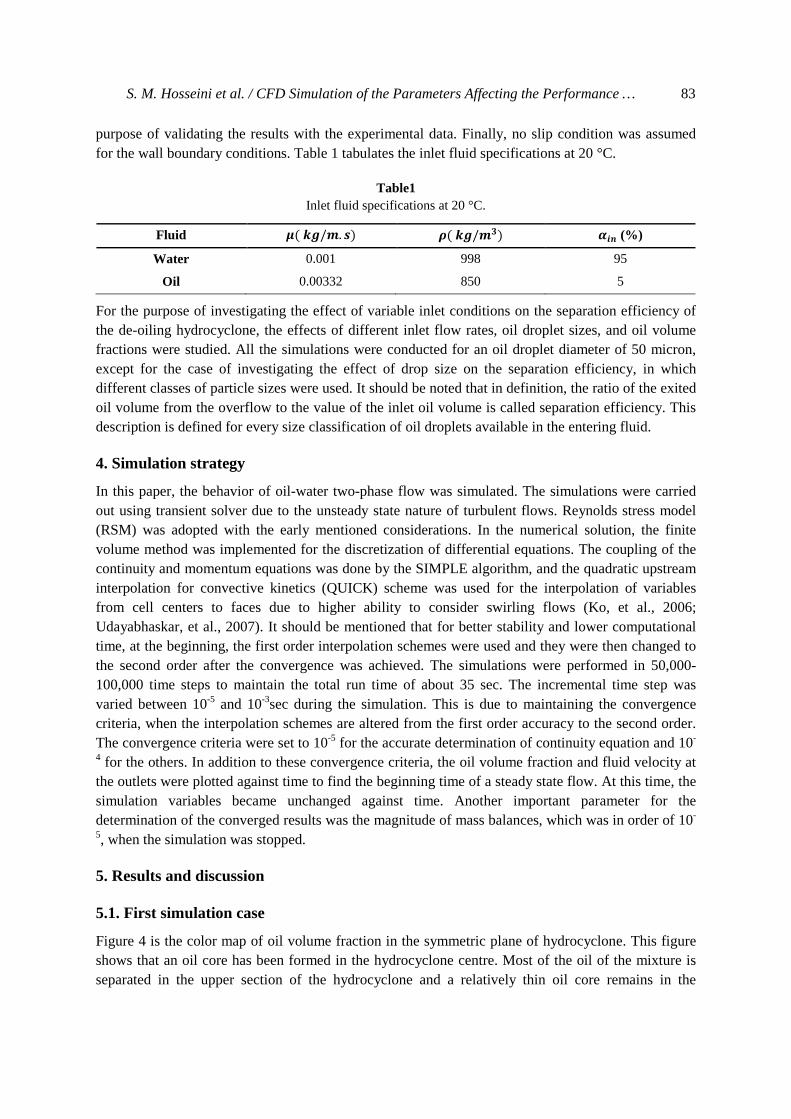
Figure 4 is the color map of oil volume fraction in the symmetric plane of hydrocyclone. This figure shows that an oil core has been formed in the hydrocyclone centre. Most of the oil of the mixture is separated in the upper section of the hydrocyclone and a relatively thin oil core remains in the
84 Iranian Journal of Oil & Gas Science and Technology,
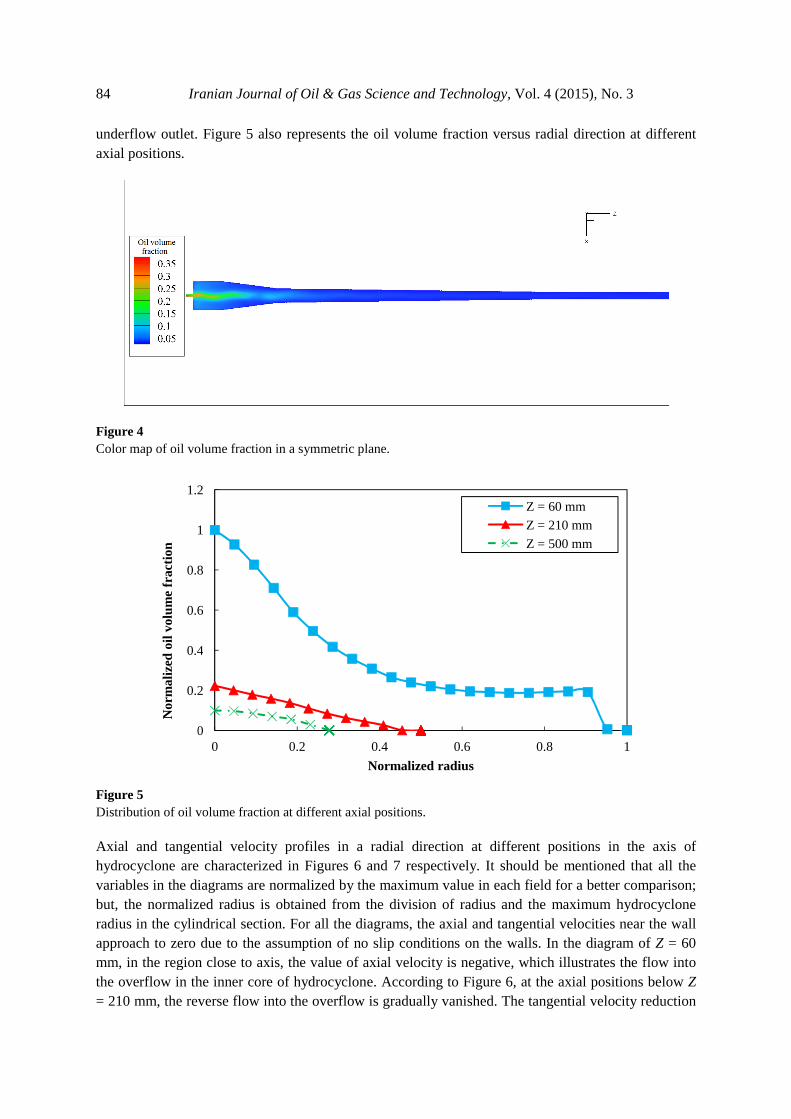
underflow outlet. Figure 5 also represents the oil volume fraction versus radial direction at different axial positions.
Figure 4 Color map of oil volume fraction in a symmetric plane.
Figure 5 Distribution of oil volume fraction
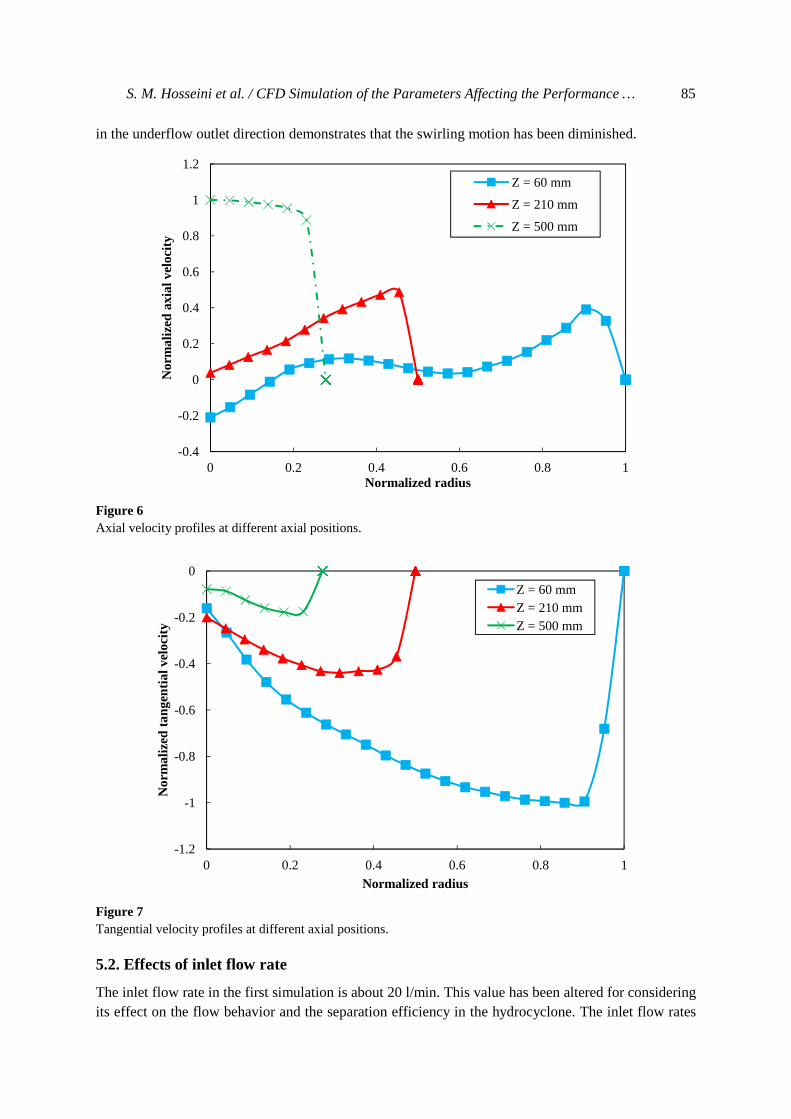
Axial and tangential velocity profiles in hydrocyclone are variables in the diagrams but, the normalized radius radius in the cylindrical section. For all approach to zero due to mm, in the region close the overflow in the inner core of hydrocyclone. According to Figure 6= 210 mm, the reverse flow into the overflow is gradually
0
0.2
0.4
0.6
0.8
1
1.2
Nor
mal
ized
oil
volu
me
frac
tion
Iranian Journal of Oil & Gas Science and Technology,
underflow outlet. Figure 5 also represents the oil volume fraction versus radial direction at different
Color map of oil volume fraction in a symmetric plane.
Distribution of oil volume fraction at different axial positions.
Axial and tangential velocity profiles in a radial direction at different positions in the axis of are characterized in Figures 6 and 7 respectively. It should be mentioned that all the
variables in the diagrams are normalized by the maximum value in each field for the normalized radius is obtained from the division of radius and t
cylindrical section. For all the diagrams, the axial and tangential velocities near the wall approach to zero due to the assumption of no slip condition
the region close to axis, the value of axial velocity is negativethe overflow in the inner core of hydrocyclone. According to Figure 6
the reverse flow into the overflow is gradually
0
0.2
0.4
0.6
0.8
1
1.2
0 0.2 0.4
Normalized radius
Iranian Journal of Oil & Gas Science and Technology, Vol. 4 (2015), No. 3
underflow outlet. Figure 5 also represents the oil volume fraction versus radial direction at different
different axial positions.
radial direction at different positions in the axis of characterized in Figures 6 and 7 respectively. It should be mentioned that all the
normalized by the maximum value in each field for a better comparisondivision of radius and the maximum hydrocyclone
diagrams, the axial and tangential velocities near the wall assumption of no slip conditions on the walls. In the diagram of
the value of axial velocity is negative, which illustrates the flow into the overflow in the inner core of hydrocyclone. According to Figure 6, at the axial positions below
the reverse flow into the overflow is gradually vanished. The tangential velocity reduction
0.6 0.8
Normalized radius
Z = 60 mm
Z = 210 mm
Z = 500 mm
), No. 3
underflow outlet. Figure 5 also represents the oil volume fraction versus radial direction at different
radial direction at different positions in the axis of characterized in Figures 6 and 7 respectively. It should be mentioned that all the
better comparison; he maximum hydrocyclone
diagrams, the axial and tangential velocities near the wall the walls. In the diagram of Z = 60
which illustrates the flow into at the axial positions below Z tangential velocity reduction
1
S. M. Hosseini et al. / CFD Simulation of the Parameters Affecting the Performance … 85
in the underflow outlet direction demonstrates that the swirling motion has been diminished.
Figure 6 Axial velocity profiles at different axial positions.
Figure 7 Tangential velocity profiles at different axial positions.
5.2. Effects of inlet flow rate
The inlet flow rate in the first simulation is about 20 l/min. This value has been altered for considering its effect on the flow behavior and the separation efficiency in the hydrocyclone. The inlet flow rates
-0.4
-0.2
0
0.2
0.4
0.6
0.8
1
1.2
0 0.2 0.4 0.6 0.8 1
Nor
mal
ized
axi
al v
eloc
ity
Normalized radius
Z = 60 mm
Z = 210 mm
Z = 500 mm
-1.2
-1
-0.8
-0.6
-0.4
-0.2
0
0 0.2 0.4 0.6 0.8 1
Nor
mal
ized
tan
gent
ial v
eloc
ity
Normalized radius
Z = 60 mmZ = 210 mmZ = 500 mm
86 Iranian Journal of Oil & Gas Science and Technology, Vol. 4 (2015), No. 3
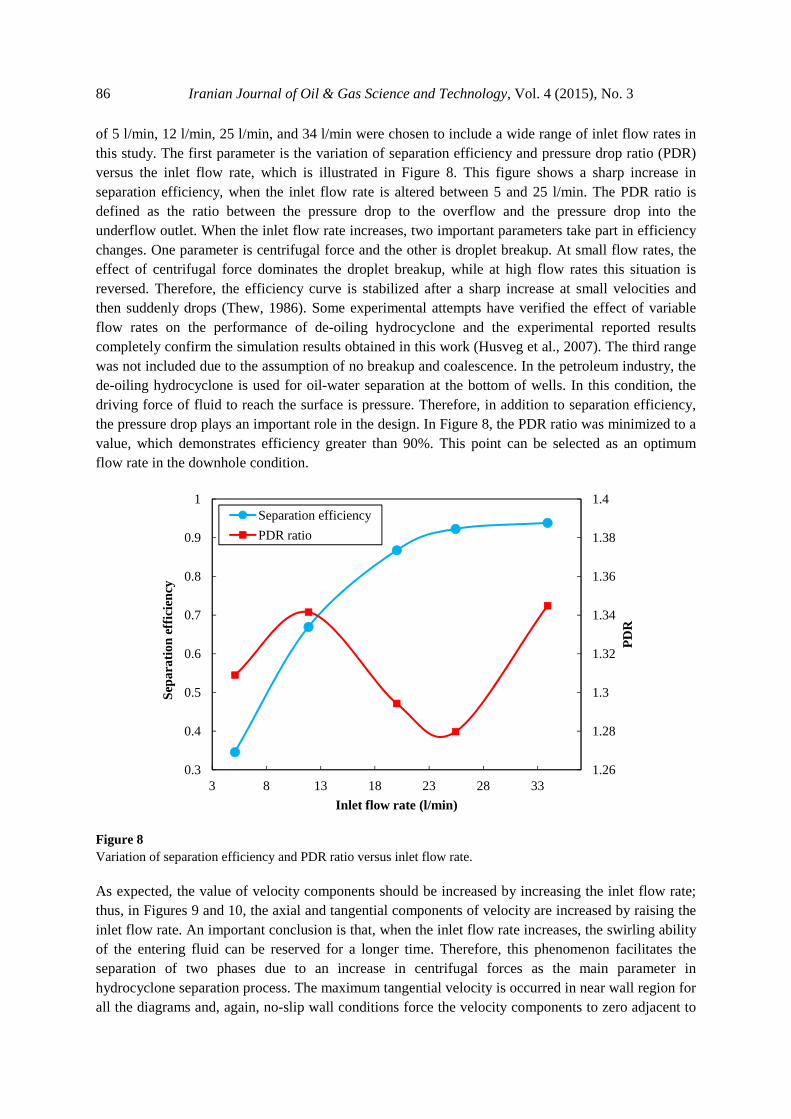
of 5 l/min, 12 l/min, 25 l/min, and 34 l/min were chosen to include a wide range of inlet flow rates in this study. The first parameter is the variation of separation efficiency and pressure drop ratio (PDR) versus the inlet flow rate, which is illustrated in Figure 8. This figure shows a sharp increase in separation efficiency, when the inlet flow rate is altered between 5 and 25 l/min. The PDR ratio is defined as the ratio between the pressure drop to the overflow and the pressure drop into the underflow outlet. When the inlet flow rate increases, two important parameters take part in efficiency changes. One parameter is centrifugal force and the other is droplet breakup. At small flow rates, the effect of centrifugal force dominates the droplet breakup, while at high flow rates this situation is reversed. Therefore, the efficiency curve is stabilized after a sharp increase at small velocities and then suddenly drops (Thew, 1986). Some experimental attempts have verified the effect of variable flow rates on the performance of de-oiling hydrocyclone and the experimental reported results completely confirm the simulation results obtained in this work (Husveg et al., 2007). The third range was not included due to the assumption of no breakup and coalescence. In the petroleum industry, the de-oiling hydrocyclone is used for oil-water separation at the bottom of wells. In this condition, the driving force of fluid to reach the surface is pressure. Therefore, in addition to separation efficiency, the pressure drop plays an important role in the design. In Figure 8, the PDR ratio was minimized to a value, which demonstrates efficiency greater than 90%. This point can be selected as an optimum flow rate in the downhole condition.
Figure 8 Variation of separation efficiency and PDR ratio versus inlet flow rate.
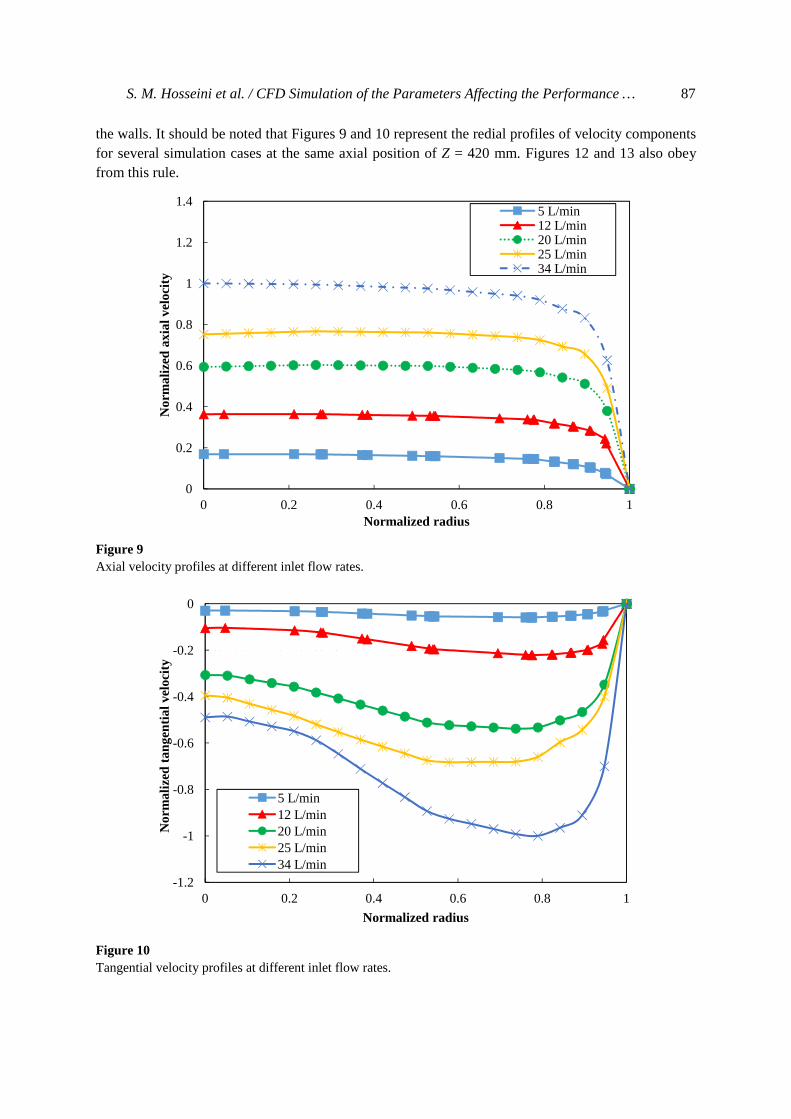
As expected, the value of velocity components should be increased by increasing the inlet flow rate; thus, in Figures 9 and 10, the axial and tangential components of velocity are increased by raising the inlet flow rate. An important conclusion is that, when the inlet flow rate increases, the swirling ability of the entering fluid can be reserved for a longer time. Therefore, this phenomenon facilitates the separation of two phases due to an increase in centrifugal forces as the main parameter in hydrocyclone separation process. The maximum tangential velocity is occurred in near wall region for all the diagrams and, again, no-slip wall conditions force the velocity components to zero adjacent to
1.26
1.28
1.3
1.32
1.34
1.36
1.38
1.4
0.3
0.4
0.5
0.6
0.7
0.8
0.9
1
3 8 13 18 23 28 33
PD
R
Sepa
rati
on e
ffic
ienc
y
Inlet flow rate (l/min)
Separation efficiency
PDR ratio
S. M. Hosseini et al. / CFD Simulation of the Parameters Affecting the Performance … 87
the walls. It should be noted that Figures 9 and 10 represent the redial profiles of velocity components for several simulation cases at the same axial position of Z = 420 mm. Figures 12 and 13 also obey from this rule.
Figure 9 Axial velocity profiles at different inlet flow rates.
Figure 10 Tangential velocity profiles at different inlet flow rates.
0
0.2
0.4
0.6
0.8
1
1.2
1.4
0 0.2 0.4 0.6 0.8 1
Nor
mal
ized
axi
al v
eloc
ity
Normalized radius
5 L/min12 L/min20 L/min25 L/min34 L/min
-1.2
-1
-0.8
-0.6
-0.4
-0.2
0
0 0.2 0.4 0.6 0.8 1
Nor
mal
ized
tan
gent
ial v
eloc
ity
Normalized radius
5 L/min12 L/min20 L/min25 L/min34 L/min
88 Iranian Journal of Oil & Gas Science and Technology, Vol. 4 (2015), No. 3
5.3. Effects of inlet oil volume fraction
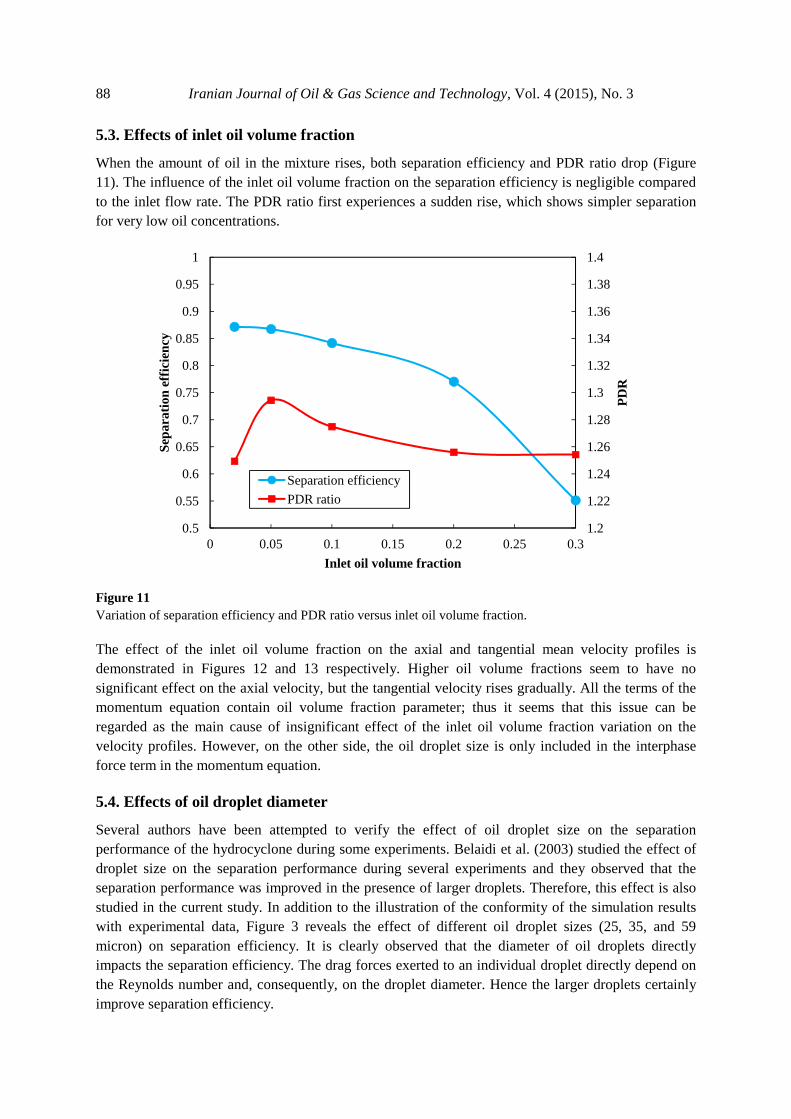
When the amount of oil in the mixture rises, both separation efficiency and PDR ratio drop (Figure 11). The influence of the inlet oil volume fraction on the separation efficiency is negligible compared to the inlet flow rate. The PDR ratio first experiences a sudden rise, which shows simpler separation for very low oil concentrations.
Figure 11 Variation of separation efficiency and PDR ratio versus inlet oil volume fraction.
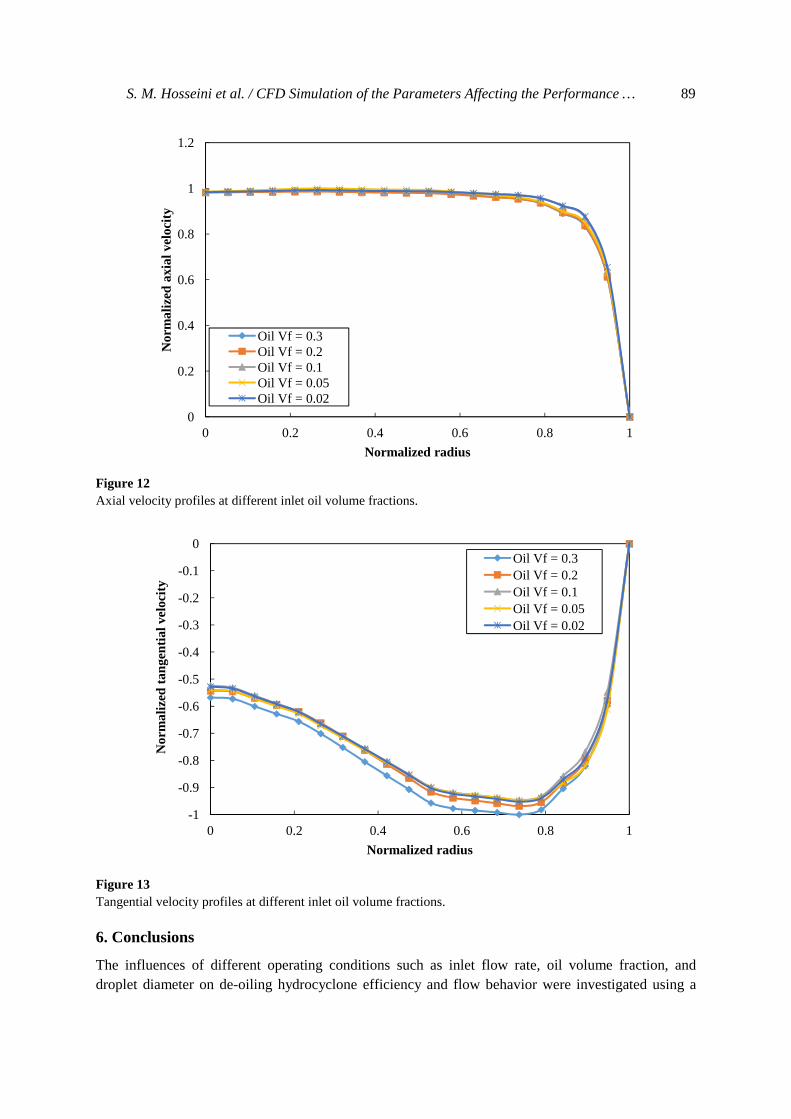
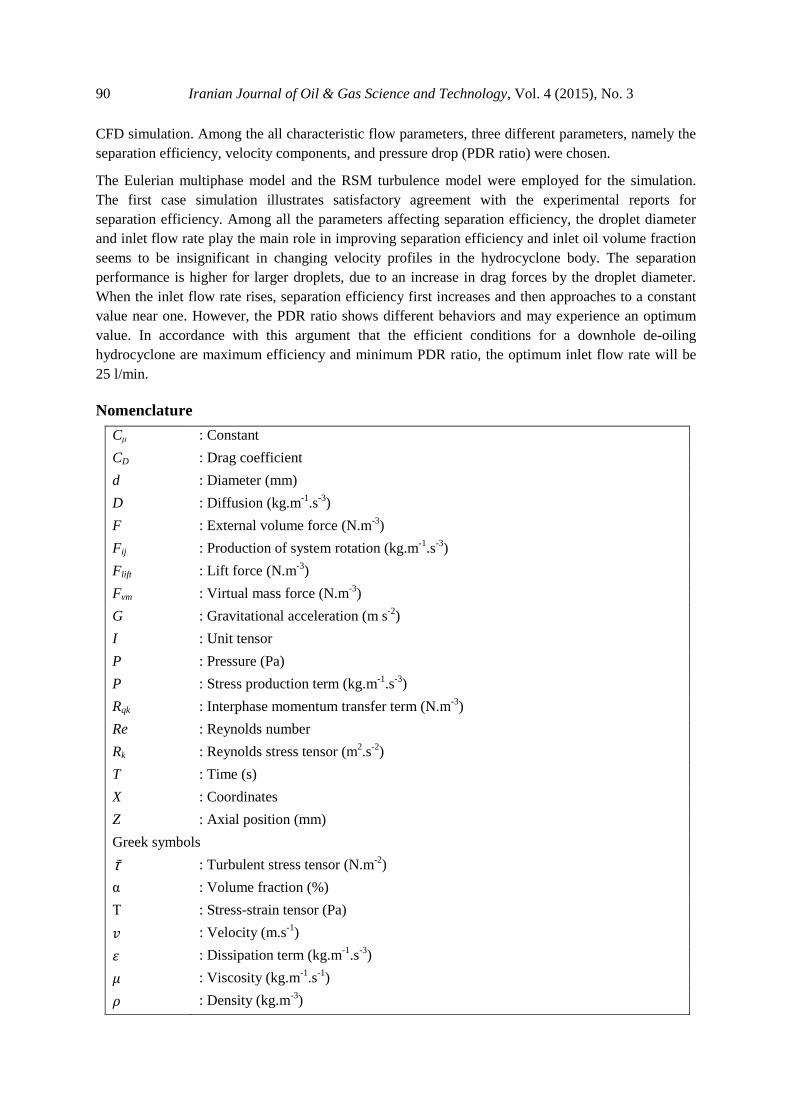
The effect of the inlet oil volume fraction on the axial and tangential mean velocity profiles is demonstrated in Figures 12 and 13 respectively. Higher oil volume fractions seem to have no significant effect on the axial velocity, but the tangential velocity rises gradually. All the terms of the momentum equation contain oil volume fraction parameter; thus it seems that this issue can be regarded as the main cause of insignificant effect of the inlet oil volume fraction variation on the velocity profiles. However, on the other side, the oil droplet size is only included in the interphase force term in the momentum equation.
5.4. Effects of oil droplet diameter
Several authors have been attempted to verify the effect of oil droplet size on the separation performance of the hydrocyclone during some experiments. Belaidi et al. (2003) studied the effect of droplet size on the separation performance during several experiments and they observed that the separation performance was improved in the presence of larger droplets. Therefore, this effect is also studied in the current study. In addition to the illustration of the conformity of the simulation results with experimental data, Figure 3 reveals the effect of different oil droplet sizes (25, 35, and 59 micron) on separation efficiency. It is clearly observed that the diameter of oil droplets directly impacts the separation efficiency. The drag forces exerted to an individual droplet directly depend on the Reynolds number and, consequently, on the droplet diameter. Hence the larger droplets certainly improve separation efficiency.
1.2
1.22
1.24
1.26
1.28
1.3
1.32
1.34
1.36
1.38
1.4
0.5
0.55
0.6
0.65
0.7
0.75
0.8
0.85
0.9
0.95
1
0 0.05 0.1 0.15 0.2 0.25 0.3
PD
R
Sepa
rati
on e
ffic
ienc
y
Inlet oil volume fraction
Separation efficiency
PDR ratio
S. M. Hosseini et al. / CFD Simulation of the Parameters Affecting the Performance … 89
Figure 12 Axial velocity profiles at different inlet oil volume fractions.
Figure 13 Tangential velocity profiles at different inlet oil volume fractions.
6. Conclusions
The influences of different operating conditions such as inlet flow rate, oil volume fraction, and droplet diameter on de-oiling hydrocyclone efficiency and flow behavior were investigated using a
90 Iranian Journal of Oil & Gas Science and Technology, Vol. 4 (2015), No. 3
CFD simulation. Among the all characteristic flow parameters, three different parameters, namely the separation efficiency, velocity components, and pressure drop (PDR ratio) were chosen.
The Eulerian multiphase model and the RSM turbulence model were employed for the simulation. The first case simulation illustrates satisfactory agreement with the experimental reports for separation efficiency. Among all the parameters affecting separation efficiency, the droplet diameter and inlet flow rate play the main role in improving separation efficiency and inlet oil volume fraction seems to be insignificant in changing velocity profiles in the hydrocyclone body. The separation performance is higher for larger droplets, due to an increase in drag forces by the droplet diameter. When the inlet flow rate rises, separation efficiency first increases and then approaches to a constant value near one. However, the PDR ratio shows different behaviors and may experience an optimum value. In accordance with this argument that the efficient conditions for a downhole de-oiling hydrocyclone are maximum efficiency and minimum PDR ratio, the optimum inlet flow rate will be 25 l/min.
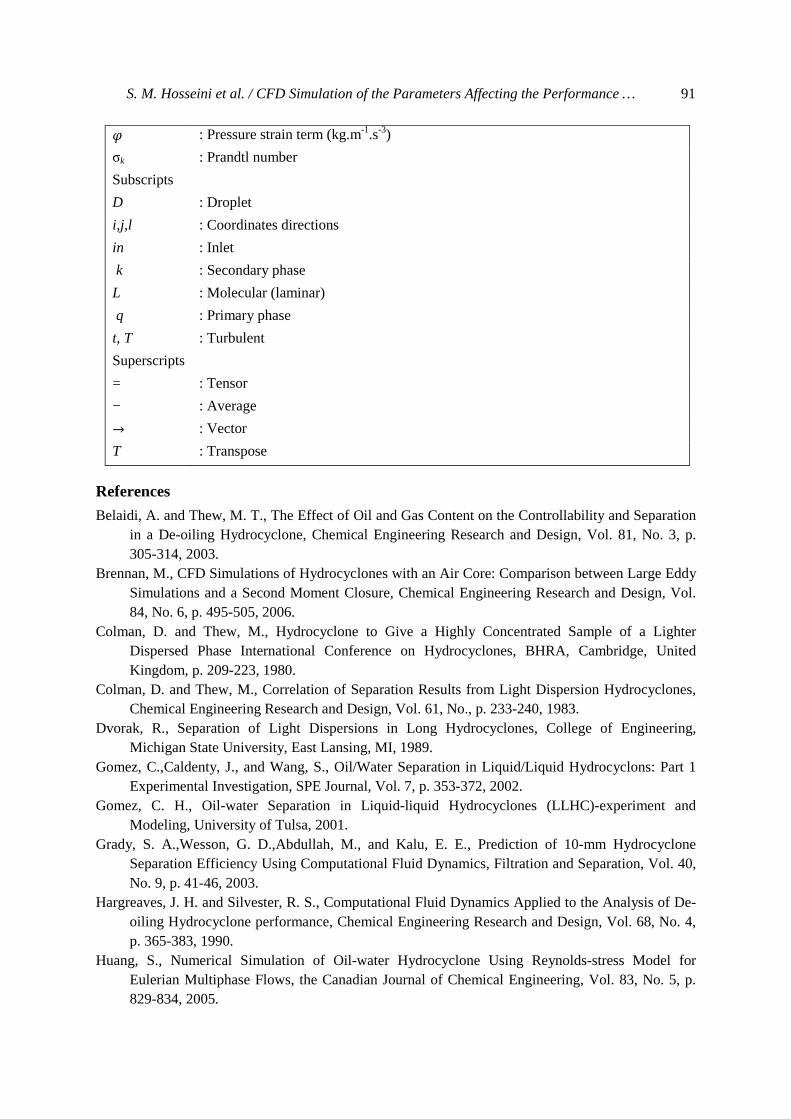
Nomenclature
Cµ : Constant
CD : Drag coefficient
d : Diameter (mm)
D : Diffusion (kg.m-1.s-3)
F : External volume force (N.m-3)
Fij : Production of system rotation (kg.m-1.s-3)
Flift : Lift force (N.m-3)
Fvm : Virtual mass force (N.m-3)
G : Gravitational acceleration (m s-2)
I : Unit tensor
P : Pressure (Pa)
P : Stress production term (kg.m-1.s-3)
Rqk : Interphase momentum transfer term (N.m-3)
Re : Reynolds number
Rk : Reynolds stress tensor (m2.s-2)
T : Time (s)
X : Coordinates
Z : Axial position (mm)
Greek symbols
τɶ : Turbulent stress tensor (N.m-2)
α : Volume fraction (%)
Τ : Stress-strain tensor (Pa)
� : Velocity (m.s-1)
" : Dissipation term (kg.m-1.s-3)
# : Viscosity (kg.m-1.s-1)
� : Density (kg.m-3)
S. M. Hosseini et al. / CFD Simulation of the Parameters Affecting the Performance … 91
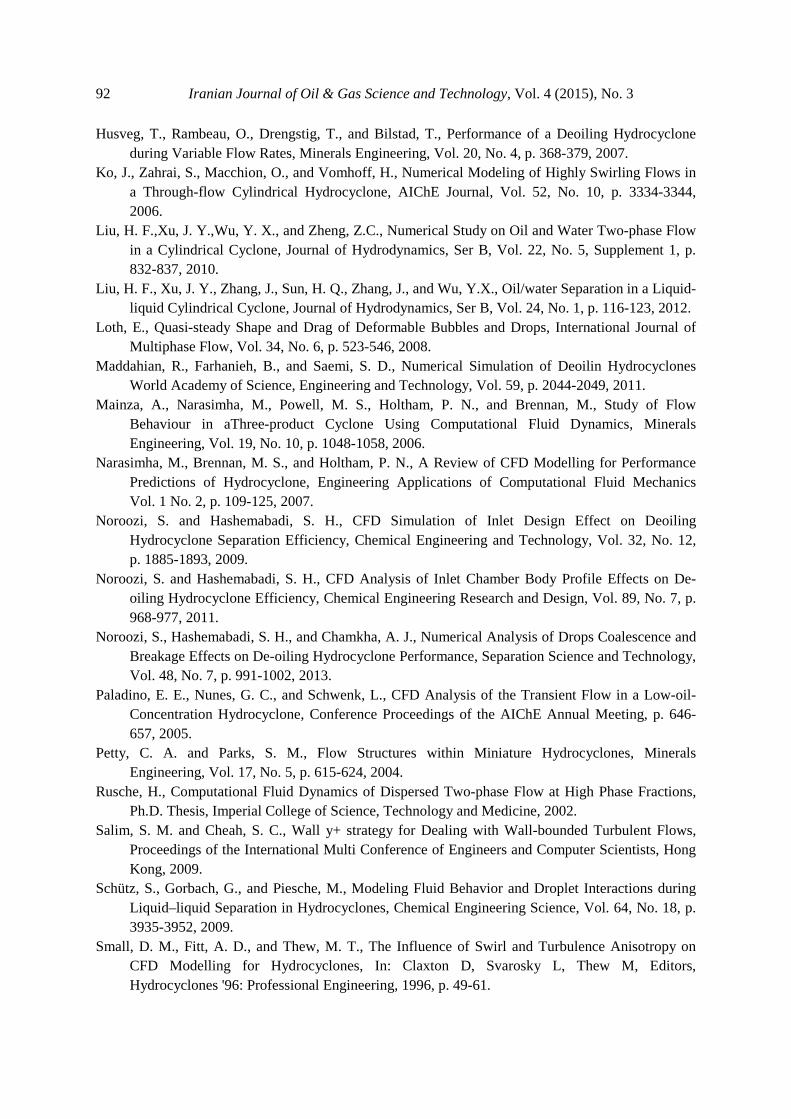
$ : Pressure strain term (kg.m-1.s-3)
σk : Prandtl number
Subscripts
D : Droplet
i,j,l : Coordinates directions
in : Inlet
k : Secondary phase
L : Molecular (laminar)
q : Primary phase
t, T : Turbulent
Superscripts
= : Tensor
− : Average
% : Vector
T : Transpose
References
Belaidi, A. and Thew, M. T., The Effect of Oil and Gas Content on the Controllability and Separation in a De-oiling Hydrocyclone, Chemical Engineering Research and Design, Vol. 81, No. 3, p. 305-314, 2003.
Brennan, M., CFD Simulations of Hydrocyclones with an Air Core: Comparison between Large Eddy Simulations and a Second Moment Closure, Chemical Engineering Research and Design, Vol. 84, No. 6, p. 495-505, 2006.
Colman, D. and Thew, M., Hydrocyclone to Give a Highly Concentrated Sample of a Lighter Dispersed Phase International Conference on Hydrocyclones, BHRA, Cambridge, United Kingdom, p. 209-223, 1980.
Colman, D. and Thew, M., Correlation of Separation Results from Light Dispersion Hydrocyclones, Chemical Engineering Research and Design, Vol. 61, No., p. 233-240, 1983.
Dvorak, R., Separation of Light Dispersions in Long Hydrocyclones, College of Engineering, Michigan State University, East Lansing, MI, 1989.
Gomez, C.,Caldenty, J., and Wang, S., Oil/Water Separation in Liquid/Liquid Hydrocyclons: Part 1 Experimental Investigation, SPE Journal, Vol. 7, p. 353-372, 2002.
Gomez, C. H., Oil-water Separation in Liquid-liquid Hydrocyclones (LLHC)-experiment and Modeling, University of Tulsa, 2001.
Grady, S. A.,Wesson, G. D.,Abdullah, M., and Kalu, E. E., Prediction of 10-mm Hydrocyclone Separation Efficiency Using Computational Fluid Dynamics, Filtration and Separation, Vol. 40, No. 9, p. 41-46, 2003.
Hargreaves, J. H. and Silvester, R. S., Computational Fluid Dynamics Applied to the Analysis of De-oiling Hydrocyclone performance, Chemical Engineering Research and Design, Vol. 68, No. 4, p. 365-383, 1990.
Huang, S., Numerical Simulation of Oil-water Hydrocyclone Using Reynolds-stress Model for Eulerian Multiphase Flows, the Canadian Journal of Chemical Engineering, Vol. 83, No. 5, p. 829-834, 2005.
92 Iranian Journal of Oil & Gas Science and Technology, Vol. 4 (2015), No. 3
Husveg, T., Rambeau, O., Drengstig, T., and Bilstad, T., Performance of a Deoiling Hydrocyclone during Variable Flow Rates, Minerals Engineering, Vol. 20, No. 4, p. 368-379, 2007.
Ko, J., Zahrai, S., Macchion, O., and Vomhoff, H., Numerical Modeling of Highly Swirling Flows in a Through-flow Cylindrical Hydrocyclone, AIChE Journal, Vol. 52, No. 10, p. 3334-3344, 2006.
Liu, H. F.,Xu, J. Y.,Wu, Y. X., and Zheng, Z.C., Numerical Study on Oil and Water Two-phase Flow in a Cylindrical Cyclone, Journal of Hydrodynamics, Ser B, Vol. 22, No. 5, Supplement 1, p. 832-837, 2010.
Liu, H. F., Xu, J. Y., Zhang, J., Sun, H. Q., Zhang, J., and Wu, Y.X., Oil/water Separation in a Liquid-liquid Cylindrical Cyclone, Journal of Hydrodynamics, Ser B, Vol. 24, No. 1, p. 116-123, 2012.
Loth, E., Quasi-steady Shape and Drag of Deformable Bubbles and Drops, International Journal of Multiphase Flow, Vol. 34, No. 6, p. 523-546, 2008.
Maddahian, R., Farhanieh, B., and Saemi, S. D., Numerical Simulation of Deoilin Hydrocyclones World Academy of Science, Engineering and Technology, Vol. 59, p. 2044-2049, 2011.
Mainza, A., Narasimha, M., Powell, M. S., Holtham, P. N., and Brennan, M., Study of Flow Behaviour in aThree-product Cyclone Using Computational Fluid Dynamics, Minerals Engineering, Vol. 19, No. 10, p. 1048-1058, 2006.
Narasimha, M., Brennan, M. S., and Holtham, P. N., A Review of CFD Modelling for Performance Predictions of Hydrocyclone, Engineering Applications of Computational Fluid Mechanics Vol. 1 No. 2, p. 109-125, 2007.
Noroozi, S. and Hashemabadi, S. H., CFD Simulation of Inlet Design Effect on Deoiling Hydrocyclone Separation Efficiency, Chemical Engineering and Technology, Vol. 32, No. 12, p. 1885-1893, 2009.
Noroozi, S. and Hashemabadi, S. H., CFD Analysis of Inlet Chamber Body Profile Effects on De-oiling Hydrocyclone Efficiency, Chemical Engineering Research and Design, Vol. 89, No. 7, p. 968-977, 2011.
Noroozi, S., Hashemabadi, S. H., and Chamkha, A. J., Numerical Analysis of Drops Coalescence and Breakage Effects on De-oiling Hydrocyclone Performance, Separation Science and Technology, Vol. 48, No. 7, p. 991-1002, 2013.
Paladino, E. E., Nunes, G. C., and Schwenk, L., CFD Analysis of the Transient Flow in a Low-oil-Concentration Hydrocyclone, Conference Proceedings of the AIChE Annual Meeting, p. 646-657, 2005.
Petty, C. A. and Parks, S. M., Flow Structures within Miniature Hydrocyclones, Minerals Engineering, Vol. 17, No. 5, p. 615-624, 2004.
Rusche, H., Computational Fluid Dynamics of Dispersed Two-phase Flow at High Phase Fractions, Ph.D. Thesis, Imperial College of Science, Technology and Medicine, 2002.
Salim, S. M. and Cheah, S. C., Wall y+ strategy for Dealing with Wall-bounded Turbulent Flows, Proceedings of the International Multi Conference of Engineers and Computer Scientists, Hong Kong, 2009.
Schütz, S., Gorbach, G., and Piesche, M., Modeling Fluid Behavior and Droplet Interactions during Liquid–liquid Separation in Hydrocyclones, Chemical Engineering Science, Vol. 64, No. 18, p. 3935-3952, 2009.
Small, D. M., Fitt, A. D., and Thew, M. T., The Influence of Swirl and Turbulence Anisotropy on CFD Modelling for Hydrocyclones, In: Claxton D, Svarosky L, Thew M, Editors, Hydrocyclones '96: Professional Engineering, 1996, p. 49-61.
S. M. Hosseini et al. / CFD Simulation of the Parameters Affecting the Performance … 93
Smyth, I., Thew, M., Debenham, P., and Colman, D., Mall-scale Experiments on Hydrocyclones for De-watering Light Oils, International Conference on Hydrocyclone, Cambridge, England, p. 189-208, 1980.
Souza, F. J., Vieira, L. G. M., Damasceno, J. J. R., and Barrozo, M. A. S., Analysis of the Influence of the Filtering Medium on the Behaviour of the Filtering Hydrocyclone, Powder Technology, Vol. 107, No. 3, p. 259-267, 2000.
Souza, J. S., Paiva, M. K. N., Farias, F. P. M., Farias Neto, S. R., and Lima, A. G. B., Hydrocyclone Applications in Produced Water: A Steady State Numerical Analysis, Brazilian Journal of Petroleum and Gas, Vol. 6, No. 3 p. 133-143, 2012.
Thew, M. T., Hydrocyclone Redesign for Liquid-liquid Separation, The Chemical Engineer, p. 17-23, 1986.
Udayabhaskar, K., Ramamurthy, Y., Ramakrishnan, N., Srivastava, J. K., Sarkar, S., and Kumar, V., CFD Validation for Flyash Particle Classification in Hydrocyclones, Minerals Engineering, Vol. 20, No. 3, p. 290-302, 2007.
Wang, B. and Yu, A. B., Numerical Study of the Gas–liquid–solid Flow in Hydrocyclones with Different Configuration of Vortex Finder, Chemical Engineering Journal, Vol. 135, No. 1-2, p. 33-42, 2008.
Young, G. A. B., Wakley, W. D., Taggart, D. L., Andrews, S. L., and Worrell, J. R., Oil-water Separation using Hydrocyclones: An Experimental Search for Optimum Dimensions, Journal of Petroleum Science and Engineering, Vol. 11, No. 1, p. 37-50, 1994.