The challenge of the sampling variance & A note on outlier treatment in EU-SILC Tim Goedemé, PhD Herman Deleeck Centre for Social Policy - University of Antwerp Net-SILC 3 FAO Rome, 2016-11-07
Transcript
The challenge of the sampling variance&A note on outlier treatment in EU-SILC
Tim Goedemé, PhD
Herman Deleeck Centre for Social Policy - University of AntwerpNet-SILC 3
FAO
Rome, 2016-11-07
2
Introduction
• Indicators should be statistically sound and robust
• Most attention to non-sampling errors & validity
• Also sampling errors are important
3
Presenter
Presentation Notes
Using a sample to observe the world around us, is in many ways similar to watching the world around us on the basis of … a picture. First of all, the more you zoom in on a detail, the more blurred the picture gets. The same is most of the time true for a sample estimate: zooming in on a specific subpopulation does not necessarily result in gaining much more insight into the details of the world around us, because our estimate will be less precise than for a larger subgroup. Second, for a picture, the quality of the method for taking the picture is crucial for the quality of the picture itself: the higher the resolution, the sharper the image will be. The same is true for sample estimates: the better the sample design ensures that all parts of the population are represented in the survey, the more precise the sample estimates will be. However, there is an important difference between using a picture for observing the world and using a sample for telling us how this world looks like: In the case of a picture it is easy to observe the precision of the image we get. This is not the case for a sample estimate: in that case there is only one way to find out the precision, that is: to calculate the sampling variance. And it is precisely because we cannot directly observe the precision of a sample estimate, that without an estimate of its precision, a point estimate is pointless.
4
5
6
• Statistics & samples are a powerful tool- Need limited number of observations- Point estimate and estimate of precision
However, without an estimate of its precision, a point estimate is pointless…
• … at least for evidence-based policy-making
Introduction
Presenter
Presentation Notes
In this presentation I focus on random error only. Of course there is also bias and non-random error. However, often the impact of this bias is much harder to estimate. Therefore, the mere fact of its existence should be no excuse for not to calculate the random error. Furthermore, if we present consistently standard errors and confidence intervals, users will be come also more cautious regarding non-random errors.
7
Introduction
• Sampling variance is challenging:
1. Monitoring2. Computation3. Communication
8
1. Monitoring
• The indicators should be sufficiently precise to observe small changes
- Advantage of panel data
• Much interest in (small) subpopulations (vulnerable groups, regional statistics, various breakdowns)
9
1. Monitoring
“Worryingly, 2014 figures show that now 11.1 per cent of the inhabitants of Flanders live in poverty. Last year, this was only 10.8 per cent.”
Standard error of change in poverty is about 1 p.p.
10
1. Monitoring
Source: Osier et al. 2013; EU-SILC 2011, own calculations
0.00.51.01.52.02.53.03.54.0
PL DE SI ES IT SE FI UK CZ HU FR EE CY LV AT MT BE NL DK EL SK LU PT BG IE RO LT
1/2 of 95% confidence interval AROPE (total population) and AROP60 (children), EU-SILC 2011
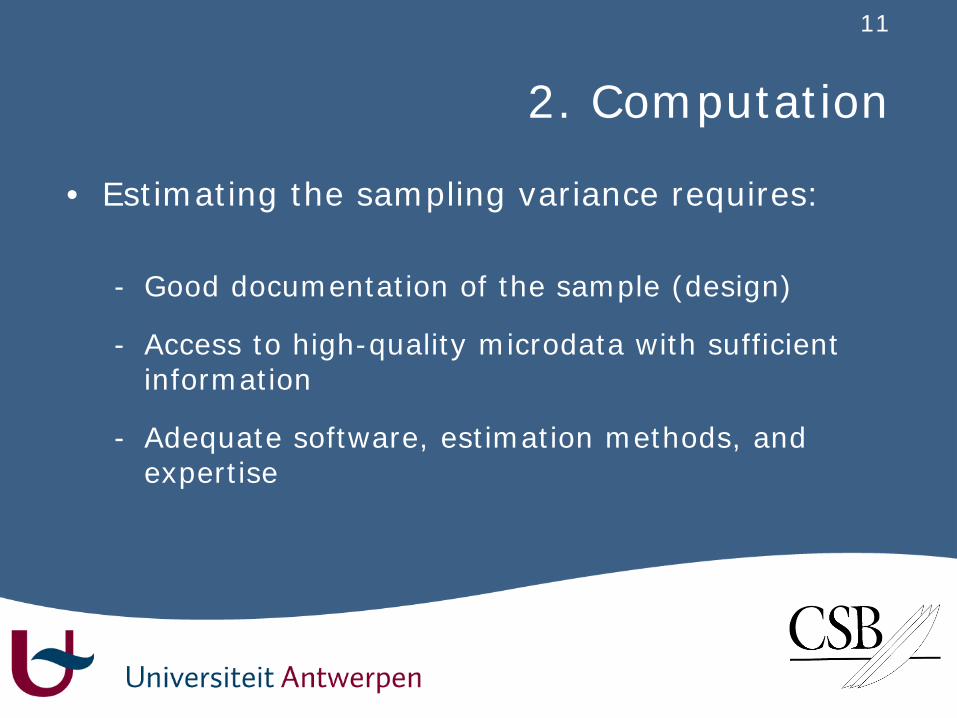
- Access to high-quality microdata with sufficient information
- Adequate software, estimation methods, and expertise
12
2. Computation
0
1
2
3
4
5
6
7
8
persons households full sample design
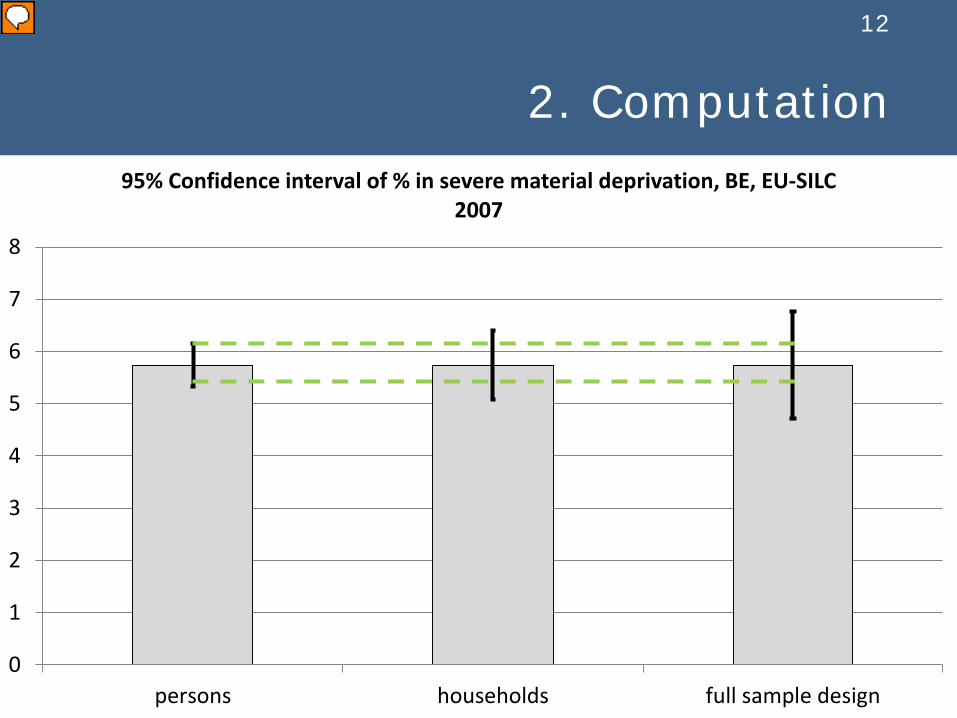
95% Confidence interval of % in severe material deprivation, BE, EU-SILC 2007
Presenter
Presentation Notes
Point: 5,74% Full / persons = 2,47 Full / households = 1,53 CI-arm: Persons: 0,4 Households: 0,7 Full: 1,02
13
2. Computation
1. Standard error of difference is much smaller with consistent SD variables.
2. Difference with 2011: the longer the time-span, the weaker the covariance (and the larger the standard error) will be
14
2. Computation
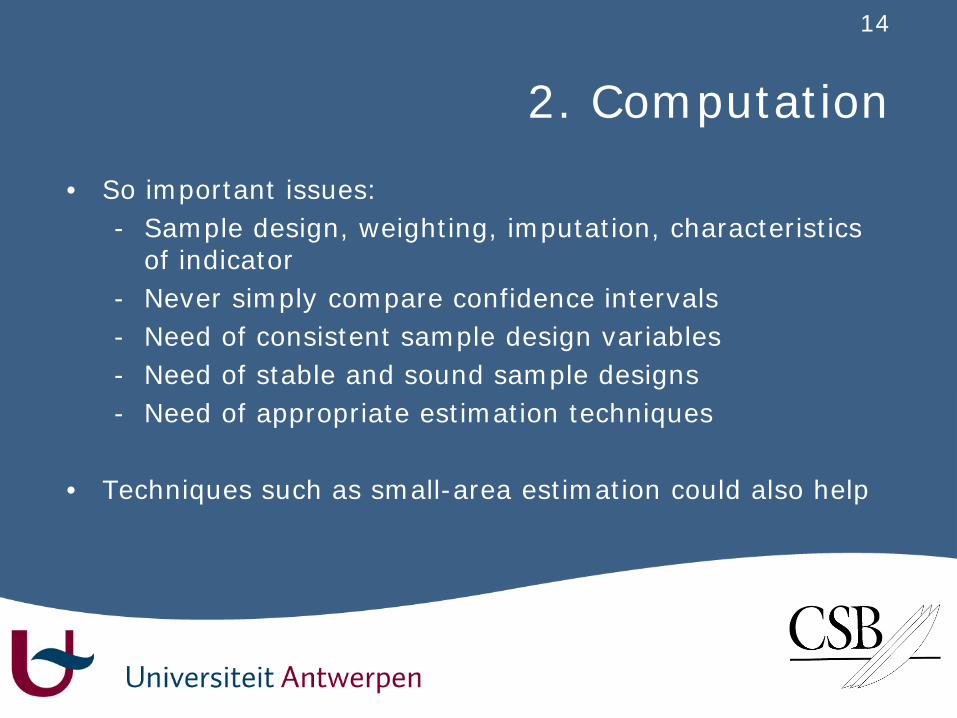
• So important issues:- Sample design, weighting, imputation, characteristics
of indicator- Never simply compare confidence intervals- Need of consistent sample design variables- Need of stable and sound sample designs- Need of appropriate estimation techniques
• Techniques such as small-area estimation could also help
15
3. Communication
• To policy-makers and politicians
• To the wider public
• For indicator databases such as RuLIS
• Improve awareness of both sampling and non-sampling errors
16
3. Communication
Informative value
Confidence interval > standard error
Standard error > degrees of freedom
Degrees of freedom > number of observations
17
3. Communication
• Develop tools to compute on line statistical significance of difference between point estimates?
- Invisible database with microdata - OR
- Invisible database with all var-covar matrices and DFs
- Users simply have to indicate which two figures they would like to compare
18
4. A note on outlier treatment
• (Undesirable) influential value
• Wrong value
• Can strongly reduce sampling variance (e.g. of poverty gap)
- No check of aggregates at individual level (e.g. totalincome)
- No check of other errors (not at extreme positions)?
Presenter
Presentation Notes
Can we learn something from EU-SILC? No. Mostly ex-post harmonised, in spite of attempts for ex ante harmonisation.
20
4. A note on outlier treatmentOutlier correction in EU-SILC 2015 (Net-SILC 3 survey)
21
4. A note on outlier treatment
• Strong variation in outlier detection and treatment
• More emphasis on trying to impute ‘correct’ value, e.g.:- Logical deduction / simulation models- Back to interviewers / data processing- Comparison with administrative records- Imputation based on multivariate regression models- Comparison with previous waves (panel data)
• Corrections through calibration
Presenter
Presentation Notes
No clear best practice!
22
4. A note on outlier treatment
• Previous EU-SILC study (Van Kerm, 2007):
- At aggregate level
- Winsorizing better than trimming
- Parametric modelling of tails promising approach
23
Conclusion
• The sampling variance is an important challenge to indicators for evidence-based policy-making
• Increases awareness of both sampling andnon-sampling errors
24
Conclusion
Outlier treatment• No clear best practice in EU-SILC
• Check on aggregates at individual level (e.g. totalincome / consumption):
- Still undesirable outliers- Accumulation of imputations?
• Sensitivity checks are key
Presenter
Presentation Notes
Potentially also invest in detecting ‘logical errors’.
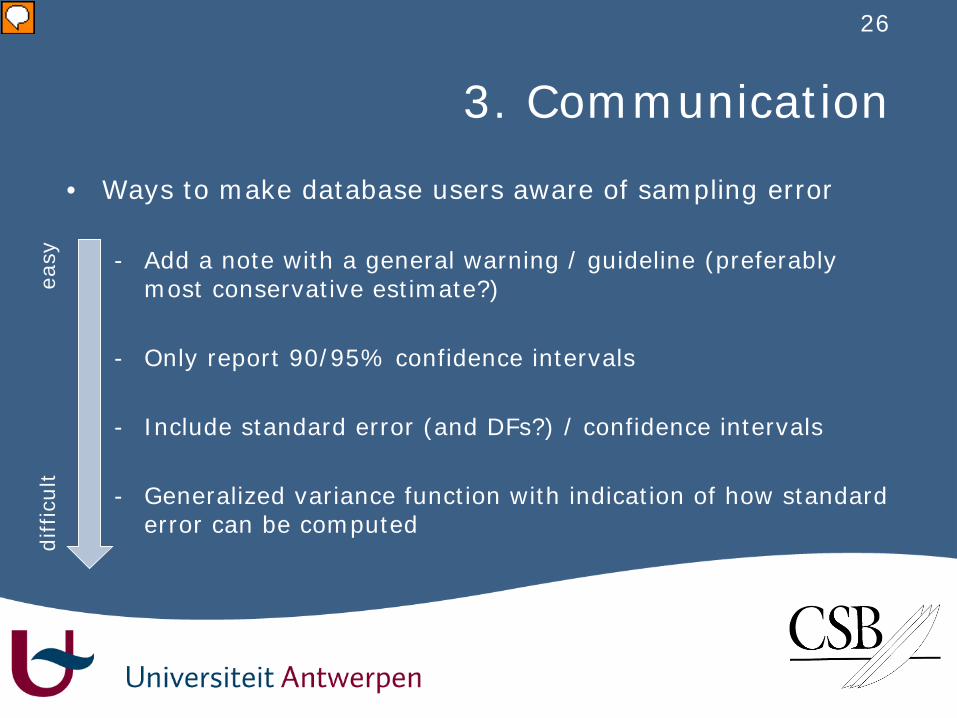
• Ways to make database users aware of sampling error
- Add a note with a general warning / guideline (preferably most conservative estimate?)
- Only report 90/95% confidence intervals
- Include standard error (and DFs?) / confidence intervals
- Generalized variance function with indication of how standard error can be computed
easy
diff
icul
t
Presenter
Presentation Notes
Same issues apply as in the case of readers of reports. However, less control here, and there may be a need for more detail. Always dual warning: precision of point estimates, precision of combinations of point estimates. The note requires some calculations on the part of Eurostat, but does not increase the weight of the database/burden for filling the database Including standard errors, and even more confidence intervals dramatically increases the number of figures to be included in the database, and possibly a new structure, because every table of point estimates should be accompanied with a table of standard errors & DFs or Confidence intervals Although it does not radically reduce the computational burden for Eurostat, a generalized variance function makes the need for structuring the database less strong (if the technique is not used for publishing standard errors and confidence intervals), but in that case the note becomes burdensome because it is very likely that one Eurostat table includes figures which cannot all be captured with one variance function (to be estimated at least separately for each country). Finally, given the degree of difficulty, some approaches may be better fit for some users of the online database than for others.