submitted papers A Chemometric Analysis of Ligand-Induced Changes in Intrinsic Fluorescence of Folate Binding Protein Indicates a Link Between Altered Conformational Structure and Physico-Chemical Characteristics SUSANNE W. BRUUN, JAN HOLM, STEEN INGEMANN HANSEN,* CHARLOTTE M. ANDERSEN, and LARS NØRGAARD The Structural Biology and NMR Laboratory, Department of Biology, University of Copenhagen. Ole Maaløes Vej 5, DK-2200 Copenhagen, Denmark (S.W.B.); Department of Clinical Biochemistry, Hillerød Hospital, Dyrehavevej 29, DK-3400 Hillerød, Denmark (J.H., S.I.H.); Faculty of Life Science, Department of Food Science, Quality and Technology, University of Copenhagen, Rolighedsvej 30, DK-1958 Frederiksberg, Denmark (C.M.A., L.N.) Ligand binding alters the conformational structure and physico-chemical characteristics of bovine folate binding protein (FBP). For the purpose of achieving further information we analyzed ligand (folate and methotrexate) -induced changes in the fluorescence landscape of FBP. Fluorescence excitation and emission two-dimensional (2D) spectra were recorded over a wide range of wavelengths on a Perkin-Elmer LS 55 spectrofluorometer at varying pH in different buffers, and the resulting three-dimensional data were subjected to a chemometric analysis, parallel factor analysis (PARAFAC). The most important finding was the occurrence of two maximum intensity emission wavelengths of tryptophan, 350 nm (compo- nent one) and 330 nm (component two). In contrast to the first component, the score of the short wavelength component increased with increasing ligation of FBP. Since the emission wavelengths of indole groups in tryptophan shorten with increasing distance from the solvent surface of proteins, an increasing number of the 11 tryptophan residues seem to re- orientate from the solvent surface to the interior of FBP with increasing ligation. The sharp decrease in hydrophobicity at pI ¼ 7–8 following binding of folate accords fairly well with the disappearance of strongly hydrophobic tryptophan residues from the solvent-exposed surface of FBP. The PARAFAC has thus proven useful to establish a hitherto unexplained link between parallel changes in conformational structure and physico-chemical characteristics of FBP induced by folate binding. Parameters for ligand binding derived from PARAFAC analysis of the fluorescence data were qualitatively and quantitatively similar to those obtained from binding of radiofolate to FBP. Herein, methotrexate exhibited a higher affinity for FBP than in competition with radiofolate. This could suggest a rapid and firm complexation of folate to FBP, blocking access of competing ligands. Index Headings: Folate binding protein; Methotrexate; Ligand binding; Changes in protein structure and hydrophobicity; Autofluorescence; Tryptophan residues; Excitation–emission matrix; EEM; Parallel factor analysis; PARAFAC. INTRODUCTION Fluorescence spectroscopy is a useful and powerful tool for monitoring changes in the intrinsic fluorescence of proteins undergoing conformational alterations. The intrinsic fluores- cence of a protein is mainly determined by three fluorophores, namely the aromatic amino acids, tryptophan, tyrosine, and phenylalanine, the former one with the highest intensity. Parallel factor analysis, PARAFAC, 1–3 is a mathematical model that can be applied to decompose three-dimensional data from fluorescence measurements to find the underlying fluorophores and the relationship between these and experimental design. We have applied the PARAFAC model to ligand-induced changes in intrinsic fluorescence of the high affinity folate binding protein (FBP), which has a remarkable and unique amino acid composition characterized by 11 tryptophans, 9 tyrosines, and 8 phenylalanines out of 222 amino acid residues. 4,5 This protein, present in most mammalian tissues and body fluids at nanomolar concentrations, seems to regulate homeostasis and intracellular trafficking of folate. 6–9 Anchored to the outer membrane of cells, FBP acts as a folate receptor (FR) internalizing folates, which play a critical role in cellular DNA synthesis and repair. 6–9 Spectroscopic studies have revealed that binding of folate induces changes in the secondary structure of bovine milk FBP. Thus, circular dichroism and infrared and near-infrared spectra show structural alterations in FBP consistent with a decrease in antiparallel b-strands and an increase in a-helix after ligation. 10,11 Folate binding also affects the quaternary structure (polymerization equilibrium) of FBP in a complex manner by enhancing the concentration-dependent aggregation of FBP at near-neutral pH 12,13 and converting the hydrophobic aggregates into hydrophilic aggregates. 14 Stopped-flow kinetic studies of the interaction between bovine FBP and folate have recently been performed at pH 5 and 7.4 by monitoring the decrease of intrinsic fluorescence. 15 The data confirmed the concept of a structural alteration of FBP induced by folate binding, which initially involved the fast formation of a rather weak complex (K ¼ 3.7 lM, pH 7.4; K ¼ 36 lM, pH 5.0) followed by a conformational change into a much tighter complex within milliseconds. 15 The combined Received 4 February 2009; accepted 3 September 2009. * Author to whom correspondence should be sent. E-mail: stha@noh. regionh.dk. Volume 63, Number 12, 2009 APPLIED SPECTROSCOPY 1315 0003-7028/09/6312-1315$2.00/0 Ó 2009 Society for Applied Spectroscopy
Transcript
submitted papers
A Chemometric Analysis of Ligand-Induced Changes in IntrinsicFluorescence of Folate Binding Protein Indicates a Link BetweenAltered Conformational Structure and Physico-ChemicalCharacteristics
SUSANNE W. BRUUN, JAN HOLM, STEEN INGEMANN HANSEN,*CHARLOTTE M. ANDERSEN, and LARS NØRGAARDThe Structural Biology and NMR Laboratory, Department of Biology, University of Copenhagen. Ole Maaløes Vej 5, DK-2200 Copenhagen,
Denmark (S.W.B.); Department of Clinical Biochemistry, Hillerød Hospital, Dyrehavevej 29, DK-3400 Hillerød, Denmark (J.H., S.I.H.); Facultyof Life Science, Department of Food Science, Quality and Technology, University of Copenhagen, Rolighedsvej 30, DK-1958 Frederiksberg,
Denmark (C.M.A., L.N.)
Ligand binding alters the conformational structure and physico-chemical
characteristics of bovine folate binding protein (FBP). For the purpose of
achieving further information we analyzed ligand (folate and methotrexate)
-induced changes in the fluorescence landscape of FBP. Fluorescence
excitation and emission two-dimensional (2D) spectra were recorded over a
wide range of wavelengths on a Perkin-Elmer LS 55 spectrofluorometer at
varying pH in different buffers, and the resulting three-dimensional data
were subjected to a chemometric analysis, parallel factor analysis
(PARAFAC). The most important finding was the occurrence of two
maximum intensity emission wavelengths of tryptophan, 350 nm (compo-
nent one) and 330 nm (component two). In contrast to the first component,
the score of the short wavelength component increased with increasing
ligation of FBP. Since the emission wavelengths of indole groups in
tryptophan shorten with increasing distance from the solvent surface of
proteins, an increasing number of the 11 tryptophan residues seem to re-
orientate from the solvent surface to the interior of FBP with increasing
ligation. The sharp decrease in hydrophobicity at pI¼7–8 following binding
of folate accords fairly well with the disappearance of strongly hydrophobic
tryptophan residues from the solvent-exposed surface of FBP. The
PARAFAC has thus proven useful to establish a hitherto unexplained link
between parallel changes in conformational structure and physico-chemical
characteristics of FBP induced by folate binding. Parameters for ligand
binding derived from PARAFAC analysis of the fluorescence data were
qualitatively and quantitatively similar to those obtained from binding of
radiofolate to FBP. Herein, methotrexate exhibited a higher affinity for FBP
than in competition with radiofolate. This could suggest a rapid and firm
complexation of folate to FBP, blocking access of competing ligands.
Index Headings: Folate binding protein; Methotrexate; Ligand binding;
Changes in protein structure and hydrophobicity; Autofluorescence;
Fluorescence spectroscopy is a useful and powerful tool formonitoring changes in the intrinsic fluorescence of proteins
undergoing conformational alterations. The intrinsic fluores-cence of a protein is mainly determined by three fluorophores,namely the aromatic amino acids, tryptophan, tyrosine, andphenylalanine, the former one with the highest intensity.Parallel factor analysis, PARAFAC,1–3 is a mathematical modelthat can be applied to decompose three-dimensional data fromfluorescence measurements to find the underlying fluorophoresand the relationship between these and experimental design.
We have applied the PARAFAC model to ligand-inducedchanges in intrinsic fluorescence of the high affinity folatebinding protein (FBP), which has a remarkable and uniqueamino acid composition characterized by 11 tryptophans, 9tyrosines, and 8 phenylalanines out of 222 amino acidresidues.4,5 This protein, present in most mammalian tissuesand body fluids at nanomolar concentrations, seems to regulatehomeostasis and intracellular trafficking of folate.6–9 Anchoredto the outer membrane of cells, FBP acts as a folate receptor(FR) internalizing folates, which play a critical role in cellularDNA synthesis and repair.6–9
Spectroscopic studies have revealed that binding of folateinduces changes in the secondary structure of bovine milk FBP.Thus, circular dichroism and infrared and near-infrared spectrashow structural alterations in FBP consistent with a decrease inantiparallel b-strands and an increase in a-helix afterligation.10,11 Folate binding also affects the quaternarystructure (polymerization equilibrium) of FBP in a complexmanner by enhancing the concentration-dependent aggregationof FBP at near-neutral pH12,13 and converting the hydrophobicaggregates into hydrophilic aggregates.14
Stopped-flow kinetic studies of the interaction betweenbovine FBP and folate have recently been performed at pH 5and 7.4 by monitoring the decrease of intrinsic fluorescence.15
The data confirmed the concept of a structural alteration of FBPinduced by folate binding, which initially involved the fastformation of a rather weak complex (K¼ 3.7 lM, pH 7.4; K¼36 lM, pH 5.0) followed by a conformational change into amuch tighter complex within milliseconds.15 The combined
Received 4 February 2009; accepted 3 September 2009.* Author to whom correspondence should be sent. E-mail: [email protected].
Volume 63, Number 12, 2009 APPLIED SPECTROSCOPY 13150003-7028/09/6312-1315$2.00/0
� 2009 Society for Applied Spectroscopy
decrease in intrinsic fluorescence and hydrophobicity inducedby folate binding in the above reported studies is in accord witha conformational change involving exposed hydrophobicfluorophores such as tryptophans. This theory finds somesupport in other studies, which showed sequence homologywith more than 30% identity between the residues 5-172 ofchicken riboflavin binding protein (RFBP) and FBP,16
particularly in the region close to the binding site of RFBP,where tryptophans play a major role. The plane of tryptophan156 in RFBP is thus in stacking contact with the ligand and fiveout of six tryptophans cluster in the vicinity.17
Changes in the conformational structure of FBP induced byligand binding could be of great physiological importance. Analtered structure of the ligated FBP, holo-FBP, might ‘‘wrapup’’ the ligand and thereby protect it from biologicaldegradation.18 The complex between folate and the FR onthe surface of the cell membrane is internalized viaendocytosis, then trafficks through endosomal compartments,and recycles back to the cell membrane after release of ligandinto the intracellular compartment.19 The process initiatingcycling/recycling of the ligated/unligated FR (holo/apo-FBP) isstill obscure, but it is a well-known fact that ligand binding tomany receptors is accompanied by conformational changes thatinitiate a sequence of biological processes. By analogy, onecould propose that ligation/unligation of FR and the confor-mational change associated with that process is the initial eventor signal that triggers FR cycling/recycling.
Herein an excitation–emission matrix (EEM) was obtainedfor studying changes in the intrinsic fluorescence of FBPinduced by folate binding under different experimentalconditions (pH, buffer type, and concentration of FBP).PARAFAC models were applied to identify and separate thecontributions from the underlying fluorophores. It was consid-ered of interest to employ the folate antagonist and cancerchemotherapeutic drug methotrexate as a ligand in someexperiments since the affinity of methotrexate for FR/FBPseems to be somewhat unresolved. A few experiments were alsoperformed to identify moieties in the folate/pteroylglutamatemolecule of particular importance for the interaction betweenligand and FBP. Furthermore, we compared parameters forligand affinity herein with those reported from our previousbinding studies with radiofolate in order to establish a direct linkbetween the binding process and altered conformation of FBP.
MATERIALS AND METHODS
Folate (pteroyl glutamate), methotrexate, pteroic acid, and 4-aminobenzoyl glutamate were supplied by Sigma.
Folate Binding Protein Purification. A large-scale purifi-cation of FBP from cow’s whey powder was performed aspreviously described4,5 by a combination of cation exchange
and methotrexate affinity chromatography. The purified proteinwas characterized with regard to primary and secondarystructure as well as ligand binding characteristics.4,5,12–14 AllFBP solutions were dialyzed against 0.2 M acetate buffer, pH3.5 at 4 8C to remove endogenous folate.13
A large-scale purification of FBP from human milk wasperformed by a separation procedure basically similar to thatemployed for bovine milk FBP.20
Sample Preparation for Spectroscopic Measurements.Folate binding protein stock solutions were prepared in fourdifferent buffer types: acetate (0.2 M) buffers of pH 3.5 and5.0, and phosphate buffers (0.2 M) of pH 5 and 7.4 Each FBPstock solution was mixed in the cuvette with a ligand solutionprepared in the same buffer type for obtaining samples withdifferent FBP and ligand concentrations.
Spectroscopic Measurements. Immediately after mixing,the samples were measured spectrofluorometrically at approx-imately 22 8C in a 10 by 10 mm quartz cuvette on a Perkin-Elmer LS55 spectrofluorometer. For every sample, an EEMwas obtained by measuring the emission spectra from 250 nmto 600 nm in 0.5 nm intervals with excitation every 5 nm from230 nm to 375 nm. The measurements started with the highestexcitation wavelength and ended with the lowest in order tominimize photodecomposition of the sample. The slit widthswere 8 nm and 4 nm for the excitation and emissionmonochromators, respectively. The scan speed was 800 nm/min. Fluorescence data were recorded in arbitrary units andwere corrected for the wavelength-dependent excitationintensity by an internal reference detector. The modelsdeveloped compare the inter-sample variation and therefore itis not necessary to correct the spectra.
Chemometric Analysis. The emission spectra collected foreach sample constitute a fluorescence landscape representingthe EEM. PARAFAC1–3 was applied to find the underlyingfluorophores in the fluorescence landscapes and the relation-ship between these and the experimental design. Ideally, thedata arranged in an I 3 J 3 K three-way array are low-ranktrilinear and thus suited for PARAFAC modeling. The firstindex (I) refers to the samples, the second (J) to the emissionwavelengths, and the third (K) to the excitation wavelengths.The PARAFAC model can be written as:
model gives one set of scores and two sets of loadings, one forexcitation and one for emission, where the loadings areestimates of the emission and excitation spectra, and the scoresare estimates of the relative concentration of the fluorescentcompound(s) or a fluorescent compound in different biologicalmatrices.
Software. The PARAFAC analyses were performed usingthe PLS Toolbox version 4.2.1 (Eigenvector Research Inc.,Manson, WA) running on a MATLAB version 7.7.0.471(R2008b) (The MathWorks, Natick, MA). The fluorescencespectra were transferred to MATLAB using an in-house routinewritten in MATLAB.
Two models were made: (1) a model for the low FBP (0.332lM) concentration included 38 samples, and (2) a modelcomparing low and high (1.66 lM) concentrations of FBP atpH 7.4 included 16 samples (see Table I). The number ofmodel components was determined from simultaneous inspec-tion of plots of loadings, residuals, and core consistency.21
RESULTS AND DISCUSSION
The Fluorescence Landscape (Excitation–Emission Ma-trix): Ligation of 0.332 lM Folate Binding Protein withFolate at pH 7.4. The present study shows that FBP exhibits
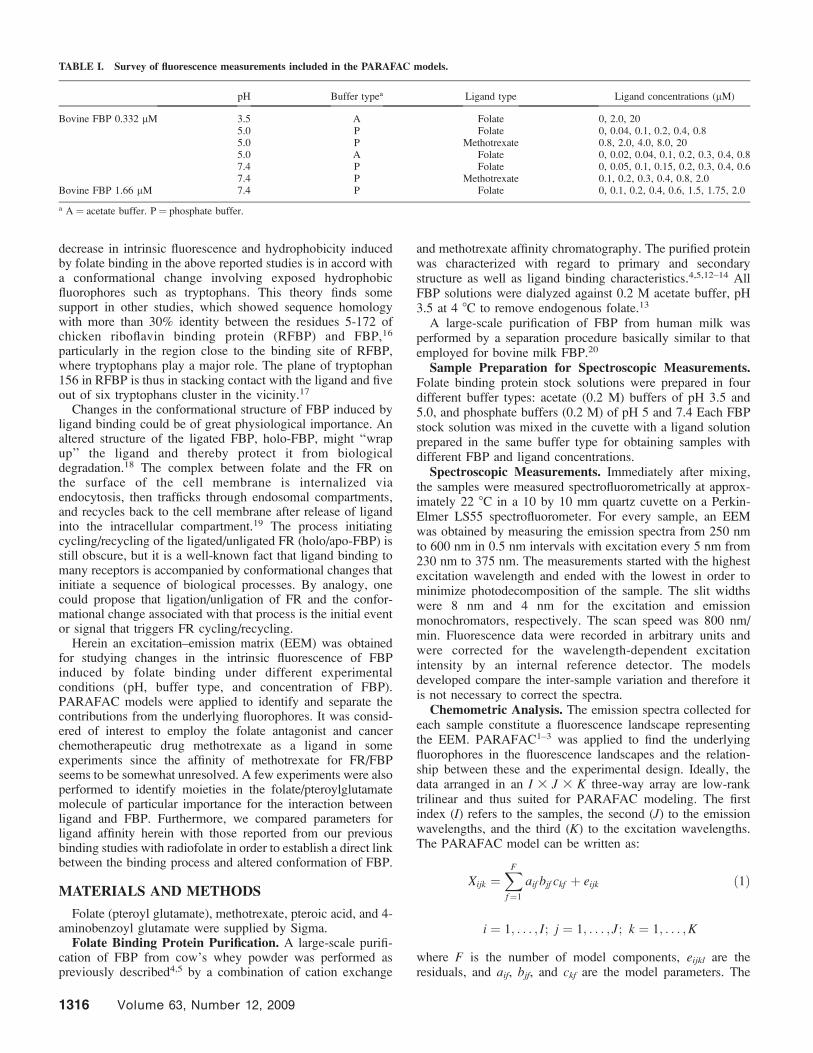
intrinsic fluorescence intensity even at rather modest (,1 lM)concentrations. The fluorescence landscape in Figs. 1a and 1brepresenting the three-dimensional excitation–emission matrix(EEM) at pH 7.4 clearly illustrates this point and shows adrastic decrease in fluorescence of FBP (80%) induced byexcess concentrations of folate. The fluorescence landscapes offolate and methotrexate (high concentrations) at pH 5.0 arecompared in Figs. 1c and 1d.
Parallel Factor Analysis: Ligation of 0.332 lM FolateBinding Protein with Folate and Methotrexate at DifferentpH Values in Different Buffers. Ligation of FBP with folateor folate analogues was performed under varying experimentalconditions (pH and buffer types), and the different types ofexperiments are summarized below and in Table I. Further-more, emission spectra for all ligands used herein wereobtained at the relevant pH values.
Components one and two in the model represent onefluorophore (tryptophan) in different molecular environments.
The two components in the four-component PARAFACmodel (Figs. 2a and 2b) exhibit emission maxima of 350 nm(component one) and 330 nm (component two) despite thepresence of only one maximum of excitation, 280 nm. Thesemaxima represent tryptophan fluorophores with different
FIG. 1. Fluorescence excitation–emission landscapes of 0.332 lM FBP samples at pH 7.4 (phosphate buffer): (a) no folate added; (b) with 0.6 lM folate added. Thelandscapes of (c) 10 lM folate and (d) 8 lM methotrexate at pH 5.0 are shown for comparison. Fluorescence intensity expressed in arbitrary units (A.U.). Note thedifferent scales in (a) and (b) vs. (c) and (d).
APPLIED SPECTROSCOPY 1317
emission properties and indicate that the intrinsic fluorescenceof FBP can be ascribed mainly to the 11 tryptophan residues.These residues constitute .5% of the FBP sequence, i.e., 4 to 5times the content in most proteins.22
Scores of the two components are shown in Figs. 3a and 3b.Ligand binding had opposite effects on the scores of the twocomponents since component two (short wavelength) seemedto achieve its maximum score in the fully ligated (holo) FBP,where component one exhibited its minimum score. This is aninteresting observation considering that the emission spectrumof the indole group in tryptophan depends on the location oftryptophan residues in proteins.23 Emission from exposedsurface tryptophans occurs at longer wavelengths than fromtryptophan residues in the interior of the protein.23 Thisphenomenon is illustrated by a shift of the tryptophan spectrumto a longer wavelength after unfolding of a protein andsubsequent exposure of tryptophan residues to the aqueousphase. Prior to unfolding, tryptophan residues are shieldedfrom the solvent by the folded protein.23 Likewise, unfoldingof bovine FBP increases intrinsic tryptophan fluorescence,which shifts to a longer wavelength.10 The altered conforma-tional structure of FBP after ligand binding is most likelyresponsible for the predominance of the short wavelength part(component two) of the emission maximum. The increase inthe score of component two (330 nm) matched by a paralleldecrease in the score of component one (350 nm) withincreasing ligation (Figs. 3a and 3b) suggests the re-orientationof some tryptophan residues from a location relatively close tothe solvent surface to the non-polar interior of FBP. The drasticdecrease in the hydrophobicity of FBP upon folate binding14 isalso in fair agreement with the disappearance of stronglyhydrophobic tryptophan residues located close to the surface ofFBP.
Component three represents the ligands as seen byinspection of Figs. 1c and 1d and Fig. 2a (emission maximaof 450–500 nm). These ligands are weak fluorophores and
hence only noticeable in the score plots of Fig. 3c with highligand concentrations (2 and 20 lM methotrexate and 20 lMfolate). Particularly high scores were obtained with methotrex-ate at pH 5.0.
Component four is not related to tryptophan, as seen fromthe emission and excitation wavelengths in Figs. 2a and 2b.This very small component (cf. the low score value in Fig. 3d)reflects a systematic structure that might arise from impurities,turbidity, or microbial contamination.
The two fluorophores of interest (component one and two)representing tryptophan were analyzed in Fig. 4, where thescores of component two were plotted versus the scores ofcomponent one. The inverse relationship between the scores ofthe two components is illustrated in plots showing ligation withfolate and methotrexate at pH 7.4 and folate at pH 5.0. Theplots with folate at pH 5.0 showed an almost linear increase inthe scores of component two with decreasing scores ofcomponent one. At pH 7.4, a decrease in the scores ofcomponent one resulted in a steep increase in the scores ofcomponent two leveling off into a far more gradual increase. Atnear-neutral pH, ligation with folate alters the quaternarystructure, i.e., the polymerization equilibrium of FBP, involv-ing enhancement of concentration-dependent aggregation ofFBP and conversion of the hydrophobic aggregates intohydrophilic aggregates.12–14 The difference between the plotsat pH 7.4 and 5.0 could reflect the above changes in thequaternary structure only taking place at near-neutral pH (pI).
Ligation of 1.66 lM FBP with folate at pH 7.4 wasmoreover investigated, and the fluorescence measurementsanalyzed in a two-component model (data not shown). Theresults obtained with the five times higher concentration ofFBP were qualitatively similar to those above.
Ligand Affinities for Folate Binding Protein Evaluatedfrom Component One and Two in the Score Plots. Ligandaffinities for FBP under varying experimental conditions wereevaluated from the score plots of Figs. 3a and 3b and compared
FIG. 2. Results from a four-component PARAFAC non-negativity constrained (in all three modes) model on 38 samples (0.332 lM FBP with or without theligands, folate, or methotrexate). (a) Emission loadings, (b) excitation loadings.
1318 Volume 63, Number 12, 2009
FIG. 3. Corresponding scores (Fig. 2) versus ligand concentration, lM. (a) Component 1, (b) component 2, (c) component 3, and (d) component 4. Note thatsamples without ligand added might be included in more than one plot.
FIG. 4. Relationship between component 2 (ordinate) and component 1 (abscissa), cf. Figs. 3a and 3b.
APPLIED SPECTROSCOPY 1319
to binding data from equilibrium dialysis studies with tritiated
folate.13
The binding affinity of folate for FBP at pH 3.5 is extremely
low and dissociation of folate already bound to FBP occurs
rapidly at this pH.13 As expected, virtually no change in the
scores of both components is observed at pH 3.5 despite
addition of a great excess of folate (20 lM folate/0.332 lM
FBP). This sharply contrasts the marked changes in both
components observed at 40-fold lower concentrations of folate
at pH 7.4 where binding affinity is high.13
The appearance of the score plots at pH 5.0 suggests a
slightly weaker effect of folate as compared to pH 7.4 where
component one intersects the abscissa at a lower concentration
(0.4 lM) of folate. At pH 5.0, binding of radiofolate to FBP
(,10 nM) depended critically on buffer type inasmuch as no
binding occurred in acetate buffer.11 However, at higher
concentrations (.0.2 lM) of FBP radiofolate bound just as
well in acetate buffer.24 As expected from the latter studies, the
buffer type at pH 5.0 (phosphate or acetate) had virtually no
influence on the appearance of the score plots at FBP
concentrations of 0.332 lM.
Methotrexate had a much weaker effect on the scores of both
components than folate (pH 7.4), in accord with binding
studies where methotrexate exhibited a lower affinity for FBP/
FR than folate.14 At pH 5.0 the effect of methotrexate appearedto be at least 10 times weaker than at neutral pH.
Comparison Between Parameters for Ligand AffinityEstimated from Score Values and by Direct Titration ofFolate Binding Protein with Radiofolate. The formation of acomplex between ligand (folate) and FBP resulting in aconformational change of the protein is a process completedwithin milliseconds.15 The present data are consistent herewithsince equilibrium between free ligand and ligand bound to FBPis achieved instantaneously as evidenced by repeated measure-ments over a period of 30 min in selected test samples. Theparameters for binding affinity of ligand S0.5 (concentration offree ligand at half saturation of FBP with ligand) wereestimated from the score values and when possible compared tothose previously determined by direct titration of FBP withradiolabelled ligand.
Figure 5 shows binding of folate to FBP (0.332 lM) at pH7.4 and illustrates how S0.5 was estimated from the score valuesin Figs. 3a and 3b. Both component one alone and the sum ofcomponent one and two were depicted as functions of total(free plus bound) concentration of folate. The decrease of bothparameters (ordinate) expresses increasing binding of folate toFBP along with the rise in concentration of folate (abscissa).The data were fitted to the Hill equation:25,26
Fraction bound ¼ ðF�KaÞh
1þ ðF�KaÞhð2Þ
where F is the free folate concentration in nM, Ka is theapparent association constant in nM�1 (Ka¼1/S0.5 (nM)), and his the Hill coefficient.26
Fraction bound is transformed to Scores by the equation
and S0.5 was adjusted to give the best fit to the observed data.There is an inverse relationship between the S0.5 value and theligand affinity.
Table II shows the S0.5 values for folate and methotrexate(0.332 lM FBP) estimated from the score values. Apart frommethotrexate at pH 7.4, the values obtained from componentone or the sum of components one and two are identical,reflecting the relatively small score values of component two.The S0.5 values for folate were either similar (pH 7.4)—or atleast of the same order of magnitude (pH 5.0)—compared tothose obtained from direct binding studies, i.e., 6.4 nM (0.22lM FBP) and 5.5 nM (0.18 lM FBP), respectively.27
For the sake of comparison, the score values for folate andmethotrexate at pH 7.4 were replaced by the measuredfluorescence intensities (wavelengths 345–355 nm) of FBP(0.332 lM). The decrease in fluorescence intensity withincreasing ligand concentrations was used to estimate S0.5
values as described above (cf. Fig. 5). The latter S0.5 valueswere identical to those estimated from the score values (datanot shown). This can be explained by the insignificantcontribution of components three and four to the fluorescenceat 345–355 nm.
The S0.5 values for the affinity of folate to 0.332 lM and1.66 lM FBP at pH 7.4 (cf. Table I) were estimated fromcomponent one in a two-component model. The S0.5 value at1.66 lM FBP was several-fold higher than that observed at the
FIG. 5. The sum of the scores of components 1 and 2 from Figs. 3a and 3b andthe score of component 1 from Fig. 3a were plotted against the total (free plusbound) concentration of ligand. This figure illustrates binding of folate to FBP(0.332 lM) at pH 7.4. The decrease in the score of component 1 (circles) andthe scores of the sum of the two components (triangles), ordinate, expressesincreasing folate binding to FBP with increasing folate concentration, abscissa.The data were fitted to the Hill equation.25,26 The value for the concentration offree folate at half saturation of binding, S0.5, was adjusted to give the best fit tothe observed data.
TABLE II. The sum of components 1 and 2 or component 1 alone(parenthesized when differing) from Figs. 3a and 3b were used to estimateligand affinity for FBP, S0.5 M (free ligand concentration at half saturationof binding) as described in Fig. 5. The FBP concentration was 0.332 lM.
five-fold lower FBP concentration, consistent with an apparentdecrease in ligand affinity (data not shown). The tendency to adecrease in apparent ligand affinity with increasing concentra-tions of FBP parallels previous studies on binding ofradiofolate.13,27 Unliganded (apo) FBP possesses a remarkableconcentration-dependent polymerization tendency at pI.12
Hence, the mechanism underlying the apparent decrease inaffinity with increasing FBP concentrations could be that thecomplex formation requires dissociation of (apo) FBPpolymers to monomers available for ligand binding.15 Thismeans that ligand affinity in terms of S0.5 can only be correctlydetermined at low (,1 nM) concentrations of (apo) FBP whereno polymerization occurs.12
Human tumor cells express high levels of FR, which is apromising target for antifolate drugs, e.g., methotrexate.28,29
Studies have demonstrated binding of tritiated methotrexate toFR on the cell surface, internalization of the FR–methotrexatecomplex into the cell, intracellular release, and subsequentbinding of methotrexate to the enzyme dihydrofolate reductaseinvolved in folate homeostasis.28,29 In the afore-mentionedbinding studies, the affinity of methotrexate for FR, 2–3 3 10�8
M, almost equal to minimum therapeutic concentration, was50-fold lower than that of folate.28,29 Herein, the affinity ofmethotrexate for FBP, 5–10 3 10�8 M, seemed to be 10 to 20fold lower than that of folate (Table II), whereas the affinity ofmethotrexate for FBP estimated from inhibitory potency onfolate binding was more than 200-fold lower than that offolate.14 The discrepancy between the affinity of methotrexatefor FBP in the absence of folate and in competition with folateis difficult to explain. It is possible that folate associates farmore rapidly with FBP than methotrexate and that theconformational change of FBP subsequent to folate bindingblocks the access of methotrexate or other competing ligands.
The affinity of methotrexate is markedly lower at pH 5.0 ascompared to neutral pH (Table II). This means thatmethotrexate traversing the cell membrane complexed to FRwill tend to dissociate inside the cell where pH is close to 5.0.
The released methotrexate exerts its biological effects bycompeting with endogenous folates for intracellular enzymesinvolved in folate homeostasis.
Identification of Moieties in the Folate/Pteroyl Gluta-mate Molecule Involved in Ligand–Folate Binding ProteinInteraction. Folate binding protein was exposed to excess (4lM) concentrations of 4-aminobenzoyl glutamate or pteroicacid at pH 7.4. Only pteroic acid was able to decrease intrinsicfluorescence (data not shown), suggesting that the pteridinering is of particular importance for the ligand–FBP interaction.
Comparison Between Intrinsic Fluorescence of Bovineand Human Folate Binding Protein. The emission spectra (at290 nm excitation) of bovine and human FBP purified frommilk are shown in Fig. 6. The spectra are qualitatively similar.Despite the fact that the concentration of bovine FBP (0.33lM) was 50% higher than that of human FBP (0.22 lM),maximum fluorescence intensity of bovine FBP only exceededthat of human FBP by 25%. This discrepancy is most likelydue to the greater number of tryptophan residues, i.e., 15, inhuman FBP.30
Ligation with excess of folate reduces intrinsic fluorescenceof both proteins markedly to a residual level. Only the ligatedspectrum of human FBP contains a broad peak with anemission maximum of 450 nm representing folate (cf. Fig. 1c)added at a concentration 25-fold higher than that employed forligation of bovine FBP.
CONCLUSION
The technique of fluorescence spectroscopy has provenuseful for monitoring changes in the intrinsic fluorescence ofproteins undergoing conformational alterations. Herein wehave analyzed changes in the fluorescence landscape of FBP ina PARAFAC model to identify the underlying fluorophoresand add novel information to our concept of the conformationalchanges occurring upon ligation. EEM and PARAFAC haveenabled us to identify two emission maxima of the mainfluorophore tryptophan and to show how ligand binding affectsthe ratio between them. The results indicate that thehydrophobic tryptophan residues re-orientate from the solventsurface to the hydrophobic interior of FBP upon ligation. Thesharp decrease in hydrophobicity following binding of folate toFBP is in accord with the disappearance of hydrophobic aminoacids from the solvent surface. We have thus been able toestablish a link between parallel changes in conformationalstructure and physico-chemical characteristics of FBP inducedby folate binding. To our knowledge, there are no previousreports in which EEM and PARAFAC have been applied toaddress ligand-induced alterations of protein conformation.The present study has thus underscored the potential of thismethod for this type of application.
1. R. A. Harshman, UCLA Working Papers in Phonetics 16, 1 (1970).2. R. Bro, Chemom. Intell. Lab. Syst. 38, 149 (1997).3. J. Christensen, L. Nørgaard, R. Bro, and S. B. Engelsen, Chem. Rev. 106,
1979 (2006).4. I. Svendsen, B. Martin, T. G. Pedersen, S. I. Hansen, J. Holm, and J.
Lyngbye, Carlsberg Res. Commun. 44, 89 (1979).5. I. Svendsen, S. I. Hansen, J. Holm, and J. Lyngbye, Carlsberg Res.
Commun. 49, 123 (1984).6. A. C. Antony, Annnu. Rev. Nutrit. 16, 501 (1996).7. A. C. Antony, Blood 79, 2807 (1992).8. G. B. Henderson, Annu. Rev. Nutrit. 10, 319 (1990).9. H. Elnakat and M. Ratnam, Front Biosci. 11, 506 (2006).
FIG. 6. A comparison between the fluorescence emission spectra of (left)human FBP, 0.224 lM and (right) bovine FBP, 0.332 lM in acetate buffer ofpH 5.0. Excitation at 290 nm. Human FBP, unligated (solid line) and ligatedwith 20 lM folate (dotted line); bovine FBP, unligated (solid line) and ligatedwith 0.8 lM folate (dotted line).
APPLIED SPECTROSCOPY 1321
10. N. C. Kaarsholm, A. M. Kolstrup, S. E. Danielsen, J. Holm, and S. I.
Hansen, Biochem. J. 292, 921 (1993).
11. S. W. Bruun, J. Holm, S. I. Hansen, and S. Jacobsen, Appl. Spectrosc. 60,737 (2006).
12. T. G. Pedersen, I. Svendsen, S. I Hansen, J. Holm, and J. Lyngbye,
Carlsberg Res. Commun. 45, 161 (1980).
13. S. I. Hansen, J. Holm, J. Lyngbye, T. G. Pedersen, and I. Svendsen, Arch.
Biochem. Biophys. 226, 636 (1983).
14. J. Holm, S. I. Hansen, and M. Høier-Madsen, Biosci. Rep. 21, 305 (2001).
15. U. Christensen, J. Holm, and S. I. Hansen, Biosci. Rep. 26, 291 (2006).
16. D. B. Zheng, H. M. Lim, J. J. Pene, and H. B. White III, J. Biol. Chem.
263, 11126 (1988).
17. H. L. Monaco, EMBO J. 16, 1475 (1997).
18. K. Sasaki, M. Natsuhori, M. Shimoda, Y. Saima, and E. Kokue, Am. J.
Physiol. 270, 105 (1996).
19. S. Sabharanjak and S. Mayor, Adv. Drug Deliv. Rev. 56, 1099 (2004).
20. I. Svendsen, S. I. Hansen, J. Holm, and J. Lyngbye, Carlsberg. Res.Commun. 47, 371 (1982).
21. C. M. Andersen and R. Bro, J. Chemom. 17, 200 (2003).22. J. R. Lakowicz, Principles of Fluorescence Spectroscopy (Kluwer
Academic/Plenum Publishers, New York, 1999), 2nd ed., Chap. 16, p.445.
23. J. R. Lakowicz, Principles of Fluorescence Spectroscopy (KluwerAcademic/Plenum Publishers, New York, 1999) 2nd ed., Chap. 1, p. 1.
24. J. Holm and S. I. Hansen, Biosci. Rep. 21, 745 (2001).25. G. Schwarz, Biophys. Struct. Mech. 2, 1 (1976).26. A. V. Hill, Biochem. J. 7, 471 (1913).27. J. Holm and S. I. Hansen, Biosci. Rep. 21, 733 (2001).28. B. A. Kamen and A. Capdevila, Proc. Natl. Acad. Sci. U.S.A. 83, 5983
(1986).29. M. A. Kane, R. M. Portillo, P. C. Elwood, A. C. Antony, and J. F.
Kolhouse, J. Biol. Chem. 261, 44 (1986).30. E. Sadasivan and S. P. Rothenberg, J. Biol. Chem. 264, 5806 (1989).