64
ACTIVATING AN ENERGY PARTNERSHIP FOR TUCSON? John Farrell February 18, 2015
| Date post: | 16-Jul-2015 |
| Category: |
Environment |
| Upload: | john-farrell |
| View: | 413 times |
| Download: | 0 times |

A C T I VAT I N G A N E N E R G Y PA R T N E R S H I P F O R T U C S O N ?
John Farrell February 18, 2015

H U G E P O T E N T I A L

POTENTIAL PERCENT OF POWER FROM LOCAL
RENEWABLES
100% or more 50 to 100% 25 to 50% 10 to 25% 10% or less
L O C A L R E N E W A B L E P O T E N T I A L
32 states - 100%+

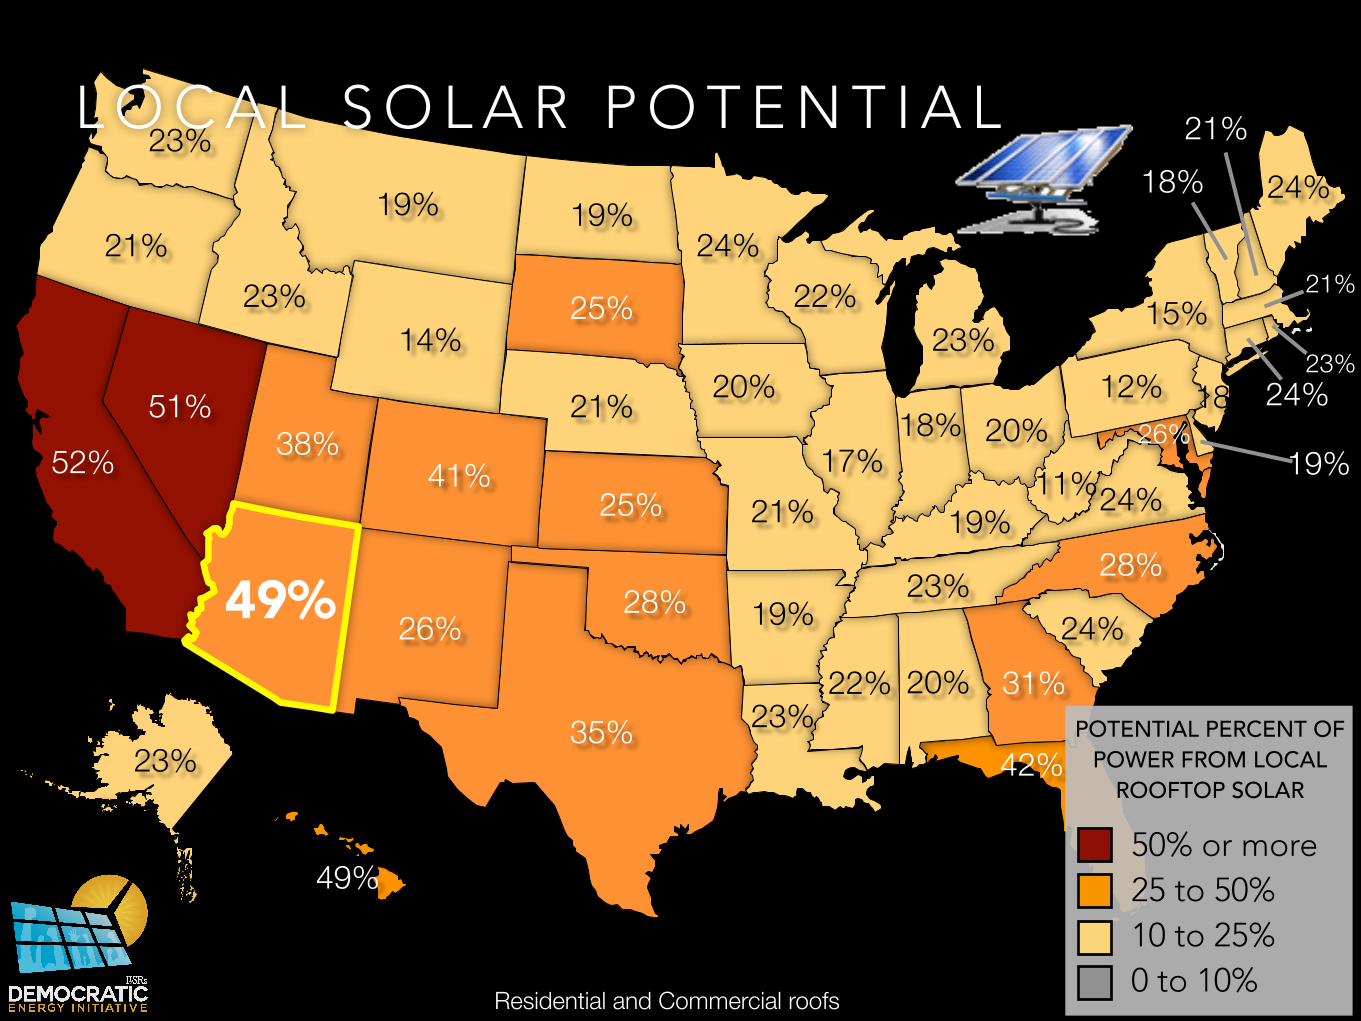
What percent of Arizona electricity could come from
rooftop solar alone?
I N T E R A C T I V E
20%
23%
49%
42%
31%
18%
23%
24%
19%
19%28%
23%
24%
24%
26%
21%
12%
11%52%51%
22%
23%
21%23%
19%
14%
38%41%
26%
35%
28%
19%
25%
21%
25%
24%
20%
22%
19%
23%
17%
23%
18% 20%
15%
24%
21%18%
Residential and Commercial roofs
L O C A L S O L A R P O T E N T I A L
POTENTIAL PERCENT OF POWER FROM LOCAL
ROOFTOP SOLAR
50% or more 25 to 50% 10 to 25% 0 to 10%
21%
49%

0¢
5¢
10¢
15¢
20¢
Residential Commercial Residential with ITC
Commercial with ITC
Prairie Fire Solar
Green Valley0¢
5¢
10¢
15¢
20¢
0¢
5¢
10¢
15¢
20¢
T U C S O N S O L A R AT PA R I T Y ?
cents per kilowatt-hour
U T I L I T Y ( T E P ) R AT E S M O D E L E D A C T U A L ( P I M A C O U N T Y )
30% tax credit
30% tax credit
NREL System Adivsor Model

$0
$3,000
$6,000
$9,000
$12,000
1982 1985 1988 1991 1994 1997 2000 2003 2006 2009 2012
Wind
SolarSource: Lawrence Berkeley Labs
A N D O N LY G E T T I N G B E T T E R
U.S. Installed Cost of Wind and Solar Power ($/kilowatt)

0¢
3¢
6¢
9¢
12¢
2004 2005 2006 2007 2008 2009 2010 2011 2012
R I S I N G AV E R A G E R E TA I L E L E C T R I C I T Y P R I C E S I N T U C S O N
¢ per kilowatt-hourSource: EIA
+2.8% per year since 2008

But rates = bills

W H AT W I L L B E A D D E D ?
C U M U L AT I V E C A PA C I T Y A D D I T I O N S T U C S O N E L E C T R I C P O W E R ( T E P ) 2 0 1 4 R E F E R E N C E P L A N
0
500
1000
1500
2000
2500
2014 2015 2016 2017 2018 2019 2020 2021 2022 2023 2024 2025 2026 2027 2028
TEP 2014 IRP, p26

C I T Y- U T I L I T Y D I S S O N A N C E

Are you Canadian?
I N T E R A C T I V E

Owned by Canadian
company, Fortis Governed by AZ Corporation Commission

M I L L I O N T O N S O F G H G E M I S S I O N S
4
5
6
7
8
1988 1990 1992 1994 1996 1998 2000 2002 2004 2006 2008 2010
T U C S O N C L I M AT E P R O B L E M
Other 40% Tucson Electric
Power 60%
Sources: Pima County GHG Inventory, TEP 2014 IRP
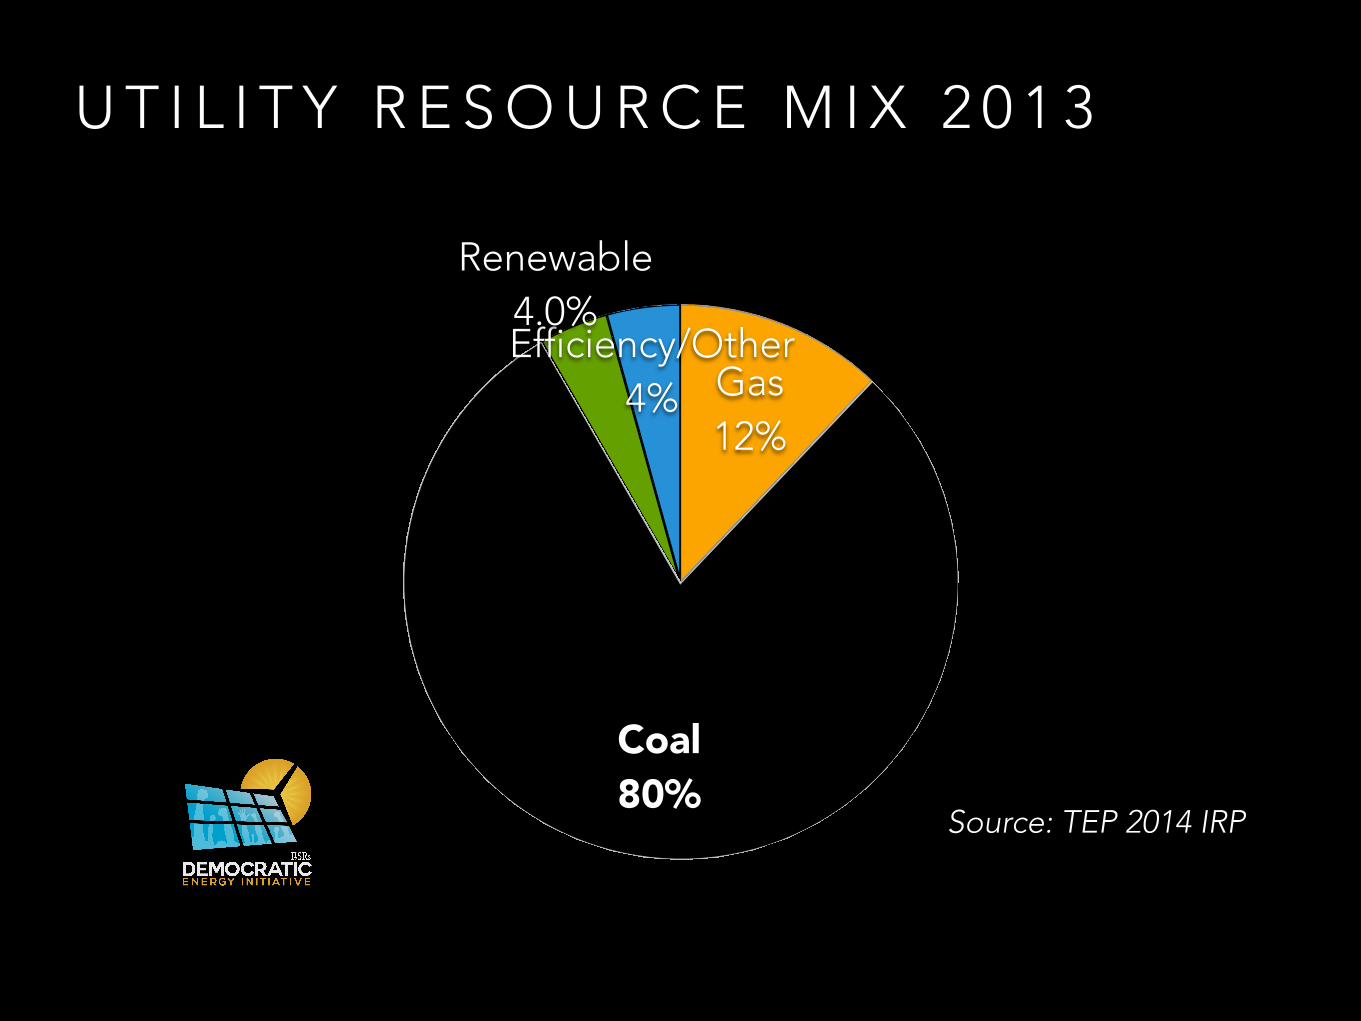
U T I L I T Y R E S O U R C E M I X 2 0 1 3
Efficiency/Other 4%
Renewable 4.0%
Coal 80%
Gas 12%
Source: TEP 2014 IRP
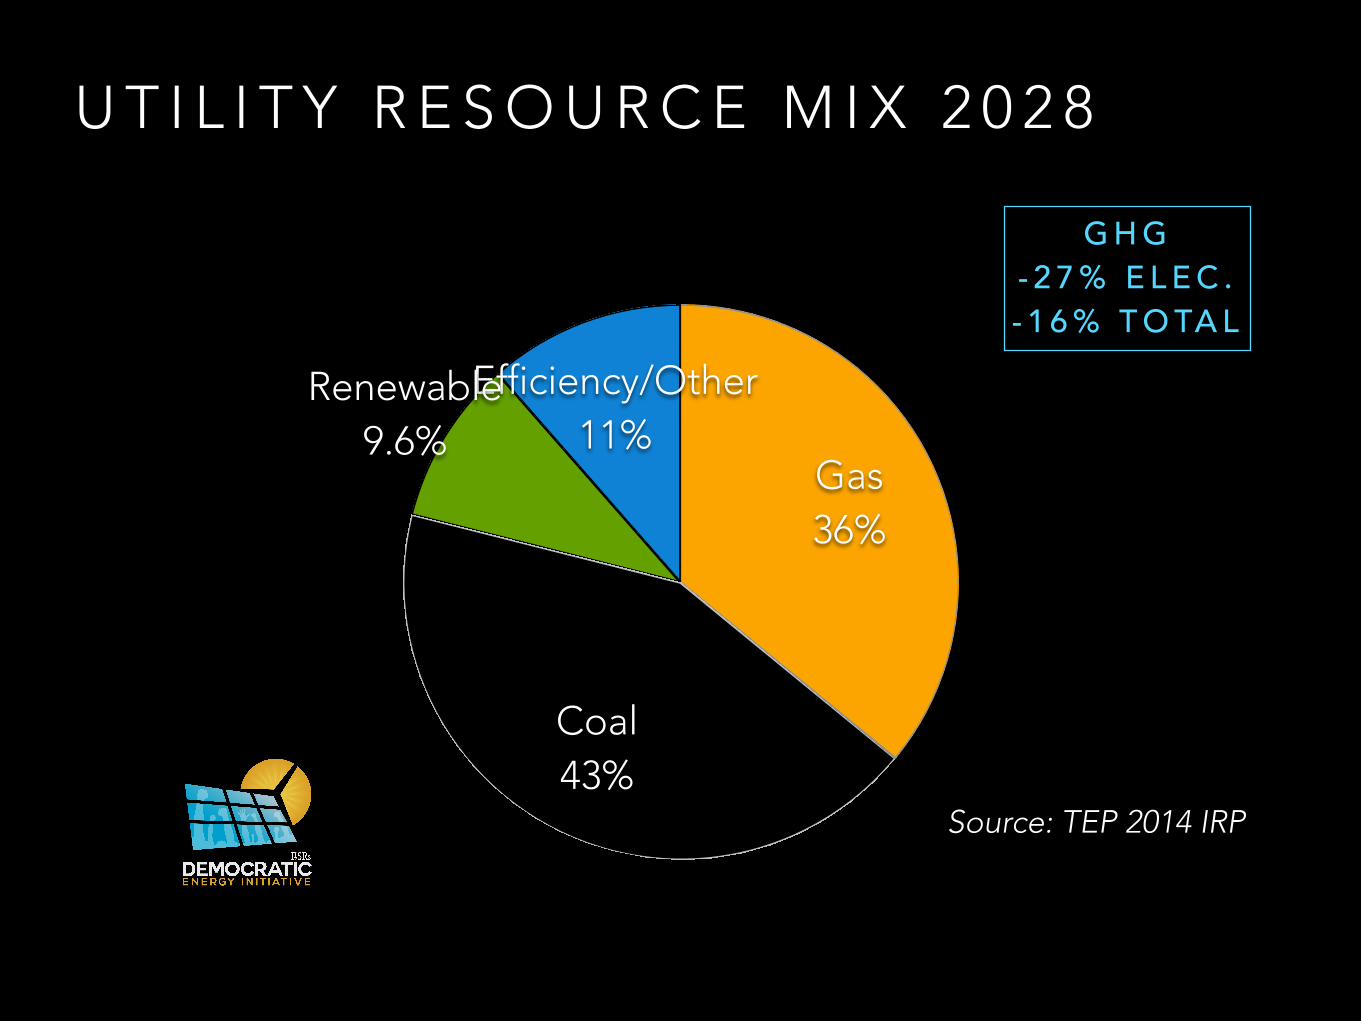
U T I L I T Y R E S O U R C E M I X 2 0 2 8
Efficiency/Other 11%
Renewable 9.6%
Coal 43%
Gas 36%
G H G - 2 7 % E L E C . - 1 6 % T O TA L
Source: TEP 2014 IRP

M I L L I O N T O N S O F G H G E M I S S I O N S
4
5
6
7
8
1990 1994 1998 2002 2006 2010 2014 2018 2022 2026
Actual emissions
Projected based on TEP IRP
Kyoto reduction goal
R E S U LT S O F U T I L I T Y R E S O U R C E P L A N …
Source: TEP 2014 IRP

M I L L I O N T O N S O F G H G E M I S S I O N S
0
2
4
6
8
1990 1994 1998 2002 2006 2010 2014 2018 2022 2026 2030 2034 2038
… N O T N E T Z E R O
N E T Z E R O 2 0 4 0 – –C I T Y ’ S L I K E LY G O A L

F O R E C A S T A G A I N S T T H E G R A I N
0
3,000
6,000
9,000
12,000
15,000
1960 1965 1970 1975 1980 1985 1990 1995 2000 2005 2010
Source: World Bank, 2014 TEP IRP
Per capita electricity use, United States
T E P F O R E C A S T
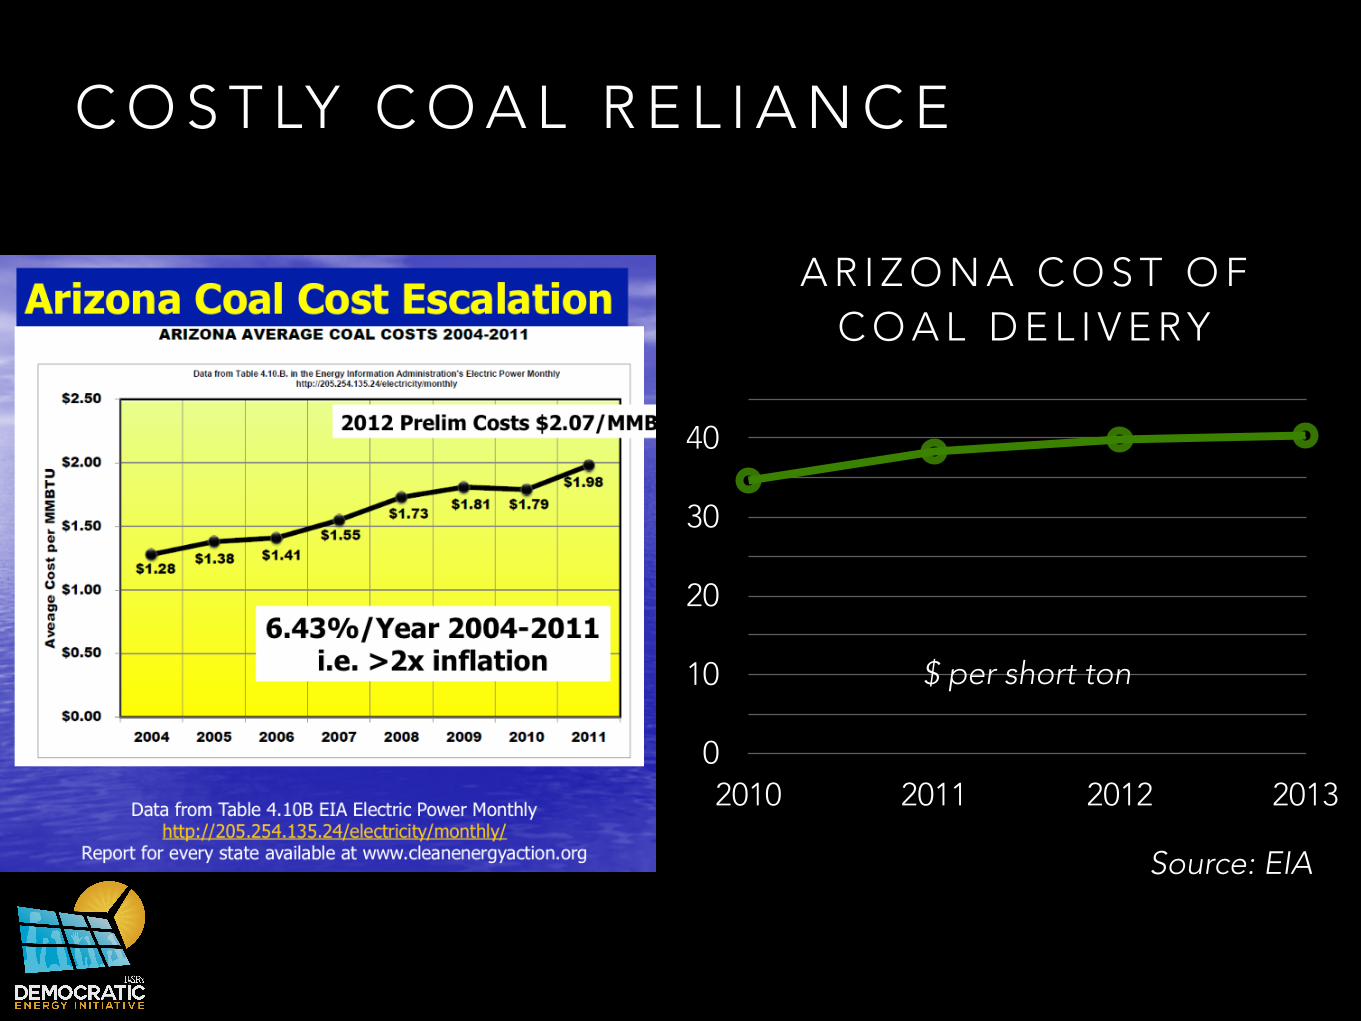
A R I Z O N A C O S T O F C O A L D E L I V E R Y
0
10
20
30
40
2010 2011 2012 2013
C O S T LY C O A L R E L I A N C E
$ per short ton
Source: EIA

C O S T LY C O A L R E L I A N C E
Coal 43%
$161 million in compliance with pollution law by 2018
Source: TEP 2014 IRP

• 1200 MW of new capacity planned
• 50+ year commitment
• 350 gallons of water per MWh
• Cost of $88-119 per MWh
T H I S I S A G A S
Source: TEP 2014 IRP

T H I S I S A G A S
Twice as much natural gas capacity planned as
solar power

0¢
5¢
10¢
15¢
20¢
8.8¢
16.6¢
U T I L I T Y ’ S C O S T F O R E C A S T
cents per kilowatt-hour
U T I L I T Y ( T E P ) C L A I M
11.9¢
Source: TEP 2014 IRP
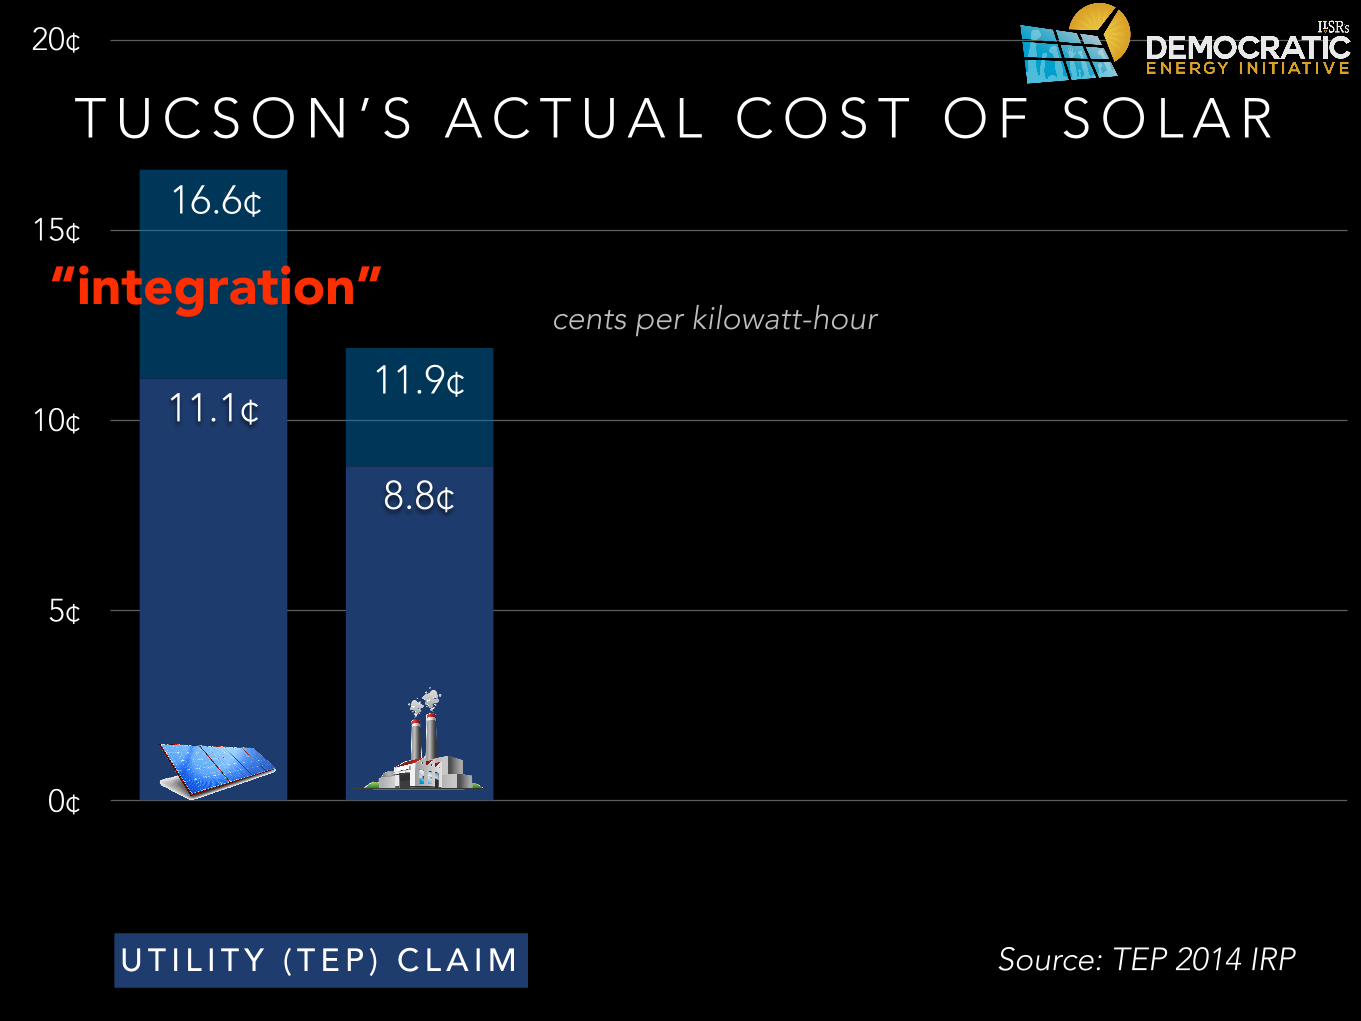
0¢
5¢
10¢
15¢
20¢
8.8¢
11.1¢
T U C S O N ’ S A C T U A L C O S T O F S O L A R
cents per kilowatt-hour
U T I L I T Y ( T E P ) C L A I M
11.9¢
16.6¢
“integration”
Source: TEP 2014 IRP

“integration”
“We have to back up every kilowatt of solar every minute of every day”
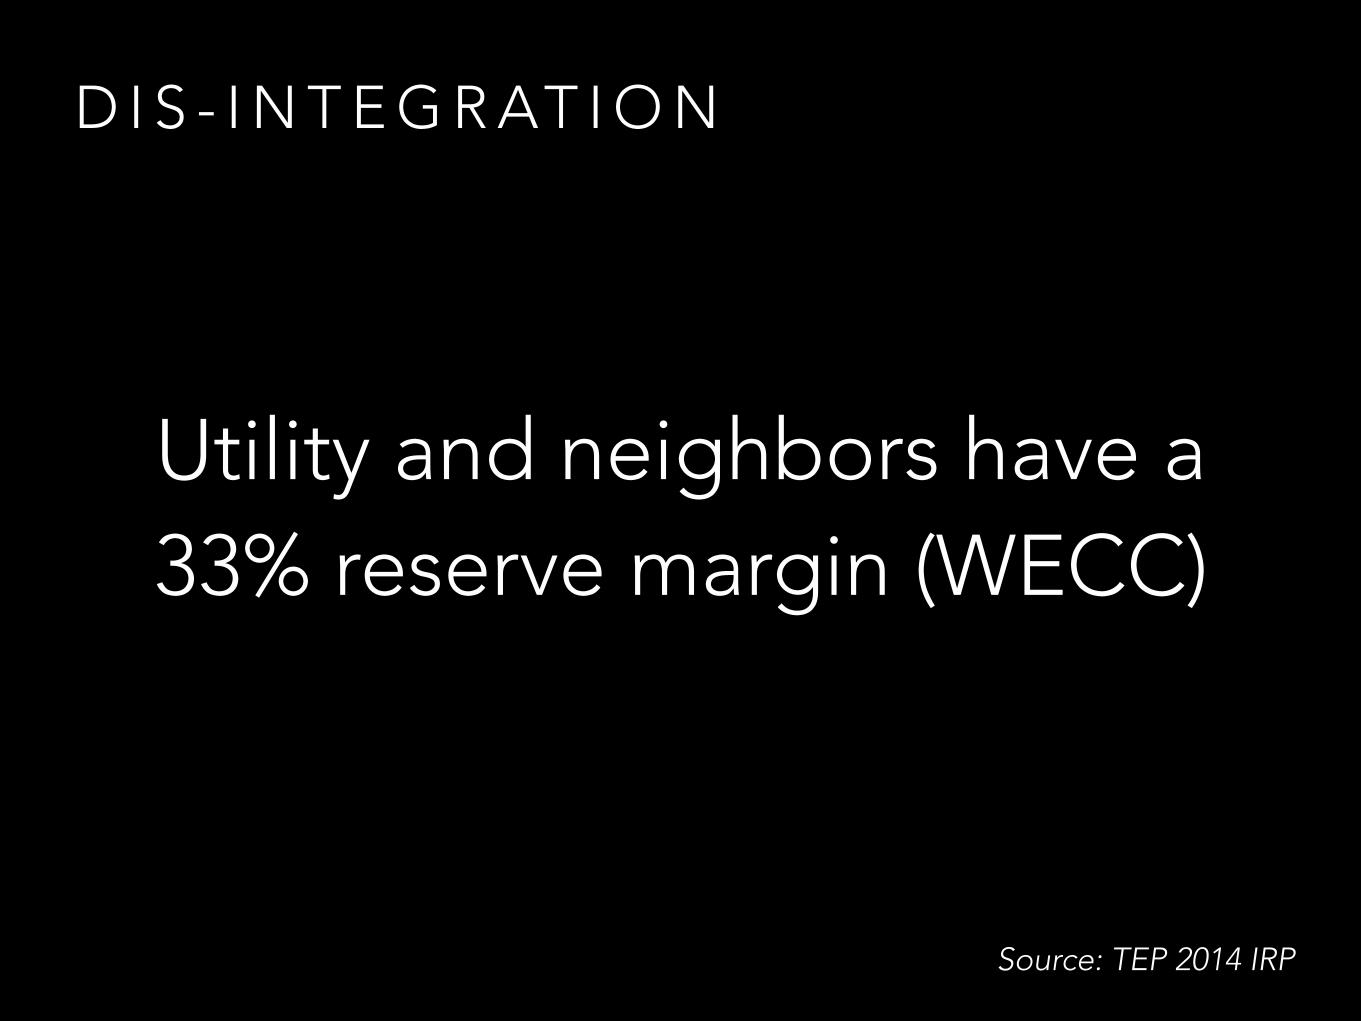
D I S - I N T E G R AT I O N
Utility and neighbors have a 33% reserve margin (WECC)
Source: TEP 2014 IRP

D I S - I N T E G R AT I O N
solar resource is predictable

D I S - I N T E G R AT I O N
Source: http://ilsr.org/solving-solars-variability-more-solar/
I N T E G R AT I O N C O S T S FA L L W I T H D I S P E R S I O N ( $ P E R M W H )
0
10
20
30
40
1 solar plant 5 solar plants 25 solar plants
$2.70
$10.80
$39.00
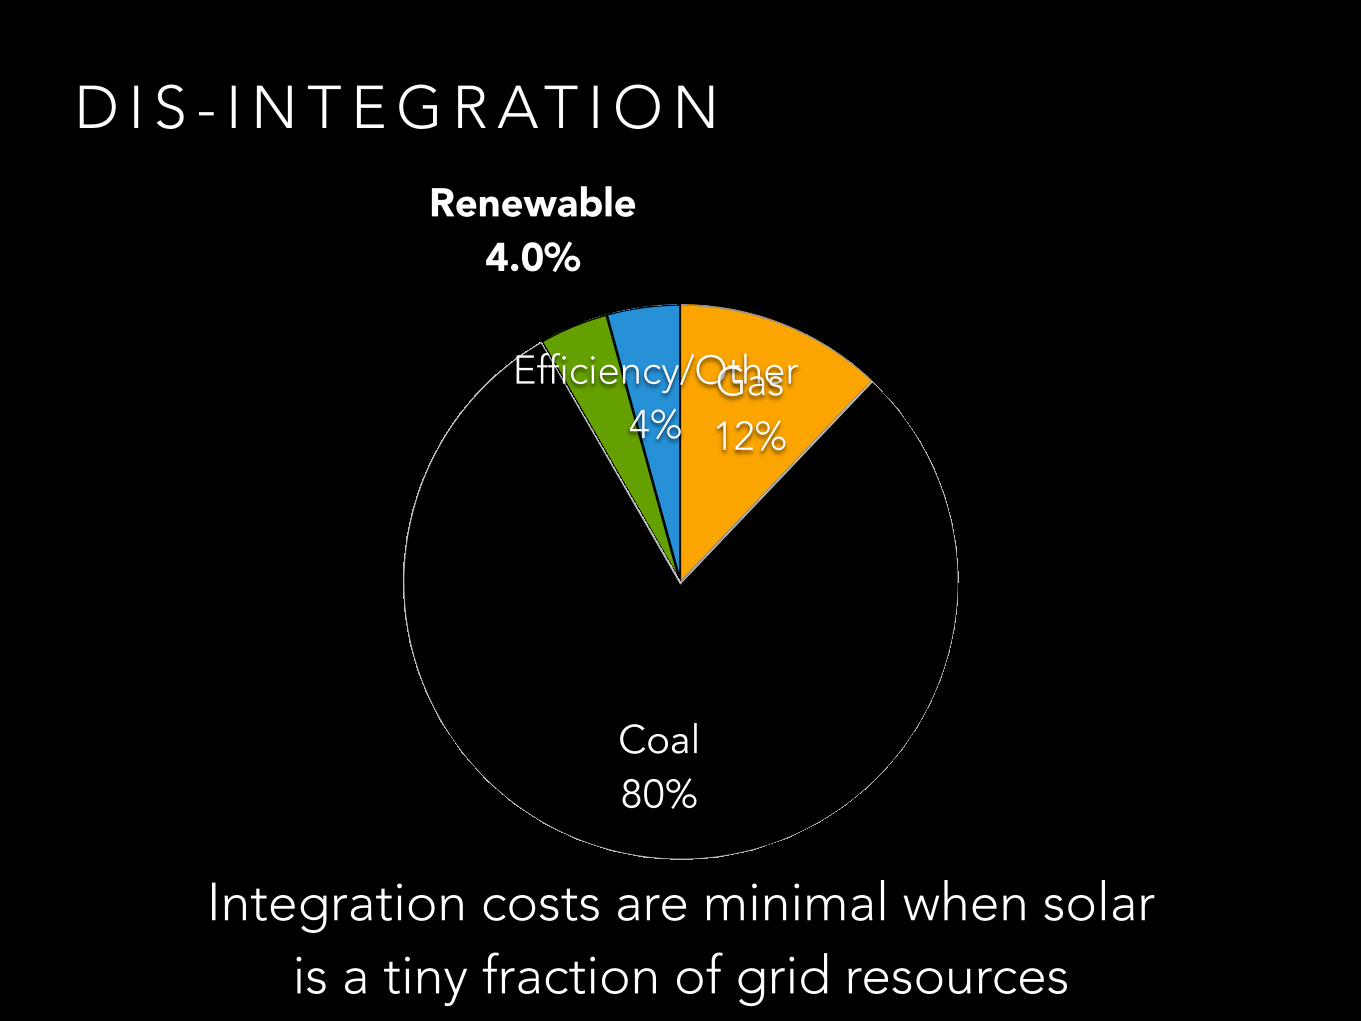
D I S - I N T E G R AT I O N
Efficiency/Other 4%
Renewable 4.0%
Coal 80%
Gas 12%
Integration costs are minimal when solar is a tiny fraction of grid resources

0¢
5¢
10¢
15¢
20¢
8.8¢
11.1¢
T U C S O N ’ S A C T U A L C O S T O F S O L A R
cents per kilowatt-hour
U T I L I T Y ( T E P ) C L A I M
11.9¢
adjusted
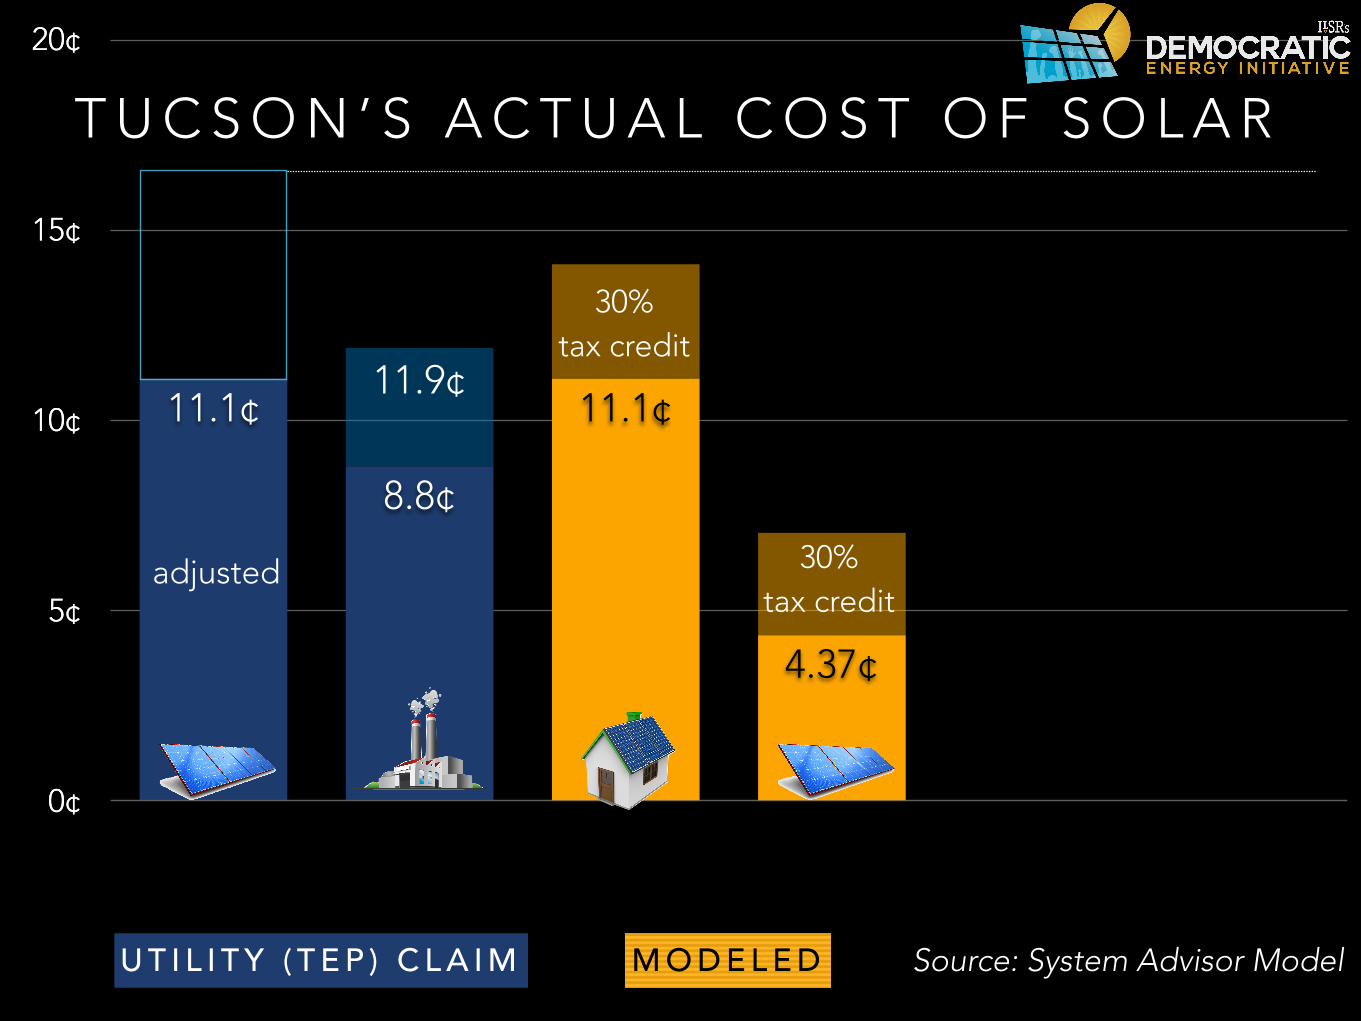
0¢
5¢
10¢
15¢
20¢
8.8¢
11.1¢
0¢
5¢
10¢
15¢
20¢
4.37¢
11.1¢
T U C S O N ’ S A C T U A L C O S T O F S O L A R
U T I L I T Y ( T E P ) C L A I M M O D E L E D
adjusted
30% tax credit
30% tax credit
11.9¢
Source: System Advisor Model

0¢
5¢
10¢
15¢
20¢
8.8¢
11.1¢
0¢
5¢
10¢
15¢
20¢
4.37¢
11.1¢
0¢
5¢
10¢
15¢
20¢
Utility scale solar
Residential Commercial Prairie Fire Solar
Green Valley
5.7¢
9.6¢
T U C S O N ’ S A C T U A L C O S T O F S O L A R
U T I L I T Y ( T E P ) C L A I M M O D E L E D A C T U A L ( P I M A C O U N T Y )
adjusted
C R E D I B I L I T Y G A P
30% tax credit
30% tax credit
11.9¢

0¢
5¢
10¢
15¢
20¢
8.8¢
11.1¢
0¢
5¢
10¢
15¢
20¢
4.37¢
11.1¢
0¢
5¢
10¢
15¢
20¢
Utility scale solar
Residential Commercial Prairie Fire Solar
Green Valley
5.7¢
9.6¢
T U C S O N ’ S A C T U A L C O S T O F S O L A R
U T I L I T Y ( T E P ) C L A I M M O D E L E D A C T U A L ( P I M A C O U N T Y )
adjusted
30% tax credit
30% tax credit
11.9¢
SOLAR SAVINGS OVER GAS

W AT E R

W AT E R I S L I M I T E D
• Central Arizona Project has lowest water rights from Colorado river
• Water storage will cover shortage but less water sales mean higher rates

L O T S O F W AT E R F O R P O W E R
T U C S O N W AT E R U S E
TEP 15%
85%

M I N N E A P O L I S : A M O D E L C I T Y- U T I L I T Y PA R T N E R S H I P ?

A S I M I L A R C H A L L E N G E

Minneapolis Energy Options
Taking charge of our energy future
G R A S S R O O T S A C T I O N
Clean Local Equitable Affordable Reliable
Minneapolis Energy Options
Taking charge of our energy future

E N E R G Y O P T I O N S 2 0 1 2
Franchise • 20 years • $23 million for city
general fund • expiring 2014
Municipal utility

O R G A N I Z I N G L E D T O O P T I O N S
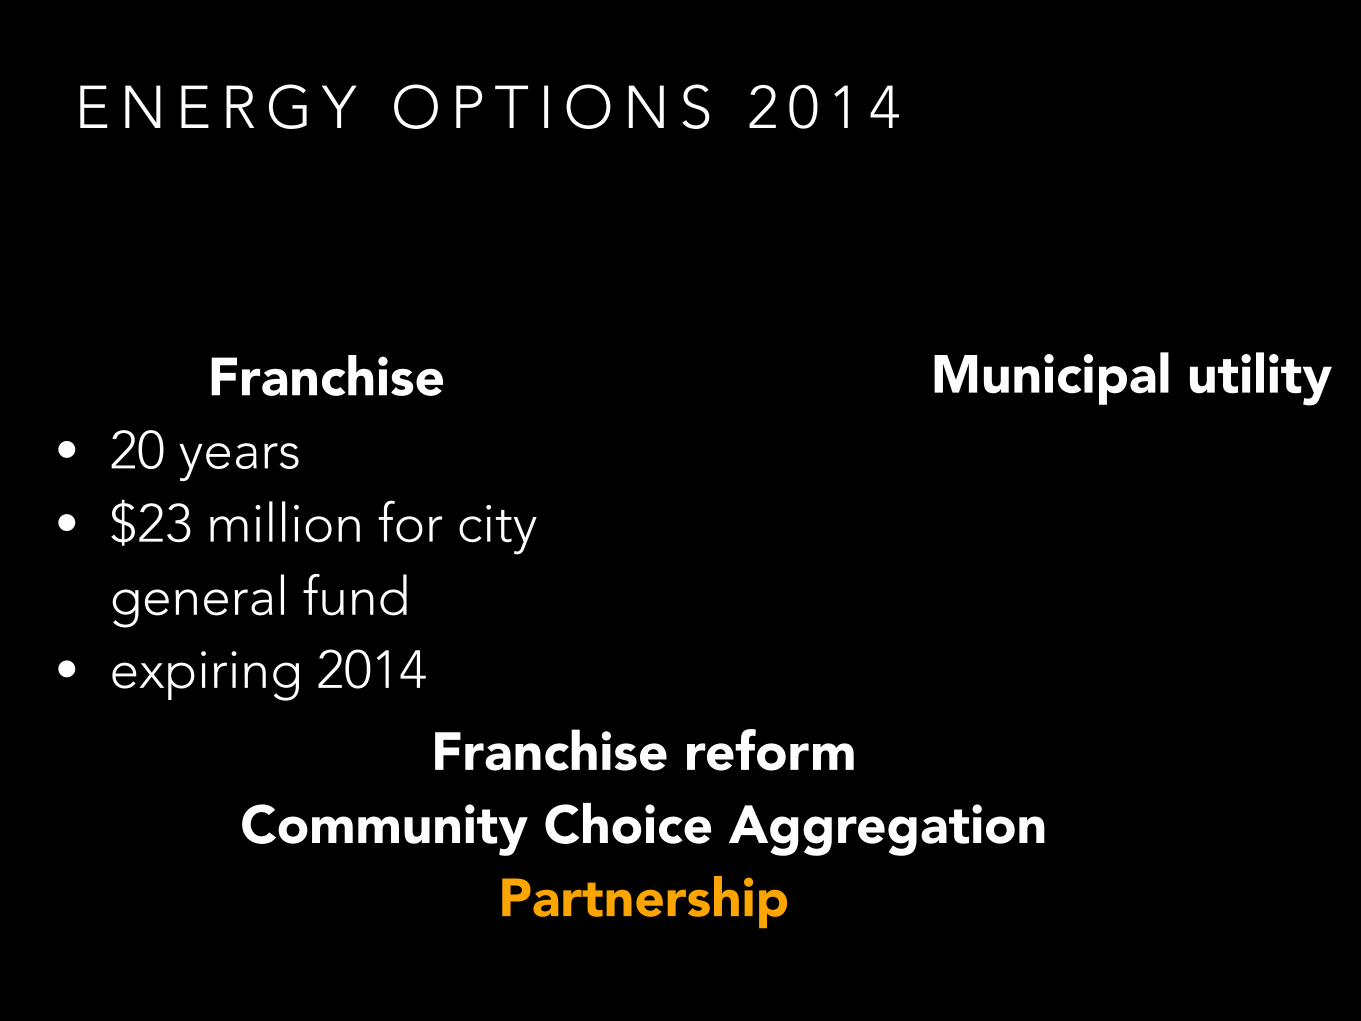
Franchise reform Community Choice Aggregation
Partnership
E N E R G Y O P T I O N S 2 0 1 4
Franchise • 20 years • $23 million for city
general fund • expiring 2014
Municipal utility
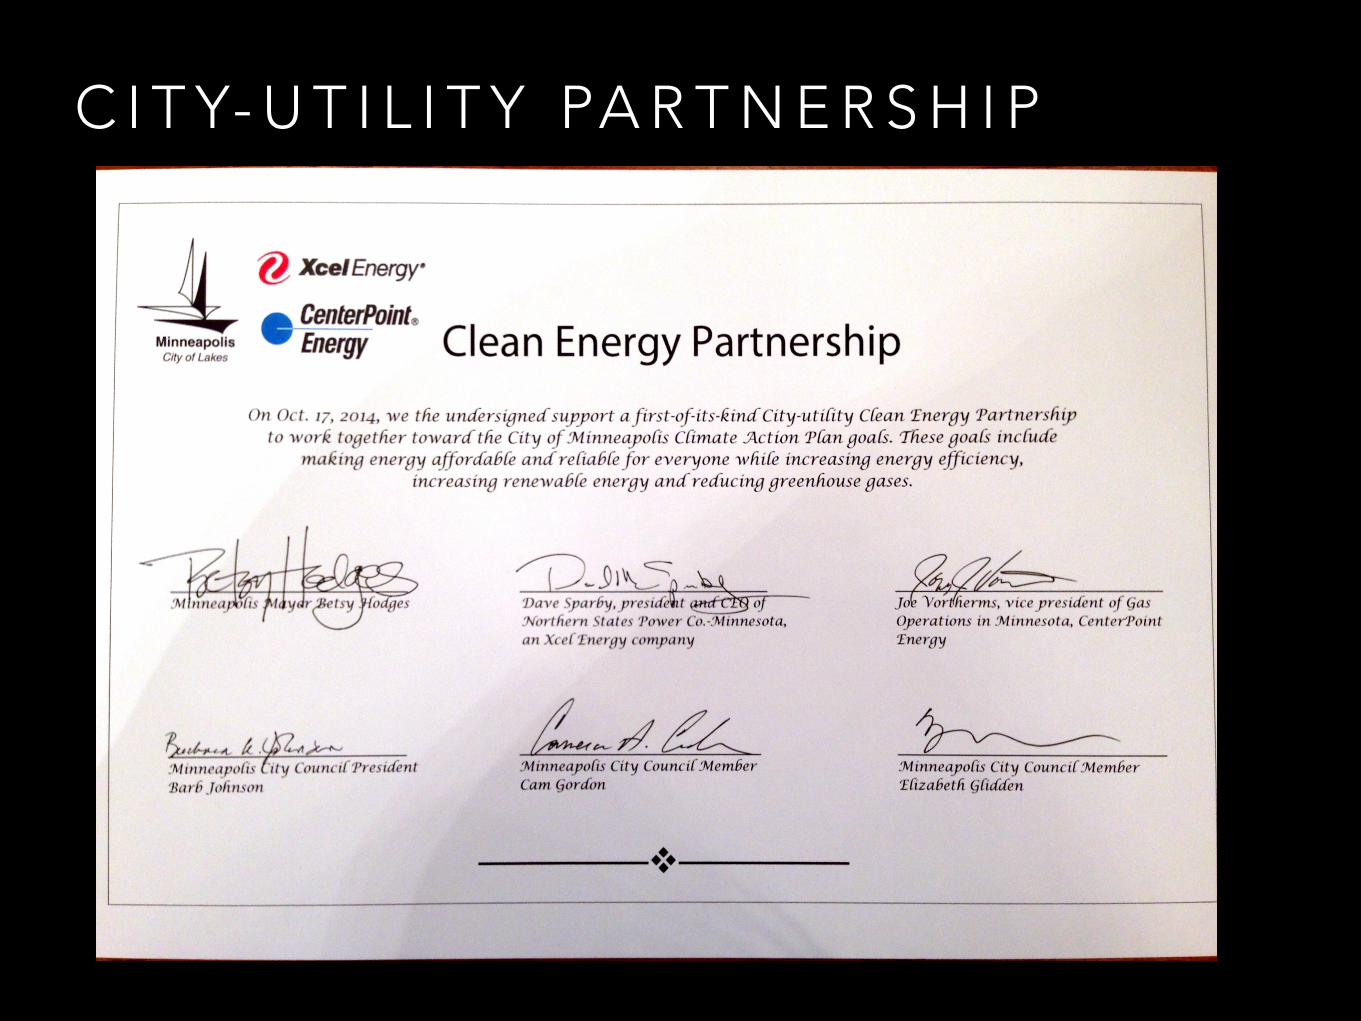
C I T Y- U T I L I T Y PA R T N E R S H I P

2 - Y E A R W O R K P L A N Minneapolis Energy Options
Taking charge of our energy futureB +
Building benchmarking
Community-driven energy efficiency
Community solar
LED streetlights
Pay back on the bill

C O N S TA N T V I G I L A N C E

W H Y F O C U S O N L O C A L P O W E R ?

$48 billion at stake

S O L A R I S VA L U A B L E

0¢
2¢
4¢
6¢
8¢
10¢
12¢
14¢
Energy
Gen. capacity
Environment
T&D Deferral
Loss Savings
12.8¢
(per kWh)
Source: The Value of Distributed Photovoltaics to Austin Energy and the City of Austin
Austin Energy Value of Solar Tariff

$0.00
$0.03
$0.06
$0.08
$0.11
$0.14
Brown energy replacement
Avoided transmission losses
Environmental (RPS compliance)
Avoided transmission access
Local capacity value
(per kWh)
Palo Alto CLEAN Program
13.5¢

$0.00
$0.03
$0.06
$0.08
$0.11
$0.14
Brown energy replacement
Avoided transmission losses
Environmental (RPS compliance)
Avoided transmission access
Local capacity value
(per kWh)
Minnesota Value of Solar
12¢

C O S T S H I F T ?
0
3
6
9
12
Value of solar (MN)
Net metering payment
(MN)
Solar producers provide subsidy for
non-solar ratepayers
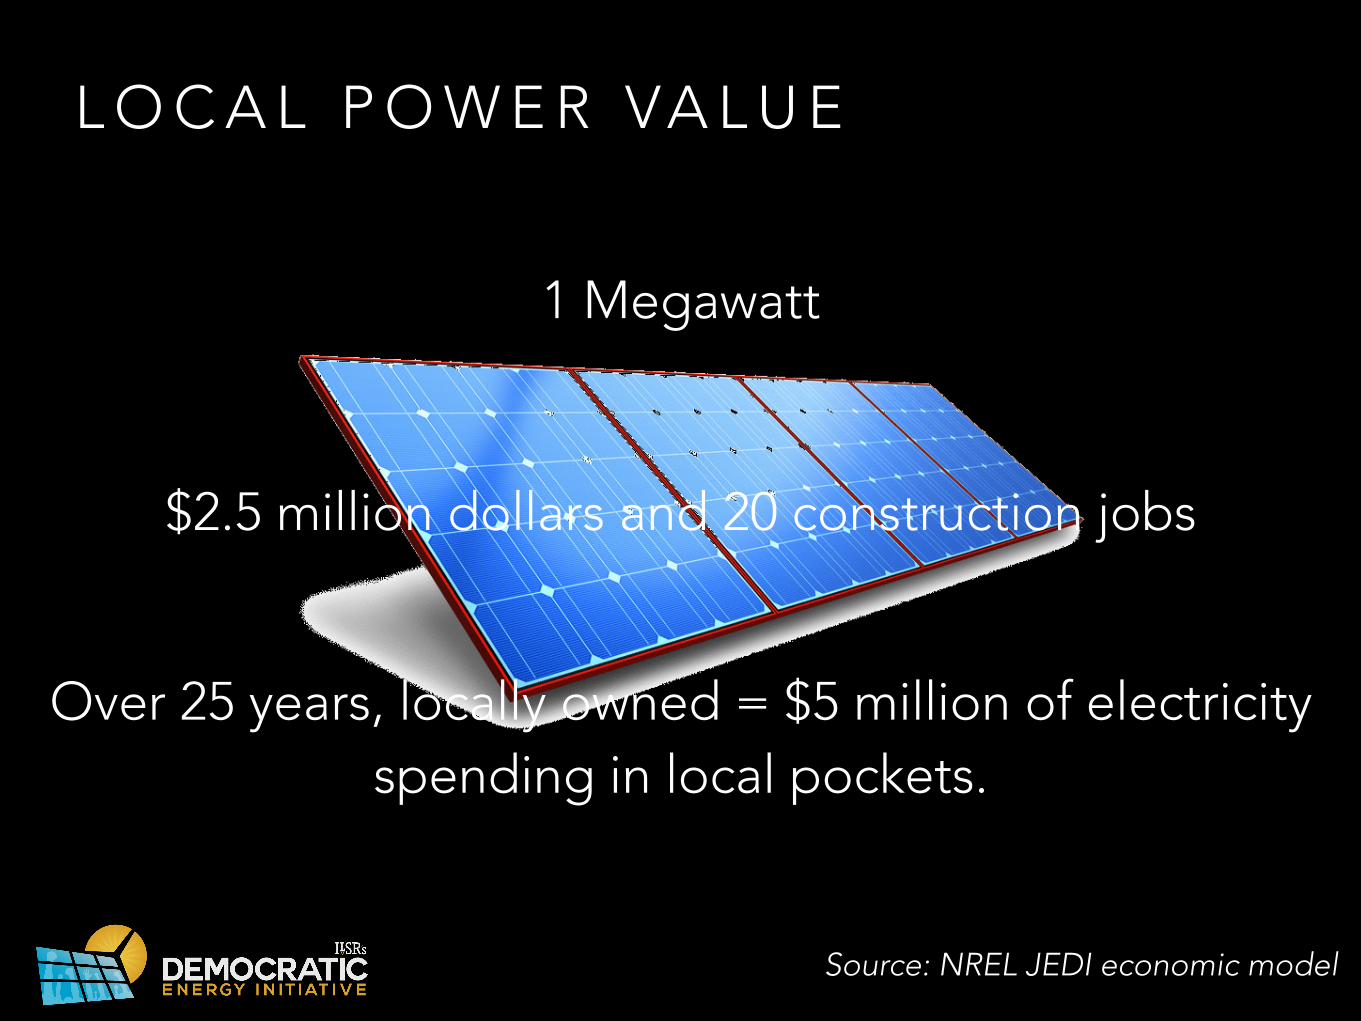
L O C A L P O W E R VA L U E
Over 25 years, locally owned = $5 million of electricity spending in local pockets.
Source: NREL JEDI economic model
1 Megawatt
$2.5 million dollars and 20 construction jobs

L O C A L P O W E R VA L U E
Not local
0 25 50 75 100
very negative negative neutral positive very positive
Comparing two towns with nearby wind projects. When one is locally owned, it means…
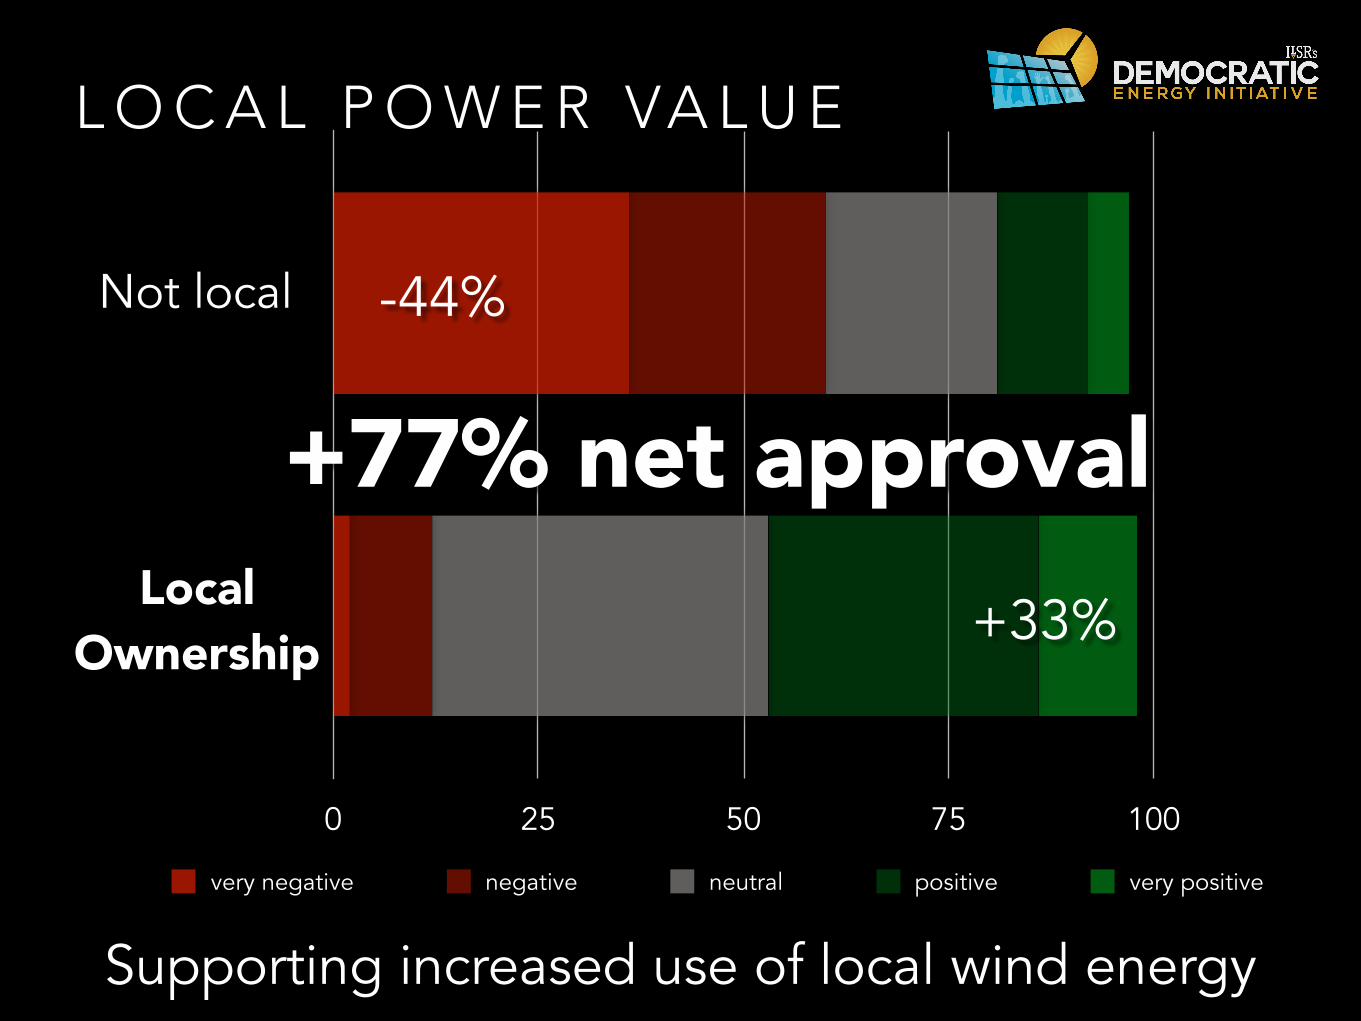
L O C A L P O W E R VA L U E
Supporting increased use of local wind energy
Not local
0 25 50 75 100
very negative negative neutral positive very positive
-44%
+33%
+77% net approvalLocal
Ownership
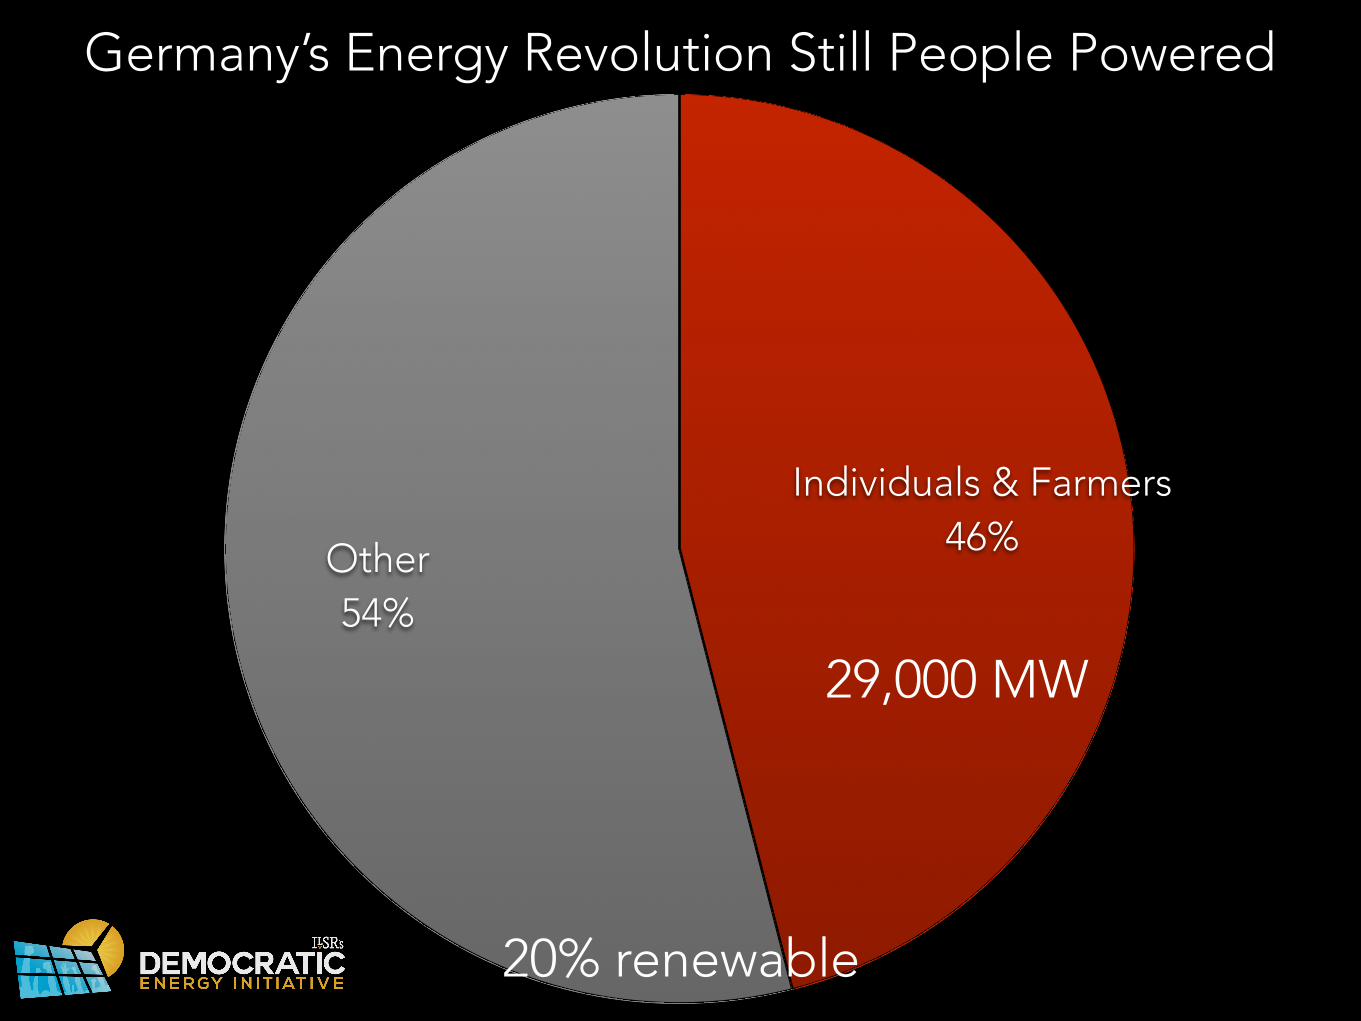
Other 54%
Individuals & Farmers 46%
Germany’s Energy Revolution Still People Powered
29,000 MW
20% renewable

T H E F U T U R E F O R L O C A L E N E R G Y

EQUITABLELOCALLOW-
CARBONEFFICIENTFLEXIBLE LOW-CARBONEFFICIENTFLEXIBLE LOCAL EQUITABLE
FIVE PILLARS OF ENERGY DEMOCRACY
“Utility 2.0” pillars
$48 billion opportunity
“Utility 3.0”

E N E R G Y D E M O C R A C Y I N A C T I O N
INDEPENDENTLOCAL GRID
MANAGER
= super efficient buildings

L O C A L P O W E R O P P O R T U N I T Y
S A N TA F EB O U L D E R
2x Coal
same

LEVERAGEUtilitiesCities
need


