A climatology of dust emission events from northern Africa usinglong-term surface observations
S. M. Cowie1, P. Knippertz2, and J. H. Marsham1
1Institute for Climate and Atmospheric Science, School of Earth and Environment, University of Leeds, Leeds, LS2 9JT, UK2Karlsruher Institute of Technology, Kaiserstr. 12, 76131 Karlsruhe, Germany
Received: 6 February 2014 – Published in Atmos. Chem. Phys. Discuss.: 18 March 2014Revised: 25 June 2014 – Accepted: 14 July 2014 – Published: 25 August 2014
Abstract. Long-term (1984–2012) surface observationsfrom 70 stations in the Sahara and Sahel are used to ex-plore the diurnal, seasonal and geographical variations indust emission events and thresholds. The frequency of dustemission (FDE) is calculated using the present weather codesof SYNOP reports. Thresholds are estimated as the windspeed for which there is a 50 % probability of dust emis-sion and are then used to calculate strong wind frequency(SWF) and dust uplift potential (DUP), where the latter isan estimate of the dust-generating power of winds. Stationsare grouped into six coherent geographical areas for morein-depth analysis.
FDE is highest at stations in Sudan and overall peaks inspring north of 23◦ N. South of this, where stations are di-rectly influenced by the summer monsoon, the annual cyclein FDE is more variable. Thresholds are highest in north-ern Algeria, lowest in the latitude band 16–21◦ N and havegreatest seasonal variations in the Sahel. Spatial variabilityin thresholds partly explain spatial variability in frequency ofdust emission events on an annual basis. However, seasonalvariations in thresholds for the six grouped areas are not themain control on seasonal variations in FDE. This is demon-strated by highly correlated seasonal cycles of FDE and SWFwhich are not significantly changed by using a fixed, or sea-sonally varying, threshold. The likely meteorological mech-anisms generating these patterns such as low-level jets andhaboobs are discussed.
1 Introduction
Northern Africa is firmly established as the biggest contrib-utor of mineral dust into the atmosphere (Prospero, 2002;Goudie and Middleton, 2001). There are large geographi-cal variations across the region with the intensity of a sourcearea depending on surface properties (soil moisture, vegeta-tion, roughness, soil composition and particle size), meteo-rological parameters (wind, stability), and even on the ex-tent of anthropogenic activity (Ozer, 2001; Mahowald et al.,2002; Ginoux et al., 2012). The Sahara desert contributesmore dust to the atmosphere than the semi-arid Sahel, thoughthe Sahel has been proposed to be the main factor in inter-annual and seasonal variability of dust exports (Zender andKwon, 2005; Evan et al., 2006). Once airborne, dust parti-cles from northern Africa can be transported for thousandsof kilometres and alter climate by scattering, reflecting andabsorbing incoming short-wave and outgoing long-wave ra-diation at both the surface, and the top of the troposphere(Sokolik et al., 2001). Cooling takes place when absorbingand scattering reduces the amount of energy which reachesthe surface (Kaufman et al., 2002; Spyrou et al., 2013) whileatmospheric warming takes place when aerosols absorb andre-emit outgoing long-wave radiation (Dufresne et al., 2002).Current radiative forcing estimates of mineral dust are highlyuncertain, but an overall negative (atmospheric cooling) ef-fect of 0.1(± 0.2) W m2 is predicted (Stocker et al., 2013).Deposited dust particles can not only impact on ocean bio-geochemical processes (Mahowald et al., 2005), but also onland ecosystems such as the nutrient-depleted Amazon basin(Bristow et al., 2010).
Published by Copernicus Publications on behalf of the European Geosciences Union.
8580 S. M. Cowie et al.: Dust emission in northern Africa
As the starting point of the global dust cycle, emission isa crucial process. However, current estimates on a regionaland even a global scale are highly uncertain. At present, thereis no network of observations to sufficiently constrain theglobal dust budget, so estimates at least partly rely on nu-merical models (Tegen and Schepanski, 2009). A recent sys-tematic comparison of state-of-the-art global models showeda range in emissions from 400 to 2200 Tg year−1 (Huneeuset al., 2011) from North Africa.
Dust emission is a highly non-linear function of windspeed, with the exceedance of a threshold value required tostart emission (Helgren and Prospero, 1987; Bagnold, 1941).This threshold is controlled by surface characteristics, whichis particularly important in semi-arid areas like the Sahelwhere the cycle of emission, transport and deposition is com-plex and intertwined with seasonal rainfall and vegetation.The main impacts here are thought to be through chang-ing seasonal amounts of bare soil surface (Kim et al., 2013)and the effects of varying roughness from vegetation on lo-calised peak winds (Roderick et al., 2007; Vautard et al.,2010; Cowie et al., 2013). Rainfall, and its subsequent impacton soil conditions and surface composition, can enhance orsuppress dust emission on diurnal to inter-annual timescalesthrough different mechanisms (Zender and Kwon, 2005). Im-portant to arid and semi-arid areas are the alternate floodingand drying out of ephemeral (temporary) lakes, wadis andalluvial fans (Mahowald et al., 2003; Ginoux et al., 2012).Alluvial fans funnel rainwater from local hills and elevatedterrain down into topographic lows where many of the majornorthern Africa dust sources, as identified by satellite obser-vations, are shown to be located (Prospero, 2002).
Meteorological mechanisms involved in producing dustemission in northern Africa act on synoptic, meso- andmicro-scales. Synoptic mechanisms are based around the es-tablishment of a large surface pressure gradient. In the bo-real winter this occurs between the Azores High intrudinginto Morocco, Algeria and Libya and the tropical pressuretrough near the Gulf of Guinea. The strong northeasterlywinds driven by this pressure difference are known as “har-mattan” and are particularly important for dust sources insouthern parts of the Sahara and the Sahel in winter (Kloseet al., 2010). Driven by the large pressure gradient describedabove, a wind-speed maximum frequently forms in the lowertroposphere, commonly known as a low-level jet (LLJ). LLJsalso occur in the southern Sahara and Sahel during summer,when surface pressure gradients around the Saharan heatlow (SHL) encourage their formation. Nocturnal low-leveljets (NLLJs) are LLJs which develop (or are enhanced) atnight-time (Fiedler et al., 2013a). The morning breakdownof a NLLJ by surface heating produces gusty winds which inturn initiate dust emission. LLJs can also occur in the day-time due to baroclinic conditions forced by coastlines andcomplex terrain (Stensrud, 1996).
Another synoptic-scale mechanism is uplift by the lead-ing edge of the West African summer monsoon flow, which
can essentially act as a large density current (Bou Karamet al., 2008) and is often referred to as the intertropical dis-continuity (ITD). Variability in the position of the ITD hasbeen linked to variability in dust uplift over West Saharandust sources (Engelstaedter and Washington, 2007) throughassociated LLJs (Knippertz, 2008) and haboobs (Marshamet al., 2008). This variability is partly controlled by distur-bances that form on the African easterly jet (AEJ), calledAfrican easterly waves (AEWs). AEWs can alter the positionof the ITD, creating northward excursions of southerly mon-soon flow and uplift in the southern Sahara (Marsham et al.,2013). The AEW surface vortex itself can also produce windsstrong enough for emission (Knippertz and Todd, 2010). Inaddition to the leading edge, dust emission has been observedwithin the moist southwesterly monsoon flow from the Gulfof Guinea. Some evidence suggests that the dominant mecha-nism is gusty cold-pool outflows from convection (Marshamet al., 2008), though LLJs are also known to be embeddedin the monsoonal flow (Parker et al., 2005). Acting on themeso-scale, these gusty cold-pool outflows, or density cur-rents, create large dust storms which can extend to severalhundred kilometres. These are commonly referred to as “ha-boobs”. Dust emission due to haboobs has been documentedin the northwest Sahara (Knippertz et al., 2007; Emmel et al.,2010), in the Sahel (Sutton, 1925; Williams et al., 2009) andsouthern Sahara (Knippertz and Todd, 2010; Marsham et al.,2013; Allen et al., 2013). It is difficult to assess the frequencyof haboobs due to satellite sensing limitations in cloudy con-ditions (Heinold et al., 2013; Kocha et al., 2013) and thesparse network of surface observation stations.
Micro-scale dust emission mechanisms take place understrong surface heating and light background winds. Theseconditions support the formation of rotating dust devils, andlonger-lived, non-rotating dust plumes (Koch and Renno,2005). Due to their small scales it is hard to compile a com-prehensive climatology for a large area like northern Africa.Current estimations are based on extrapolating field cam-paign analysis to a wider area. Recent advances in remotesensing of atmospheric dust from satellites have been invalu-able, but are not without limitations such as cloud contam-ination, assumptions made on optical properties, variabilityin surface albedo and emissivity over land (Knippertz andTodd, 2012). It is also very hard to separate airborne dustfrom dust emission in remotely sensed data. Some productsare only available daily, making them unsuitable to investi-gate the large diurnal cycle in dust emission. While routinesurface observations can only give point measurements, theydo provide long-term records and are not subject to the limi-tations of satellite data mentioned above. In this paper, weuse long-term observations from standard surface weatherstations across North Africa which report at 3- and 6-hourlyintervals to compile climatological statistics, including thediurnal cycle. Despite the sparse area coverage of northernAfrica, these data have a high value for dust emission studiesand have been explored surprisingly little in the literature. Up
S. M. Cowie et al.: Dust emission in northern Africa 8581
to now, surface observations of visibility and present weatherhave been used for statistical analysis in the Sahel and Sahara(Mbourou et al., 1997; Mahowald et al., 2007; Klose et al.,2010), but have not isolated dust emission events specifi-cally. Climatological studies of dust emission, from surfaceSYNOP present weather reports, have only been conductedfor East Asia (Kurosaki and Mikami, 2005), the southwestsummer monsoon region (Ackerman and Cox, 1989; Middle-ton, 1986) and Australia (McTainsh and Pitblado, 1987).Theseasonal and diurnal cycles of dust are explored in relationto visibility and rainfall inMbourou et al.(1997) while Mar-ticorena et al.(2010) discuss dust concentration and strongwind frequency. The time and spatial scales of these twostudies are quite different with 53 stations and three 4-yearperiods investigated inMbourou et al.(1997) compared tothree stations for a 3-year period inMarticorena et al.(2010).This paper intends to build on the information gathered bythese studies by including a larger spatial area, a longer datarecord and new data analysis techniques which aim to clearlyseparate emission from transport events.
This paper presents a climatology of dust emission eventsfrom SYNOP observations from northern Africa, objectivelydetermines wind-speed thresholds for emission and appliesnew diagnostics and statistics to assess seasonal and diurnalcycles of these events. Section2 will focus on how dust emis-sion is identified from surface observations, on the criteriaand quality flags applied to the station data and on diagnostictools used for analysis. Section3 presents the results of theseasonal and diurnal cycle of dust emission, with discussionon individual stations followed by stations grouped togetherin Sect.3.2. Changes in emission threshold, both geographi-cally and temporally, will also be discussed in Sect.3.
2 Data and methods
2.1 Observational data
2.1.1 Routine surface SYNOP observations
Long-term surface observations are recorded as SYNOP re-ports, which include 3-hourly observations of 10 min meanwind-speed, measured at a height of 10 m by an anemome-ter, and present weather subjectively judged by a humanstation observer using a code defined by the World Meteo-rological Organization (WMO). The present weather (ww)codes describing dust emission are 07–09, 30–35 and 98(WMO, 1995). These descriptions of dust emission weatherdo not provide information on the physical processes at aparticle scale, but simply describe how the dust appears inthe atmosphere to the observer. As inKurosaki and Mikami(2005), we split these codes into “blowing dust” (07 and 08)and “dust storms” (09, 30–35 and 98), which represent dustevents on a larger scale and may also be more intense. In-formation on visibility is purposely omitted, as the relative
contribution of advected and locally emitted dust particles tolow visibility is unknown. The code 06 (“dust not raised bywind, at or near the station”) is extracted to investigate non-emission dust events. For the purpose of this study we labelthese events as “transported dust”. We transform groups ofreports into frequency of occurrence parameters. Frequencyof dust emission (FDE) is the percentage of dust events (allemission codes) reported at a given time of day or during acertain month, with respect to the total number of observa-tions. Dust storm frequency (DSF), blowing dust frequency(BDF) and transported dust frequency (TDF) are calculatedin the same way, but with the particular codes for dust stormsand blowing dust as described above.
SYNOP reports were taken from the Met Office IntegratedData Archive System (MIDAS) data set. As we are primarilyinterested in dust emission, the first criterion for stations tobe selected was for 1060 observations of dust emission overthe time period 1984–2012: 70 stations, displayed in Fig.1,fulfilled this criterion and form the basis of this study. Theratio of day to night-time observations, as well as the numberof observations per year, was investigated in order to createa quality flag system for the stations. Quality flags consistsof a number (1 or 2) proceeded by a letter (A, B or blank).Where the ratio of day to night observations is greater than2 : 1 a 2 flag is given, while a 1 is applied to a non-biasedstation. Healthy stations with more than 500 observations peryear for each year between 1984 and 2012 do not have a letterflag. Stations which have less (greater) than 5 years with lessthan 500 observations per year are marked A (B).
The 29 years of SYNOP data included some wind-speedreports above realistic values; in some cases a typographic er-ror was clear. We analysed some of the strongest winds fromthe study period with SEVIRI data (2006–2012) and foundthat the strongest (realistic) wind associated with a dust emis-sion report was a 54 kn report accompanied by a noticeablecold pool outflow in the satellite imagery. Since we could notconfirm any of the other reports at greater speeds than this,wind speeds greater than 55 kn were removed from the anal-ysis.
In the Sahel region 6-hourly sampling is more commonthan 3-hourly sampling. Different sampling regimes tend tobe confined to within countries. For example in Mauritanianearly all stations have no night-time observations, while inMali and Niger sampling tends to be limited to 6-hourly. Thisis documented in detail in Fig. S1 in the Supplement. Analy-sis of 6-hourly data was applied to stations which have stable3-hourly sampling. The magnitude of annual FDE varied at afew stations, but overall the seasonal cycle remained similarat all but one station (Fig. S2 in the Supplement). We sus-pect that this is due to natural inter-station variability in thediurnal distribution of dust emission mechanisms betweenSYNOP and inter-SYNOP hours. The approach we take inthis paper is to highlight the main biases which might affectconclusions that apply to large areas and groups of stations,
8582 S. M. Cowie et al.: Dust emission in northern Africa
ACPD14, 1–47, 2014
Dust emission innorthern Africa
S. M. Cowie et al.
Title Page
Abstract Introduction
Conclusions References
Tables Figures
J I
J I
Back Close
Full Screen / Esc
Printer-friendly Version
Interactive Discussion
Discussion
Paper
|D
iscussionP
aper|
Discussion
Paper
|D
iscussionP
aper|
Fig. 1. Geographical overview. Map of observation stations used in the study, with quality flags in black
(see section 2.1.1) and elevation in purple. Country codes, as definedby ISO (International Organization
for Standardization): DZA=Algeria, TUN=Tunisia, MRT=Mauritania, MLI=Mali, NER=Niger, LBY=Libya,
EGY=Egypt, TCD=Chad and SDN=Sudan. Colour shading gives the orography in m.
24
Figure 1. Geographical overview. Map of observation stations used in the study, with qualityflags in black (see Sect. 2.1.1) and elevation in purple. Country codes, as defined by ISO (In-ternational Organization for Standardization): DZA=Algeria, TUN=Tunisia, MRT=Mauritania,MLI=Mali, NER=Niger, LBY=Libya, EGY=Egypt, TCD=Chad and SDN=Sudan. Colourshading gives the orography in m.
36
Figure 1. Geographical overview. Map of observation stations used in the study, with quality flags in black (see Sect.2.1.1) and el-evation in purple. Country codes, as defined by ISO (International Organization for Standardization): DZA= Algeria, TUN= Tunisia,MRT = Mauritania, MLI= Mali, NER= Niger, LBY= Libya, EGY= Egypt, TCD= Chad and SDN= Sudan. Colour shading gives theorography in m.
rather than focusing on the effect of individual station biaseson their individual results.
Station location, elevation and quality flag values are dis-played in Fig.1. Not surprisingly, SYNOP stations are rarein the interior of the Sahara and more commonly situated onthe fringes, where precipitation is abundant enough to sus-tain vegetation, crops and livestock. The stations in Sudanare all located along the Nile, as are most Egyptian stations.Southern Mauritania and northern Algeria have a relativelygood network. The stations of Bordj Mokhtar (southern Al-geria) and Faya (northern Chad) are particularly valuable dueto their close location to two well-known dust sources. Theformer was the location of a supersite during the recent Fen-nec field campaign (Marsham et al., 2013), while the latteris close to field activities during BoDEx (Washington et al.,2006). The elevations of the stations vary from 2 m (Nouak-chott and Port Said) to 1347 m at Mecheria in the foothills ofthe Atlas Mountains in northern Algeria (Fig.1). The health-iest station records are found in the north, as the distributionof quality flags in Fig.1 indicates. Civil unrest in Sudan maybe the cause of large gaps in the station records, as all stationsthere have an A or B flag. The central and western Sahel sta-tions are most affected by lack of night-time data and moststations there have a 2 flag. This is a problem for the Sahel re-
gion where haboobs commonly occur and are known to upliftdust in the evening and night-time (Marsham et al., 2013).
2.1.2 Satellite observations of normalized differencevegetation index
To better understand temporal variations in emission thresh-old, the main seasonal cycle of vegetation is investigated,which in the Sahel is primarily constrained by precipitation(Fensholt et al., 2012) and is thought to be a better indicatorof soil moisture than rainfall (Nicholson et al., 1990). Thenormalized difference vegetation index (NDVI;Tucker et al.,2005) is a popular proxy for vegetation, especially in semi-arid areas such as the Sahel (Huber and Fensholt, 2011; Ols-son et al., 2005) to which it is particularly well suited. A lim-itation of this data set is that NDVI only detects green vegeta-tion and may overestimate areas with low Leaf Area Indices(Zhu et al., 2013), such as semi-arid regions. After the maingrowing season brown vegetation, which still affects dustemission (Zender and Kwon, 2005), is likely to be left over,but not detected by NDVI. NDVI data are accessed from theGlobal Inventory Modeling and Mapping Studies (GIMMS)database (www.landcover.org), which covers the time period
S. M. Cowie et al.: Dust emission in northern Africa 8583ACPD14, 1–47, 2014
Dust emission innorthern Africa
S. M. Cowie et al.
Title Page
Abstract Introduction
Conclusions References
Tables Figures
J I
J I
Back Close
Full Screen / Esc
Printer-friendly Version
Interactive DiscussionD
iscussionP
aper|
Discussion
Paper
|D
iscussionP
aper|
Discussion
Paper
|
Fig. 2. Schematic to illustrate the estimation of emission thresholds. Orange shading indicates the number
density function of wind-speeds associated with dust emission reports and grey shading represents wind-speeds
for all observations. The arrows signify the wind-speed at which dustemissions make up 25%, 50% and 75%
(red, green and blue respectively) of all reports. Areas A and B arerepresented by grey dots and circles, C and
D with orange dots and circles. For a detailed discussion of this schematic, see section 2.2.1.
25
Figure 2. Schematic to illustrate the estimation of emission thresholds. Orange shading indi-cates the number density function of wind-speeds associated with dust emission reports andgrey shading represents wind-speeds for all observations. The arrows signify the wind-speed atwhich dust emissions make up 25, 50 and 75 % (red, green and blue respectively) of all reports.Areas A and B are represented by grey dots and circles, C and D with orange dots and circles.For a detailed discussion of this schematic, see Sect. 2.2.1.
37
Figure 2. Schematic to illustrate the estimation of emission thresh-olds. Orange shading indicates the number density function of windspeeds associated with dust emission reports and grey shading rep-resents wind speeds for all observations. The arrows signify thewind speed at which dust emissions make up 25, 50 and 75 % (red,green and blue respectively) of all reports. Areas A and B are rep-resented by grey dots and circles, C and D with orange dots andcircles. For a detailed discussion of this schematic, see Sect.2.2.1.
1984–2006 and is calculated for a 24 km by 24 km box overeach station location.
2.2 Methods
2.2.1 Analysis of dust emission thresholds from SYNOPdata
For any land surface, there is a minimum surface stress thatmust be exerted by the wind to generate dust emission. Thisstress closely corresponds to a threshold speed for the low-level wind (Helgren and Prospero, 1987). The threshold windspeed for a surface is determined by the surface roughnessand soil properties (such as particle shapes and sizes, soilcomposition, moisture content and aerodynamic properties)but can also be influenced by previous disturbance of the soils(Gillette et al., 1980). Although we do not have long-termmeasurements of soil conditions, it is possible to statisticallyevaluate which wind speeds are most likely to be associatedwith reported dust emissions.
We use two alternative approaches to measure the rela-tionship between reported dust events and anemometer windspeed. The first method compares the probability densityfunction (PDF) of winds during dust emission events (bot-tom black curve in Fig.2) with those considering all reportsfor a given station (top black curve in Fig.2, and is basedon work by Morales, 1979; Helgren and Prospero, 1987;Kurosaki and Mikami, 2007). Based on these PDFs, the windspeeds at which 25, 50 and 75 % of all observations containa dust emission report can be computed (herein T25, T50 andT75; see vertical lines in Fig.2). Within the remainder of thepaper we focus on T50, but T25 and T75 are useful to de-scribe the range of observed thresholds. A real-world exam-
ACPD14, 1–47, 2014
Dust emission innorthern Africa
S. M. Cowie et al.
Title Page
Abstract Introduction
Conclusions References
Tables Figures
J I
J I
Back Close
Full Screen / Esc
Printer-friendly Version
Interactive Discussion
Discussion
Paper
|D
iscussionP
aper|
Discussion
Paper
|D
iscussionP
aper|
Fig. 3. Example wind climatology for Faya (WMO no. 64753) in Chad (see Fig. 1 for location). Number distri-
bution of surface wind-speed for the time period 1984-2012. Black bars and grey bars give the distribution of all
winds and those associated with dust emission only, respectively. Dust emission frequency ((grey/black)*100)
for each wind-speed bin is given by the blue dots. T25, T50 and T75 threshold values are given in red, green
and blue, respectively.
26
Figure 3. Example wind climatology for Faya (WMO no. 64753) in Chad (see Fig. 1 for location).Number distribution of surface wind-speed for the time period 1984–2012. Black bars and greybars give the distribution of all winds and those associated with dust emission only, respectively.Dust emission frequency ((grey/black) ·100) for each wind-speed bin is given by the blue dots.T25, T50 and T75 threshold values are given in red, green and blue, respectively.
38
Figure 3.Example wind climatology for Faya (WMO no. 64753) inChad (see Fig.1 for location). Number distribution of surface windspeed for the time period 1984–2012. Black bars and grey bars givethe distribution of all winds and those associated with dust emissiononly, respectively. Dust emission frequency ((grey/black) ·100) foreach wind-speed bin is given by the blue dots. T25, T50 and T75threshold values are given in red, green and blue, respectively.
ple from the station of Faya in Chad is shown in Fig.3. Thelarge majority of observed wind speeds are in the range of2–6 m s−1 (black bars). Dust emission starts around 4 m s−1,but remains a small fraction of all observations up to 7 m s−1.Beyond this value the dust fraction increases quickly andfrom 10 m s−1 onwards practically all observations containdust emission reports.
In order to test the relationship between the occurrence ofdust emission and the occurrence of strong winds, we definethe parameter strong wind frequency (SWF) as the percent-age of all wind observations exceeding T50. If the thresholdbehaviour is well defined (as in Fig.3), FDE and SWF shouldbehave in a similar way, but this is not generally the caseand differences will depend on the exact shapes of the twoPDFs. To illustrate the effect, four areas are distinguishedin Fig. 2. Area A represents winds below T50 without dustemission, B winds above T50 without dust emission, C windsbelow T50 with dust emission and D winds above T50 withdust emission. All observations are thenN = A +B+C+D.Consequently, Area C+D represents all dust emission eventsand therefore FDE is the fraction(C+ D)/N . SWF is rep-resented by the fraction(B + D)/N . If FDE = SWF thenthis implies that C= B. Four cases can be distinguished. Ifboth C and B are small, FDE≈ SWF and the threshold mustbe sharp. If both C and B are large, then still FDE≈ SWF,but a large fraction of strong winds are not accompanied bydust emission events, implying a large difference betweenT25 and T75. This could be caused by varying threshold be-haviour due to changes in soil moisture or vegetation, forexample. If B> C, then SWF> FDE and therefore a rela-tively large fraction of strong winds occur without dust. This
8584 S. M. Cowie et al.: Dust emission in northern Africa
implies a rather abrupt start of emissions, and a larger dif-ference between T50 and T75. If B< C, then SWF< FDEand therefore a relatively large fraction of weak winds cre-ate dust events, most likely accompanied by a larger dif-ference between T25 and T50. Out of 18 387 observationsof high winds with no emission from the 70 stations, 434events (2.3 %) experienced a documented rainfall event inthe previous 24 h. This provides evidence that some high-wind events do not produce dust due to high soil moisture.However, as the majority of rainfall values are blank in theSYNOP records, and we cannot ascertain if this is becausethere was no rainfall or no reading, we are cautious of usingSYNOP precipitation to investigate this any further.
The SWF concept is used in the second method to deter-mine an emission threshold. Here, SWF is first calculated fora range of wind-speed thresholds. The value that gives thesmallest total squared difference between the seasonal meandiurnal cycles of FDE and SWF is then selected. A seasonalapproach is preferred here in order to give stable PDFs. Thismethod will be referred to as “least squares” (LS, hereafter).We expect it to give results of the same order as T50 anduse it to test the robustness of the threshold identification ap-proach. A comparison between the threshold values of T25,T50, T75 and LS gives more insight into the relationship be-tween winds and emission than a single value and highlightsthe fact that emission occurs over a range of wind-speed val-ues (Helgren and Prospero, 1987).
2.2.2 Dust-emitting power of winds: dust upliftpotential
FDE provides occurrence frequency of emission, but not itsintensity or quantity. To investigate the dust emitting powerof the wind, we use the diagnostic parameter dust uplift po-tential (DUP;Marsham et al., 2011), based on the emissionparameterisation of (Marticorena and Bergametti, 1995):
DUP= U3(1+ Ut/U)(1− U2t /U2) (1)
for U > Ut, whereU is the measured wind speed andUtis a threshold wind speed for dust emission. DUP is zerowhen U < Ut. This diagnostic takes into consideration thehighly non-linear impact of changes in winds on dust emis-sion. DUP is very closely related to the power of the wind:if the land surface did not vary and the underlying emissionparameterisation was accurate, dust emission would dependonly on DUP. For DUP calculations, we use the seasonallyvarying T50 forUt at each SYNOP station. The dust-emittingpower per strong wind event is given by DUP mean (all DUPvalues, including 0 values)/fraction of strong wind events(SWF× 100) and is referred to as “DUP Intensity”.
ACPD14, 1–47, 2014
Dust emission innorthern Africa
S. M. Cowie et al.
Title Page
Abstract Introduction
Conclusions References
Tables Figures
J I
J I
Back Close
Full Screen / Esc
Printer-friendly Version
Interactive Discussion
Discussion
Paper
|D
iscussionP
aper|
Discussion
Paper
|D
iscussionP
aper|
Fig. 4. Annual emission climatology. Spatial distribution of mean annual FDE (dotsize) and % ratio of emission
to all dust events (including transported events) (dot colour) at 70 stations in northern Africa for the time period
1984-2012.
27
Figure 4. Annual emission climatology. Spatial distribution of mean annual FDE (dot size) and% ratio of emission to all dust events (including transported events) (dot colour) at 70 stationsin northern Africa for the time period 1984–2012.
39
Figure 4. Annual emission climatology. Spatial distribution ofmean annual FDE (dot size) and % ratio of emission to all dustevents (including transported events) (dot colour) at 70 stations innorthern Africa for the time period 1984–2012.
3 Results and discussion
3.1 Single-station climatologies
3.1.1 Annual frequencies of dust emission andtransported dust
Figure4 shows annual mean FDE for all stations for the en-tire investigation period 1984–2012. Despite a lot of varia-tion between stations there are some general patterns in thegeographical distribution. All 11 stations with FDE> 10 %are located between 15 and 23◦ N (large circles, Fig.4). Sit-uated close to an important dust source, the Bodélé Depres-sion, Faya in Chad has a mean FDE of 12 %. Spatial varia-tion is high in Egypt, particularly between the two stations ofKharga (10 %) and Luxor (1 %), which are within 230 km ofeach other. This could be due to local environmental factors,as Kharga is a desert oasis and Luxor is situated on the Nile.FDE values of 5 to 10 % are quite common in the northernSahel and present at the central Algerian stations of Timi-moun, Adrar and In Salah. Values< 5 % are frequent northof 24◦ N in the central and northern Sahara and in the south-ern Sahel. This pattern indicates that, although dust sourcesare found across the entire region, dust emission is generallymore frequent in the semi-arid transition zone between theSahel and Sahara (∼ 15–23◦ N). This is in agreement with theidentification of a “Sahel dust zone” byKlose et al.(2010),though their study included transported events.
To explore the relative contribution of emission to all dustevents at a given station, the ratio of emission to emissionplus transport(BDF+ DSF)/(BDF+ DSF+ TDF) (for def-initions see Sect.2.2.1) is displayed in Fig.4 by the shadingof circles, where light colours indicate more transport anddark colours more emission. Emission generally dominates
S. M. Cowie et al.: Dust emission in northern Africa 8585ACPD14, 1–47, 2014
Dust emission innorthern Africa
S. M. Cowie et al.
Title Page
Abstract Introduction
Conclusions References
Tables Figures
J I
J I
Back Close
Full Screen / Esc
Printer-friendly Version
Interactive Discussion
Discussion
Pa
per|
Discussion
Paper
|D
iscussionP
aper|
Discussion
Paper
|Figure 5. Geographical distribution of emission thresholds. Shown are annual values ofT25, T50 and T75 (for definitions, see Sect. 2.2.1) in red, green and blue, respec-tively. Country codes, as defined by ISO (International Organization for Standardiza-tion): DZA=Algeria, TUN=Tunisia, MRT=Mauritania, MLI=Mali, NER=Niger, LBY=Libya,EGY=Egypt, TCD=Chad and SDN=Sudan.
40
Figure 5. Geographical distribution of emission thresholds.Shown are annual values of T25, T50 and T75 (for defini-tions, see Sect.2.2.1) in red, green and blue, respectively. Coun-try codes, as defined by ISO: DZA= Algeria, TUN= Tunisia,MRT = Mauritania, MLI= Mali, NER= Niger, LBY= Libya,EGY= Egypt, TCD= Chad and SDN= Sudan.
the dust records north of∼ 22◦ N. The largest values of> 90 % are found at many stations in Egypt. The Algerianand Tunisian stations of El Oued, Remada and El Borma (seeFig. 1 for locations) display a local maximum with values> 80 %. This area has been identified as a major dust sourcedue to the dried lakes associated with Chott Jerid and ChottMelrhir (Prospero, 2002; Schepanski et al., 2012). Generallyvalues> 50 % are found in Libya, Tunisia and Algeria, whilefor the majority of Sahelian stations values are< 50 %. Lo-cated close to active source regions, the stations of BordjMokhtar and Faya have transport ratios of 55 and 68 % re-spectively, which are among the highest of any stations southof 22◦ N. Transport events generally dominate Sahelian sta-tions south of 20◦ N. Despite frequent transport reports, thesestations also have FDE mean values comparable to those inthe north, and sometimes higher, making the Sahel a dusthotspot (Klose et al., 2010). The dustiest subregion in north-ern Africa is Sudan with an FDE of more than 10 % at severalstations and in addition to this, a high frequency of trans-port events. Overall, this analysis demonstrates that emissionevents contribute significantly to the frequency of all reporteddust events, which includes transported dust, in this region.
3.1.2 Annual mean dust-emission thresholds
Spatial variations in annual mean dust emission thresholdsare displayed in red, green and blue, representing T25, T50and T75, in Fig.5. Thresholds are generally higher north of22◦ N, with T50 between 10 and 15 m s−1 at many stations inAlgeria, Tunisia, central Libya and Niger. Moderate T50 val-ues of 7–10 m s−1 are found in Egypt, southern Sudan and inparts of the west Sahelian countries of Mali and Mauritania.
ACPD14, 1–47, 2014
Dust emission innorthern Africa
S. M. Cowie et al.
Title Page
Abstract Introduction
Conclusions References
Tables Figures
J I
J I
Back Close
Full Screen / Esc
Printer-friendly Version
Interactive Discussion
Discussion
Paper
|D
iscussionP
aper|
Discussion
Paper
|D
iscussionP
aper|
Fig. 6. Scatter of annual mean frequency of dust events (FDE) against annual mean T50 (for definition, see
section 2.2.1) for each of the 70 individual stations for the period 1984-2012. Correlation coefficient, gradient
of best-fit line and goodness of fit test are given in the top right corner.
29
Figure 6. Scatter of annual mean frequency of dust events (FDE) against annual mean T50(for definition, see Sect. 2.2.1) for each of the 70 individual stations for the period 1984–2012.Correlation coefficient, gradient of best-fit line and goodness of fit test are given in the top rightcorner.
41
Figure 6. Scatter of annual mean frequency of dust events (FDE)against annual mean T50 (for definition, see Sect.2.2.1) for eachof the 70 individual stations for the period 1984–2012. Correlationcoefficient, gradient of best-fit line and goodness of fit test are givenin the top right corner.
The lowest thresholds are found between 16◦ N and 20◦ N inthe northern Sahel, in the west over Mauritania and particu-larly in central/northern Sudan, where T50 values of 5 m s−1
and 6 m s−1 are present at five adjacent stations. Differencesbetween T25, T50 and T75 tend to be largest in the Sahel,consistent with possible influences from seasonal precipita-tion and vegetation there. Larger differences are also foundfor some stations along the Mediterranean coast, where oc-casional cool season rains may have a similar effect. Thereis no clear pattern in the relationship between T25, T50 andT75. For many stations, the three values are quite equallyspaced. At some stations however, particularly in the Sahel,there is a much larger difference between T75 and T50 thanbetween T25 and T50. This result suggests that these areasare occasionally characterised by soil states that do not allowdust emission, even for rather high winds. This could occurin summer when soils are wetter and more vegetated.
It is interesting to question the extent to which these spa-tial differences in thresholds affect dust emission or whethermeteorological factors dominate. Figure6 shows a scatterplot of annual mean FDE and T50 for all 70 stations plottedin Fig. 5. The anti-correlation of−0.54 shows that stationswith low thresholds tend to have more frequent dust events,but the explained variance is only 30 %. The two prominentoutliers are Dongola and Abu Hamed in Sudan, which haveboth very low thresholds and extremely high mean FDEs ofalmost 20 %. These high FDE values could be due to localenvironmental factors such as an easily erodible local source,or local orographic circulations which allow winds to exceedthe threshold regularly.
8586 S. M. Cowie et al.: Dust emission in northern Africa ACPD14, 1–47, 2014
Dust emission innorthern Africa
S. M. Cowie et al.
Title Page
Abstract Introduction
Conclusions References
Tables Figures
J I
J I
Back Close
Full Screen / Esc
Printer-friendly Version
Interactive Discussion
Discussion
Paper
|D
iscussionP
aper|
Discussion
Paper
|D
iscussionP
aper|
Figure 7. Mean seasonal cycle. Monthly mean FDE, split into BDF (green bars) and DSF (redbars) (for definitions, see Sect. 2.1.1), as well as monthly mean NDVI (blue lines) calculated fora 24km×24km box centred on each station. The x axis runs from January to December. They axis scale is 0–40 % for FDE and 0–5000 for NDVI. Areas of grouped stations, discussed inSect. 3.2.1, are shown with shaded black ellipses and labels.
42
Figure 7. Mean seasonal cycle. Monthly mean FDE, split into BDF (green bars) and DSF (red bars) (for definitions, see Sect.2.1.1), as wellas monthly mean NDVI (blue lines) calculated for a 24km× 24km box centred on each station. Thex axis runs from January to December.They axis scale is 0–40 % for FDE and 0–5000 for NDVI. Areas of grouped stations, discussed in Sect.3.2.1, are shown with shaded blackellipses and labels.
3.1.3 Seasonal cycles in frequency of dust emission andvegetation
Figure7shows station mean monthly values of FDE split intothe contribution from BDF (green) and DSF (red). Each indi-vidual station plot can be found in Fig. S4 in the Supplement.Not surprisingly BDF dominates at all stations. DSF arequite rare, but relatively more common in the Sahel, particu-larly between 15 to 20◦ N. At many stations across Algeria,Tunisia, Libya, Egypt and Sudan FDE is highest in spring.The remaining stations, mostly situated in the central andwestern Sahel, have variable seasonal cycles, though mostdisplay reduced FDE in autumn. At the southernmost stationsFDE is practically zero in late summer/early autumn whenrainfall and vegetation cover are high. FDE peaks in summerat the central Saharan station Bordj Mokhtar, which could berelated to the SHL and the arrival of convective cold poolsfrom the northern Sahel during the peak of the summer mon-soon as discussed inMarsham et al.(2013). Faya, the onlystation in Chad, shows high values of both FDE and DSF dur-ing the winter half year (Washington and Todd, 2005), whenthe harmattan is strongest, while monsoon-related summerdust storms are much rarer here.
Some of the seasonality evident from Fig.7 is con-sistent with the seasonal cycle of vegetation cover. Themost southerly stations, including Nioro Du Sahel, Niamey,Gouré, Nyala and El Obeid, show a marked increase inNDVI (blues lines in Fig.7) in autumn following the sum-mer rainfall maximum (Fensholt et al., 2012). These signals
get weaker towards the northern Sahel and are absent in cen-tral Mauritania and at Bordj Mokhtar. In Egypt, the three sta-tions situated on the banks of the Nile (Minya, Asyut andLuxor) contrast with desert oasis stations of Baharia, Farafraand Kharga, which have no seasonal cycle in vegetation. Asthe Nile river flow in Egypt is controlled by the upstreamAswan Dam, and this region experiences little rainfall, it ispossible that the seasonal cycle is driven by agriculture andanthropogenic activities. There are some subtle changes inseasonal vegetation at northern Algerian stations, but overallin Algeria and Libya it is unlikely that vegetation has a majorinfluence on seasonal dust cycles.
3.2 Climatologies from grouped stations
3.2.1 Rationale for grouping of stations
As discussed in the Introduction, there are numerous dustemitting mechanisms over northern Africa, creating distinctseasonal and diurnal cycles in different regions, while indi-vidual stations may also be influenced by very local factorssuch as topography or nearby obstacles (trees, buildings etc.).For further discussion of the climatology, six geographicalgroups of stations are defined: Northern Algeria (N Algeriahereafter), Central Sahara (C Sahara), Western Sahel (W Sa-hel), Central Sahel (C Sahel), Egypt and Sudan (see ellipsesin Fig. 7). This was done subjectively by looking for simi-lar characteristics in the seasonal and diurnal dust cycles aswell as using literature and wind-direction climatologies toidentify similar seasonal wind regimes. The reasoning behind
S. M. Cowie et al.: Dust emission in northern Africa 8587
station selection in each group is discussed further below.Grouped values are calculated by taking a mean of a givenvariable (T25, T50, T75, LS, FDE, DBF, DSF, SWF, DUPmean), which has before been calculated separately for eachstation in the group. DUP Intensity is calculated after DUPand SWF have been group averaged first. Therefore each sta-tion is equally weighted within the group, but this comes withthe caveat that stations with gaps and biases in their recordare weighted equally to stations with more complete records.
N Algeria experiences a Mediterranean climate with wetwinters, associated with Atlantic cyclones and Mediter-ranean depressions, and hot, dry summers (Warner, 2004).Saharan, orSharavas they are known in NW Africa, cy-clones are a key feature here in spring (Hannachi et al., 2011)and play a role in dust source activation (Schepanski, 2009;Fiedler et al., 2013b). Analysis of the wind direction (notshown) suggests that the background flow, hence large-scaleinfluence, are similar at the stations of Biskra, El Oued, Toug-gourt, Ghardaia, Elbayadh, Hassi Messaoud, Ouargla andMecheria which make up the N Algeria group. Quality flagsof 1 apply to all eight stations due to unbiased and unbro-ken time series of data (Fig.1). Six of the eight stations aresituated in the low-lying area to the southeast of the AtlasMountains, while Mecheria and Elbayadh are located in thefoothills and have elevations of 1149 m and 1347 m, respec-tively.
The C Sahara group is situated further south, between 27–30◦ N, and 1◦ W–14◦ E. The stations of Timimoun, Adrar, InSalah, In Amenas, Ghadames and Sebha experience a dif-ferent meteorological regime to that of N Algerian stations.Rainfall is scarce and winds, which are generally higher, havean easterly or northeasterly direction. Similar to N Algeria,all stations have a quality flag of 1 (Fig.1) and show a peakin FDE in spring (Fig.7). In Egypt, we focus on the seveninland stations of Baharia, Farafra, Kharga, Minya, Asyut,Luxor and Aswan within the region 23–28◦ N, 27–33◦ Ewhich are characterised by a similar N–NW wind regime.Only Farafra has quality issues, with 1B flag indicating a pe-riod > 5 years with reduced observations (Fig.1). Despitesome seasonal variation in the vegetation cycle at stations onthe banks of the Nile (Minya, Asyut and Luxor, see Fig.7),the overall seasonal cycle of dust is similar with a spring peakin FDE, most likely caused by the seasonality of meteorolog-ical factors.
Two groups of stations in the Sahel are considered. TheW Sahel group is comprised of the inland stations of Kiffa,Aioun El Atrouss, Nioro Du Sahel, Kaedi, Nema, Tombouc-tou, Gao and Tidjika, and encompasses the region 13–19◦ N,13◦ W–0◦ E. The C Sahel stations include Bilma, Niamey,Gouré and Agadez in Niger and Faya in Chad. The main dif-ference between the two groups is that the summer monsoonand its interactions with the SHL drive summer emissions inW Sahel, but have less influence over the C Sahel stations,which are united by the domination of the winter harmattanwinds as a driver of the frequency of dust emission (Fig.7).
As is common with nearly all Mauritanian stations, five ofthe eight stations in the W Sahel group have a daytime biasand four have gaps of< 5 years as indicated with flags of 2and A respectively (Fig.1). The quality of C Sahel stations ismixed, with healthy stations of Niamey and Gouré achievingquality flags of 1, in contrast to Faya with a 2B flag (Fig.1).
The Sudan group consists of Wadi Halfa, Abu Hamed,Dongola, Karima and Atbara and lies within the coordi-nates 17–22◦ N, 30–34◦ E. This excludes the southern sta-tions, where the influence of the monsoon is felt in summer.Only Atbara receives small amounts of summer rains. FromKarima up to Wadi Halfa, the stations remain in a consis-tently northerly flow and experience almost no rainfall. Bquality flags apply to these stations to indicate gaps in therecord> 5 years, which coincide with periods of civil unrest(Fig. 1).
3.2.2 Seasonal cycle in dust-emission thresholds
To summarise and complement the discussion based onFig.5 in Sect.3.1.2, seasonal values of T25, T50, T75 and LSdust emission thresholds are presented here (Fig.8), whichare first calculated for each station and then averaged overthe group. The LS values are typically within 1 m s−1 fromT50, but deviations of up to 2.5 m s−1 also occur for somegroups in some seasons. Consistent with Fig.5, Fig.8 showsthat the highest thresholds are observed at the N Algeria sta-tions with an annual mean of 11.5 m s−1 followed by the CSahara group. The lowest thresholds are observed in Sudanwith a mean of 5.7 m s−1. The maximum seasonal thresholdof 12.5 m s−1 occurs in the wet N Algerian winter, while Su-dan thresholds fall to a minimum of 5.5 m s−1 in spring.
Seasonal variability is highest in the summer monsoon-influenced Sahel, particularly the C Sahel where thresholdsare a mean of 2.8 m s−1 higher in summer than in winter.In contrast to this Sudan thresholds vary by only 0.5 m s−1.The seasonal transition from low thresholds to high thresh-olds takes place in summer in W Sahel and in spring in theC Sahel, where two of the southernmost stations are located.In both regions T75 increases before T50 and T25. We hy-pothesise that this is due to infrequent early-season precipita-tion events, which moisten soils so that no emission can takeplace. Just a few of these events could create the increase inD75, while for the majority of the time it is still dry enoughto allow for dust emission such that T25 and T50 do not risesimilarly.
Standard deviations in thresholds between stations withineach group (indicated by error bars in Fig.8) are largest insummer in the C Sahara and C Sahel, in winter in N Alge-ria and in autumn in the W Sahel and Egypt. Interestinglythese increases in spatial variability within a region are usu-ally accompanied by an increase of the threshold itself. Thismay indicate that the changes in soil moisture and vegetationthat cause the threshold to rise are inhomogeneous across theregion. However, higher thresholds typically also coincide
8588 S. M. Cowie et al.: Dust emission in northern Africa
ACPD14, 1–47, 2014
Dust emission innorthern Africa
S. M. Cowie et al.
Title Page
Abstract Introduction
Conclusions References
Tables Figures
J I
J I
Back Close
Full Screen / Esc
Printer-friendly Version
Interactive Discussion
Discussion
Paper
|D
iscussionP
aper|
Discussion
Paper
|D
iscussionP
aper|
Fig. 8. Seasonal threshold values averaged over six station groups (see section 3.2.1 for definition): a) N
Algeria, b) C Sahara, c) Egypt, d) W Sahel, e) C Sahel and f) Sudan according to the legend in the top left panel
(for definition of thresholds, see section 2.2.1). The dashed black lines indicate the annual mean T50. Seasons
are December, January, February (DJF), March, April, May (MAM), June, July, August (JJA) and September,
October, November (SON).
31
Figure 8. Seasonal threshold values averaged over six station groups (see Sect. 3.2.1 fordefinition): (a) N Algeria, (b) C Sahara, (c) Egypt, (d) W Sahel, (e) C Sahel and (f) Sudanaccording to the legend in the top left panel (for definition of thresholds, see Sect. 2.2.1). Thedashed black lines indicate the annual mean T50. Seasons are December, January, February(DJF), March, April, May (MAM), June, July, August (JJA) and September, October, November(SON).
43
Figure 8. Seasonal threshold values averaged over six station groups (see Sect.3.2.1for definition):(a) N Algeria, (b) C Sahara,(c) Egypt,(d) W Sahel,(e)C Sahel and(f) Sudan according to the legend in the top left panel (for definition of thresholds, see Sect.2.2.1). The dashedblack lines indicate the annual mean T50. Seasons are December, January, February (DJF), March, April, May (MAM), June, July, August(JJA) and September, October, November (SON).
with fewer dust observations, which reduces confidence inthe threshold estimates.
3.2.3 Seasonal cycle in dust emission
Figure 9 shows the seasonal evolutions of BDF, DSF andFDE (bars) together with those of SWF, DUP and DUP In-tensity (lines) for the six groups. The latter three are based onseasonal, rather than monthly, T50 values (season boundariesare indicated by thin vertical lines in Fig.9). This slight in-consistency is undesirable, but necessary to obtain sufficientdata to estimate stable thresholds. The influence of using sea-sonal, instead of annual mean, thresholds is rather insignifi-cant and consistent with the relatively minor changes seen inFig. 8. For example, monthly correlations between FDE andSWF vary on average by only 0.08 from when using eithera seasonally varying, or a fixed annual mean, T50 threshold.
Spring is the dominant season in the N Algeria group asexpected from Fig.7, with a maximum FDE of 7 % in April.DSF is very low in this region throughout the year withlargest values also in April. The annual cycle of SWF fol-lows that of FDE closely with a correlation of 0.99, but withvalues consistently 1–2 % lower. As discussed in Sect.2.2.1,this implies a relatively large area C (winds below T50 whichdo produce emission) in Fig.2 and is consistent with theslightly larger difference between T50 and T25 than that be-tween T50 and T75 in Fig.8a. As the region with the high-est threshold of all groups, T25 is already well above typi-cal emission thresholds found in the literature (Helgren andProspero, 1987; Chomette et al., 1999), creating this ratherbroad range of wind speeds which can and cannot producedust. The annual cycle of DUP agrees with FDE on the over-all peak in spring. The ratio of DUP to SWF (“DUP Inten-sity”) indicates a relatively low mean intensity from February
S. M. Cowie et al.: Dust emission in northern Africa 8589
ACPD14, 1–47, 2014
Dust emission innorthern Africa
S. M. Cowie et al.
Title Page
Abstract Introduction
Conclusions References
Tables Figures
J I
J I
Back Close
Full Screen / Esc
Printer-friendly Version
Interactive Discussion
Discussion
Paper
|D
iscussionP
aper|
Discussion
Paper
|D
iscussionP
aper|
Fig. 9. Mean seasonal cycle for the six station groups (see section 3.2.1 for definitions): a) N Algeria, b) C
Sahara, c) Egypt, d) W Sahel, e) C Sahel and f) Sudan. Monthly frequency of FDE, split into BDF (green bars)
and DSF (red bars), as well as SWF (blue line), DUP mean (solid purple)and DUP Intensity (DUP mean/SWF,
dashed purple, maximum values given), all computed using the seasonally varying T50 (for definitions of
parameters, see section 2.2.1). Thin vertical black lines indicate seasonal boundaries where thresholds change.
Note the different vertical axes for DUP intensity.
32
Figure 9. Mean seasonal cycle for the six station groups (see Sect. 3.2.1 for definitions): (a) NAlgeria, (b) C Sahara, (c) Egypt, (d) W Sahel, (e) C Sahel and (f) Sudan. Monthly frequencyof FDE, split into BDF (green bars) and DSF (red bars), as well as SWF (blue line), DUP mean(solid purple) and DUP Intensity (DUP mean/SWF, dashed purple, maximum values given), allcomputed using the seasonally varying T50 (for definitions of parameters, see Sect. 2.2.1). Thinvertical black lines indicate seasonal boundaries where thresholds change. Note the differentvertical axes for DUP intensity.
44
Figure 9. Mean seasonal cycle for the six station groups (see Sect.3.2.1for definitions):(a) N Algeria,(b) C Sahara,(c) Egypt,(d) W Sahel,(e) C Sahel and(f) Sudan. Monthly frequency of FDE, split into BDF (green bars) and DSF (red bars), as well as SWF (blue line), DUPmean (solid purple) and DUP Intensity (DUP mean/SWF, dashed purple, maximum values given), all computed using the seasonally varyingT50 (for definitions of parameters, see Sect.2.2.1). Thin vertical black lines indicate seasonal boundaries where thresholds change. Note thedifferent vertical axes for DUP intensity.
to July and much higher values from September to January.This suggests that less frequent dust events during the coolseason are more intense when they occur. Mediterranean cy-clones could be the meteorological mechanism creating high-intensity events in the cool season. As shown by Fig.8a, win-ter is also the time when thresholds are slightly increased,requiring a more extreme meteorological event to generatedust.
Several of these features are broadly reproduced in theC Sahara (Fig.9b), but values of both FDE and DUP aresignificantly higher than in N Algeria (note identical FDEand DUP scales in all panels of Fig.9). Here, FDE peaksat 10 % in April with a secondary autumn maximum in bothDUP and FDE which is less significant than the spring max-imum. DUP Intensity is less seasonally variable than in NAlgeria with typical values around 14 000 m3 s−3, which isslightly lower than in N Algeria (note the variable DUP In-
tensity scales between panels in Fig.9). Egypt (Fig.9c) alsoagrees with the former two regions with respect to the springmaximum and secondary maximum in autumn FDE. The an-nual FDE peak is 10 % in April and the annual mean is∼ 2 %higher than N Algeria. SWF is considerably lower here thanFDE but shows a similar annual cycle. Less frequent strongwinds could, to some extent, explain the lower DUP meanvalues. The clearest difference is the clear peak in DUP In-tensity in November, though overall DUP Intensity is lowerthan N Algeria and C Sahara. High DUP Intensity in autumncould be due to occasional storms from the Mediterraneanaffecting northeastern Africa, during a time when thresholdsare slightly increased (Fig.8c).
Behaviour is fundamentally different over the two Sahe-lian regions (Fig.9d and e). A similar effect on dust concen-tration was observed byMarticorena et al.(2010) for two sta-tions located within the C and W Sahel regions. The C Sahel,
8590 S. M. Cowie et al.: Dust emission in northern Africa
which contains more southern stations, displays a longer lowdust season. W Sahel is located closer to the centre of theSHL in summer, which may contribute to dust emissions intoJune and even July. In both regions the agreement in magni-tude between FDE and SWF is better than for the three north-ern regions, indicating a better balance between low windswith dust and high winds without dust. Annual mean DSFis higher than in the three northern regions, possibly point-ing to more productive dust sources. DUP mean and SWFcorrelate well with FDE (0.94 and 0.98, respectively) in WSahel with absolute values similar to N Algeria. DUP Inten-sity is lowest in winter, despite February being the monthof highest FDE. This could be due to the lack of haboobsin this season which have a significant contribution to DUPthe rest of the year. The annual cycle in FDE is very differ-ent in the C Sahel. Both DUP and SWF have correlations of0.97 with FDE, but here the winter is the only main dust sea-son, driven by strong NE harmattan winds and frequent LLJbreakdown in this season (Washington et al., 2006; Schep-anski et al., 2009). The southern stations in this region havea clear vegetation increase in autumn (Fig.7) which couldalso decrease FDE levels and contribute to higher dust emis-sion thresholds (Fig.8e), though this may not necessarily berepresentative of the more northern and arid stations of Bilmaand Faya (Fig.1). Extremely intense, local emissions werefound to be important to dust concentrations inMarticorenaet al.(2010) in the Sahel summer months, associated with thepassage of mesoscale convective systems (MCSs). However,with their short durations of less than 1 h at the observationstations, MCSs may not be properly represented by the 3-hourly SYNOP data used here.
It is interesting to compare the C and W Sahel regionswith that at Bordj Mokhtar, immediately to the north ofthe Sahel (Fig.10). High year-round dust emission reachesa maximum of 18 % in July, followed by August and Juneand all three months have high DSF. This summer maxi-mum is also identified in TOMS AI measurements (Engel-staedter and Washington, 2007). This station is too far northto get enough monsoonal precipitation to suppress sourcestrength. However, it is likely that cold pools from Saheliansquall lines could reach Bordj Mokhtar during the summerto cause the observed peak. This leads to high DUP valuesin June, July and August, likely underestimated due to thefact that only daytime cold pools are detected (no data from21:00–03:00 UTC) which will have weakened by the timethey reach the station, if formed the previous night.
Northern Sudan (Fig.9f) stands out as having the highestFDE year-round (annual mean of 13 %), though DUP val-ues are not comparably increased, suggesting frequent lower-energy events. DSF is a little higher than in the three north-ern regions here, particularly during June–September, but notas high as in the W and C Sahel. The most active monthis March with an FDE of 20 %, while September showsa secondary peak similar to that in the three northern groups(Fig. 9a–c). DUP Intensity is the lowest of the six regions
but peaks during the second maximum in September. SWFis consistently higher than FDE (annual mean of 17 %), butwith a similar annual cycle resulting in a correlation of 0.95.This may well be a reflection of the very low threshold in thisregion (Fig.8f), below which dust emission will be very rare.
3.2.4 Diurnal cycle and meteorological mechanisms
The 3-hourly resolution of SYNOP reports also allows theinvestigation of seasonal mean diurnal cycles of FDE, DUPand DUP Intensity (as defined in Figs.9 and 10) for eachgroup (Figs.11 and 12). For N Algeria (left column ofFig. 11), there are stark contrasts between day and night dur-ing all seasons. Maximum FDE is at 15:00 UTC (16:00 localtime, LT) in all seasons but summer, when values are slightlyhigher at 12:00 UTC and emission extends longer into thenight. The minimum is at 06:00 UTC year-round. The di-urnal cycle of DUP largely follows that of FDE with someminor shifts, such as a maximum at 12:00 UTC in winterand autumn. Consistent with previous discussions, FDE andDUP reach comparable magnitudes in winter, summer andautumn, but are higher in spring (note the different scales).DUP Intensity tends to oppose the FDE and DUP diurnal cy-cles, with peaks at night and smaller values during the day,though this is less pronounced in N Algeria spring (Fig.11b).During winter and autumn, when nights are comparably longand column water vapour tends to be low, radiative coolingcan create strong surface inversions that can only be brokenby the strongest storms with wind speed well above the emis-sion threshold, leading to fewer events with larger DUPs.This behaviour is still evident in summer and spring, butless pronounced. Overall, the diurnal cycle found for this re-gion suggests that NLLJ breakdown in the morning couldplay a role, leading to rapid increases in FDE and DUP be-tween 06:00 and 12:00 UTC. The continuation of high val-ues into the afternoon, when the boundary layer typically isdeepest, indicates additional momentum sources above thatof the NLLJ. These are likely related to thermal wind contri-butions caused by baroclinic zones due to mountains (Sten-srud, 1996), land–sea contrasts (Todd et al., 2013) or thepresence of the subtropical jet. The growth of the boundarylayer due to heating of the surface will also contribute by ac-cessing these upper level thermal wind contributions around12:00–15:00 UTC and mixing down more intense turbulence.In summer, the extension of FDE and DUP into the eveningmay be related to convective cold pools as discussed inKnip-pertz et al.(2007) for the Atlas Mountains and inEmmelet al.(2010) for Morocco.
The C Sahara regions (middle column in Fig.11) alsoshows a marked day–night contrast, but with some remark-able deviations from N Algeria. The FDE maximum is at09:00 UTC in all seasons but winter (where it is 12:00 UTC),suggesting a relatively more important role of the morningbreakdown of NLLJs. This is most likely related to a largerdistance from baroclinic zones, which reduces the likelihood
S. M. Cowie et al.: Dust emission in northern Africa 8591
ACPD14, 1–47, 2014
Dust emission innorthern Africa
S. M. Cowie et al.
Title Page
Abstract Introduction
Conclusions References
Tables Figures
J I
J I
Back Close
Full Screen / Esc
Printer-friendly Version
Interactive Discussion
Discussion
Paper
|D
iscussionP
aper|
Discussion
Paper
|D
iscussionP
aper|
Fig. 10. As Fig. 9 but for Bordj Mokhtar (WMO number 60686).
33
Figure 10. As Fig. 9 but for Bordj Mokhtar (WMO number 60686).
45
Figure 10.As Fig. 9 but for Bordj Mokhtar (WMO number 60686).
of afternoon LLJ breakdown as the boundary layer grows.An additional factor could be that LT is slightly later forthe Libyan stations in this region, possibly resulting in somelater emissions being included at an earlier SYNOP hour.Consistent with previous figures, FDE and DUP are high-est in spring, followed by summer and winter, then lowestin autumn. DUP Intensity drops during the day in summerand autumn, but actually increases in winter and spring day-time following a dip before sunrise. Diurnal DUP Intensityvaries less in winter and spring and dips before sunrise incontrast to summer and autumn where DUP Intensity is highat night. In summer, when nights are relatively short and sta-bility is weaker, early breakdowns of NLLJ could play a roleas well as ageing cold pools from afternoon convection overthe Hoggar Mountains.
In Egypt (right column in Fig.11) diurnal cycles inFDE and DUP are stable throughout the year with mini-mum at 03:00 UTC (05:00 LT) and maximum at 12:00 UTC(14:00 LT), suggesting some influence of NLLJ breakdown,deep boundary layer mixing during the afternoon and per-haps the general presence of daytime dry convection. DUPIntensity is consistent all year, with a peak at 03:00 UTC andminimum at 15:00 UTC. This is related to the diurnal cycleof stability as discussed before.
The analysis of the diurnal cycles in W and C Sahelis complicated by fewer night-time observations comparedwith daytime (2 in quality flags, Fig.1). This introduceslarger random error in night-time values in these locations.This is unfortunate, as convective cold pools are expectedto affect these regions during the evening and night. Bothgroups of stations show a clear daytime peak in FDE allyear. In the W Sahel (left column of Fig.12) this occursat 12:00 UTC, in the C Sahel (middle column of Fig.12) at09:00 UTC (10:00 LT), suggesting a strong influence of theNLLJ in all seasons. The DUP Intensity cycle is consistentwith the other regions; low during the day and high at night.Any sharp increases in DUP and DUP Intensity at night,such as 21:00 UTC (Fig.12f and g) and 18:00 (Fig.12h),
are possibly artefacts of the low number of observations atthis reporting time which allow a small number of individualevents, possibly only reported because they are exceptional,to dominate the statistics.
In Sudan (right column of Fig.12) FDE shows again max-ima at 09:00–12:00 UTC (14:00 LT) in winter and spring, andonly 09:00 UTC (11:00 LT) in summer and autumn. FDE re-mains relatively high during the night, too, with values neverdropping below 5 %. When compared to the diurnal cycleof N Algeria (Fig. 11) where emission never exceeds 5 %in winter, summer or autumn, this highlights the strong per-manent presence of dust emission in Sudan. The high val-ues at night in Sudan could be due to orographic flow in theNile valley, indicated by consistent dips in emission just be-fore and after sunrise, or occasional haboob storms in sum-mer. DUP and DUP Intensity show relatively flat diurnal cy-cles, with lower intensities during the second half of the day,which suggests weaker events or an overestimation of emis-sion by the observer due to the already high dust levels in theatmosphere.
4 Conclusions
This is the first detailed analysis of dust emission from long-term surface SYNOP observations over the Saharan and Sa-hel region. Data quality is a major issue in this area and weattempt to balance quality of the data set with spatial cover-age by including imperfect station records and making theirlimitations clear. Initial criteria were used to eliminate ex-tremely biased and patchy stations or those that simply didnot have enough dust reports to make meaningful statisticsfrom, which left 70 stations to work with. Quality flags as-signed to these stations gave indications as to the results thatshould be approached with caution, such as the diurnal cy-cle in the Sahel where a daytime bias is present. Frequencyof dust emission (FDE) is compiled from present weather re-ports of 7–9, 30–35 and 98 divided by the total number ofreports. These statistics are further split into dust storm fre-quency (DSF) which includes only reports of 9, 30–35 and98 and blowing dust frequency (BDF) with associated reportsof 7 or 8. Dust uplift potential (DUP,Marsham et al., 2011)is used to investigate the dust emitting power of the wind.Strong wind frequency (SWF) is calculated in the same wayas FDE but using 10 m surface winds over a threshold insteadof dust emission reports. Reports over 55 kn are excluded dueto low confidence in their accuracy. DUP Intensity is DUPmean per SWF and gives an indication of the type of dustevents which might be occurring. The regional differences inthe seasonal and diurnal cycles of dust emission were pre-sented and discussed by subjectively separating stations intosix groups with similar meteorological regimes.
Thresholds were determined objectively in two ways.First, by comparing the PDFs of dust emission and wind-speed observations to give the 25, 50 and 75 % probabilities
8592 S. M. Cowie et al.: Dust emission in northern Africa ACPD14, 1–47, 2014
Dust emission innorthern Africa
S. M. Cowie et al.
Title Page
Abstract Introduction
Conclusions References
Tables Figures
J I
J I
Back Close
Full Screen / Esc
Printer-friendly Version
Interactive Discussion
Discussion
Paper
|D
iscussionP
aper|
Discussion
Pa
per|
Discussion
Pa
per|
Fig. 11. Diurnal cycles of FDE (solid black), DUP mean (solid purple) and DUP Intensity (dashed purple) for
N Algeria (column 1), C Sahara (column 2) and Egypt (column 3) for DJF (row 1), MAM (row 2), JJA (row 3)
and SON (row 4) (see section 3.2.1 for definition of regions). For definitions of parameters, see section 2.1.1.
34
Figure 11. Diurnal cycles of FDE (solid black), DUP mean (solid purple) and DUP Intensity(dashed purple) for N Algeria (column 1), C Sahara (column 2) and Egypt (column 3) for DJF(row 1), MAM (row 2), JJA (row 3) and SON (row 4) (see Sect. 3.2.1 for definition of regions).For definitions of parameters, see Sect. 2.1.1.
46
Figure 11. Diurnal cycles of FDE (solid black), DUP mean (solid purple) and DUP Intensity (dashed purple) for N Algeria (column 1),C Sahara (column 2) and Egypt (column 3) for DJF (row 1), MAM (row 2), JJA (row 3) and SON (row 4) (see Sect.3.2.1for definition ofregions). For definitions of parameters, see Sect.2.1.1.
of dust emission and second, by calculating the least squaresdifference in the diurnal cycle of the frequency of bothdust emission (FDE) and strong winds (SWF). Annualmean grouped thresholds range from 5.7 m s−1 in Sudan to11.5 m s−1 in N Algeria. In general, thresholds are higherin the hyper-arid Sahara north of 22◦ N. Seasonal variationsin thresholds are largest in the Sahel and smallest in Sudan.In arid Sudan (this work focuses on the northern stations ofSudan) there is significantly less rainfall than in the Sahel.Hence, there will be less seasonal variation in soil charac-teristics leading to less-variable thresholds in Sudan. Thereis also evidence of soil moisture varying in time when T75
increases before T25 in the Sahel transition from high- tolow-emission seasons.
Spatially, annual mean observed emission is highest be-tween 16 and 24◦ N. Emission events are more frequent thantransported events north of 24◦ N, while south of this, al-though FDE is high, the frequency of transported events iseven higher. This highlights the overall more frequent pres-ence of dust in the atmosphere south of 24◦ N (Klose et al.,2010). Outside the Sahel, FDE and DUP peak in spring, re-lated to strong pressure gradients in this season. The Sa-hel does have high emission in spring but the seasonal cy-cle is more complex with the influences of both the Saha-ran Heat Low and monsoon-related haboobs, which create
S. M. Cowie et al.: Dust emission in northern Africa 8593 ACPD14, 1–47, 2014
Dust emission innorthern Africa
S. M. Cowie et al.
Title Page
Abstract Introduction
Conclusions References
Tables Figures
J I
J I
Back Close
Full Screen / Esc
Printer-friendly Version
Interactive Discussion
Discussion
Paper
|D
iscussionP
aper|
Discussion
Paper
|D
iscussionP
aper|
Fig. 12. As Fig. 11 but for W Sahel (column 1), C Sahel (column 2) and Sudan (column 3).
35
Figure 12. Diurnal cycles of FDE (solid black), DUP mean (solid purple) and DUP Intensity(dashed purple) for W Sahel (column 1), C Sahel (column 2) and Sudan (column 3) for DJF(row 1), MAM (row 2), JJA (row 3) and SON (row 4) (see Sect. 3.2.1 for definition of regions).For definitions of parameters, see Sect. 2.1.1.
47
Figure 12. Diurnal cycles of FDE (solid black), DUP mean (solid purple) and DUP Intensity (dashed purple) for W Sahel (column 1),C Sahel (column 2) and Sudan (column 3) for DJF (row 1), MAM (row 2), JJA (row 3) and SON (row 4) (see Sect.3.2.1for definition ofregions). For definitions of parameters, see Sect.2.1.1.
more summer emission in the W Sahel, but hardly affect theC Sahel. In the C Sahel a particularly strong harmattan flow,with embedded NLLJs, create strong emissions in winter andearly spring. Bordj Mokhtar (southern Algeria), the only sta-tion between the Sahel and the central Sahara, has a strongsummer peak in FDE and DUP. Despite an absence of night-time data, the presence of haboobs at this location in the Sa-hara is indicated by the jump in FDE, DUP and DUP Inten-sity in June.
Seasonal variation in emission frequency is mostly con-trolled by strong wind frequency, indicated by high corre-lations between FDE and SWF in all areas, which changeslittle when SWF is calculated with a seasonally variable or
annually fixed threshold. However, the relationship betweenFDE and DUP is more complex, as more frequent events donot necessarily mean more emission. DUP is most closelyrelated to FDE in the C Sahara, and so intensity (DUP perSWF) is relatively constant. This shows that here the strengthof the winds that generate emission does not vary much sea-sonally. DUP and FDE are typically higher during the day,relative to night, when atmospheric stability increases and in-hibits strong winds. As a consequence, any emission whichdoes take place is likely to require a stronger wind in order toovercome this stability. High night-time DUP Intensity val-ues support this conclusion.
8594 S. M. Cowie et al.: Dust emission in northern Africa
Our results are consistent with currently understanding ofvegetation growth in the Sahel and its role in decreasingemissions in late summer and autumn. We find high levelsof summer emissions in the SHL region, despite the fact thatthe only station in this area, Bordj Mokhtar, may be missingup to 50 % of emission events (Marsham et al., 2013) throughabsent night-time observations. The NLLJ is observed in thediurnal cycle of Niger and Chad stations which is in line withpast work close to the Bodélé Depression byWashingtonet al.(2006, 2009). Evidence here suggests that NLLJs, creat-ing frequent morning emission, are the dominant mechanismin the central Sahara and central Sahel, while in other regionsit is difficult to separate NLLJ breakdown from other factors,such as boundary layer growth eroding daytime LLJs. Thesedaytime LLJs can be formed in response to complex terrain,mountains or land–sea air temperature contrasts.
The results of this climatology are a stepping stone to-wards improving our understanding of the overall mech-anisms which influence the frequency of dust events andstrong winds. By characterising the data set limitations andadvantages we are in a better position to use it to evaluateother data sets such as reanalyses, output from dust modelsand satellite data, which come with their own caveats. Mov-ing on from the work presented here we aim to combine theseresults with additional information from reanalysis data tofurther explore the relative contribution of different mecha-nisms to the dust cycle.
The Supplement related to this article is available onlineat doi:10.5194/acp-14-8579-2014-supplement.
Acknowledgements.This work is funded by the European ResearchCouncil as part of the “Desert Storms” project under grant 257543.We acknowledge support by Deutsche Forschungsgemeinschaftand the Open Access Publishing Fund of Karlsruhe Instituteof Technology. NDVI is compiled from Advanced Very HighResolution Radiometer data and is available from the GlobalInventory Modeling and Mapping Studies (GIMMS) database(www.landcover.org) for the time period 1984–2006.
Edited by: X. Querol
References
Ackerman, S. and Cox, S.: Surface Weather Observations Of At-mospheric Dust Over the Southwest Summer Monsoon Region,Meteorol. Atmos. Phys., 41, 19–34, doi:10.1007/BF01032587,1989.
Allen, C. J. T., Washington, R., and Engelstaedter, S.: Dustemission and transport mechanisms in the central Sa-hara: Fennec ground-based observations from Bordj BadjiMokhtar, June 2011, J. Geophys. Res.-Atmos., 118, 6212–6232,doi:10.1002/jgrd.50534, 2013.
Bagnold, R.: The physics of blown sand and desert dunes, DoverPublications, Mineola, NY, USA, 85–95, 1941.
Bou Karam, D., Flamant, C., Knippertz, P., Reitebuch, O., Pelon, J.,Chong, M., and Dabas, A.: Dust emissions over the Sahel asso-ciated with the West African monsoon intertropical discontinuityregion: A representative case-study, Q. J. Roy. Meteor. Soc., 134,621–634, 2008.
Bristow, C. S., Hudson-Edwards, K. A., and Chappell, A.: Fertiliz-ing the Amazon and equatorial Atlantic with West African dust,Geophys. Res. Lett., 37, L14807, doi:10.1029/2010GL043486,2010.
Chomette, O., Legrand, M., and Marticorena, B.: Determination ofthe wind speed threshold for the emission of desert dust usingsatellite remote sensing in the thermal infrared, J. Geophys. Res.-Atmos., 104, 31207–31215, 1999.
Cowie, S. M., Knippertz, P., and Marsham, J. H.: Are vegetation-related roughness changes the cause of the recent decrease in dustemission from the Sahel?, Geophys. Res. Lett., 40, 1868–1872,doi:10.1002/grl.50273, 2013.
Dufresne, J., Gautier, C., Ricchiazzi, P., and Fouquart,Y.: Longwave scattering effects of mineral aerosols,J. Atmos. Sci., 59, 1959–1966, doi:10.1175/1520-0469(2002)059<1959:LSEOMA>2.0.CO;2, 2002.
Emmel, C., Knippertz, P., and Schulz, O.: Climatology ofconvective density currents in the southern foothills of theAtlas Mountains, J. Geophys. Res.-Atmos., 115, D11115,doi:10.1029/2009JD012863, 2010.
Engelstaedter, S. and Washington, R.: Atmospheric controls on theannual cycle of North African dust, J. Geophys. Res.-Atmos.,112, D03103, doi:10.1029/2006JD007195, 2007.
Evan, A. T., Heidinger, A. K., and Knippertz, P.: Analysis of win-ter dust activity off the coast of West Africa using a new 24-year over-water advanced very high resolution radiometer satel-lite dust climatology, J. Geophys. Res.-Atmos., 111, D12210,doi:10.1029/2005JD006336, 2006.
Fensholt, R., Langanke, T., Rasmussen, K., Reenberg, A., Prince,S. D., Tucker, C., Scholes, R. J., Le, Q. B., Bondeau, A., East-man, R., Epstein, H., Gaughan, A. E., Hellden, U., Mbow,C., Olsson, L., Paruelo, J., Schweitzer, C., Seaquist, J., andWessels, K.: Greenness in semi-arid areas across the globe1981-2007 - an Earth Observing Satellite based analysis oftrends and drivers, Remote Sens. Environ., 121, 144–158,doi:10.1016/j.rse.2012.01.017, 2012.
Fiedler, S., Schepanski, K., Heinold, B., Knippertz, P., and Tegen,I.: Climatology of nocturnal low-level jets over North Africa andimplications for modeling mineral dust emission, J. Geophys.Res.-Atmos., 118, 6100–6121, doi:10.1002/jgrd.50394, 2013a.
Fiedler, S., Schepanski, K., Knippertz, P., Heinold, B., and Tegen, I.:How important are cyclones for emitting mineral dust aerosol inNorth Africa?, Atmos. Chem. Phys. Discuss., 13, 32483–32528,doi:10.5194/acpd-13-32483-2013, 2013b.
Forster, P., Ramaswamy, V., Artaxo, P., Berntsen, T., Betts, R., Fa-hey, D. W., Haywood, J., Lean, J., Lowe, D. C., Myhre, G.,Nganga, J., Prinn, R., Raga, G., Schulz, M., and Van Dorland, R.:Changes in Atmospheric Constituents and in Radiative Forcing.In: Climate Change 2007: The Physical Science Basis. Contribu-tion of Working Group I to the Fourth Assessment Report of theIntergovernmental Panel on Climate Change, Tech. rep., 2007.
Gillette, D., Adams, J., Endo, A., Smith, P. H., D., and Kihl, R.:Threshold velocities for input of soil particles into the air by
S. M. Cowie et al.: Dust emission in northern Africa 8595
desert soils, J. Geophys. Res.-Ocean. Atmos., 85, 5621–5630,doi:10.1029/JC085iC10p05621, 1980.
Ginoux, P., Prospero, J. M., Gill, T. E., Hsu, N. C., andZhao, M.: Global scale attribution of anthropogenic and nat-ural dust sources and their emission rates based on MODISDeep Blue aerosol products, Rev. Geophys., 50, RG3005,doi:10.1029/2012RG000388, 2012.
Goudie, A. S. and Middleton, N. J.: Saharan dust storms: nature andconsequences, Earth-Science Reviews, 56, 179–204, 2001.
Hannachi, A., Awad, A., and Ammar, K.: Climatology and classifi-cation of Spring Saharan cyclone tracks, Climate Dynamics, 37,473–491, doi:10.1007/s00382-010-0941-9, 2011.
Heinold, B., Knippertz, P., Marsham, J. H., Fiedler, S., Dixon,N. S., Schepanski, K., Laurent, B., and Tegen, I.: The roleof deep convection and nocturnal low-level jets for dust emis-sion in summertime West Africa: Estimates from convection-permitting simulations, J. Geophys. Res.-Atmos., 118, 4385–4400, doi:10.1002/jgrd.50402, 2013.
Helgren, D. M. and Prospero, J. M.: Wind Velocities AssociatedWith Dust Deflation Events in the Western Sahara, J. Clim. Appl.Meteorol., 26, 1147–1151, 1987.
Huber, S. and Fensholt, R.: Analysis of teleconnections betweenAVHRR-based sea surface temperature and vegetation produc-tivity in the semi-arid Sahel, Remote Sens. Environ., 115, 3276–3285, doi:10.1016/j.rse.2011.07.011, 2011.
Huneeus, N., Schulz, M., Balkanski, Y., Griesfeller, J., Prospero,J., Kinne, S., Bauer, S., Boucher, O., Chin, M., Dentener, F.,Diehl, T., Easter, R., Fillmore, D., Ghan, S., Ginoux, P., Grini,A., Horowitz, L., Koch, D., Krol, M. C., Landing, W., Liu, X.,Mahowald, N., Miller, R., Morcrette, J. J., Myhre, G., Penner,J., Perlwitz, J., Stier, P., Takemura, T., and Zender, C. S.: Globaldust model intercomparison in AeroCom phase I, Atmos. Chem.Phys., 11, 7781–7816, doi:10.5194/acp-11-7781-2011, 2011.
Kaufman, Y., Tanre, D., Holben, B., Mattoo, S., Remer, L., Eck,T., Vaughan, J., and Chatenet, B.: Aerosol radiative impact onspectral solar flux at the surface, derived from principal-plane skymeasurements, J. Atmos. Sci., 59, 635–646, doi:10.1175/1520-0469(2002)059<0635:ARIOSS>2.0.CO;2, 2002.
Kim, D., Chin, M., Bian, H., Tan, Q., Brown, M. E., Zheng, T.,You, R., Diehl, T., Ginoux, P., and Kucsera, T.: The effect ofthe dynamic surface bareness on dust source function, emis-sion, and distribution, J. Geophys. Res.-Atmos., 118, 871–886,doi:10.1029/2012JD017907, 2013.
Klose, M., Shao, Y., Karremann, M. K., and Fink, A. H.: Sahel dustzone and synoptic background, Geophys. Res. Lett., 37, L09802,doi:10.1029/2010GL042816, 2010.
Knippertz, P.: Dust emissions in the West African heat trough – therole of the diurnal cycle and of extratropical disturbances, Mete-orol. Zeitschr., 17, 553–563, 2008.
Knippertz, P. and Todd, M. C.: The central west Saharan dusthot spot and its relation to African easterly waves and extra-tropical disturbances, J. Geophys. Res.-Atmos., 115, D12117,doi:10.1029/2009JD012819, 2010.
Knippertz, P. and Todd, M. C.: Mineral Dust Aerosols over theSahara: Meteorological controls on Emission and Transportand Implications for Modeling, Rev. Geophys., 50, RG1007,doi:10.1029/2011RG000362, 2012.
Knippertz, P., Deutscher, C., Kandler, K., Müller, T., Schulz,O., and Schütz, L.: Dust mobilization due to density currents
in the Atlas region: Observations from the Saharan MineralDust Experiment 2006 field campaign, J. Geophys. Res., 112,doi:10.1029/2007JD008774, 2007.
Kocha, C., Tulet, P., Lafore, J. P., and Flamant, C.: The importanceof the diurnal cycle of Aerosol Optical Depth in West Africa,Geophys. Res. Lett., 40, 785–790, doi:10.1002/grl.50143, 2013.
Koch, J. and Renno, N. O.: The role of convective plumes andvortices on the global aerosol budget, Geophys. Res. Lett., 32,L18806, doi:10.1029/2005GL023420, 2005.
Kurosaki, Y. and Mikami, M.: Regional difference in the charac-teristic of dust event in East Asia: Relationship among dust out-break, surface wind, and land surface condition, J. Meteorol. Soc.Jpn., 83A, 1–18, doi:10.1029/2003JD003913, 2005.
Kurosaki, Y. and Mikami, M.: Threshold wind speed for dust emis-sion in east Asia and its seasonal variations, J. Geophys. Res.-Atmos., 112, D17202, doi:10.1029/2006JD007988, 2007.
Mahowald, N., Zender, C., Luo, C., Savoie, D., Torres, O.,and del Corral, J.: Understanding the 30-year Barbadosdesert dust record, J. Geophys. Res.-Atmos., 107, 1074,doi:10.1029/2002JD002097, 2002.
Mahowald, N., Bryant, R., del Corral, J., and Steinberger, L.:Ephemeral lakes and desert dust sources, Geophys. Res. Lett.,30, GB4025, doi:10.1029/2002GL016041, 2003.
Mahowald, N., Baker, A., Bergametti, G., Brooks, N., Duce, R.,Jickells, T., Kubilay, N., Prospero, J., and Tegen, I.: Atmosphericglobal dust cycle and iron inputs to the ocean, Global Bio-geochem. Cy., 19, GB4025, doi:10.1029/2004GB002402, 2005.
Mahowald, N. M., Ballantine, J. A., Feddema, J., and Ramankutty,N.: Global trends in visibility: implications for dust sources, At-mos. Chem. Phys., 7, 3309–3339, doi:10.5194/acp-7-3309-2007,2007.
Marsham, J. H., Parker, D. J., Grams, C. M., Taylor, C. M.,and Haywood, J. M.: Uplift of Saharan dust south of theintertropical discontinuity, J. Geophys. Res., 113, D21102,doi:10.1029/2008JD009844, 2008.
Marsham, J. H., Knippertz, P., Dixon, N. S., Parker, D. J.,and Lister, G. M. S.: The importance of the representationof deep convection for modeled dust-generating winds overWest Africa during summer, Geophys. Res. Lett., 38, L16803,doi:10.1029/2011GL048368, 2011.
Marsham, J. H., Hobby, M., Allen, C. J. T., Banks, J. R., Bart,M., Brooks, B. J., Cavazos-Guerra, C., Engelstaedter, S., Gas-coyne, M., Lima, A. R., Martins, J. V., McQuaid, J. B., O’Leary,A., Ouchene, B., Ouladichir, A., Parker, D. J., Saci, A., Salah-Ferroudj, M., Todd, M. C., and Washington, R.: Meteorology anddust in the central Sahara: Observations from Fennec supersite-1during the June 2011 Intensive Observation Period, J. Geophys.Res.-Atmos., 118, 4069–4089, doi:10.1002/jgrd.50211, 2013.
Marticorena, B. and Bergametti, G.: Modeling the Atmosphere DustCycle. 1. Design of a Soil-Derived Dust Emission Scheme, J.Geophys. Res.-Atmos., 100, 16415–16430, 1995.
Marticorena, B., Chatenet, B., Rajot, J. L., Traore, S., Coulibaly, M.,Diallo, A., Kone, I., Maman, A., Diaye, T. N., and Zakou, A.:Temporal variability of mineral dust concentrations over WestAfrica: analyses of a pluriannual monitoring from the AMMASahelian Dust Transect, Atmos. Chem. Phys., 10, 8899–8915,doi:10.5194/acp-10-8899-2010, 2010.
8596 S. M. Cowie et al.: Dust emission in northern Africa
Mbourou, G., Bertrand, J., and Nicholson, S.: The diurnal and sea-sonal cycles of wind-borne dust over Africa north of the equator,J. Appl. Meteorol., 36, 868–882, 1997.
McTainsh, G. and Pitblado, J.: Dust Storms and Related PhenomenaMeasured from Meteorological Records in Australia, Earth Surf.Proc. Landf., 12, 415–424, doi:10.1002/esp.3290120407, 1987.
Middleton, N. J.: A Geography of Dust Storms in Southwest Asia,J. Climatol., 6, 183–196, 1986.
Morales, C.: Saharan Dust, chap. The Use of Meteorological Ob-servations for Studies of the Mobilization, Transport, and De-position of Saharan Soil Dust, 119–131, John Wiley and Sons,Salisbury, Wiltshire, 1979.
Nicholson, S., Davenport, M., and Malo, A.: A Compari-son of the Vegetation response to rainfall in the Saheland East-Africa, using normalized difference vegetation in-dex from NOAA AVHRR., Clim. Change, 17, 209–241,doi:10.1007/BF00138369, 1990.
Olsson, L., Eklundh, L., and Ardo, J.: A recent greening of the Sahel- Trends, patterns and potential causes, Journal of Arid Environ-ments, 63, 556–566, doi:10.1016/j.jaridenv.2005.03.008, work-shop on Changes in the Sahel, Nairobi, Kenya, 14–16 October2003, 2005.
Ozer, P.: Les lithometeores en region sahelienne, Int. J. Trop. Ecol.Geogr., 24, 9–42, 59–207, 2001.
Parker, D. J., Burton, R. R., Diongue-Niang, A., Ellis, R. J., Fel-ton, M., Taylor, C. M., Thorncroft, C. D., Bessemoulin, P., andTompkins, A. M.: The diurnal cycle of the West African mon-soon circulation, Q. J. Roy. Meteor. Soc., 131, 2839–2860, 2005.
Prospero, J. M.: Environmental characterization of global sources ofatmospheric soil dust identified with the NIMBUS 7 Total OzoneMapping Spectrometer (TOMS) absorbing aerosol product, Rev.Geophys., 40, doi:10.1029/2000RG000095, 2002.
Roderick, M. L., Rotstayn, L. D., Farquhar, G. D., and Hobbins,M. T.: On the attribution of changing pan evaporation, Geophys.Res. Lett., 34, L17403, doi:10.1029/2007GL031166, 2007.
Schepanski, K.: Characterising Saharan Dust Sources and Exportusing Remote Sensing and Regional Modelling, Ph.D. thesis,2009.
Schepanski, K., Tegen, I., Todd, M. C., Heinold, B., Bonisch, G.,Laurent, B., and Macke, A.: Meteorological processes forcingSaharan dust emission inferred from MSG-SEVIRI observationsof subdaily dust source activation and numerical models, J. Geo-phys. Res.-Atmos., 114, D10201, doi:10.1029/2008JD010325,2009.
Schepanski, K., Tegen, I., and Macke, A.: Comparison of satellitebased observations of Saharan dust source areas, Remote Sens.Environ., 123, 90–97, doi:10.1016/j.rse.2012.03.019, 2012.
Sokolik, I., Winker, D., Bergametti, G., Gillette, D., Carmichael, G.,Kaufman, Y., Gomes, L., Schuetz, L., and Penner, J.: Introduc-tion to special section: Outstanding problems in quantifying theradiative impacts of mineral dust, J. Geophys. Res.-Atmos., 106,18015–18027, doi:10.1029/2000JD900498, 2001.
Spyrou, C., Kallos, G., Mitsakou, C., Athanasiadis, P., Kalogeri, C.,and Iacono, M. J.: Modeling the radiative effects of desert duston weather and regional climate, Atmos. Chem. Phys., 13, 5489–5504, doi:10.5194/acp-13-5489-2013, 2013.
Stocker, T., Qin, D., Plattner, G., Tignor, M., Allen, S., Boschung,J., Nauels, A., Xia, Y., Bex, V., and Midgley, P.: Summary forPolicymakers. In: Climate Change 2013: The Physical Science
Basis. Contribution of Working Group I to the Fifth AssessmentReport of the Intergovernmental Panel on Climate Change, Tech.rep., 2013.
Stensrud, D.: Importance of low-level jets to climate: A review, J.Climate, 9, 1698–1711, 1996.
Sutton, L.: Haboobs, Q. J. Roy. Meteor. Soc., 51, 25–30, 1925.Tegen, I. and Schepanski, K.: The Global Distribution of Mineral
Dust, in: Wmo/Geo Expert Meeting on an International Sandand Dust Storm Warning System, edited by Perez, J. C. and Bal-dasano, J. M., vol. 7 of IOP Conference Series Earth and Envi-ronmental Science, tegen, I. Schepanski, K. WMO/GEO ExpertMeeting on an International Sand amd Dust Storm Warning Sys-tem NOV 07-09, 2007 Barcelona, Spain, 2009.
Todd, M. C., Allen, C. J. T., Bart, M., Bechir, M., Bentefouet, J.,Brooks, B. J., Cavazos-Guerra, C., Clovis, T., Deyane, S., Dieh,M., Engelstaedter, S., Flamant, C., Garcia-Carreras, L., Gan-dega, A., Gascoyne, M., Hobby, M., Kocha, C., Lavaysse, C.,Marsham, J. H., Martins, J. V., McQuaid, J. B., Ngamini, J. B.,Parker, D. J., Podvin, T., Rocha-Lima, A., Traore, S., Wang, Y.,and Washington, R.: Meteorological and dust aerosol conditionsover the western Saharan region observed at Fennec Supersite-2during the intensive observation period in June 2011, J. Geophys.Res.-Atmos., 118, 8426–8447, doi:10.1002/jgrd.50470, 2013.
Tucker, C., Pinzon, J., Brown, M., Slayback, D., Pak, E., Ma-honey, R., Vermote, E., and El Saleous, N.: An extendedAVHRR 8-km NDVI dataset compatible with MODIS and SPOTvegetation NDVI data, Int. J. Remote Sens., 26, 4485–4498,doi:10.1080/01431160500168686, 2005.
Vautard, R., Cattiaux, J., Yiou, P., Thepaut, J.-N., and Ciais, P.:Northern Hemisphere atmospheric stilling partly attributed toan increase in surface roughness, Nature Geosci., 3, 756–761,doi:10.1038/NGEO979, 2010.
Warner, T. T.: Desert meteorology, Cambridge University Press, 83–91, 2004.
Washington, R. and Todd, M. C.: Atmospheric controls on min-eral dust emission from the Bodélé Depression, Chad: Therole of the low level jet, Geophys. Res. Lett., 32, L17701,doi:10.1029/2005GL023597, 2005.
Washington, R., Todd, M. C., Engelstaedter, S., Mbainayel, S., andMitchell, F.: Dust and the low-level circulation over the BodeleDepression, Chad: Observations from BoDEx 2005, J. Geophys.Res.-Atmos., 111, D03201, doi:10.1029/2005JD006502, 2006.
Washington, R., Bouet, C., Cautenet, G., Mackenzie, E., Ashpole,I., Engelstaedter, S., Lizcano, G., Henderson, G. M., Schepanski,K., and Tegen, I.: Dust as a tipping element: The Bodele De-pression, Chad, Proc. Natl. Acad. Sci. USA, 106, 20564–20571,2009.
Williams, E., Nathou, N., Hicks, E., Pontikis, C., Russell, B., Miller,M., and Bartholomew, M. J.: The electrification of dust-loftinggust fronts (“haboobs”) in the Sahel, Atmos. Res., 91, 292–298,2009.
WMO: International Codes-WMO No. 306, Geneva-Switzerland:World Meteorological, 1995.
Zender, C. and Kwon, E.: Regional contrasts in dust emissionresponses to climate, J. Geophys. Res.-Atmos., 110, D13201,doi:10.1029/2004JD005501, 2005.
Zhu, Z., Bi, J., Pan, Y., Ganguly, S., Anav, A., Xu, L., Samanta, A.,Piao, S., Nemani, R. R., and Myneni, R. B.: Global data sets ofvegetation leaf area index (LAI) 3g and Fraction of Photosyn-
S. M. Cowie et al.: Dust emission in northern Africa 8597
thetically Active Radiation (FPAR) 3g derived from Global In-ventory Modeling and Mapping Studies (GIMMS) NormalizedDifference Vegetation Index (NDVI3g) for the period 1981 to2011, Remote Sens., 5, 927–948, 2013.


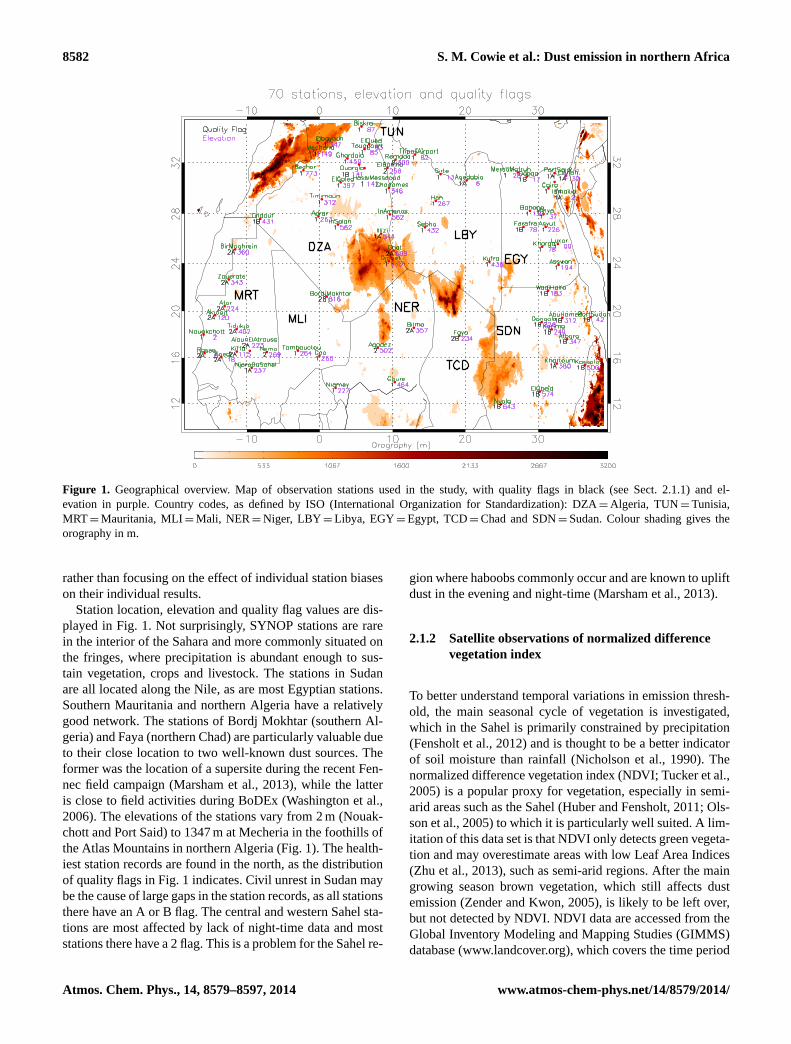


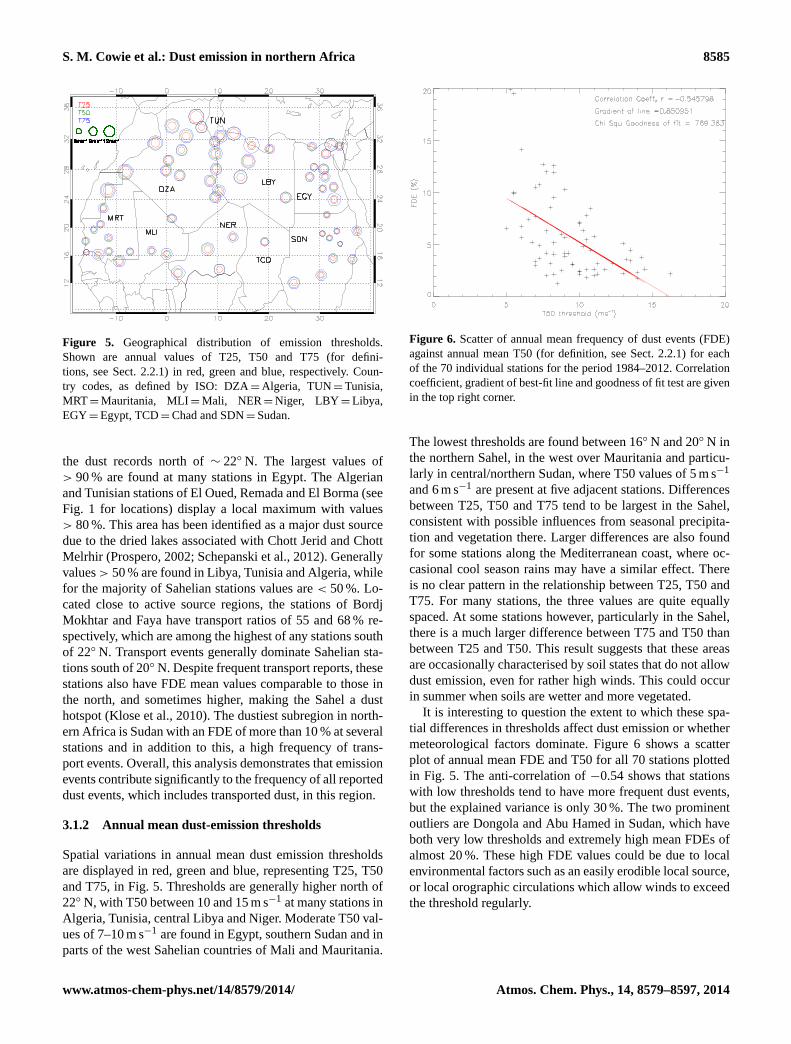


![Climatology [Autosaved]](https://static.documents.pub/doc/80x56/577cd2e91a28ab9e78964bc6/climatology-autosaved.jpg)


