1488 VOLUME 29 JOURNAL OF PHYSICAL OCEANOGRAPHY q 1999 American Meteorological Society A Climatology of the Circulation and Water Mass Distribution near the Philippine Coast* TANGDONG QU AND HUMIO MITSUDERA Japan Marine Science and Technology Center, Yokosuka, Japan, and International Pacific Research Center, SOEST, University of Hawaii, Honolulu TOSHIO YAMAGATA Department of Earth and Planetary Physics, University of Tokyo, Tokyo, Japan (Manuscript received 21 October 1997, in final form 27 July 1998) ABSTRACT This study provides a climatology of the circulation and water mass distribution by using historical data combined with observations from dozens of recent cruises near the Philippine coast. The most striking results are related to the poleward contraction of the subtropical gyre on denser surfaces, with the bifurcation of the North Equatorial Current moving from about 158N in the upper thermocline to about 208N at intermediate depths. Though time variability and the possible errors in the data are rather large, the Halmahera eddy (HE) is clearly seen in the climatic mean fields, lying at about 38N, 1308E near the surface and reaching the Mindanao coast on density surfaces around 27.2s u . It seems that the previously observed Mindanao Undercurrent is merely a component of the recirculation associated with the HE. North Pacific Tropical Water (NPTW) and Intermediate Water (NPIW) enter the western ocean with their extreme properties centered at 158 and 208N, respectively, and continue southward as far as the southern tip of Mindanao along the western boundary. The influence of South Pacific sources becomes increasingly important with depth. Antarctic Intermediate Water (AAIW) is traced to about 128N off Mindanao; but, there is little indication of a northward flow of AAIW farther north. Salinity extremes are also used as an indicator of NPTW and NPIW, and the primary result is that mixing of potential temperature and salinity are not jointly compensated, thus leading to an increase of density in NPTW and a decrease of density in NPIW in the flowpath from the North Pacific subtropical gyre to the Tropics along the Philippine coast. 1. Introduction Recent studies of decadal climate variability have fo- cused on the water mass exchange between the sub- tropical and equatorial oceans, particularly since the un- usual climate state after 1990. There is increasing evi- dence that much of the water mass exchange between the subtropical and equatorial oceans occurs at the west- ern boundary (Luyten et al. 1983; Lukas et al. 1991; Bingham and Lukas 1994; McCreary and Lu 1994; Lu and McCreary 1995). Here, a change in the properties of the subtropical surface waters will, in due course, first influence the equatorial thermocline and then the *School of Ocean and Earth Science and Technology Contribution Number 4769. Corresponding author address: Dr. Tangdong Qu, International Pacific Research Center, SOEST, University of Hawaii, 2525 Correa Rd., Honolulu, HI 96822. E-mail: [email protected]surface conditions in the Tropics that in turn affect the circulation in the global atmosphere. The rapid atmo- spheric links between the Tropics and subtropics, and the slow oceanic links in the reverse direction are hy- pothesized to be essential in determining the decadal climate variability (Gu and Philander 1997). To further identify the mechanisms of decadal variability in the Pacific climate system, a comprehensive study of the circulation and water mass distribution in the tropical western Pacific is of high scientific interest. Studies of the tropical western Pacific have been fairly diverse (cf. Fine et al. 1994); in general, they can be divided into two groups. One includes the early work of Reid (1965), Tsuchiya (1968), and many others, who investigated the large-scale aspects of water masses by using data collected from various cruises in different seasons. These studies were useful because they pro- vided the basis for understanding the water character- istics of the entire tropical Pacific Ocean. However, ow- ing to the sparse distribution of the data used, these studies failed to depict many detailed phenomena as- sociated with the narrow western boundary currents. A
Transcript
1488 VOLUME 29J O U R N A L O F P H Y S I C A L O C E A N O G R A P H Y
q 1999 American Meteorological Society
A Climatology of the Circulation and Water Mass Distribution near thePhilippine Coast*
TANGDONG QU AND HUMIO MITSUDERA
Japan Marine Science and Technology Center, Yokosuka, Japan, andInternational Pacific Research Center, SOEST, University of Hawaii, Honolulu
TOSHIO YAMAGATA
Department of Earth and Planetary Physics, University of Tokyo, Tokyo, Japan
(Manuscript received 21 October 1997, in final form 27 July 1998)
ABSTRACT
This study provides a climatology of the circulation and water mass distribution by using historical datacombined with observations from dozens of recent cruises near the Philippine coast. The most striking resultsare related to the poleward contraction of the subtropical gyre on denser surfaces, with the bifurcation of theNorth Equatorial Current moving from about 158N in the upper thermocline to about 208N at intermediate depths.Though time variability and the possible errors in the data are rather large, the Halmahera eddy (HE) is clearlyseen in the climatic mean fields, lying at about 38N, 1308E near the surface and reaching the Mindanao coaston density surfaces around 27.2su. It seems that the previously observed Mindanao Undercurrent is merely acomponent of the recirculation associated with the HE. North Pacific Tropical Water (NPTW) and IntermediateWater (NPIW) enter the western ocean with their extreme properties centered at 158 and 208N, respectively, andcontinue southward as far as the southern tip of Mindanao along the western boundary. The influence of SouthPacific sources becomes increasingly important with depth. Antarctic Intermediate Water (AAIW) is traced toabout 128N off Mindanao; but, there is little indication of a northward flow of AAIW farther north. Salinityextremes are also used as an indicator of NPTW and NPIW, and the primary result is that mixing of potentialtemperature and salinity are not jointly compensated, thus leading to an increase of density in NPTW and adecrease of density in NPIW in the flowpath from the North Pacific subtropical gyre to the Tropics along thePhilippine coast.
1. Introduction
Recent studies of decadal climate variability have fo-cused on the water mass exchange between the sub-tropical and equatorial oceans, particularly since the un-usual climate state after 1990. There is increasing evi-dence that much of the water mass exchange betweenthe subtropical and equatorial oceans occurs at the west-ern boundary (Luyten et al. 1983; Lukas et al. 1991;Bingham and Lukas 1994; McCreary and Lu 1994; Luand McCreary 1995). Here, a change in the propertiesof the subtropical surface waters will, in due course,first influence the equatorial thermocline and then the
*School of Ocean and Earth Science and Technology ContributionNumber 4769.
Corresponding author address: Dr. Tangdong Qu, InternationalPacific Research Center, SOEST, University of Hawaii, 2525 CorreaRd., Honolulu, HI 96822.E-mail: [email protected]
surface conditions in the Tropics that in turn affect thecirculation in the global atmosphere. The rapid atmo-spheric links between the Tropics and subtropics, andthe slow oceanic links in the reverse direction are hy-pothesized to be essential in determining the decadalclimate variability (Gu and Philander 1997). To furtheridentify the mechanisms of decadal variability in thePacific climate system, a comprehensive study of thecirculation and water mass distribution in the tropicalwestern Pacific is of high scientific interest.
Studies of the tropical western Pacific have been fairlydiverse (cf. Fine et al. 1994); in general, they can bedivided into two groups. One includes the early workof Reid (1965), Tsuchiya (1968), and many others, whoinvestigated the large-scale aspects of water masses byusing data collected from various cruises in differentseasons. These studies were useful because they pro-vided the basis for understanding the water character-istics of the entire tropical Pacific Ocean. However, ow-ing to the sparse distribution of the data used, thesestudies failed to depict many detailed phenomena as-sociated with the narrow western boundary currents. A
JULY 1999 1489Q U E T A L .
relatively good data coverage is available for the tropicalwestern Pacific since the 1970s, particularly after thesuccess of the Tropical Ocean Global Atmosphere(TOGA) and the World Ocean Circulation Experiment(WOCE) programs, and, consequently, many alternativestudies, that can be put under the second group, haveappeared. Among them, Toole et al. (1988), Wijffels etal. (1995), and Qu et al. (1997, 1998) focused on themean structure along repeated sections, whereas Tsu-chiya et al. (1989), Lukas et al. (1991), Fine et al.(1994), Bingham and Lukas (1994, 1995), and manyothers examined the synoptic distribution over a largepart of the tropical western Pacific. These studies havesubstantially advanced our knowledge of the westernboundary currents and their potentially important rolein the water mass exchange between the subtropical andequatorial oceans. However, the results may have somelimitations because measurements with extensive cov-erage both in space and time were not used. At thisstage, it seems desirable to prepare a climatology of thecirculation and water mass distribution over the entiretropical western Pacific with all available data.
Huge historical data were distributed recently byNOAA/NESDIS/NODC (called the NODC data below).The NODC data, augmented by observations from doz-ens of recent cruises, likely provide the best data cov-erage to date in the tropical western Pacific, thus allow-ing a more accurate and more general investigation ofthe region, in particular with regard to the intermediatewaters. The results of an analysis of these data are pre-sented in the following sections. After a brief descriptionof the data in section 2, general characteristics of watermasses are presented in section 3. Sections 4 and 5 aredevoted to detailed descriptions of water properties onisopycnal surfaces and on vertical sections, respectively.Error analysis is made in section 6. An attempt is alsomade in section 7 to trace the North Pacific waters byproperty extremes. Results are summarized in section 8.
2. Description of data
For this study CTD and bottle profiles at observedlevels recorded on the CD-ROMs of World Ocean Atlas1994 of NOAA/NESDIS/NODC from the region 28S–278N, 1188–1428E were used. The observed level pro-files were used instead of the mean atlases at standarddepths for a couple of reasons. First, the objective anal-ysis employed in preparing the mean atlases involveshorizontal smoothing over approximately 1000 km, andthus the smoothed fields may not be appropriate forshowing some of the detailed phenomena at the westernboundary. Second, averaging at standard pressure sur-faces may produce drastic artificial smoothing of waterproperties due to the huge vertical gradient around thepycnocline.
Also included in this study were data from 23 recenthydrographic cruises under the auspices of TOGA andWOCE, including five by the Chinese Academy of Sci-
ences (CAS; Qu et al. 1998), eight by a joint programbetween the People’s Republic of China and the UnitedStates (PRC-US; Toole et al. 1990), one by the WesternEquatorial Pacific Ocean Circulation Study program(WEPOCS III; Lukas et al. 1991), two by a joint pro-gram between Japan Marine Science and TechnologyCenter and Badan Pengkajian Dan Penerapan Technol-ogy of Indonesia (JAMSTEC-BPPT; Kashino et al.1996), and six obtained from the WOCE HydrographicProgram Special Analysis Center. It is worthwhile not-ing that the CTD profiles from the first eight PRC–UScruises and the WEPOCS III have already been includedin the NODC archives. However, for unclear reasons,the record was made only for approximately the upper400 m. For this study these shallower profiles were re-placed by the high-resolution data cited above.
Even after extensive editing (Levitus and Boyer1994a–c), some NODC profiles still contained errone-ous records both in coordinates and measured values.The primary procedure for quality control of the datafor this study included removal of profiles with obvi-ously erroneous records (e.g., temperature higher than88C below 1000 m or salinity lower than 30 psu below100 m) and profiles with only a few measurements inthe shallow (,100 m) waters and at deep (.700 m)levels as well, without any in between. The most dif-ficult quality control process involved the oxygen pro-files since different units were used, with some in mll21 and some in mmol kg21. These were detected by eye.After all these procedures, the historical and recent dataconsisted of 14 540 temperature/salinity and 6193 ox-ygen profiles for the region studied (Figs. 1a and 1b).The observations of temperature/salinity spanned theperiod from the 1920s to the beginning of the 1990s,with two periods of dense sampling during 1935–45and 1965–90, respectively (Fig. 2). Oxygen measure-ments were not wide spread until the 1960s. No obviousbias in the density of sampling was apparent toward anyseason of the year.
3. General characteristics
The relations of potential temperature versus salinityand dissolved oxygen concentration versus salinity areshown on a 58 3 58 grid for all observed level readings(Figs. 3a,b). At least five water masses are indicated inthese relations. One is in the surface layer, two are inthe upper thermocline, and two are in the intermediatelayers. The tropical surface water (TSW), with a ho-mogeneous layer of oxygen concentration (4.5 ml l21)at 258 , u , 308C and 33.5 , S , 34.5 psu, is formedlocally in the vicinity of the intertropical convergencezone (ITCZ). It is confined primarily south of 158N inthe ocean interior, but may be traced farther north at thewestern boundary.
North Pacific Tropical Water (NPTW) is characterizedby high salinity (34.75 , S , 35.25) and high oxygenconcentration (.4.0 ml l21) on density surfaces around
1490 VOLUME 29J O U R N A L O F P H Y S I C A L O C E A N O G R A P H Y
FIG. 1. Spatial distribution of stations (asterisk) of (a) temperature/salinity and (b) oxygen for this study. The light line shows the 500-misobath. Abbreviations are CS: Celebes Sea, H: Halmahera, L: Luzon, M: Mindanao, NG: New Guinea, and T: Taiwan.
FIG. 2. Temporal distribution of stations for this study.
JULY 1999 1491Q U E T A L .
FIG. 3. Relations of (a) potential temperature vs salinity and (b) salinity vs oxygen on a 58 3 58 grid. The thin lines in (a) denotepotential densities of 24.5, 26.6, and 27.2su.
24.0su (Figs. 3a,b). The formation of NPTW is thoughtto be at about 208N, 1408E–1608W, as a result of ex-cessive evaporation (Tsuchiya 1968; Fine et al. 1994).It extends westward from its formation area in the NorthEquatorial Current (NEC) between 108 and 258N. At thewestern boundary, part of the NPTW appears to con-tinue southward, coinciding with the Mindanao Current(MC; Lukas et al. 1991; Qu et al. 1998). South PacificTropical Water (SPTW), identified as a salinity (.35.25psu) maximum with homogeneous oxygen concentra-
tion (about 3.3 ml l21) around 25.0su, is seen in theequatorial region (south of 58N). There is little indi-cation that this water extends into the Celebes Sea.
North Pacific Intermediate Water (NPIW) is presentmainly in the northern Philippine Sea, with S , 34.4psu and 2.5 , O2 , 3 ml l21 on density surfaces of26.5–26.8su (discussed in section 7). According to Tal-ley (1993), NPIW is generated through the overrun ofsubpolar water by the saltier surface water of the mixedwater region between the Kuroshio and the Oyashio.
1492 VOLUME 29J O U R N A L O F P H Y S I C A L O C E A N O G R A P H Y
FIG. 3. (Continued.)
This water appears to cross much of the interior oceanwithin the subtropical gyre, with only a small part es-caping to the Tropics at the Philippine coast. Below theNPIW salinity minimum, oxygen concentrations tend todecrease with depth, reaching the broad minimum (,2.0ml l21) of the North Pacific subpolar water (Reid 1965;Wijffels et al. 1998). The difference in depth betweenthe salinity and oxygen minima induces circle-shapedS–O2 relations (Fig. 3b) in the north. These relationsare not seen south of 108N, presumably because of theintrusion of South Pacific waters with relatively high
oxygen levels. A secondary salinity minimum (about34.55 psu) characteristic of Antarctic Intermediate Wa-ter (AAIW; Wyrtki 1961) is present near the equatoraround the 27.2su surface (Fig. 3a).
4. Mean distributions on isopycnal surfaces
Maps are presented to show the distributions of ac-celeration potential, depth, salinity, and oxygen con-centration on three isopycnal surfaces. The geostrophicflow along isopycnal surfaces can be deduced from the
JULY 1999 1493Q U E T A L .
gradient of the acceleration potential (Tsuchiya 1968).Water properties are conserved following isopycnalflow, assuming the flow is inviscid and nondiffusive. Inthe presence of viscosity and diffusivity, as is the casein the true ocean (sections 4a–c), the flow does not haveto be exactly along constant property lines. Neverthe-less, water properties (temperature, salinity, oxygenconcentration, etc.) can be used as passive tracers toprovide direct pathways of water masses. Because tem-perature on isopycnal surfaces is uniquely defined bysalinity, maps of temperature resemble those of salinityin all the details, and are excluded from this study.
The three isopycnal surfaces chosen are su 5 24.5,26.6, and 27.2 (Fig. 3a). They have the following char-acteristics. The 24.5su surface passes through the upperthermocline at depths of 100–200 m, lying roughly be-tween NPTW and SPTW. The choice of the 26.6su sur-face is based on the fact that NPIW is of lower (about26.55su) density at the Mindanao coast (Lukas et al.1991) than in the main part of the subtropical gyre(26.8su, Talley 1993). Thus, this surface is expected tohave a more reasonable representation of NPIW thanthe 26.8su surface for much of the region studied. The27.2su surface coincides basically with the secondaryvertical salinity minimum (AAIW) that spreads over thesouthern part of the Philippine Sea.
While deeper observations are available at some lo-cations and times, the number of observations decreasesrather rapidly with depth below 1200 db. To optimizeuniformity of the database, the reference level for es-timating acceleration potential is chosen to be 1200 db.Because of the shallowness of the three isopycnal sur-faces chosen, whose depths do not exceed 900 db overthe whole region studied, this reference is thought to bedeep enough to show most major features of the geo-strophic flow in the upper layers.
Water properties at observed levels are first inter-polated onto the selected isopycnal surfaces by cubicspline, and then averaged on a 0.58 3 0.58 grid, re-gardless of their date and time of measurement. Con-sidering that there are few stations in some grid bins,we smooth the property fields by choosing a horizontalradius big enough to include at least 20 observations ineach grid bin from which means and standard deviationswere calculated. The primary criterion for averaging isthat two widely spaced data points have more influenceon the mean than two close together. Estimates of stan-dard deviations are used to edit the mean: if an inter-polated property deviates from the mean by a value threetimes larger than the standard deviation, it is excluded,and the mean and standard deviation are recalculated.The estimated mean fields are finally smoothed with aGaussian filter of about 150-km half-width or e-foldingscale (Bretherton et al. 1976).
a. su 5 24.5
The geostrophic flow on the 24.5su surface showsmany similar features to those derived from synoptic
observations (e.g., Nitani 1972; Lukas et al. 1991). Thewestward-directed NEC is seen over a broad latituderange between 88 and 258N. It splits near 158N at thewestern boundary into the northward-flowing Kuroshioand southward-flowing MC (Fig. 4a). The boundary be-tween the NEC and the North Equatorial Countercurrent(NECC) is clearly indicated by a minimum (,15.5 m2
s22) of acceleration potential at about 78N. Part of theMC appears to turn cyclonically in the Celebes Sea tofeed the NECC, adding to waters that flow directly fromthe MC to the NECC. The retroflection of the MC inthe Celebes Sea and its subsequent flow to the eastgenerates a trough (,130 m) in the isopycnal surfacecentered at 78N, 1298E (Fig. 4b), consonant with thepreviously observed Mindanao eddy (Wyrtki 1961; Lu-kas et al. 1991). A small anticyclonic eddy (accelerationpotential .16.5 m2 s22) near 38N, 1308E may representthe Halmahera eddy, through which the South Equa-torial Current tends to recurve into the NECC.
The deepest (.180 m) isopycnal depth lies farthersouth (158N) than the northern boundary of the NEC,consonant with the poleward contraction of the sub-tropical gyre with depth (Reid and Arthur 1975). As thenorthward downslope of isopycnal surfaces correspond-ing to the westward NEC extends farther north in thedeeper layers, there should be a northward displacementof the maximum of acceleration potential from that ofdepth (ridge) on the shallower surfaces. From this ridgeisopycnal depth decreases northward to about 110 mnear 258N, reflecting the dominant influence of latitude-dependent surface heat flux on the upper thermoclinewater.
High salinity water originating in the tropical surfacesalinity maximum of the North Pacific (NPTW) is seenas a tongue with salinity exceeding 34.95 psu (Fig. 4c).The axis of the tongue appears to coincide with the ridgeof the isopycnal surface and with the bifurcation of theNEC as well. It is likely that this high salinity waterflows westward in the NEC and reaches the PhilippineIslands in a latitude band centered near 158N, wherepart of it returns northward in the Kuroshio and the restcontinues southward in the MC.
High oxygen levels extending from the NEC south-ward along the Philippines and toward the MakassarStrait reflect the strong influence of North Pacific sourc-es on the water masses in the Celebes Sea (Fig. 4d).High oxygen levels also extend southeastward off Min-danao, indicative of a direct advection of NPTW to theNECC. The alternating tongues of high and low oxygenlevel between 58 and 78N farther to the east might berelated to the meandering of the NECC. A strong me-ridional temperature and salinity gradient, allied withhomogeneous oxygen concentration, is seen east of Hal-mahera, which has been interpreted as evidence thatSouth Pacific waters do not directly cross the equatorin the interior ocean but retroflect into the equatorialcurrents as they arrive at the equatorial western Pacific(Fig. 4a; Tsuchiya et al. 1989; Fine et al. 1994).
1494 VOLUME 29J O U R N A L O F P H Y S I C A L O C E A N O G R A P H Y
FIG. 4. Distributions of (a) acceleration potential (in m2 s22) relative to 1200 db, (b) isopycnal depth in meter, (c)salinity (in psu), and (d) dissolved oxygen concentration (in ml L21) on 24.5su surface.
b. su 5 26.6
The NEC on the 26.6su surface (Fig. 5a) shows es-sentially the same pattern as that in the upper thermo-cline except for a slight northward shift (to about 178N)of the bifurcation latitude. A striking feature of the iso-pycnal topography is that the ridge measured at about158N in the shallower water (Fig. 4b) does not exist onthe 26.6su surface; instead, the isopycnal depth appears
to increase northward from about 275 m near 78N toabout 600 m near 258N. This result implies that thelatitude-dependent surface heat flux has little impact onthe waters of the salinity minimum. Eastward-directedsubsurface flow is seen from about 58N to near the equa-tor; its southern boundary is not particularly well de-fined, presumably due to the emergence of the Equa-torial Undercurrent. Another important feature of geo-
JULY 1999 1495Q U E T A L .
FIG. 5. Same as Fig. 4 except on the 26.6su surface.
strophic flow is that the Halmahera eddy, indicated asa maximum (.12.4 m2 s22) of acceleration potential,appears to move somewhat farther northwest than onthe shallower surface (Fig. 4a).
Low salinity water characteristic of NPIW is seen asa tongue extending southwestward in the NEC andsouthward in the Luzon Undercurrent (LUC; Qu et al.1997) and the MC along the Philippine coast (Fig. 5c).The salinity in the tongue is lowest (about 34.0 psu) inthe northeast, and increases to about 34.4 psu around
the southern tip of Mindanao by lateral mixing withmore saline waters of its surroundings. Associated withthis low salinity tongue is an elevated oxygen level thatdecreases southward from the NEC and eastward fromthe LUC/MC (Fig. 5d). A boundary between watermasses is found east of Mindanao. Bingham and Lukas(1994) describe this boundary as a water mass discon-tinuity between the equatorial and subtropical waters.The equatorial water is seen extending westward as atongue of low (,2.0 ml l21) oxygen concentration cen-
1496 VOLUME 29J O U R N A L O F P H Y S I C A L O C E A N O G R A P H Y
tered at about 88N. On the inshore side, water of NorthPacific origin (NPIW) escapes to the equatorial regionvia the MC. Compared to the shallower surface, wateroriginating from the Southern Hemisphere with highsalinity and high oxygen concentration intrudes farthernorthwest, consonant with the northwestward shift ofthe Halmahera eddy on this surface (Fig. 5a).
c. su 5 27.2
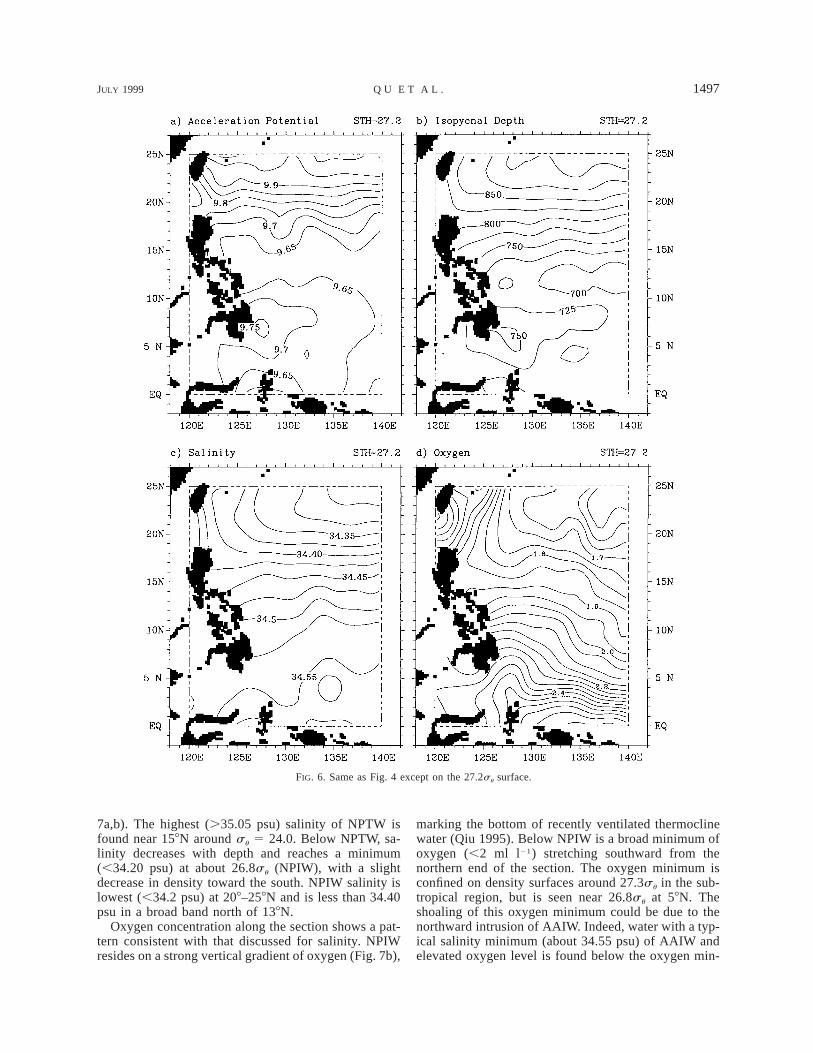
The NEC on the 27.2su surface shrinks northwardnorth of 158N, with its bifurcation occurring near 208N.This implies that the LUC, though significantly reducedin magnitude from the surfaces above, originates as farnorth as 208N on this surface. The LUC at this densitydoes not appear to go directly southward along the west-ern boundary but separates from the coast around 108N.Probably, this flow turns to the right continuously andfinally reaches the equatorial region through a clockwiserecirculation east of Mindanao.
The distribution of isopycnal depth (Fig. 6b) basicallyfits the geostrophic flow. A minimum (,700 m) of iso-pycnal depth is located near 128N, somewhat farthersouth than the minimum (,9.65 m2 s22) of accelerationpotential due to the same reason as was stated in section4a. A maximum of isopycnal depth (.750 m) is foundeast of Mindanao, coinciding roughly with the maxi-mum (.9.75 m2 s22) of acceleration potential.
The recirculation regime east of Mindanao was notpreviously reported, though it could be sometimes iden-tified from one- or two-shot hydrographic observations(e.g., Kashino et al. 1996, their Fig. 10c). To detect it,several density surfaces between 26.7 and 27.4su wereexamined. In all of these maps (not shown) a core ofhigh acceleration potential with deep isopycnal depth ispresent. The location varies with density from about 48Non su 5 26.6 to about 78N on su 5 27.0. This pattern(Figs. 6a,b) appears to remain in denser waters (27.0 #su # 27.4), despite some quantitative modifications.Furthermore, Figs. 6a,b are insensitive to vertical dis-placements of the reference level within the depth rangeof 1000–1500 db. All these results suggest that the re-circulation regime east of Mindanao is a robust feature.
Water of subpolar origin (Reid 1965; Wijffels et al.1998) with S , 34.4 psu is seen extending westwardin the NEC and southward in the LUC (Fig. 6c). Waterwith relatively homogeneous salinity (about 34.55 psu)and high (.2.0 ml l21) oxygen concentration identicalwith the properties of AAIW meets North Pacific waterin a broad region between Halmahera and Mindanao.Much of the AAIW appears to be advected eastwardinto the equatorial circulation, with a part escaping tothe Celebes Sea. The northward intrusion of AAIW istraced to about 128N at the Mindanao coast, in reason-able agreement with the early work of Masuzawa(1972).
The previously observed Mindanao Undercurrent(MUC; Hu et al. 1991; Lukas et al. 1991) appears to
be merely a component of recirculation associated withthe Halmahera eddy. Using 10 repeated hydrographicsections along 88N east of Mindanao, Qu et al. (1998)noted that the MUC, referred to as subsurface northwardvelocity cores centered at 800–900 db, was evident dur-ing all the periods of observation, having mean speedexceeding 0.08 m s21. The geostrophic flow shown inFig. 6a appears to match their results very well, sup-porting the speculation that the MUC is a permanentfeature. Water joining the Halmahera eddy from thesouth may be advected northward via the MUC alongthe coast of Mindanao and carried offshore on the northside of the gyre, where it either continues as a jet intothe equatorial currents or turns southward to completethe circuit. Recirculation east of Mindanao allows waterparticles to gradually share properties with their sur-roundings and finally approach a common and homog-enized state. This probably explains why mean propertydistribution does not show any significant cores in thenarrow MUC except for a broad region of elevated ox-ygen level east of Mindanao (Fig. 6d; Wijffels et al.1995; Qu et al. 1998).
Here, we emphasize the potentially important influ-ence of eddies through integration over short timescaleson the distribution of properties, for example, the con-centration of dissolved oxygen (Fig. 6d). According toseveral earlier studies (e.g., Masumoto and Yamagata1991; Qiu and Lukas 1996), the tropical western Pacificis an eddy-dominated region. With the growth and decayof the Halmahera eddy, water that flows to the north isusually of higher oxygen level than that to the south inthe front area between the North and South Pacific wa-ters (Fig. 6d). The overall action of eddies would be toproduce a net (northwestward) transport of oxygen inthe downstream direction of the MUC, but its relativeimportance to the mean advection is not clear.
5. Mean distributions along vertical sections
Maps of salinity and oxygen concentration are shownagainst density along two meridional and eight zonalsections. The meridional sections are chosen to be tworegularly repeated hydrographic sections at 1308 and1378E with usually 30–60 samples in each 18 lat bin.The selection of zonal sections is made at every 28 latfrom 68 to 208N at the western boundary (west of1308E). Sampling along the zonal sections is generallygood on a 18 lat 3 0.58 long grid, except at 148 and168N where broader (1.58 instead of 18) latitude bandsare chosen so as to include at least five samples withineach 0.58 long bin. Mean sections are constructed byensemble averaging.
a. Meridional
Along 1378E, NPTW is indicated by a high salinity(.34.90 psu) core stretching from about 108 to 248Non density surfaces between 23.0 and 25.0su (Figs.
JULY 1999 1497Q U E T A L .
FIG. 6. Same as Fig. 4 except on the 27.2su surface.
7a,b). The highest (.35.05 psu) salinity of NPTW isfound near 158N around su 5 24.0. Below NPTW, sa-linity decreases with depth and reaches a minimum(,34.20 psu) at about 26.8su (NPIW), with a slightdecrease in density toward the south. NPIW salinity islowest (,34.2 psu) at 208–258N and is less than 34.40psu in a broad band north of 138N.
Oxygen concentration along the section shows a pat-tern consistent with that discussed for salinity. NPIWresides on a strong vertical gradient of oxygen (Fig. 7b),
marking the bottom of recently ventilated thermoclinewater (Qiu 1995). Below NPIW is a broad minimum ofoxygen (,2 ml l21) stretching southward from thenorthern end of the section. The oxygen minimum isconfined on density surfaces around 27.3su in the sub-tropical region, but is seen near 26.8su at 58N. Theshoaling of this oxygen minimum could be due to thenorthward intrusion of AAIW. Indeed, water with a typ-ical salinity minimum (about 34.55 psu) of AAIW andelevated oxygen level is found below the oxygen min-
1498 VOLUME 29J O U R N A L O F P H Y S I C A L O C E A N O G R A P H Y
FIG. 7. Vertical sections of (a) salinity (in psu) and (b) dissolvedoxygen concentration (in ml L21) against su along 1378E. The areaswith S . 34.9 psu or S , 34.4 psu are shaded.
imum in the Tropics. SPTW, corresponding to high sa-linity (.34.9 psu) and homogeneous oxygen concen-tration (about 3.5 ml l21), forms a very thick layer be-tween 23.0 and 26.5su surfaces, with extreme propertiesat about 25.0su.
The extreme properties of NPTW and NPIW becomeweaker toward the west due to the mixing in the ocean.Along 1308E, the spreading of NPTW is between 108and 208N, with its highest salinity (.35.0 psu) at about158N. NPIW salinity is lowest (,34.20 psu) near 208Nand is less than 34.40 psu along the northern part ofthe section (Fig. 8a). The southern boundary of the ox-ygen minimum (,2.0 ml l21) is seen at about 78N, some-what farther north than that along 1378E, reflecting thestrong influence of South Pacific sources on the watermasses near the western boundary.
b. Zonal
NPIW enters the western ocean as part of the NECcentered near 208N (Fig. 9a), and extends southwardalong the Philippine coast (Figs. 9b–h). At 168N, it con-tains two cores of low salinity (,34.30 psu). One hugsthe coast and can be traced continuously to as far as thesouthern tip of Mindanao; while the other, emanating
from the east, is not present south of 148N, reflectingthe limited extension of NPIW in the ocean interior (Fig.8a). The low salinity cores along the coast have rela-tively high oxygen levels, consonant with its supplyfrom the subtropical gyre. This is clearly indicated bythe shoreward downslope of oxygen concentration con-tours south of 168N.
NPTW reaches the Philippine coast with its extremeproperties (S . 35.0 psu) at 148–168N (Figs. 9c–d)where it separates into two parts. One turns northwardinto the East China Sea via the Kuroshio (Figs. 9a–b),and the other moves southward in the MC (Figs. 9e–h).As NPTW approaches the Mindanao coast, its salinitymaximum hugs the continental slope with a value about0.10 psu lower than at the bifurcation latitude of theNEC because of mixing. In the ocean interior, thespreading of NPTW is seen as a high salinity corestretching from the east near the bifurcation latitude ofthe NEC (Figs. 9b–e), but this structure is absent farthernorth and south. Because of its subtropical origin,NPTW supplied by the MC is of elevated oxygen levelsouth of 148N (Figs. 9e–h). This condition is reversednorth of 168N, with relatively low oxygen concentrationin the Kuroshio (Figs. 9a and 9b).
6. Error analysis
As stated in section 2, the observations used in thisstudy were made in various seasons of different years.Since the tropical western Pacific is a region of strongeddies, in particular those associated with transeasonaland/or interseasonal fluctuations, time variations in theregion are expected to be fairly large (e.g., Lukas et al.1991; Masumoto and Yamagata 1991; Qiu and Lukas1996). Indeed, this is confirmed by large standard de-viations of properties obtained during the averaging andsmoothing processes.
The spatial distribution of standard deviations, thoughnot presented here, is rather uniform on the three iso-pycnal surfaces, except with slightly higher values inthe front area between the North and South Pacific wa-ters east of Halmahera. Typical temperature and salinitystandard deviations, defined as the averages over thedomain, are 0.328C and 0.10 psu on su 5 24.5, 0.358Cand 0.07 psu on su 5 26.6, and 0.248C and 0.04 psuon su 5 27.2, based on ensembles of more than 20stations in each 0.58 3 0.58 bin. Consequently, accel-eration potential (as a vertical integration of steric anom-aly) varies considerably, with typical standard devia-tions of 0.72, 0.33, and 0.15 m2 s22, respectively, onthe three surfaces. The standard deviation of the depthof the 27.2su surface (52 m) is about two times largerthan that of the 24.5su surface (25 m), indicative oflarger uncertainties in the deeper layers. Estimate of thestandard deviations of oxygen concentration of 0.25,0.26, and 0.16 ml l21 on the three surfaces providesindependent information on the variability. Standard de-viations of properties are also obtained along vertical
JULY 1999 1499Q U E T A L .
FIG. 8. Same as Fig. 7 except along 1308E.
sections, showing a pattern consistent with that on theisopycnal surfaces; but, the magnitude is somewhatsmaller because of the relatively good data coveragealong the selected vertical sections (section 5).
The results described above give the impression thatthe standard deviations of properties are of comparablestrength with the mean fields, in particular with regardto the waters of the salinity minimum. However, it mustbe noted that, in addition to time variations, the esti-mated standard deviations may also include uncertain-ties in the data mainly from the following three sources.First, because most of the observations were made atconventional standard depths, the interpolated values ofproperties on the isopycnal surfaces are subject to a largeuncertainty, in particular at the intermediate depthswhere vertical separation between levels is typically 100m. Second, the limited number of observations mayenhance the uncertainty by using a larger radius of av-eraging in some parts of the region. The third and prob-ably the least important source of the uncertainty is dueto the smoothing process, explaining less than 10% ofthe total standard deviations.
Yet there is no easy way to definitely know how muchof the large standard deviation is due to the errors inthe data, so as to quantify how complete the mean fields(Figs. 4–9) are in a statistical sense. Nevertheless, since
both time variability and the effect of the errors in thedata are expected to be much reduced by the combineduse of more than 20 samples from various cruises indifferent seasons of different years, the mean fields de-scribed in the preceding sections should be reasonablyrepresentative.
7. Salinity extremes as an indicator of watermasses
Water masses have been traced using isopycnal sur-faces in the previous sections, based on the idea thatwater flows adiabatically without mixing. But, in thepresence of mixing, as is the case in the real ocean, canmixing of temperature and salinity be jointly compen-sated for a water mass to remain a stable density? Thisquestion is investigated below by using salinity ex-tremes as an indicator of water masses.
a. NPTW
Based on Figs. 7–9, NPTW is traced as a salinitymaximum (.34.85 psu) in the density range of 23.0–25.0su. Where multiple maxima occur, the one of high-est salinity is used to map NPTW properties (Figs.10a–d). In the distribution of the probability of salinitymaximum within the density range cited above (Fig.10a), the location of NPTW is fairly clear. Probabilityhigher than 0.5 fits the isopycnal distributions (Figs.4a–d) fairly well. It is confined primarily north of 108Nin the ocean interior, but extends farther south along thewestern boundary. Another interesting phenomenonshown in Fig. 10a is a belt of high (.0.8) probabilitystretching westward over the latitude range between 128and 188N. The axis of the belt is consistent with thepreceding description (section 4) that NPTW enters thewestern ocean with extreme properties at about 158N.Relatively high probability extending northwestwardalong the coast of New Guinea is also seen, apparentlydue to the intrusion of SPTW.
The density of NPTW alters between 23.9 and 24.4su
over the domain enclosed by the probability higher than0.5 (Fig. 10b). It is lowest (23.9su) near 158N, 1408E,and increases westward in the NEC, northward in theKuroshio, and southward in the MC, achieving 24.25and 24.10su, respectively, at the northern and southerntips of the Philippines. In the meantime, considerablechanges are found in potential temperature and salinity,both decreasing in the downstream direction of the NEC,the Kuroshio, and the MC (Figs. 10c–d). The reason forthese changes are apparently mixing in the ocean.
Here su is a function of potential temperature, salin-ity, and pressure of seawater. Different variables makedifferent contributions. The component of pressure isgenerally negligible in the upper ocean, so the densityof water masses is basically determined by the relativeimportance of potential temperature and salinity in thestate equation. In the limit of linear thermodynamics,
1500 VOLUME 29J O U R N A L O F P H Y S I C A L O C E A N O G R A P H Y
FIG. 9. Vertical sections of salinity in psu and dissolved oxygen concentration (in ml L21) againstsu along (a) 208N, (b) 188N, (c) 168N, (d) 148N, (e) 128N, (f ) 108N, (g) 88N, and (h) 68N. Theareas with S . 34.9 psu or S , 34.4 psu are shaded.
changes in density due to changes in potential temper-ature can be estimated by assuming a constant salinity,and vice versa. With the properties shown in Figs.10c–d, the increase of density due to the decrease ofpotential temperature is about three and a half timeslarger in magnitude than the decrease of density due tothe decrease of salinity, thus making NPTW gain itsdensity gradually as it flows with the NEC, the Kuro-shio, and the MC.
b. NPIW
NPIW properties have been documented by severalearlier studies as a salinity minimum between 26.6 and27.0su (e.g., Reid 1965; Talley 1993). Considering thatNPIW is of lower (about 26.55su) density at the Min-danao coast (Lukas et al. 1991), a wider density rangeof 26.4–27.0su is chosen here in which to search forNPIW. The distribution of high (.0.5) probability (Fig.
11a) of salinity minimum (,34.45 psu) in this densityrange shows a similar pattern to that of salinity maxi-mum (Fig. 10a), except for a northward shift of thesouthern boundary in the ocean interior due to the con-traction of the subtropical gyre on denser surfaces. Thehighest (.0.8) probability is centered near 208N, co-inciding roughly with a cold and fresh water mass char-acteristic of NPIW.
NPIW properties are significantly modified as a resultof mixing, becoming warmer and saltier in the down-stream direction of the flowpath (Figs. 11c–d). Again,because changes of potential temperature and salinitymake different contributions to density, with change ofpotential temperature being of more importance thanthat of salinity by a factor of ;2 at intermediate depths,NPIW loses its density to the south from a value ofabout 26.7 kg m23 at 208N to about 26.62 kg m23 at58N (Fig. 11b). Here, the density of NPIW off Mindanaois somewhat higher than that derived from synoptic ob-
JULY 1999 1501Q U E T A L .
FIG. 9. (Continued.)
servations (Lukas et al. 1991; Bingham and Lukas1994). This could be either due to the sparse verticalresolution of the data or due to the averaging andsmoothing processes (described in section 4) used inpreparing this mean density field.
Lukas et al. (1991) suggest that the lower NPIW den-sity off Mindanao is due to truncation from below, asthe deeper component of NPIW has been sheared offby the intrusion of AAIW. The effect of mixing, how-ever, may also be important. Because of the differentimportance of potential temperature and salinity in thestate equation, mixing of potential temperature and sa-linity are not jointly compensated. The net effect ofmixing would be to change NPIW density in favor ofpotential temperature, that is, to decrease southwardalong the Philippine coast.
8. Discussion and summary
With all available historical and recent data, we haveshown an updated climatology of the circulation and
water mass distribution near the Philippine coast.Though time variability and the possible errors in thedata are rather large, the climatology has essentially thesame pattern of circulation as that derived from synopticmeasurements in the upper thermocline by several ear-lier studies, except for some quantitative differences;but, considerable discrepancies are found at interme-diate depths mainly because of the poleward contractionof the subtropical gyre on denser surfaces.
The bifurcation of the NEC is measured near 208Non the 27.2su surface, about 58 farther north than in theupper thermocline. The low part of the LUC does notappear to go directly southward along the westernboundary, as is the case in the shallower waters. Per-haps, it separates from the coast at 108–128N and pen-etrates into the equatorial region through a clockwiserecirculation east of Mindanao. There is some indicationthat this clockwise recirculation is mainly the Halma-hera eddy, tilting to the northwest from about 38N,1308E near the surface to about 78N, 1278E at inter-mediate depths. The mechanism responsible for the ex-
1502 VOLUME 29J O U R N A L O F P H Y S I C A L O C E A N O G R A P H Y
FIG. 9. (Continued.)
istence of this eddy may be a combination of thermo-haline driving and topographic features (Masumoto andYamagata 1991). Its shallow part does not expand north-westward probably because of the strong potential vor-ticity gradient associated with the southward turning ofthe NEC and its subsequent eastward flow of the NECC(Fine et al. 1994; Kashino et al. 1996). At increasingdepths the NEC retreats northward and, in particular, tonorth of 158N on density surfaces around 27.2su, pro-ducing negligible potential vorticity gradient off Min-danao (Kashino et al. 1996) and thus allowing the lowerpart of the Halmahera eddy to intrude farther northwest.As such, the previously observed northward-flowingMUC east of Mindanao appears to be merely a com-ponent of recirculation associated with the Halmaheraeddy.
The Halmahera eddy may be a key factor concerningthe water exchange between hemispheres. Especially atintermediate depths, this eddy extracts North Pacific wa-ter from the north and South Pacific water from the
south, and it finally allows the mixed water to flowsoutheastward into the equatorial circulation on itsnortheast side, westward to the Celebes Sea on its southside, and northward along the coast of Mindanao on itswest side.
Consonant with the circulation pattern describedabove, NPTW and NPIW enter the western ocean withtheir extreme properties at about 158 and 208N, respec-tively. Some of them continue southward as part of theLUC/MC. The southward intrusion of NPTW and NPIWis seen as far south as the southern tip of Mindanaoalong the western boundary. We found little evidencethat SPTW flows into the Celebes Sea. Instead, muchof this saline water appears to recurve eastward into theequatorial circulation through the shallow part of theHalmahera eddy, consonant with the hypothesis that theIndonesian Throughflow is largely derived from the MCwaters (e.g., Lukas et al. 1991; Hautala et al. 1996).The influence of South Pacific sources becomes increas-ingly important with depth. On the 27.2su surface, water
JULY 1999 1503Q U E T A L .
FIG. 10. Distributions of (a) probability, (b) potential density (in kg m23), (c) potential temperature (in 8C), andsalinity (in psu) of NPTW, defined as a salinity maximum (.34.85 psu) in density range of 23.0–25.0su. The heavydashed lines denote the 0.5 probability isopleth.
characteristic of AAIW is traced to about 128N east ofMindanao; however, there is little indication of a north-ward flow of AAIW farther north as was expected (e.g.,Reid 1965; Fine et al. 1994).
NPTW and NPIW are also traced as salinity extremes.Considerable changes in water properties are found atthese salinity extremes because of mixing. Mixing ofpotential temperature and salinity, however, are notjointly compensated, thus leading to an increase of den-
sity in NPTW and a decrease of density in NPIW intheir flowpath from the subtropical gyre to the Tropicswith the NEC and the LUC/MC. These results suggestthat whether or not a water mass remains a stable densityshould largely depend on the relative importance of po-tential temperature and salinity in the state equation.
Left to be addressed in future studies is the effect ofeddies on the distribution of water masses. Althoughpart of the standard deviation obtained during the av-
1504 VOLUME 29J O U R N A L O F P H Y S I C A L O C E A N O G R A P H Y
FIG. 11. Same as Fig. 10 except for NPIW, defined as a salinity minimum (,34.45 psu) in density range of26.4–27.0su.
eraging process may be attributed to the limited numberof samples and the sparse resolution of the data, timevariability in the region appears to be of comparablestrength with the mean field. In view of this large timevariability, the combined use of data from various cruis-es in different seasons of different years may be justi-fiable for the flow due to the very large tendency forgeostrophic balance in the horizontal momentum equa-tions (Wijffels et al. 1995; Qu et al. 1998); but, theeffect of eddies on the distribution of properties is not
likely to be filtered out by averaging, owing to the strongnonlinear dynamics in the process. In this regard, aneddy advective term representing the effect of baroclinicinstability processes should be added to the mean ad-vection. Whether the distribution of properties is moredue to mean advection than due to eddy fluxes remainsunknown. The limited observations available so far un-fortunately do not permit a detailed investigation. Muchwork can be done with the emergence of high-resolutionocean general circulation models.
JULY 1999 1505Q U E T A L .
Finally, it is probably worthwhile noting that the pole-ward tilt of planetary eddies (e.g., the subtropical gyres,the Mindanao Dome, the Halmahera eddy, etc.) at in-creasing depth looks like a rather general phenomenonof the global ocean. The general dynamics governingthis tilt should be investigated further by research.
Acknowledgments. The NODC data used for thisstudy was kindly provided by the Japan OceanographicData Center; WOCE data by the WOCE HydrographicProgram–Special Analysis Center; CAS data by Insti-tute of Oceanology, Chinese Academy of Sciences;PRC–USA data by State Oceanic Administration DataCenter of China; JAMSTEC-BPPT data by Japan Ma-rine Science and Technology Center; and WEPOCS IIIdata by R. Lukas. We wish to express our deep thanksto N. Hogg for his constructive suggestions on the meth-ods of objective analysis, and to G. Meyers, J. P.McCreary, R. Lukas, and S. Wijffels for their helpfuldiscussions on the present topic. Thanks are also ex-tended to J. Potemra and two anonymous reviewers fortheir valuable comments on the earlier manuscript. TheInternational Pacific Research Center (IPRC) is partlysponsored by Frontier Research System for GlobalChange.
REFERENCES
Bingham, F. M., and R. Lukas, 1994: The southward intrusion ofNorth Pacific Intermediate Water along the Mindanao coast. J.Phys. Oceanogr., 24, 141–154., and , 1995: The distribution of intermediate water in thewestern equatorial Pacific during January–February 1986. Deep-Sea Res. I, 42, 1545–1573.
Bretherton, F. P., R. E. Davis, and C. B. Fandry, 1976: A techniquefor objective analysis and design of oceanographic experimentsapplied to MODE-73. Deep-Sea Res. I, 23, 559–582.
Fine, R. A., R. Lukas, F. M. Bingham, M. J. Warner, and R. H.Gammon, 1994: The western equatorial Pacific is a water masscrossroads. J. Geophys. Res., 99, 25 063–25 080.
Gu, D., and, S. G. H. Philander, 1997: Interdecadal climate fluctu-ations that depend on exchange between the Tropics and extra-tropics. Science, 275, 805–807.
Hautala, S. L., J. S. Reid, and N. Bray, 1996: The distribution andmixing of Pacific water masses in the Indonesian Seas. J. Geo-phys. Res., 101, 12 353–12 373.
Hu, D., M. Cui, T. Qu, and Y. Li, 1991: A subsurface northwardcurrent off Mindanao identified by dynamic calculation. Ocean-ography of Asian Marginal Seas, K. Takanao, Ed., No. 54, El-sevier Oceanogr. Series, Elsevier, 359–365.
Kashino, Y., M. Aoyama, T. Kawano, N. Hendiarti, Syaefudin, Y.Anantasena, K. Muneyama, and H. Watanabe, 1996: The watermasses between Mindanao and New Guinea. J. Geophys. Res.,101, 12 391–12 400.
Levitus, S., and T. P. Boyer, 1994a: World Ocean Atlas 1994. Vol.4: Temperature. NOAA Atlas NESDIS 4, U.S. Department ofCommerce, 117 pp., and , 1994b: World Ocean Atlas 1994. Vol. 3: Salinity.NOAA Atlas NESDIS 3, U.S. Department of Commerce, 99 pp.
, and , 1994c: World Ocean Atlas 1994. Vol. 2: Oxygen.NOAA Atlas NESDIS 2, U.S. Department of Commerce, 186 pp.
Lu, P., and J. P. McCreary, 1995: Influence of the ITCZ on the flowof thermocline water from the subtropical to the equatorial Pa-cific Ocean. J. Phys. Oceanogr., 25, 3076–3088.
Lukas, R., E. Firing, P. Hacker, P. L. Richardson, C. A. Collins, R.Fine, and R. Gammon, 1991: Observations of the MindanaoCurrent during the Western Equatorial Pacific Ocean CirculationStudy (WEPOCS). J. Geophys. Res., 96, 7098–7104.
Luyten, J. R., J. Pedlosky, and H. Stommel, 1983: The ventilationthermocline. J. Phys. Oceanogr., 13, 292–309.
Masumoto, Y., and T. Yamagata, 1991: Response of the western trop-ical Pacific to the Asian winter monsoon: The generation of theMindanao Dome. J. Phys. Oceanogr., 21, 1386–1398.
Masuzawa, J., 1972: Water characteristics of the North Pacific centralregion. Kuroshio: Physical Aspects of the Japan Current, H.Stommel and K. Yoshida, Eds., University of Washington Press,95–127.
McCreary, J. P., and P. Lu, 1994: On the interaction between thesubtropical and the equatorial oceans: The subtropical cell. J.Phys. Oceanogr., 24, 466–497.
Nitani, H., 1972: Beginning of the Kuroshio. Kuroshio: PhysicalAspects of the Japan Current, H. Stommel and K. Yoshida, Eds.University of Washington Press, 129–163.
Qiu, B., 1995: Why is the spreading of the North Pacific IntermediateWater confined on density surfaces around su 5 26.8? J. Phys.Oceanogr., 25, 168–180., and R. Lukas, 1996: Seasonal and interannual variability ofthe North Equatorial Current, the Mindanao Current and theKuroshio along the Pacific western boundary. J. Geophys. Res.,101, 12 315–12 330.
Qu, T., T. Kagimoto, and T. Yamagata, 1997: A subsurface counter-current along the east coast of Luzon. Deep-Sea Res. I, 44, 413–423., H. Mitsudera, and T. Yamagata, 1998: On the western boundarycurrents in the Philippine Sea. J. Geophys. Res., 103 (4), 7537–7548.
Reid, J. L., 1965: Intermediate waters of the Pacific Ocean. JohnsHopkins Oceanogr. Stud., Vol. 2, 85 pp., and R. S. Arthur, 1975: Interpretation of maps of geopotentialanomaly for the deep Pacific Ocean, J. Mar. Res., 33 (Suppl.),37–52.
Talley, L. D., 1993: Distribution and formation of North Pacific In-termediate Water. J. Phys. Oceanogr., 23, 517–537.
Toole, J. M., E. Zou, and R. C. Millard, 1988: On the circulation ofthe upper waters in the western equatorial Pacific Ocean. Deep-Sea Res. I, 35, 1451–1482., R. C. Millard, Z. Wang, and S. Pu, 1990: Observations of thePacific North Equatorial Current bifurcation at the PhilippineCoast. J. Phys. Oceanogr., 20, 307–318.
Tsuchiya, M., 1968: Upper waters of the intertropical Pacific Ocean.Johns Hopkins Oceanogr. Stud., Vol. 4, 50 pp., R. Lukas, R. A. Fine, E. Firing, and E. Lindstrom, 1989: Sourcewaters of the Pacific equatorial undercurrent. Progress in Ocean-ography, Vol. 23, Pergamon Press, 101–147.
Wijffels, S., E. Firing, and J. Toole, 1995: The mean structure andvariability of the Mindanao Current at 88N. J. Geophys. Res.,100, 18 421–18 435., M. M. Hall, T. Joyce, D. J. Torres, P. Hacker, and E. Firing,1998: Multiple deep gyres of the western North Pacific: AWOCE section along 1498E. J. Geophys. Res., 103, 12 985–13009.
Wyrtki, K., 1961: Physical oceanography of the southeast Asian wa-ters. NAGA Report 2, Scripps Inst. of Oceanogr., University ofCalifornia, San Diego, La Jolla, CA, 195 pp.