Bo Li 1,2 and Michelle S. Hoo Fatt 1 A Cohesive Zone Model to Predict Dynamic Tearing of Rubber REFERENCE: Li, B., and Hoo Fatt, M. S., ‘‘A Cohesive Zone Model to Predict Dynamic Tearing of Rubber,’’ Tire Science and Technology , TSTCA, Vol. 43, No. 4, October– December 2015, pp. 297–324. ABSTRACT: Tire failures, such as tread separation and sidewall zipper fracture, occur when internal flaws (cracks) nucleate and grow to a critical size as result of fatigue or cyclic loading. Sudden and catastrophic rupture takes place at this critical crack size because the strain energy release rate exceeds the tear energy of the rubber in the tire. The above-mentioned tire failures can lead to loss of vehicle stability and control, and it is important to develop predictive models and computational tools that address this problem. The objective of this article was to develop a cohesive zone model for rubber to numerically predict crack growth in a rubber component under dynamic tearing. The cohesive zone model for rubber was embedded into the material constitutive equation via a user-defined material subroutine (VUMAT) of ABAQUS. It consisted of three parts: (1) hyperviscoelastic behavior before damage, (2) damage initiation based on the critical strain energy density, and (3) hyperviscoelastic behavior after damage initiation. Crack growth in the tensile strip and pure shear specimens was simulated in ABAQUS Explicit, and good agreement was reported between finite element analysis predictions and test results. KEY WORDS: cohesive zone model, rubber, hyperviscoelastic, finite element analysis Introduction All tires possess microscopic flaws or defects. These flaws gradually coalesce into cracks, and these cracks grow as a result of fatigue or cycling loading in a rotating tire. Occasionally, surface cracks can appear on sidewalls or the base of tread grooves from weathering or ozone cracking. In most cases, crack growth is slow, stable, and sustainable before the treads wear down in the tire. Under some circumstances, however, a crack may grow to a critical length so that further loading results in unstable crack growth and catastrophic failure throughout the tire. Tread separation and sidewall zipper failure are two well- known examples of catastrophic tire failures, which could result in uncontrollable vehicle dynamics and sometimes accidents. Trucks, off-road vehicles, and heavy-equipment vehicles are prone to these types of failures because of an aggressive environment and usage, as well as poor maintenance, such as underinflated tires. Poor materials and manufacturing processes could exacerbate the problem by increasing the number and size of microscopic defects in a tire. New tire technology, such as the introduction or sensors/ 1 Department of Mechanical Engineering, University of Akron, 302 East Buchtel Avenue, Akron, Ohio 44325-3903, USA 2 Corresponding author. Email: [email protected]297
Transcript
Bo Li1,2 and Michelle S. Hoo Fatt1
A Cohesive Zone Model to Predict Dynamic Tearingof Rubber
REFERENCE: Li, B., and Hoo Fatt, M. S., ‘‘A Cohesive Zone Model to Predict Dynamic
Tearing of Rubber,’’ Tire Science and Technology, TSTCA, Vol. 43, No. 4, October–
December 2015, pp. 297–324.
ABSTRACT: Tire failures, such as tread separation and sidewall zipper fracture, occur when
internal flaws (cracks) nucleate and grow to a critical size as result of fatigue or cyclic loading.
Sudden and catastrophic rupture takes place at this critical crack size because the strain energy
release rate exceeds the tear energy of the rubber in the tire. The above-mentioned tire failures
can lead to loss of vehicle stability and control, and it is important to develop predictive models
and computational tools that address this problem. The objective of this article was to develop
a cohesive zone model for rubber to numerically predict crack growth in a rubber component
under dynamic tearing. The cohesive zone model for rubber was embedded into the material
constitutive equation via a user-defined material subroutine (VUMAT) of ABAQUS. It
consisted of three parts: (1) hyperviscoelastic behavior before damage, (2) damage initiation
based on the critical strain energy density, and (3) hyperviscoelastic behavior after damage
initiation. Crack growth in the tensile strip and pure shear specimens was simulated in
ABAQUS Explicit, and good agreement was reported between finite element analysis
predictions and test results.
KEY WORDS: cohesive zone model, rubber, hyperviscoelastic, finite element analysis
Introduction
All tires possess microscopic flaws or defects. These flaws graduallycoalesce into cracks, and these cracks grow as a result of fatigue or cyclingloading in a rotating tire. Occasionally, surface cracks can appear on sidewallsor the base of tread grooves from weathering or ozone cracking. In most cases,crack growth is slow, stable, and sustainable before the treads wear down in thetire. Under some circumstances, however, a crack may grow to a critical lengthso that further loading results in unstable crack growth and catastrophic failurethroughout the tire. Tread separation and sidewall zipper failure are two well-known examples of catastrophic tire failures, which could result inuncontrollable vehicle dynamics and sometimes accidents. Trucks, off-roadvehicles, and heavy-equipment vehicles are prone to these types of failuresbecause of an aggressive environment and usage, as well as poor maintenance,such as underinflated tires. Poor materials and manufacturing processes couldexacerbate the problem by increasing the number and size of microscopicdefects in a tire. New tire technology, such as the introduction or sensors/
1 Department of Mechanical Engineering, University of Akron, 302 East Buchtel Avenue,Akron, Ohio 44325-3903, USA
indicators and a change in materials/manufacturing processes, could alsopotentially lead to unintentional or unexpected tire response and result in someof these failures. Therefore, it is important to have predictive models andcomputational tools that can address the growth of cracks in a tire. Having thiscapability will improve tire engineering and analysis, and it may even alleviateoverdesigning them with unsubstantiated high factors of safety.
A cohesive zone model (CZM) for predicting crack propagation in rubberunder dynamic loading is developed in this article. This concept is based on theidea of energy release rate, which originated with Griffith [1]. The adaptation ofGriffith’s energy approach to the tear behavior of rubber was made in 1953 byRivlin and Thomas [2] and verified experimentally by comparing the behaviorof test pieces of very different shapes by Thomas [3]. From the viewpoint offracture mechanics, a crack will not grow unless the energy release rate exceedsthe critical energy release rate or tear energy of the rubber necessary to create anew surface at the crack tip. However, rubber fracture mechanics is distinctfrom classical fracture mechanics of other engineering materials because itinvolves hyperviscoelastic material behavior and large deflection or finite strainanalysis. In addition to this, rubber’s mechanical properties are also affected byaging, temperature, and environmental agents, such as ozone and ultravioletrays [4].
The energy release rate for crack propagation in an actual tire is acomplicated function of the initial crack length and its orientation, tiregeometry, rubber material behavior in the tire, and the loading to the tireimparted by the vehicle. There have been attempts to use finite element analysis(FEA) to calculate energy release rates (sometimes called J-Integrals) in tires[5,6]. However, these attempts focused on crack initiation and did not involvethe creation of new crack surfaces in the tire. The CZM is a breakthrough infracture mechanics because it is based on the energy release rate and candescribe crack growth or the creation of new surfaces. By introducing theconcept of a traction-separation law in a cohesive zone at the crack tip, the crackis assumed to break like two adhesive surfaces. Each material has its ownunique traction-separation law depending on micro-mechanisms of failure [7].The CZM is typically characterized by only two of three parameters: the peaktraction Ti, the maximum displacement df, and the energy release rate G, whichis the area under the traction-separation curve shown in Fig. 1. In this case, thestress at the crack tip is characterized by the peak traction Ti so that the CZMavoids the stress singularity problem, which arises with the use of stressintensity factors and J-Integrals.
Although the CZM has been applied in fracture analysis of both brittle andductile materials, most CZM research requires a predefined crack path indifferent FEA problems [8–14], including rubber [15]. The approach in thisarticle does not make use of cohesive elements and a predetermined crack pathbut instead incorporates cohesive zone modeling into the material constitutive
298 TIRE SCIENCE AND TECHNOLOGY
behavior of the rubber. To develop the CZM for rubber, results from high-strain-
rate material tensile and fracture tests on carbon black–filled natural rubber
(NR) are taken from Al-Quraishi and Hoo Fatt [16] and Hoo Fatt et al. [17]. The
following section summarizes the above-mentioned experimental results that
will be used in this study. A CZM for rubber is then proposed after this. A
hyperviscoelastic constitutive equation and a damage initiation criterion are first
developed from the high strain rate, uniaxial dumbbell tension test data up to
break. Appropriate equivalent traction and displacement then follow from the
damage initiation criterion. A unique damage evolution function for rubber is
proposed and introduced into the traction-separation response for the rubber.
The traction-separation response and the tear energy of the NR are used to
determine crack propagation. The CZM model is incorporated in the form of an
ABAQUS Explicit user-defined material subroutine (VUMAT) and is used to
predict the crack initiation and propagation in the tensile strip and pure shear
fracture specimens.
Charpy Impact Tension and Fracture Test Results
The test data used in this article are taken from references [16] and [17]. In
these experiments, a Charpy Tensile Impact apparatus [18] was used to apply
tensile loading of rubber specimen at high speeds. The drop height of the
Charpy pendulum determined the amount of available potential energy for each
test. Once the pendulum was released, it hit a slider bar at the base, thereby
transferring potential energy of the hammer to kinetic energy of slider bar.
Through various design configurations, the slider bar was connected to ends of
grips holding the specimens. Specific details of these can be found in references
[16] and [17]. During each test, the deformation and the crack tip position of the
specimen were recorded by the FASTCAM-Ultima high-speed camera, and
piezoelectric force sensors were used to record the impact tensile force imposed
on the specimen.
FIG. 1 — Traction-separation law of a cohesive zone model.
LI AND HOO FATT ON A COHESIVE ZONE MODEL 299
Three types of specimens were tested on this Charpy Tensile Impact
apparatus: (1) uniaxial tensile dumbbell, (2) tensile strip, and (3) pure shear. The
uniaxial tension test results are used to develop the hyperviscoelastic behavior
before damage initiation as well as a damage initiation criterion for rubber. The
tensile strip and pure shear fracture tests are then used to develop the CZM,
including the hyperviscoelastic behavior after damage initiation and tearing.
The CZM is used in an ABAQUS Explicit program to simulate tearing of the
tensile strip and pure shear specimens. Crack propagation is manifested by
element erosion in the FEA.
Uniaxial Tension Tests
In reference [16], a uniaxial tension test was performed on ASTM D638
half-dumbbell specimens [19]. The experiments were done to break up the
material so that the tensile strength and elongation at break could be found, as
shown in Fig. 2. In addition to the high-strain-rate tests, material behavior at
0.1, 1, and 10 s�1 as well as the equilibrium behavior of material were obtained
from an MTS servo-hydraulic machine. The equilibrium response was obtained
from step relaxation tests on the MTS servo-hydraulic machine. Results from
the MTS machine are added to Fig. 2 for comparison. It was noted that the NR
exhibited rate-dependent behavior. Unlike most other rubber compounds,
stiffness and strength do not increase with the rate of loading because of a lack
of relaxation time during the test. NR obtains stiffness and strength from strain-
induced crystallization, which is a process that occurs over a finite time. At high
FIG. 2 — Uniaxial tension test results.
300 TIRE SCIENCE AND TECHNOLOGY
strain rates or very short loading times, this crystallization process is suppressedso that stiffening and strengthening by it are reduced.
Tensile Strip TestsIn the tensile strip tests, the specimen was a flat rubber sheet with a notch,
as shown in Fig. 3. The dimensions of the specimen were length l ¼ 50.8 mm,width w¼25.4 mm, thickness t¼2 mm, and a notch or precrack length a¼5.08mm. The tensile loading was evenly imposed on the opposite ends of thespecimen. Crack growth occurred from the left end to the right end at the centerof the specimen.
The deformation and the corresponding force-displacement relationmeasured at the grips are shown in Fig. 4 for the test at drop height 76.2 cm.Different stages of deformation and crack growth are marked as a–e, and thecorresponding force-displacement curve at these events is given. The specimenexperienced severe blunting before fracture onset at 25.6 ms or 50.6 mm ofextension. The crack grows from 25.6 ms to 30.7 ms, when the specimen breaksinto two parts. Tests at drop heights 50.8 and 101.6 cm were also done, andresults from these will be shown in a later section.
Pure Shear TestsThe pure shear tests were similar to the tensile strip tests. However, the
width of the specimen was much longer than its height, as shown in Fig. 5. The
FIG. 3 — Tensile strip specimen.
LI AND HOO FATT ON A COHESIVE ZONE MODEL 301
dimensions of the specimen were height h ¼ 19 mm, width w ¼ 260 mm,
thickness t ¼ 1.5 mm, and precrack length a ¼ 63.5 mm. During the pure shear
tests, tensile loading was imposed on the upper surface of the specimen and the
lower surface was fixed. The crack grows from the notch to the right end. The
material is under constrained tension because of the high width-to-height ratio.
This mode of fracture is often termed constrained tension because of this
geometry configuration.
FIG. 4 —Tensile strip test deformation and corresponding force-displacement curve at 76.2-cm dropheight.
FIG. 5 — Pure shear specimen.
302 TIRE SCIENCE AND TECHNOLOGY
The deformation and the corresponding force-displacement curve measuredat the grips are shown in Fig. 6 for the test at 76.2-cm drop height. Similar to thetensile strip, there is blunting at the crack tip before the onset of fracture at 10.5ms or 18 mm. Crack growth in this specimen is much longer than the tensilestrip. The load drop that is associated with tearing occurs over half of the totalload-drop curve so that crack propagation in this specimen is very evident. Testsat drop heights of 50.8 and 101.6 cm were also performed, and results fromthese will be given in a later section.
Development of CZM for Rubber
During crack growth in a ductile material–like rubber, there is an apparentcohesive zone ahead of the crack tip as shown in Fig. 7a. From the viewpoint ofa CZM, material behavior in the cohesive zone can be characterized by anequivalent traction-separation law, as shown in Fig. 7b. The stress at the cracktip is denoted by an equivalent traction T, and the displacement between the two
FIG. 6 — Pure shear test deformation and corresponding force-displacement curve at 76.2-cm dropheight.
LI AND HOO FATT ON A COHESIVE ZONE MODEL 303
surfaces ahead of the crack tip is denoted by an equivalent separation d, which
is given by
d ¼ e � Lc ð1Þ
where e is the equivalent strain and Lc is the characteristic length associated
with the mesh in FEA. Specific details of how to obtain the equivalent strain and
traction at the crack tip will be given later.
The CZM that is proposed for rubber consists of three events based on the
equivalent traction-separation law: (1) hyperviscoelastic behavior before
damage OA, (2) damage initiation at A, and (3) hyperviscoelastic behavior
after damage initiation AB. Note that in most existing CZMs, behavior before
damage OA is ignored because it is used with cohesive surface or interface
elements and not actual material response.
OA, the hyperviscoelastic behavior before damage is developed from a
rheological model involving an equilibrium spring, is in parallel with a Maxwell
FIG. 7 — Growth of a crack in rubber: (a) cohesive zone and (b) equivalent traction-separation law.
304 TIRE SCIENCE AND TECHNOLOGY
element. The high-strain-rate, uniaxial tension test data up to break is used todevelop this hyperviscoelastic behavior.
At Point A, the critical strain energy density is selected as the damageinitiation criterion for the rubber material. A strain rate–dependent function isused to describe the variation of critical strain energy density in a differentstrain rate. In the equivalent traction-separation curve Ti and di are, respectively,the traction and displacement when the damage initiation is reached.
In AB, the hyperviscoelastic behavior after damage initiation is character-ized by the following exponential function:
T ¼ Ti 1 � 1 � e�mðd�diÞðdf �diÞ
1 � e�m
24
35
8<:
9=; ð2Þ
where m is a parameter to control the rate of degradation and df is the finaldisplacement. The equivalent traction T is given by
T ¼ Teq þ Tov ð3Þ
where Teq is the equivalent traction due to equilibrium spring and Tov is theequivalent traction due to intermediate spring. Hence, the equivalent traction ishyperviscoelastic. The tear energy of the rubber G is the value equal to the areaunder OAB:
G ¼Z df
0
Tdd ð4Þ
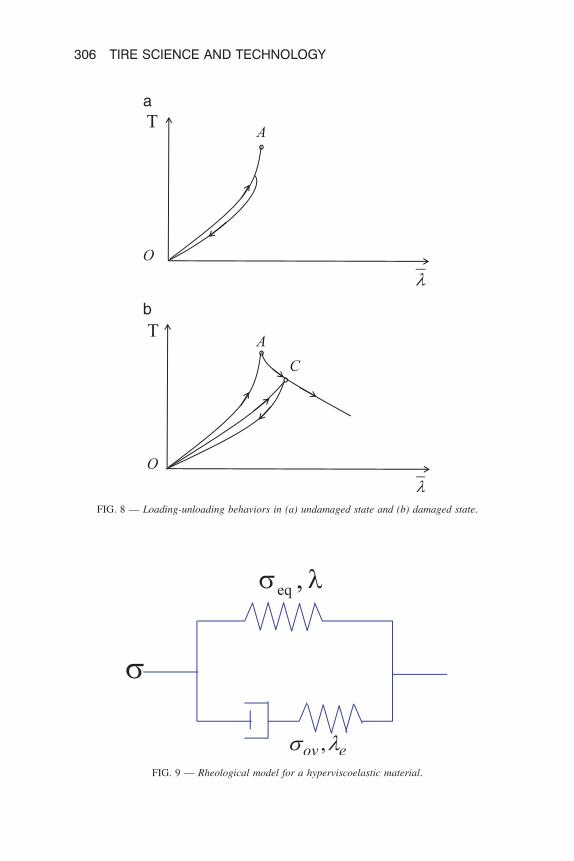
Once damage has initiated, the material properties are degraded. It isimportant to distinguish the terms damage and degradation in this context withthe so-called Mullins effect or stress softening in the hysteresis of filled rubbersundergoing cyclic loading [20]. Here the terms damage and degradation relateto the local cavitation or thinning of a rubber sheet as it breaks apart. Figure 8aand b illustrate the loading-unloading behavior of rubber in the undamaged anddamaged states. Between OA, the rubber has hyperviscoelastic behavior withundamaged properties, as shown in Fig. 8a. Between AC, the rubber hashyperviscoelastic behavior with damaged properties, as shown in Fig. 8b.Loading and unloading in these deformation phases produce hysteresis.Unloading between AC can occur if the available energy is not enough tocreate new surfaces. The following section describes the material behaviorbefore damage, a damage initiation criterion, and material behavior afterdamage initiation based on the above CZM for rubber.
Hyperviscoelastic Behavior before DamageThe hyperviscoelastic behavior of the NR is derived from the rheological
model of an equilibrium spring in parallel with a Maxwell element, as shown in
LI AND HOO FATT ON A COHESIVE ZONE MODEL 305
FIG. 8 — Loading-unloading behaviors in (a) undamaged state and (b) damaged state.
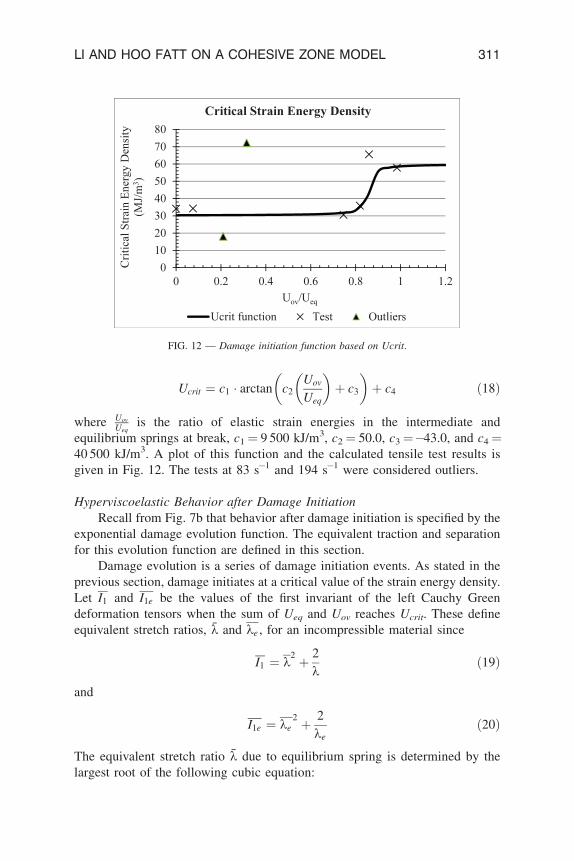
FIG. 9 — Rheological model for a hyperviscoelastic material.
306 TIRE SCIENCE AND TECHNOLOGY
Fig. 9. The Maxwell element has a viscous damper in series with an
intermediate spring. Thus, the total stress at any time is given by
r ¼ req þ rov ð5Þ
where r symbolizes the total Cauchy stress of this model. The req and rov
denotes the stress caused by the equilibrium spring and intermediate spring,
respectively. Both springs in this model are hyperelastic, and resistance of the
viscous damper is controlled by strain rate.
The viscous damper allows the force in the intermediate spring to vary at
different strain rates. If the strain rate is very low or approaches zero, the total
deformation of this rheological model is governed only by the equilibrium
spring since no force passes through the intermediate spring of the Maxwell
element. In this case, the total stress r is equal to the equilibrium stress req.
When the strain rate is very high, the viscous damper does not have time to
deform, and the intermediate spring deforms by the same amount as the
equilibrium spring. In this case, the overstress and total stress are at an upper
limiting value. In between very slow and fast strain rates, the intermediate
spring deformation is lower than the equilibrium spring. This feature allows
rate-dependent behavior to be modeled.
In a three-dimensional context, the equilibrium and intermediate springs
are expressed as incompressible hyperelastic material:
req ¼ �peqI þ 2]Ueq
]I1þ IB
]Ueq
]I2
� �B � 2
]Ueq
]I2BB ð6Þ
and
rov ¼ �povI þ 2]Uov
]I1eþ I1e
]Uov
]I2e
� �Be � 2
]Uov
]I2eBeBe ð7Þ
where peq and pov are undetermined pressures, I1 and I2 denote first and second
invariants of the left Cauchy Green deformation tensor B in the equilibrium
spring, I1e and I2e denote first and second invariants of the left Cauchy Green
deformation tensor in the intermediate spring Be, and Ueq and Uov are strain
energy potential functions given in terms of the above-mentioned invariants of
the left Cauchy Green deformation tensors.
The key to relating viscosity to the overstress lies in a compatibility
relation first derived by Huber and Tsakmakis [21]:
_Be ¼ LBe þ BeLT � 2FeDvFTe ð8Þ
where L is the velocity gradient tensor and Dv is the rate of deformation tensor
of the viscous damper. They argued that to guarantee the dissipation rate is
always positive
LI AND HOO FATT ON A COHESIVE ZONE MODEL 307
FeDvFTe ¼ 1
gBer
Dov;g.0 ð9Þ
where g is a viscosity coefficient and rDov is the deviatoric component of the
overstress. Substituting Eq. (9) into Eq. (8) gives an expression for the
overstress in terms of the
_Be ¼ LBe þ BeLT � 2
gBer
Dov ð10Þ
The above equation relates the overstress to deformation rates in both
equilibrium and intermediate springs. In reference [21], g was assumed to be
constant, but in this article, g is taken to be a nonlinear function of I1 and I1e. By
making the viscosity a function of the first invariants of both of these left
Cauchy Green deformation tensors, the overstress becomes dependent on
deformation as well as rate of deformation.
The above expressions were reduced to the uniaxial stress case in order to
obtain hyperelastic constants for the springs and a viscosity function for the
damper. A Yeoh (third-order reduced polynomial) function [22] was found to
best describe the hyperelastic equilibrium and intermediate springs, which were
assumed to have the same hyperelastic coefficients for simplicity:
req ¼ 2 C10 þ 2C20ðI1 � 3Þ þ 3C30ðI1 � 3Þ2h i
k2 � 1
k
� �; I1 ¼ k2 þ 2
kð11Þ
and
rov ¼ 2 C10 þ 2C20ðI1e � 3Þ þ 3C30ðI1e � 3Þ2h i
k2e �
1
ke
� �; I1e ¼ k2
e þ2
ke
ð12Þ
The hyperelastic coefficients, C10, C20, and C30, were found by fitting the
uniaxial test data from a step relaxation tests for the equilibrium response. For
the 25 phr carbon black–filled NR: C10 ¼ 0.2515 MPa, C20 ¼ 0.0057 MPa, and
C30 ¼ 6.303E-06 MPa. Once these coefficients were found, a viscosity function
was derived from the high strain rate tests as follows:
g ¼ aðI1 þ bÞc þ dðI1e þ eÞf þ gðI1 þ hÞiðI1e þ jÞk þ l ð13Þ
where parameters a–l are listed in Table 1. Figure 10 is a plot showing the
viscosity in I1–I1e space.
Uniaxial stress–strain behavior at various strain rates was predicted with
the above hyperelastic and viscoelastic properties. The predicted hyper-
viscoelastic behavior before damage initiation is compared in tensile tests
results in Fig. 11a and b, and relatively good agreement is reported.
308 TIRE SCIENCE AND TECHNOLOGY
Damage Initiation Criterion
The damage initiation criterion for NR is defined as the critical strain
energy density Ucrit, which is the total strain energy density stored in the
equilibrium and intermediate spring up to break in a uniaxial tensile test. At
point A, the strain energy density U is given by
FIG. 10 — Viscosity distributions at different strain rate in NR25.
Thus, the damage initiation criterion for NR is given by
U � Ucrit ð17Þ
The critical strain energy density is rate dependent. The tensile strength and
elongation at break depended on strain rate in the tensile tests. To model this
rate dependency, the following function was chosen for Ucrit:
FIG. 11 — Rate-dependent material response: (a) simulations and (b) tests.
310 TIRE SCIENCE AND TECHNOLOGY
Ucrit ¼ c1 � arctan c2Uov
Ueq
� �þ c3
� �þ c4 ð18Þ
where Uov
Ueqis the ratio of elastic strain energies in the intermediate and
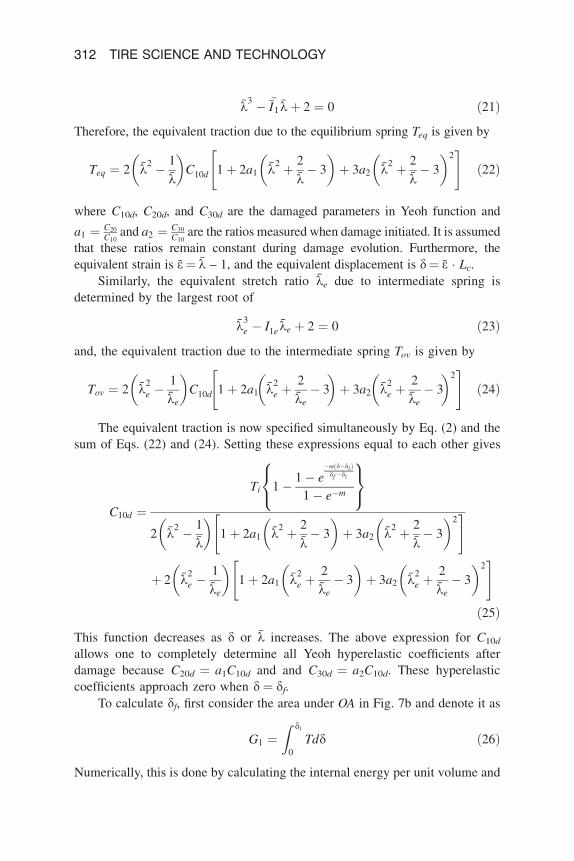
equilibrium springs at break, c1 ¼ 9 500 kJ/m3, c2 ¼ 50.0, c3 ¼�43.0, and c4 ¼40 500 kJ/m3. A plot of this function and the calculated tensile test results isgiven in Fig. 12. The tests at 83 s�1 and 194 s�1 were considered outliers.
Hyperviscoelastic Behavior after Damage InitiationRecall from Fig. 7b that behavior after damage initiation is specified by the
exponential damage evolution function. The equivalent traction and separationfor this evolution function are defined in this section.
Damage evolution is a series of damage initiation events. As stated in theprevious section, damage initiates at a critical value of the strain energy density.Let I1 and I1e be the values of the first invariant of the left Cauchy Greendeformation tensors when the sum of Ueq and Uov reaches Ucrit. These defineequivalent stretch ratios, k and ke , for an incompressible material since
I1 ¼ k2 þ 2
kð19Þ
and
I1e ¼ ke2 þ 2
keð20Þ
The equivalent stretch ratio k due to equilibrium spring is determined by thelargest root of the following cubic equation:
FIG. 12 — Damage initiation function based on Ucrit.
LI AND HOO FATT ON A COHESIVE ZONE MODEL 311
k3 � �I1 kþ 2 ¼ 0 ð21Þ
Therefore, the equivalent traction due to the equilibrium spring Teq is given by
Teq ¼ 2 k2 � 1
k
� �C10d 1 þ 2a1 k
2 þ 2
k� 3
� �þ 3a2 k
2 þ 2
k� 3
� �2" #
ð22Þ
where C10d, C20d, and C30d are the damaged parameters in Yeoh function and
a1 ¼ C20
C10and a2 ¼ C30
C10are the ratios measured when damage initiated. It is assumed
that these ratios remain constant during damage evolution. Furthermore, the
equivalent strain is e¼ k – 1, and the equivalent displacement is d¼ e � Lc.
Similarly, the equivalent stretch ratio ke due to intermediate spring is
determined by the largest root of
k3e � I1e ke þ 2 ¼ 0 ð23Þ
and, the equivalent traction due to the intermediate spring Tov is given by
Tov ¼ 2 k2e �
1
ke
� �C10d 1 þ 2a1 k
2e þ
2
ke
� 3
� �þ 3a2 k
2e þ
2
ke
� 3
� �2" #
ð24Þ
The equivalent traction is now specified simultaneously by Eq. (2) and the
sum of Eqs. (22) and (24). Setting these expressions equal to each other gives
C10d ¼
Ti 1 � 1 � e�mðd�diÞdf �di
1 � e�m
8<:
9=;
2 k2 � 1
k
� �1 þ 2a1 k
2 þ 2
k� 3
� �þ 3a2 k
2 þ 2
k� 3
� �2" #
þ 2 k2e �
1
ke
� �1 þ 2a1 k
2e þ
2
ke
� 3
� �þ 3a2 k
2e þ
2
ke
� 3
� �2" #
ð25Þ
This function decreases as d or k increases. The above expression for C10d
allows one to completely determine all Yeoh hyperelastic coefficients after
damage because C20d ¼ a1C10d and and C30d ¼ a2C10d. These hyperelasticcoefficients approach zero when d ¼ df.
To calculate df, first consider the area under OA in Fig. 7b and denote it as
G1 ¼Z di
0
Tdd ð26Þ
Numerically, this is done by calculating the internal energy per unit volume and
312 TIRE SCIENCE AND TECHNOLOGY
multiplying it by Lc. The remaining energy release rate includes the area undercurve AB in Fig. 7b and is given by
G2 ¼Z df
di
Ti 1 � 1 � e�mðd�diÞðdf �diÞ
1 � e�m
24
35
8<:
9=;dd ¼ Tiðdf � diÞ 1 � e�mðm þ 1Þ½ �
mð1 � e�mÞ ð27Þ
Using G2 ¼ G – G1 gives the final equivalent displacement for total damage as
df ¼ di þðG � G1Þmð1 � e�mÞ
1 � e�mðm þ 1Þ½ �Tið28Þ
The viscosity function after damage initiation also changes with C10d. Asimple function for the viscosity after damage initiation is assumed as
gd ¼ C10d
C10g ð29Þ
where g is the undamaged viscosity function in Eq. (13).
FEA Results
FEA ImplementationThe CZM developed for rubber and discussed above is incorporated in an
ABAQUS VUMAT. The VUMAT was first used in a single element underuniaxial stress. The tension test at 106 s�1 strain rate was simulated specifically.Details of the ABAQUS single-element model are given in Table 2, and inputmaterial properties are given in Table 3.
Figure 13a shows the element and the boundary conditions applied to it inorder to keep it in uniaxial loading condition. The Cauchy extension ratioresponses of the single element with a different rate of degradation parametersm are shown in Fig. 13b for comparison. The single-element FEA shows thatthe load gradually drops after damage initiation. This is different from thesudden load drop in an ideally brittle material. The load drop speed and thefinal extension of the element depend on m. When m � 0.1, an almost linearload drop and a final extension ratio of about 8 is expected. When m � 5, theload drop is steeper at first and ends more gradually, like an exponential
TABLE 2 — ABAQUS single-element model.
ABAQUS solver Dynamic, explicit version 6.12
Element l 3 b 3 h ¼ 0.125 mm 3 0.125 mm 3 0.125 mm; type ¼ C3D8
Step time 0.1 s
Loading type Displacement control, ramp at 13.25 mm/s (strain rate is 106 s�1)
LI AND HOO FATT ON A COHESIVE ZONE MODEL 313
TABLE 3 — Material properties for FEA input.
Density 1083.35 kg/m3
Yeoh hyperelastic coefficients C10¼ 0.2515 MPa
C20¼ 0.005 68 MPa
C30¼ 6.3029E-06 MPa
Bulk modulus (for almost incompressible material) K1¼ 0.251 456 GPa
K2¼ 0.002 838 GP
K3¼ 2.10e-6 GPa
Viscosity function Eq. (13)
Critical strain energy Ucrit Eq. (18)
Tear energy G 10 900 J/m2
Crack parameter m 0.1, 1, 2, 5
FIG. 13 — Uniaxial tension in a single finite element (a) FEA model and (b) Cauchy stress versusextension ratio with various m.
314 TIRE SCIENCE AND TECHNOLOGY
decay, but the final extension ratio becomes large (.9). Such a largeextension ratio would not be practical because of element overdistortion.Therefore, there is a small range of useful values for m, and it is assumed that0.1 � m � 5.
In a meshed part, m should theoretically control the rate of crack growthbecause it determines the final deformation at which an element is eroded. Theelement is eroded quickly when the final deformation is small, and it is erodedslowly when the final deformation is large. However, the size of the element in ameshed part will also affect how fast crack growth is simulated in FEA. Erosionwith smaller elements is slower than with larger elements. These are tradeoffsthat one has to make in the FEA.
Tensile Strip TestsA quarter model of the tensile strip specimen is made to simulate the
tensile strip tearing tests because the load is evenly imposed on the specimenopposite ends. The full specimen and quarter model are shown in Fig. 14a andb. The dashed lines in Fig. 14a indicate the quarter of the full strip used in theFEA. According to Fig. 14b, there are symmetry boundary conditions withrespect to y and z directions, and the displacement loading is placed at a
FIG. 14 — FEA model of tensile strip specimen: (a) full specimen and (b) quarter model.
LI AND HOO FATT ON A COHESIVE ZONE MODEL 315
reference point on the top of the surface. Forces are also obtained from this
reference point.
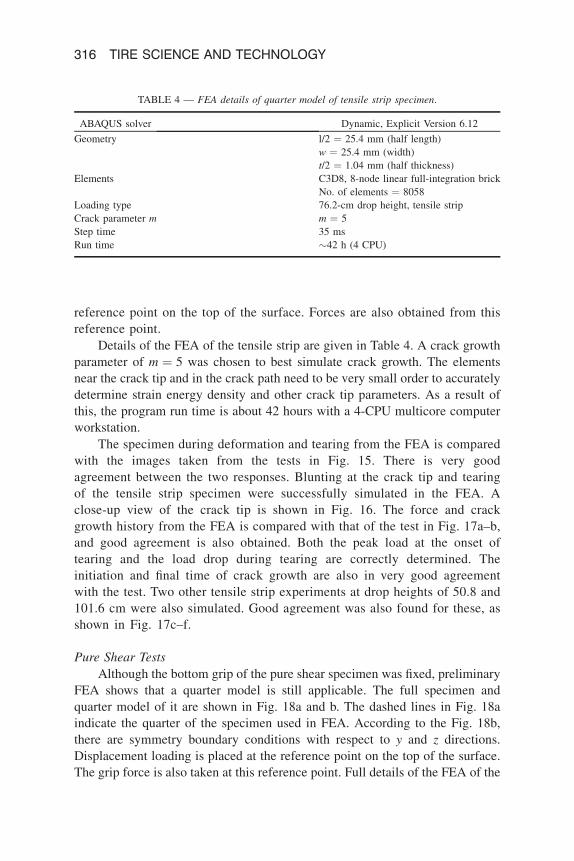
Details of the FEA of the tensile strip are given in Table 4. A crack growth
parameter of m ¼ 5 was chosen to best simulate crack growth. The elementsnear the crack tip and in the crack path need to be very small order to accurately
determine strain energy density and other crack tip parameters. As a result of
this, the program run time is about 42 hours with a 4-CPU multicore computerworkstation.
The specimen during deformation and tearing from the FEA is compared
with the images taken from the tests in Fig. 15. There is very good
agreement between the two responses. Blunting at the crack tip and tearingof the tensile strip specimen were successfully simulated in the FEA. A
close-up view of the crack tip is shown in Fig. 16. The force and crack
growth history from the FEA is compared with that of the test in Fig. 17a–b,and good agreement is also obtained. Both the peak load at the onset of
tearing and the load drop during tearing are correctly determined. Theinitiation and final time of crack growth are also in very good agreement
with the test. Two other tensile strip experiments at drop heights of 50.8 and
101.6 cm were also simulated. Good agreement was also found for these, asshown in Fig. 17c–f.
Pure Shear Tests
Although the bottom grip of the pure shear specimen was fixed, preliminary
FEA shows that a quarter model is still applicable. The full specimen and
quarter model of it are shown in Fig. 18a and b. The dashed lines in Fig. 18aindicate the quarter of the specimen used in FEA. According to the Fig. 18b,
there are symmetry boundary conditions with respect to y and z directions.
Displacement loading is placed at the reference point on the top of the surface.The grip force is also taken at this reference point. Full details of the FEA of the
TABLE 4 — FEA details of quarter model of tensile strip specimen.
ABAQUS solver Dynamic, Explicit Version 6.12
Geometry l/2 ¼ 25.4 mm (half length)
w ¼ 25.4 mm (width)
t/2 ¼ 1.04 mm (half thickness)
Elements C3D8, 8-node linear full-integration brick
No. of elements ¼ 8058
Loading type 76.2-cm drop height, tensile strip
Crack parameter m m ¼ 5
Step time 35 ms
Run time ~42 h (4 CPU)
316 TIRE SCIENCE AND TECHNOLOGY
pure shear specimen are given in Table 5. It was not possible to use a smaller
mesh in this specimen without excessively increasing the computer run time. To
compensate for the larger elements, the critical strain energy density function
was reduced by a factor of 1/11.
The specimen deformation from the FEA is compared with the test results
in Fig. 19. As with the tensile strip, there is very good agreement between the
FEA predicted response and the test images of the pure shear specimen.
Blunting at the crack tip and tearing of the specimen were also successfully
simulated in the pure shear specimen in the FEA. A close-up view of the crack
tip is shown in Fig. 20.
The force and crack growth history from the FEA is compared with that
of the test in Fig. 21a–b, and relatively good agreement is also obtained. The
FIG. 15 — Side-by-side comparison of tensile strip tearing in FEA and test for 76.2-cm drop height.
LI AND HOO FATT ON A COHESIVE ZONE MODEL 317
peak load at the beginning of tearing was determined by the FEA very well,
and the subsequent load drop during tearing was slightly faster in the FEA
than in the test. The corresponding crack speed is faster in the FEA than in
the test. Two other pure shear experiments at drop heights of 50.8 and 101.6
cm were also simulated. The peak load was predicted correctly for a drop
height of 50.8 cm in Fig. 21c, but FEA again predicted faster tearing than
what was reported in the experiment (Fig. 21d). However, very good
agreement in both peak load and crack speed was obtained for the 101.6-cm
drop height in Fig. 21e–f.
Even though the FEA results with coarser mesh for the wider pure shear
specimens were not as accurate as for the tensile strips, they were still able to
capture crack initiation and growth in these specimens relatively well. It should
be emphasized that m¼5 afforded the lowest crack speed in the FEA, and it was
not possible to simulate a slower crack speed in the FEA with this mesh. A finer
mesh could improve crack speed accuracy, but this comes at a cost of increased
program run time.
FIG. 16 — Close-up view of crack tip of tensile strip specimen during test at 76.2-cm drop height.
318 TIRE SCIENCE AND TECHNOLOGY
Conclusions
A CZM for rubber was developed to numerically predict crack growth in a
rubber component under dynamic loading. This CZM consisted of three parts:
(1) hyperviscoelastic behavior before damage, (2) damage initiation based on
the critical strain energy density, and (3) hyperviscoelastic behavior after
damage initiation. The CZM for rubber was embedded into the material
constitutive equation via a user-defined material subroutine (VUMAT) of
ABAQUS Explicit. This allowed crack growth to proceed by element erosion in
the FEA programs without predefining a crack path.
FIG. 17 — Comparisons of force history and crack growth positions in test and FEA for tensile stripexperiments at drop heights (a–b) 76.2 cm, (c–d) 50.8 cm, and (e–f) 101.6 cm.
LI AND HOO FATT ON A COHESIVE ZONE MODEL 319
Results from high-strain-rate material tension tests up to break on 25
phr carbon black–filled NR were used to develop the hyperviscoelastic
constitutive equations and damage initiation. Crack growth in tensile strip
and pure shear fracture specimens made with of the same material were
then simulated in ABAQUS Explicit. The CZM was successfully able to
predict the deformation and crack behavior of these specimens with a very
fine mesh near the crack tip and in the crack path. However, adjustments
on the critical strain energy density for damage initiation were made to
FIG. 18 — FEA model of pure shear specimen: (a) full specimen and (b) quarter model.
TABLE 5 — FEA details of quarter model of pure shear specimen.
ABAQUS solver Dynamic, Explicit Version 6.12
Geometry h/2 ¼ 9.5 mm (half length)
w ¼ 260.0 mm (width)
t/2 ¼ 0.702 mm (half thickness)
Elements C3D8, 8-node linear full-integration brick
No. of elements ¼ 2448
Loading type 76.2-cm drop height, pure shear
Crack parameter m m ¼ 5
Step time 30 ms
Run time 25 h (4 CPU)
320 TIRE SCIENCE AND TECHNOLOGY
FIG. 19 — Side-by-side comparison of pure shear tearing in FEA and test for 76.2-cm drop height.
FIG. 20 — Close-up view of crack tip in pure shear specimen during test at 76.2-cm drop height.
LI AND HOO FATT ON A COHESIVE ZONE MODEL 321
avoid using small elements and long program run times. These adjustmentsdid not affect the overall deformation and crack behavior of thesespecimens.
Acknowledgments
This project was funded by CenTire, an NSF I/UCRC. The authors wouldlike to thank their industry mentors within CenTire, who not only supported thisproject but also provided healthy discussions and advice throughout theresearch.
FIG. 21 — Comparisons of force history and crack growth positions in test and FEA for pure shearexperiments at drop heights of (a–b) 76.2 cm, (b–d) 50.8 cm, and (e–f) 101.6 cm.
322 TIRE SCIENCE AND TECHNOLOGY
References
[1] Griffith, A. A., ‘‘The Theory of Rupture,’’ in Biezeno, C. B., and Burgers, J. M. (eds.), The
Proceeding of the First International Congress for Applied Mechanics, Delft, the Netherlands,
1925, pp. 55–63.
[2] Rivlin, R. S. and Thomas, A. G., ‘‘Rupture of Rubber. I. Characteristic Energy for Tearing,’’
Journal of Polymer Science, Vol. 10, 1953, pp. 291–318.
[3] Thomas, A. G., ‘‘Rupture of Rubber. VI. Further Experiments on the Tear Criterion,’’ Journal
of Applied Polymer Science, Vol. 3, 1960, pp. 168–174.
[4] Gent, A. N., ‘‘Strength of Elastomers,’’ in Mark, J. E., Erman, B., and Eirich, F. R. (eds.),
Science and Technology of Rubber, 3rd ed., Elsevier Academic Press, Boston, 2005, pp. 455–
495.
[5] Previati, G. and Kaliske, M., ‘‘Crack Propagation in Pneumatic Tires: Continuum Mechanics
and Fracture Mechanics Approaches,’’ International Journal of Fatigue, Vol. 37, 2012, pp. 69–
78.
[6] Kroon, M., ‘‘Dynamic Steady-State Analysis of Crack Propagation in Rubber-like Solids
Using an Extended Finite Element Method,’’ Computational Mechanics, Vol. 49, 2012, pp.
73–86.
[7] Sun, C. T. and Jin, Z. H., Fracture Mechanics, Academic Press, Waltham, MA, 2012.
[8] Hillerborg, A., Modeerand, M., and Petersson, E., ‘‘Analysis of Crack Formation and Crack
Growth in Concrete by Means of Fracture Mechanics and Finite Elements,’’ Cement and
Concrete Research, Vol. 6, 1976, pp. 773–782.
[9] Xu, X. P. and Needleman, A., ‘‘Numerical Simulations of Fast Crack Growth in Brittle Solids,’’
Journal of the Mechanics and Physics of Solids, Vol. 42, 1994, pp. 1397–1434.
[10] Planas, J. and Elices, M., ‘‘Nonlinear Fracture of Cohesive Materials,’’ International Journal of
Fracture, Vol. 51, 1991, pp. 139–157.
[11] Rahulkumar, P., Jagota, A., Bennison, S. J., and Saigal, S., ‘‘Cohesive Element Modeling Of
Viscoelastic Fracture: Application to Peel Testing of Polymers,’’ International Journal of
Solids and Structures, Vol. 37, 2000, pp. 1873–1897.
[12] Tijssens, M. G. A., Van Der Giessen, E., and Sluys, L. J., ‘‘Modeling of Crazing Using
Cohesive Surface Methodology,’’ Mechanics of Materials, Vol. 32, 2000, pp. 19–35.
[13] Spanda, M. and Philippe, H. G., ‘‘A Cohesive Model for Fatigue Failure of Polymers,’’
Engineering Fracture Mechanics, Vol. 72, 2005, pp. 691–708.
[14] De Borst, R., Joris, J. C. R., and Needleman, A., ‘‘Mesh-Independent Discrete Numerical
Representations of Cohesive-Zone Models,’’ Engineering Fracture Mechanics, Vol. 73, 2006,
pp. 160–177.
[15] Elmukashfi, E. and Kroon, M., ‘‘Numerical Analysis of Dynamic Crack Propagation in
Rubber,’’ International Journal of Fracture, Vol. 177, 2012, pp. 163–178.
[16] Al-Quraishi, A. A. and Hoo Fatt, M. S., ‘‘Dynamic Fracture of Natural Rubber,’’ Tire Science
and Technology, Vol. 35, 2007, pp. 252–275.
[17] Hoo Fatt, M. S., Chen, L., and Al-Quraishi, A. A., ‘‘Fracture Parameters for Natural Rubber
under Dynamic Loading,’’ Strain, Vol. 47, 2011, pp. 505–518.
[18] Bekar, I., Hoo Fatt, M. S., and Padovan, J., ‘‘Tensile Impact Apparatus,’’ U.S. Patent 7-320-
242, January 22, 2008.
[19] Kuhn, H. and Medlin, D., ‘‘ASM Handbook Mechanical Testing and Evaluation,’’ Materials
Park, Vol. 8, 2001.
LI AND HOO FATT ON A COHESIVE ZONE MODEL 323
[20] Mullins, L., ‘‘Softening of Rubber by Deformation,’’ Rubber Chemistry and Technology, Vol.
42, 1969, pp. 339–362.
[21] Huber, N. and Tsakmakis, C., ‘‘Finite Deformation Viscoelasticity Laws,’’ Mech. Mater. Vol.
32, 2000, pp. 1–18.
[22] Yeoh, O. H., ‘‘Some Forms of the Strain Energy Function for Rubber,’’ Rubber Chemistry and