Page 1
CGEH Working Paper Series
A Colonial Legacy of African Gender Inequality? Evidence from Christian
Kampala, 1895-2011
Felix Meier zu Selhausen (Utrecht University)
Jacob Weisdorf (University of Southern Denmark, Utrecht University, and CEPR)
July 2014
Working paper no. 60
www.cgeh.nl/working-paper-series/
Page 2
A Colonial Legacy of African Gender Inequality? Evidence from Christian Kampala, 1895-2011
Felix Meier zu Selhausen (Utrecht University)
Jacob Weisdorf (University of Southern Denmark, Utrecht University, and CEPR)
Abstract: The colonial legacy of African underdevelopment is widely debated but hard to document. We use occupational statistics from Protestant marriage registers of historical Kampala to investigate the hypothesis that African gender inequality and female disempowerment are rooted in colonial times. We find that the arrival of Europeans in Uganda ignited a century- long transformation of Kampala involving a gender Kuznets curve. Men rapidly acquired literacy and quickly found their way into white-collar (high-status) employment in the wage economy built by the Europeans. Women took somewhat longer to obtain literacy and considerably longer to enter into white-collar and waged work. This led to increased gender inequality during the first half of the colonial period. But gender inequality gradually declined during the latter half of the colonial era, and after Uganda’s independence in 1962 its level was not significantly different from that of pre-colonial times. Our data support Boserup’s view that gender inequality was rooted in native social norms: daughters of African men who worked in the traditional, informal economy were less well educated, less frequently employed in formal work, and more often subjected to marital gender inequality than daughters of men employed in the modernized, formal economy created by the Europeans.
Keywords: Africa, Church Books, Colonialism, Development, Female Disempowerment, Gender Discrimination, Gender Inequality, Missionaries, Uganda
JEL Codes: N37, J12, J16, N97, O55.
Corresponding author: Jacob Weisdorf, e-mail: [email protected] .
Acknowledgements: We thank Angus Crichton, Dieter von Fintel, Johan Fourie, Ewout Frankema, Leigh Gardener, Jan Kok, Alexander Moradi, Eric Schneider, Gaaitzen de Vries, Jan Luiten van Zanden, and the seminar participants at the universities of Nijmegen, Stellenbosch, Utrecht, Wageningen, as well as conference participants at the African Economic History Workshop (Lund), the 10th Swedish Economic History Meeting (Lund) and the Crossroads in African Studies Conference (Birmingham) for helpful comments and suggestions. We are grateful to the Diocese of Namirembe in Kampala for opening their books for us; to Benard Asiimwe and Christopher Byomukama of Mountains of the Moon University in Uganda for their transcription of the data (sponsored by the University of Southern Denmark); to former Ugandan Minister of Education Prof Edward Rugumayo for helping us code our occupational titles into waged and unwaged work; and to Prof Marco van Leeuwen for coding our occupational titles according to the HISCO/HISCLASS scheme. Jacob Weisdorf’s research was funded by a Marie Curie Intra- European Fellowship (Grant No 300339).
Page 3
2
I"
" " Introduction" "
It! is!well! known! that! SubLSaharan!Africa! has! lagged!behind! the! rest! of! the!world! for!many!
decades,!at! least! since! the!1960s,!when!most!of! today’s!African!states!gained! independence!
from!their!European!colonial!powers.!It!is!not!so!well!known,!however,!for!how!much!longer!
Africa!had!lagged!behind,!and!to!what!extent!colonial!Africa!was!developed,!or!stunted,!by!the!
colonial!powers.!Historical!data!that!might!inform!us!scarcely!exist,!and!the!little!data!that!is!
available!is!often!unreliable!(Jerven!2013).!Empirical!investigations!into!Africa’s!colonial!past!
are!often!limited!to!the!study!of!nationalLlevel!variables,!recorded!long!ago!by!colonial!agents!
who!gave!primacy!to!statistics!regarding!the!colonizer’s!own!activities!(notably!exports!and!
taxes).! Native! Africans! and! the! informal! economy! have! received! little! or! no! attention.!
Missionary! activities! seem! to! have! positively! impacted! on! the! educational! attainments! of!
contemporary!Africans!(Nunn!2014),!but!to!what!extent!colonial!activities!more!broadly!have!
translated! into! human! capital! formation,! labour! market! opportunities,! and! social! mobility!
among!African!men!and!women,!today!and!in!the!past,!remains!an!open!question.!!
!
! Recent! scholarship! has! pointed! to! women’s! lack! of! access! to! education! and! formal!
employment!as!a!barrier!to!African!economic!growth!(Duflo!2012;!World!Bank!2011).!Earlier!
scholarship! has! suggested! that! this! marginalization! of! women! is! rooted! in! colonial! times.!
During! her! numerous! visits! to! Africa! in! the! 1960s,! Ester! Boserup! observed! that! the!
modernized! (formal)! sectors! were! primarily! reserved! for! men,! while! women! were!mainly!
engaged! in! informal! work! (Boserup! 1970).! Boserup! hypothesised! that! a! key! reason! why!
women! were! discouraged! from! entering! into! formal! employment! was! that! African! men!
‘loathed!the!idea!of!their!wives!and!daughters!working!under!the!authority!of!a!foreign!man’!
Page 4
3
(ibid.,!p.!178).!Akyeampong!et!al! (2012,!2013)!have!advanced!Boserup’s!hypothesis! further,!
reasoning!that!since!postLcolonial,!maleLdominated!politics!did! little!to!correct!these!gender!
imbalances,!today’s!marginalization!of!African!women!is!a!legacy!from!colonial!times.!But!the!
lack! of! longLterm! genderLspecific! occupational! information! has! prevented! empirical!
investigations!of!this!hypothesis.!
!
! In!this!paper!we!propose!a!novel!empirical!basis!for!testing!the!hypothesis!that!gender!
inequality!and!female!disempowerment!is!a!legacy!of!colonial!times.!Our!data!come!from!the!
church!books!of!one!of!the!earliest!and!largest!Protestant!parishes!in!SubLSaharan!Africa,!St.!
Paul’s!Cathedral!in!Kampala,!containing!more!than!16,000!historical!marriages.!The!recorded!
statistics! provide! uncharted! access! to! the! educational! and! occupational! performances! of!
Christianized!African!men!and!women!dating!back! to!preLcolonial! times.!Our!sampled!birth!
cohorts!spread!across!four!distinct!eras!of!Ugandan!history:!the!preLmissionary!period!(preL
1877);!the!(intermediate)!preLcolonial!period!(1877L1894);!the!colonial!period!(1894L1962);!
and! the! postLcolonial! period! (postL1962).! The! data! facilitate! an! investigation! of! individual!
performances! and! gender! inequalities! within! five! distinct! areas! of! accomplishment:! (i)!
numeracy! skills;! (ii)! literacy! skills;! (iii)! working! skills;! (iv)! whiteLcollar! (i.e.! highLstatus)!
employment,! and! (v)! formalLsector! (i.e.! waged)! employment.! Our! statistics! also! provide!
insight! into! female! labour! force!participation! rates! across! the! four! eras! of!Ugandan!history!
mentioned!above.!
!
! Our! data! clearly! demonstrate! that! the! arrival! of! missionaries! and! colonial! agents!
dramatically! changed! the! educational! and! occupational! structures! among! the! sampled!
population,! initiating! a! centuryLlong! transformation! of! Kampala! from! an! entirely! rural!
Page 5
4
economy! to! one! of! urban! modernity.! We! find! that! this! transformation! initially! amplified!
gender!inequality!within!those!capacities!that!we!are!able!to!measure,!both!between!cohorts!
of! birth! and! within! marriage.! Our! sampled! men! and! women! both! underwent! a! literacy!
revolution! following! the! arrival! of! the! missionaries,! with! literacy! rates! rising! from! 0%! to!
nearly!100%!within!three!generations.!But!the!literacy!revolution!among!women!came!with!a!
delay! of! about! three! decades! causing! the! gender! gap! in! literacy! to! grow! substantially.!We!
observe!similar!patterns!with!regard!to!female!labour!market!opportunities:!women!took!on!
average!considerably!longer!than!men!to!acquire!working!skills!and!to!enter!into!waged!and!
whiteLcollar!(highLstatus)!work.!But!towards!the!end!of!the!colonial!era,!notably!after!1950,!
women!started!to!catch!up!with!men!within!most!of!these!areas.!Today!the!gender!inequality!
within! the! capacities! that!we! are! able! to! observe! is! either! completely! gone! or! is!miniscule!
compared!to!colonial!times.!
!
! We!also!find!that!social!background,!captured!by!the!occupational!status!of!the!fathers!of!
our! sampled!men! and!women,! played! a! key! role!both! for! the! educational! and!occupational!
performances!of!the!offspring!and!for!their!gender!inequality!within!marriage.!Our!data!show!
that! daughters! of! fathers! engaged! in! the! traditional,! informal! economy! were! less! well!
educated,! less! frequently! employed! in! formal! work,! and! more! often! subjected! to! marital!
gender!inequality!compared!to!the!daughters!of!fathers!employed!in!the!modernized,!formal!
economy!created!by!the!Europeans.!These!findings!lend!support!to!the!Boserupian!notion!that!
female! labour! market! segregation! was! linked! to! African! social! norms.! Our! data! reject! the!
hypothesis,! however,! that! colonial! gender! inequality! in! educational! and! occupational!
opportunities! continued! into! the! postLcolonial! era:! marital! gender! inequality! among! the!
sampled!population!was!not!significantly!different!from!its!preLcolonial! level!at!any!point!in!
Page 6
5
time!following!Uganda’s!independence!in!1962.!Even!Idi!Amin’s!political!regime!of!the!1970s,!
renowned!for!its!campaign!against!women!working!outside!the!household,!had!no!significant!
impact!on!the!gender!inequality!among!our!sampled!couples.!!
!
! Our! paper! proceeds! as! follows! in! order! to! demonstrate! these! findings! in! detail.! After!
providing! a! brief! historical! background! (Section! II),!we! describe! our! data! (Section! III)! and!
illustrating!them!(Section!VI).!Then,!we!present!the!results!of!our!regression!analyses!(Section!
V)!and!conclude!(Section!IV).!
!
II"
Brief"Background"
Before!Uganda!became!a!British!Protectorate!in!1894,!the!Kingdom!of!Buganda,!situated!along!
the!northern!shore!of!Lake!Victoria,!was!a!centralized!state!of!feudal!structures!with!a!kabaka!
(king),! territorial! lordships! (chiefs),! and! a! peasant! class.! The! greater!Mengo! area,! in!which!
today’s! Kampala! is! situated,! was! the! most! densely! populated! region! in! Buganda,! home! to!
some!70,000!bakopi! (peasants).!The!Kingdom!had!engaged! intensively! in! the! trade!of! ivory!
and! slaves! for! cotton! clothe,! beads,! firearms,! and! gunpowder! with! Swahili! and! Arab!
merchants! since! the! 1850s,!with!Kampala! as! the!main! commercial! hub! of! the! region! (Reid!
2002).!!
!
! A!wellLcontrolled! peasant! population,! the! fertile! soil! of! the! surrounding! area,! and! the!
tradition!of!trade!made!Kampala!the!principal!‘node’!of!the!British!Protectorate!and!thus!the!
location!from!which!both!Christian!missionaries!and!British!(indirect)!rule!spread.!Unlike!its!
neighbouring! country! Kenya,! Uganda! was! not! a! settler! economy! and! its! land! remained! in!
Page 7
6
possession! of! the! Ugandans.! Instead,! the! British! colonial! authority! introduced! a! cash! crop!
economy! (mainly! cotton! and! coffee)! based! on! indigenous! responses! to! commercial!
opportunities!and!accompanied!by!colonial!tax!obligations.!!
!
! The!first!urban!planning!of!Kampala!(and!its!then!close!to!3,000!citizens)!came!in!1912.!
Kampala! remained! a! moderateLsized! town! with! around! 25,000! residents! in! the! 1940s!
growing!to!reach!some!50,000!residents!around!the!time!of!Uganda’s!independence!in!1962.!
After! independence!Kampala!grew!considerably,! first! to!352,000! residents! in!1969,! then! to!
774,241!in!1991.!Today!Kampala!has!a!population!of!over!1.5!million!(McMaster!et!al!1975;!
OmoloLOkalebo!et!al!2010).!!
!
! Christianity! is!by!far!the!most!popular!religion!in!Kampala,!with!nine!out!of!ten!adults!
being! declared! as! Christians! in! 2002! (UBOS! 2006).!Hastings! (1994,! p.! 464)! has! said! of! the!
Kingdom!of!Buganda! that! ‘there!was!both! largeLscale! conversion! to!Christianity! in! the!preL
colonial!era!and!a!mass!conversion!movement!within!the!early!colonial!age.’!The!spread!of!the!
gospel! in! Buganda!was! faster! than! in! other! regions! of! Uganda! (Oliver,! 1952;! Taylor! 1958;!
Ward!1999;!Meier!zu!Selhausen!2014).!Mission!statistics!from!the!colonial!Blue!Books!of!the!
Protectorate! of! Uganda! confirm! this! ‘explosive’! indigenous! reception! of! Christianity.! The!
share!of!Christian!affiliates!among!the!population!of!Buganda!grew!from!23%!in!1910!to!74%!
in!1959,!and!Buganda!had!the!highest!total!number!of!mission!school!enrolments!in!the!whole!
of!British!Africa!in!1938!(Frankema!2012).!!
!
" "
Page 8
7
III""
Data"
Our! data! comes! from! the! earliest! and! largest! Christian! missionary! station! in! Uganda:! the!
Anglican! Church! Diocese! of! Namirembe,! established! in! 1890! and! situated! in! Kampala.! The!
Diocese’s!original!barn!church,!housing!3,000!people,!was!destroyed!during!a!thunderstorm!
in! 1894! (Moon! 1994).! The! church’s! fastLgrowing! popularity! inspired! the! construction! of! a!
new!church! in!1895!with!a!seating!capacity!of!4,000.!This!event!marks!the!starting!point!of!
our!marriage!register!series,!which!ends!in!2011.!The!series!is!complete!apart!from!the!books!
covering!the!years!1900L1907,!which!were!lost!after!lightening!set!fire!to!the!thatched!roof!of!
the! church! in! 1910.! Following! the! fire,! the! current! St.! Paul’s! Cathedral! was! constructed!
between!1915!and!1919.!This!was!the!largest!house!of!God!in!subLSaharan!Africa!at!the!time,!
where!thousands!of!Christian!affiliates!gathered!every!Sunday!(Hastings!1994;!Taylor!1958).!!
!
! Our! marriage! registers! contain! some! key! vital! statistics! regarding! our! sampled!
population!at!the!time!of!their!marriage.!These!include!the!names!of!each!of!the!spouses,!their!
age! at! marriage,! their! civil! status,! their! occupational! title,! the! occupational! title! of! their!
fathers,! and! their! place! of! residence.! Information! about! literacy! can! be! inferred! from! their!
signatures!on!the!marriage!certificate:!if!a!spouse!was!unable!to!write!down!his!or!her!name,!
the!vicar!would!do!so,!and!the!illiterate!spouse!would!then!make!a!mark!to!verify!his!or!her!
consent.! While! signature! literacy! is,! of! course,! an! imperfect! measure! of! someone’s! actual!
literacy!achievement,!previous!work!has!shown!that!signature! literacy! is!a! reasonably!good!
proxy!for!someone’s!general!ability!to!read!and!write!(Schofield!1973;!Clark!2007).!
!
Page 9
8
! The! detailed! and! systematic! recordLkeeping! of! the! Anglican! missionaries! (as! well! as!
their! native! successors)! not! only! make! our! data! a! novel! empirical! basis! in! the! context! of!
African!economic!history,!but!also!constitute!an!excellent!source!of!information!for!studying!
the!impact!of!missionaries!and!colonizers!on!the!educational!and!occupational!opportunities!
of!native!Africans.2!One!of!its!key!advantages!is!that!Anglican!missionaries!followed!the!same!
procedure!as! their!BritishLbased!colleagues:!even!our!earliest!registers,! from!the!1890s,!are!
written!in!English!on!standardised!forms,!preLprinted!in!London,!and!are!completely!identical!
to!those!used!by!parish!ministers!in!Britain.!!
!
Anglican! missionaries! were! not! the! only! Christian! missionaries! in! Uganda.! Other!
missionary! societies,! such! as! the!White! Fathers,! the!Mill! Hill! Missionaries,! and! the! Verona!
Fathers,! operated! in! the! region! as! well.! Statistics! from! the! Colonial! Blue! Books! of! the!
Protectorate! of! Uganda! report! that! roughly! two! thirds! of! all! Christian! marriages! in! early!
twentiethLcentury! Uganda! were! Catholic! marriages! (Meier! zu! Selhausen! 2014).! Catholic!
missionaries! did! not,! however,! follow! the! tradition! of! their! Protestant! counterparts! of!
recording!the!occupational!titles!of!the!spouses.!This!makes!a!comparison!of!the!occupational!
performances! between! Catholics! and! Protestants! impossible.! Although! Woodberry! and!
Gallego!(2010)!and!Nunn!(2014)!have!shown!that!contemporary!African!Protestant!women!
are!better!educated!than!their!Catholic!counterparts!(vice!versa!for!men)!geography!appears!
to!predict! educational! achievements! far!better! than! religious! affiliation! in!our! case.! Indeed,!!!!!!!!!!!!!!!!!!!!!!!!!!!!!!!!!!!!!!!!!!!!!!!!!!!!!!!!!2!Thornton!(1977)!has!used!vital! information!from!African!parish!registers!to!estimate!the!population!of!17thLcentury!Congo!by!combining!the!statistics!of!native!baptisms!from!missionary!stations!with!a!reconstruction!of!the!nation’s!age!structure.!Similarly,!Katzenellenbogen!et!al!(1993)!have!assessed!the!changes!in!mortality!at!the!Western!Cape! of! South!Africa! based! on! records! of! the!Moravian!Church! for! cohorts! between!1837! and!1909.!Notkola!and!Siiskonen!(2000)!and!Notkola!et!al.!(2000)!have!studied!fertility,!mortality,!and!migration!in!north!Namibia! using! parish! registers! of! the! EvangelicLLutheran! Church! between! 1925! and! 1990.! More! recently,!Walters! (2008)!has!used!Catholic!parish! registers! for! the!Mwanza! region! in!northern!Tanzania! to! reconstruct!historical! families! since! 1890.!None! of! these!works,! however,! have! sought! to! use! educational! or! occupational!information!from!African!parish!registers!for!the!purpose!of!studying!the!economic!history!of!Africa.!
Page 10
9
our!sampled!Protestants! look!much!more!like!their!urban!colleagues,!regardless!of!religious!
affiliation,!than!their!religious!equals!in!rural!Uganda!(see!our!discussion!below).!
!
Figure"1"The!Frequency!of!the!Sampled!Individuals!by!Sex!and!Year!of!Birth!
"
!
! Our!data! include!16,783!marriages! taking!place!between!1895!and!2011.! Some!of! the!
marriage!records!were!incomplete!and!hence!excluded!from!the!sample.!Records!missing!the!
spousal! signature! information! (0.1%)! and! records! where! neither! of! the! spouses! had! an!
occupation! recorded! (2%)! were! removed! from! the! sample.! We! kept! those! marriages,!
however,! where! only! the! groom! was! recorded! to! have! held! an! occupation! (12%)! on! the!
assumption!that!the!bride!was!a!housewife.!The!implication!of!this!is!discussed!below.!Finally,!
in!some!of!the!recorded!marriages,!mainly!during!the!1930s,!the!spousal!ages!were!replaced!
by!the!terms!‘Minor’!or! ‘Full’!(14%).!This!signified!whether!or!not!a!spouse!had!reached!the!
Inde
pend
ence
Col
oniz
atio
n
Mis
sion
arie
s
010
020
030
040
0N
umbe
r of S
ampl
ed In
divi
dual
s
1850
1860
1870
1880
1890
1900
1910
1920
1930
1940
1950
1960
1970
1980
1990
Year of Birth
Men Women
Page 11
10
age! of! 21.! These! records! are! included! only! when! we! study! the! sampled! population’s!
occupational! structure,! but! for! obvious! reasons! the! records! are! excluded! when! we! study!
cohorts!of!birth.!
!
! One! more! data! limitation! is! necessary! due! to! the! prevalence! of! polygamy! in! Uganda!
(Anderson! 2007).! Polygamy! (multiple! marriages)! may! create! a! bias! in! our! sample.! For!
example,!if!workers!with!highLstatus!jobs!take!more!wives!than!workers!with!lowLstatus!jobs,!
than!highLstatus!workers!will!be!overLrepresented!in!the!sample.!Worse!still,!the!propensity!
towards! polygamy!may! change! over! time,! thus! changing! the! bias! of! the! sample! across! the!
period!of!observation.!Interestingly,!besides!those!listed!as!widow(er)s,!which!we!remove!to!
avoid!individual!overLrepresentation!(0.4%),!there!are!no!records!of!individuals!reLmarrying!
in! our! data:! all! remaining! spouses! were! recorded! as! either! ‘bachelor’! or! ‘spinster’.! This! is!
consistent!with! the!proscription!of! the!Anglican!Church!against!polygamy!and!supports! the!
Church’s!emphasis!on!the!building!of!nuclear! families!(Hastings!1973).! It!does!not! imply,!of!
course,!that!polygamy!did!not!take!place!at!all!among!our!sampled!individuals.!Many!Ugandan!
couples! celebrated! a! customary! wedding! prior! to! marrying! in! the! Christian! faith! (Hansen!
1984).!The!flipside!of!this!is!that!the!Christian!Church!could!not!prevent!their!affiliates!from!
engaging! in! several! customary!marriages! following! the! Christian!marriage,! a! practice! often!
observed!among! local!chiefs! (Hastings!1973).!Since!such!behaviour!does!not!appear! to!bias!
our!sample,!however,!polygamy!of!this!sort!will!not!have!any!bearing!on!our!results.!
! !
Page 12
11
Table"1"Summary!Statistics!
!!! !! !! !! !! !!
! !Men! Women!
Variable! Obs! Mean! St.dev.! Mean! St.dev.!!! !! !! !! !! !!
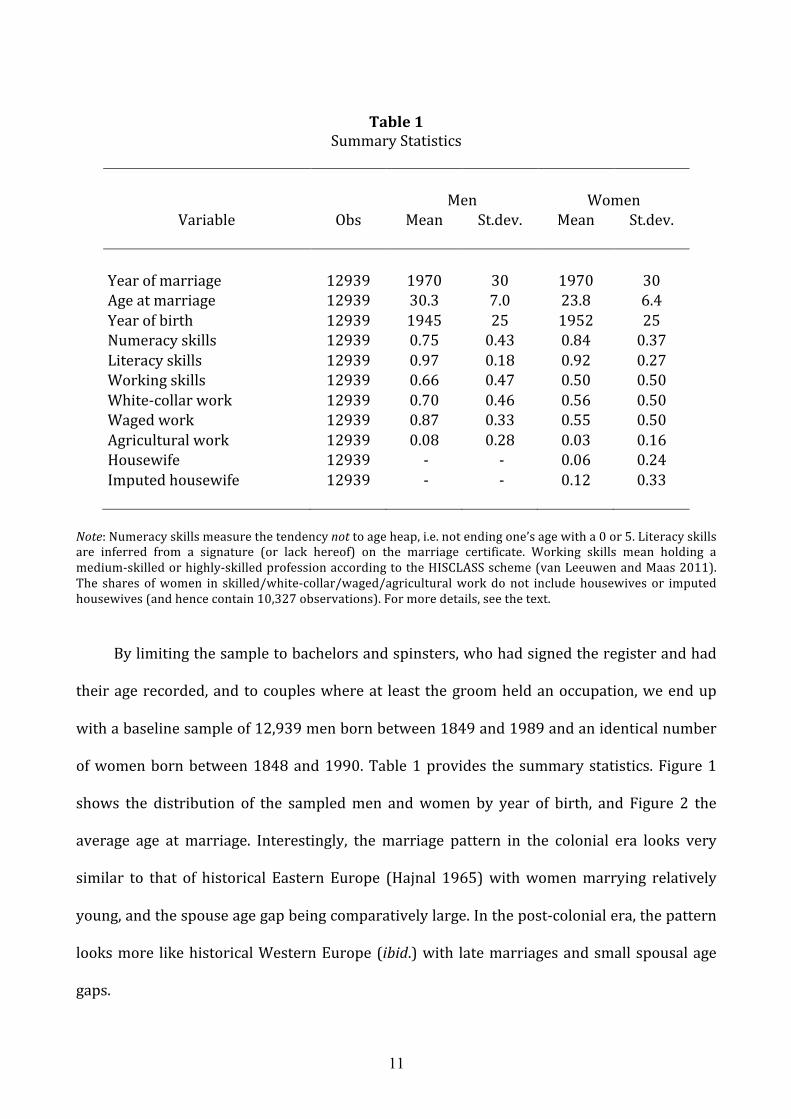
! ! ! ! ! !Year!of!marriage! 12939! 1970! 30! 1970! 30!Age!at!marriage! 12939! 30.3! 7.0! 23.8! 6.4!Year!of!birth! 12939! 1945! 25! 1952! 25!Numeracy!skills! 12939! 0.75! 0.43! 0.84! 0.37!Literacy!skills! 12939! 0.97! 0.18! 0.92! 0.27!Working!skills! 12939! 0.66! 0.47! 0.50! 0.50!WhiteLcollar!work! 12939! 0.70! 0.46! 0.56! 0.50!Waged!work! 12939! 0.87! 0.33! 0.55! 0.50!Agricultural!work! 12939! 0.08! 0.28! 0.03! 0.16!Housewife! 12939! !L! !L! 0.06! 0.24!Imputed!housewife! 12939! !L! !L! 0.12! 0.33!!! !! !! !! !! !!!
Note:!Numeracy!skills!measure!the!tendency!not!to!age!heap,!i.e.!not!ending!one’s!age!with!a!0!or!5.!Literacy!skills!are! inferred! from! a! signature! (or! lack! hereof)! on! the! marriage! certificate.! Working! skills! mean! holding! a!mediumLskilled!or!highlyLskilled!profession!according!to!the!HISCLASS!scheme!(van!Leeuwen!and!Maas!2011).!The! shares! of!women! in! skilled/whiteLcollar/waged/agricultural!work!do!not! include!housewives!or! imputed!housewives!(and!hence!contain!10,327!observations).!For!more!details,!see!the!text.!!
! By!limiting!the!sample!to!bachelors!and!spinsters,!who!had!signed!the!register!and!had!
their!age!recorded,!and! to!couples!where!at! least! the!groom!held!an!occupation,!we!end!up!
with!a!baseline!sample!of!12,939!men!born!between!1849!and!1989!and!an!identical!number!
of!women!born!between!1848!and!1990.!Table!1!provides! the! summary!statistics.!Figure!1!
shows! the! distribution! of! the! sampled!men! and!women! by! year! of! birth,! and! Figure! 2! the!
average! age! at!marriage.! Interestingly,! the!marriage! pattern! in! the! colonial! era! looks! very!
similar! to! that! of! historical! Eastern! Europe! (Hajnal! 1965)!with!women!marrying! relatively!
young,!and!the!spouse!age!gap!being!comparatively!large.!In!the!postLcolonial!era,!the!pattern!
looks!more! like!historical!Western!Europe!(ibid.)!with! late!marriages!and!small!spousal!age!
gaps.!
Page 13
12
Figure"2"Mean!Age!at!Marriage!by!Sex!
!
!
!
Note:!The!graph!shows!the!average!age!at!marriage!apart!from!those!individuals!whose!age!at!marriage!was!replaced!by!the!terms!‘Minor’!or!‘Full’!are!excluded!from!the!graph!(see!text).!
!
! A! good! question! is! to! what! extent! our! sampled! population! represent! the! actual!
population! of! Kampala.!While! we! cannot! answer! this! for! the! colonial! period,! a! population!
census! conducted! in! 2002! by! the! Ugandan! Statistical! Office! (UBOS! 2006)! enables! us! to!
compare!the!population!living!in!Kampala!today!with!those!from!our!sampled!population.!To!
this!end,!we!restrict!both!datasets!to!include!cohorts!of!births!aged!20!to!60!in!2002!and,!for!
the!census!data,!to!those!whose!civil!status!was!‘married’!or!‘widow’/’widower’.!!
! !
Inde
pend
ence
1520
2530
35M
ean
Age
at M
arria
ge
1910
1920
1930
1940
1950
1960
1970
1980
1990
2000
2010
Year of Marriage
Men Women
Page 14
13
Table"2"Shares!of!Literate!and!Skilled!workers,!by!Sex!
!!! Literate! Skilled!
Sample! Males! Females! Males! Females!!! !! !! !! !!
Uganda,!all! 77%! 53%! 43%! 24%!Uganda,!Anglicans! 79%! 56%! 45%! 26%!Kampala,!all! 96%! 91%! 86%! 76%!Kampala,!Anglicans! 96%! 92%! 83%! 72%!Marriage!sample! 100%! 99%! 77%! 58%!
!! !! !! !! !!!
Note:! Skilled! individuals! in! the! census! data! are! individuals! with! more! than! six! years! of! schooling.! Skilled!individuals!in!the!marriage!sample!are!workers!holding!occupations!that!are!coded!mediumL!or!higherLskilled!in!the!HISCLASS!scheme!(van!Leeuwen!and!Maas!2011).!Source:!2002!Census!Data!for!Kampala!and!Uganda!(UBOS!2006).!Marriage!sample:!see!text.!!
!! Table!2!reports!the!literacy!rates!for!the!sampled!men!and!women.!Among!our!marriage!
register!population,!the!literacy!rates!are!100%!for!men!and!99%!for!women.!Among!Anglican!
Protestants! living! in!Kampala! they!are!96%! for!men!and!92%! for!women.!The!discrepancy!
could!be!due!to!the!fact!that!signature!literacy!is!an!imperfect!measure!of!actual!literacy.!The!
literature!rates!among!all!Ugandans!–!77%!for!men!and!53%!for!women!–!demonstrate!that!
individuals!living!in!Kampala!are!far!more!literate!than!the!average!Ugandan.!Notably,!this!is!
not!a!matter!of!religion:!Anglican!Protestants!in!Uganda!as!a!whole!includes!79%!literate!men!
and!56%!literate!women.!!
!
! The! census!data! report! years! of! schooling,! information! that! the!marriage! registers! do!
not! include.! Conversely,! our! marriage! registers! report! occupational! titles,! which! are! not!
available!in!the!census!data.!It!is!possible,!under!sensible!assumptions,!to!transform!the!two!
different! variables! into! an! analogous!measure.! To! this! end,!we! use! the! soLcalled!HISCLASS!
scheme!to!code!our!occupational!titles!into!‘skilled’!and!‘unskilled’!workers!(see!van!Leeuwen!
Page 15
14
and!Maas!2011).!‘Skilled’!workers!include!highlyL!or!mediumLskilled!professions!in!HISCLASS,!
while!‘unskilled’!workers!include!lowerL!or!unskilled!professions.!To!give!two!examples!from!
the! data,! a! teacher! is! classified! as! a! skilled! worker,! and! a! matmaker! is! classified! as! an!
unskilled! worker.! Next,! we! coded! those! individuals! in! the! census! population! that! had!
completed! their! primary! education,! i.e.! had! more! than! six! years! of! schooling,! as! ‘skilled’!
workers,! and! those! individuals!with! less! than! six! years! of! schooling! as! ‘unskilled’!workers.!
Table!2!show!the!results.!In!the!marriage!register,!77%!males!and!58%!females!are!classified!
as!skilled!workers.!Among!Kampala!Anglicans,!83%!males!and!72%!females!are!classified!as!
skilled.!The!numbers!for!the!entire!Kampala!population!(i.e.!regardless!of!religious!affiliation)!
are!86%!skilled!males! and!76%!skilled! females.!Among! average!Ugandans,! 45%!males! and!
25%!females!are!skilled.!
!
! We!think!the!performance!of!our!sampled!population!is!slightly!worse!than!that!of!their!
Kampala!counterparts!for!two!reasons!other!than!measurement!error.!The!first!is!that!not!all!
of!our!individuals!live!in!Kampala.!Our!regression!analysis!below!shows!that!grooms!residing!
outside! a! radius! of! 10! km! from! the! centre! of! Kampala! (roughly! 40%! of! all! males)!
underperform! in! terms! of! educational! and! occupational! achievements! compared! with!
Kampala! dwellers.! Another! factor! that! would! downwardLbias! the! skill! performance! of! our!
individuals!is!that!we!catch!them!on!average!earlier!in!life!(i.e.!at!the!time!of!their!marriage)!
compared! to! those! of! the! census! registers! (caught!when! the! census!was! conducted,!which!
could!be!early!or!late!in!life).!Nonetheless,!the!modest!discrepancies!in!the!skill!performances!
between!the!census!population!and!the!population!of!our!marriage!registers!do!not!deny!the!
fact! that! our! sample! is! a! fairly! good! representation! of! Kampala! individuals! (regardless! of!
religious!affiliation).!
Page 16
15
IV"
Graphic"Analysis"
This!section!is!devoted!to!illustrating!the!evolution,!from!the!preLcolonial!times!until!today,!in!
the!educational!and!occupational!performances!of!our!sampled!men!and!women,!as!well!as!
the!gender! inequality!between! them.!We!are!able! to!measure! individual!performances! (and!
gender! inequalities)! within! five! distinct! areas! of! achievement:! literacy,! numeracy,! working!
skill,! working! status! (blue! vs.! whiteLcollar! work),! and! formality! of! the! work! (waged! or!
unwaged).!!
!
! Figure! 3! illustrates! the! literacy! rates! by! sex! for! cohorts! of! birth! at! the! age! of! 20.!Not!
surprisingly,! literacy! was! virtually! nonLexistent! prior! to! the! arrival! of! the! missionaries! in!
1877,! after! which! it! rapidly! spread! first! to! men! and! later! women.! Virtually! all! males! had!
attained! literacy!within! less! than! three! generations! after! the! first!missionaries! arrived! and!
virtually!all!women!within!three!decades!later!by!the!1940s.!Since!basic!schooling!up!until!the!
1950s!was!almost!exclusively!provided!by!missionaries!(Etherington!2005;!Frankema!2012),!
the!graph!shows!the!immense!impact!of!missionary!activities!on!the!literacy!skills!among!our!
sampled!population.!The!time!lapse!between!men!and!women’s!literacy!achievements!in!the!
period! following! the! arrival! of! missionaries! caused! gender! inequality! in! literacy! to! rise!
dramatically.!But!since!women!gradually!caught!up!with!men!during!the!colonial!era,!gender!
inequality!in!literacy!had!practically!disappeared!by!the!midL20th!century.!
! !
Page 17
16
Figure"3!Literacy!Rates!by!Sex!
!
Note:!The!graph!shows!the!literacy!rates!by!birth!cohorts!20!years!from!birth.!Literacy!is!inferred!from!the!spousal!signature!(or!lack!thereof)!on!the!marriage!certificate.!The!dotted!lines!illustrate!the!literacy!rates!among!men!and!women!marrying!after!the!age!of!25.!!
!
! One! explanation! for! women’s! delay! in! attaining! literacy! could! be! to! do! with! ageL
structure!effects.!Women!married!relatively!young!during! the!colonial!period!(Figure!2),!on!
average!around!the!age!of!18.!Men!married!later,!around!the!age!of!25.!If!literacy!(contrary!to!
what!we! expect)! was! attained! between! the! ages! of! 18! and! 25,! then! this! could! explain! the!
lapse.!But!when!we!control!for!this!by!limiting!the!sample!to!those!who!marry!beyond!the!age!
of!25! (in! colonial! times! this!was! roughly!10%!of!our! sampled!population),! then! it!becomes!
clear!that!ageLstructure!effects!do!not!explain!the!delay!(the!dotted!lines!of!Figure!3).!!
!
" "
Inde
pend
ence
Col
oniz
atio
n
Mis
sion
arie
s
0.2
.4.6
.81
Lite
racy
Rat
es
1870
1880
1890
1900
1910
1920
1930
1940
1950
1960
1970
1980
1990
2000
2010
Year at Age 20
Men (All) Men (>25)Women (All) Women (>25)
Page 18
17
Figure"4!Whipple’s!Index!for!Numeracy!by!Sex!
!
Note:!The!Whipple’s! Index!Score! is!obtained!by!summing!the!number!of! individuals! in!the!age!range!23!and! 62! inclusive,! who! report! ages! ending! in! 0! and! 5,! dividing! that! sum! by! the! number! of! individuals!between!ages!23!and!62!years!inclusive,!and!multiplying!the!result!by!5.!
!
! Turning! to! numeracy! skills,!we! can!use! the! fact! that! spousal! age!was! selfLreported! to!
study!the!prevalence!of!age!heaping!in!our!sample,!captured!by!the!tendency!to!end!one’s!age!
with! a! 0! or! 5! (Shryock! and! Siegel! 1976).! AgeLheaping! behaviour! is! not!widespread! in! our!
population:! the! overall! imprecision! in! age! reporting,! measured! by! the! Whipple! index,3!is!
0.9%,!which! is!commonly!considered!to!be!highly!accurate!(Robine!et!al!2007).!This!means!
our! sampled! individuals! are! comparatively!numerate! relative! to!other!populations! living! in!
developing! regions! in! this! period! (Crayen! and! Baten! 2010).! Figure! 4! demonstrates! the!
Whipple!Index!by!sex,!revealing!that!age!heaping!was!more!prevalent!among!men!than!among!
!!!!!!!!!!!!!!!!!!!!!!!!!!!!!!!!!!!!!!!!!!!!!!!!!!!!!!!!3!The!Whipple! Index! reports! the! sum!of! individuals! in! the! age! range! of! 23! and!62! inclusive,!who! report! ages!ending! in! 0! and! 5,! divided! by! the! number! of! individuals! between! the! ages! of! 23! and! 62! years! inclusive,! and!multiplied!by!5.!
Inde
pend
ence
Col
oniz
atio
n
Mis
sion
arie
s
01
23
4W
hipp
le's
Inde
x
1870
1880
1890
1900
1910
1920
1930
1940
1950
1960
1970
1980
1990
2000
2010
Year at Age 20
Men Women
Page 19
18
women!across!the!entire!period!of!observation.!The!graph!also!shows!a!gradual!improvement!
over!time!in!average!numeracy!skills,!including!a!large!decline!in!age!heaping!in!the!decades!
following!the!arrival!of!missionaries.4!
!
! The! rise! in! literacy! and! numeracy! skills! following! the! arrival! of! the! missionaries! no!
doubt! helped! the! acquisition! of!more! substantial! human! capital! attainments.! This! is! not! to!
deny!that!knowledge!accumulation!took!place!in!the!preLcolonial!era.!PreLcolonial!education!
was!built!on! learningLbyLdoing!and! interLgenerational! transmissions!of!oral! traditions!(Iliffe!
2007).!But!those!traditional!skills!were!arguably!of!limited!use!in!the!technicallyLversed!wage!
economy! that! emerged!with! the!Europeans! and! emphasised! the! importance!of! literacy! and!
numeracy!skills.!
!
! Literacy! and! numeracy! skills! are! of! course! rather! crude! proxies! for! human! capital!
achievements.!More!extensive!knowledge!about!human!capital!formation!among!our!sampled!
individuals! can! be! derived! from! their! occupational! titles.! The! HISCO/HISCLASS! schemes!
already!mentioned!provide!useful!tools!for!this.!The!HISCO!scheme!classifies!several!thousand!
historical! occupations! from! across! the! world! by! the! nature! of! the! work! conducted! (van!
Leeuwen!et!al!2002).!The!HISCLASS!scheme!ranks!all!the!occupations!listed!in!the!HISCO!by!
the!social!status!of!the!work!(blueL!versus!whiteLcollar!work)!and!by!the!skill!requirements!of!
the!work!described!by!the!occupational!title!(van!Leeuwen!and!Maas!2011).5!Tables!A1!and!
A2! in! the! Appendix! list! the! most! common! occupational! titles! in! our! sample,! by! decade,!
!!!!!!!!!!!!!!!!!!!!!!!!!!!!!!!!!!!!!!!!!!!!!!!!!!!!!!!!4!There!is!no!apparent!reason!why!age!heaping!increases!among!men!towards!the!end!of!our!period.!5!We!are!grateful!to!Prof!Marco!van!Leeuwen,!the!creator!of!the!HISCO!scheme,!for!annexing!our!Ugandan!data!into!HISCO/HISCLASS,!enabling!us!to!extract!information!about!the!working!skills!of!our!sampled!population.!In!those! rare! cases! where! the! HISCO/HISCLASS! schemes! do! not! contain! our! occupational! titles! (such! as! ‘witch!doctor’)!we!have!made!individuals!assessments!aided!by!local!labour!historians.!
Page 20
19
showing!how!these!titles!were!coded!in!HISCLASS!concerning!blueL!and!whiteLcollar!work,!as!
well! as! skilled! and!unskilled!work.! It! also! shows! the!main! sector! of! activity! (agriculture! or!
not).!
"
Figure"5!Distribution!of!Occupations!by!Social!Class,!Men!
!
Note:! The! distribution! of! occupations! into! the! social! groups! follows! the! HISCLASS! scheme! (van!Leeuwen!and!Maas!2011).!Data:!see!text.!
!
! Building! on! the! HISCLASS! classification,! Figures! 5! and! 6! illustrate! the! distribution! of!
occupations!of!men!and!women!by!social!group.!It!follows!that!Kampala!was!almost!entirely!
dominated! by! agricultural! activities! (black)!when!Uganda! became! a! British! Protectorate! in!
1894:!practically!all!our!sampled!males!were!recorded!as!‘Peasant’!or!‘Farmer’!(Table!A1).!In!
the! decade! following! the! arrival! of! the! British! colonizers! (i.e.! 1900L09)! Kampala! (as!
represented!by!our!sample)!had!already!undergone!a!dramatic!transformation.!Skilled,!nonL
0%#
20%#
40%#
60%#
80%#
100%#
1895+99#
1900+09#
1910+19#
1920+29#
1930+39#
1940+49#
1950+59#
1960+69#
1970+79#
1980+89#
1990+99#
2000+11#
Non+manual# Unskilled#manual# Skilled#manual# Farmer#and#farm#workers#
Page 21
20
agricultural,! blueLcollar! work! (light! grey)! had! increased! substantially! among! men,! with!
occupations! like! ‘Carpenter’! and! ‘Tailor’! starting! to! appear! (Figure! 5).! WhiteLcollar! work!
(white)!also!grew,!from!1%!to!a!staggering!20%!in!the!first!decade!of!the!20th!century,!with!
jobs!such!as!‘Clerk’,!‘Teacher’,!and!‘Trader’!now!emerging.!WhiteLcollar!work!for!men!became!
generally!more! common! during! the! colonial! era:! by! the! time! of! Uganda’s! independence,! in!
1962,! nearly! four! in! five! males! were! employed! in! whiteLcollar! jobs.! The! occupational!
structure!for!women!also!changed!dramatically!following!the!colonization!of!Uganda!(Figure!
6).!But!while!men!chiefly!ventured!into!skilled!and!whileLcollar!work!during!the!colonial!era,!
women’s!work!was!initially!dominated!by!manual!labour,!first!unskilled!(dark!grey)!and!later!
skilled! (light! grey)!work.!Notably,! less! than!20%!of!our! sampled!women!were!employed! in!
whiteLcollar!(highLstatus)!work!toward!the!end!of!the!colonial!era,!against!80%!of!all!men.!
!
! The!drastic!changes! in! the!occupational!structures!among!men!and!women!after!1900!
deserve! a! comment.! It! needs! to! be! kept! in!mind! that! the! church! books! covering! the! years!
1900L1907!were!lost,!meaning!that!the!decade!1900L1909!effectively!only!concerns!the!years!
1908L09.!That!in!turn!means!the!transition!was!probably!slightly!less!radical!than!Figures!5!
and!6!indicate.!The!structural!changes!could!of!course!also!reflect!an!adjustment!in!the!way!
that! the!missionaries!recorded!occupational! titles.!Or! they!could!reflect! the! fact! that!British!
colonial!taxes!had!to!be!paid!in!cash!and!by!males!only,!hence!forcing!the!native!African!men!
to!seek!waged!employment.!This!would!certainly!help!explain!why! job!titles!such!as! ‘Clerk’,!
‘Carpenter’,!‘Trader’,!and!‘Teacher’!emerge!among!men!during!this!period.!!
!
" "
Page 22
21
Figure"6"Distribution!of!Occupations!by!Social!Class,!Women!
!
Note:!The!distribution!of!occupations!into!social!class!follows!the!HISCLASS!scheme!(van!Leeuwen!and!Maas!2011).!Housewives!and!imputed!housewives!were!excluded!from!the!sample.!The!decade!1900L09!effectively!only!includes!the!years!1908L09.!
!
! Female! labour!market!participation! rates! can!also!be! studied!using!our!data.! Figure!7!
shows!the!evolution!in!the!share!of!women!recorded!with!an!actual!occupational!title!(white).!
Women!recorded!as! ‘housewife’! (dark!grey),!or!who!had!no! title!recorded!at!all,! i.e.!our!soL
called! ‘imputed’! housewives! (black),! were! very! likely! working! in! agriculture! at! home! or!
contributing!to!the!household!income!by!‘working!on!their!own!account!in!bazaar!or!service!
occupations’,! as! Boserup! (1970,! p.! 178)! phrases! it.! So! the! radical! changes! in! women’s!
occupational! structure! after! 1900! (Figure!6)! could! reflect! a! new!practice! among!women!of!
now! reporting! their! byLoccupation.! After! largely! disappearing! during! the! colonial! period,!
housewives! (imputed! and! actual)! reLemerge! following! Uganda’s! independence.! Their!
0%!
20%!
40%!
60%!
80%!
100%!1895L99!
1900L09!
1910L19!
1920L29!
1930L39!
1940L49!
1950L59!
1960L69!
1970L79!
1980L89!
1990L99!
2000L11!
NonLmanual! Unskilled!manual! Skilled!manual! Farmer!and!farm!workers!
Page 23
22
frequency!peaked!in!the!1970s,!with!nearly!50%!of!all!women!appearing! in!the!registers!as!
housewife! or! imputed! housewife.! This,! interestingly,! coincides! with! Idi! Amin’s! notorious!
campaign! against! women! working! outside! the! household,! a! telling! tale! that! postLcolonial!
policy! may! have! had! temporary! gender! effects! (Kyomuhendo! and! McIntosh! 2006).! Our!
regression!analysis!below!sheds!further!light!on!that!question.!
!
Figure"7"Women’s!Labour!Market!Participation!Rates!by!Decade!
!
Note:!“Housewife”!(in!citation!marks)!means!the!occupation!was!imputed!from!the!fact!that!the!bride!had!no!occupation!recorded!while!the!groom!did!(see!text).!The!decade!1900L09!effectively!only!includes!the!years!1908L09.!
!
! The! coding! of! our! occupations! using! HISCLASS! affords! us! a! deeper! look! into! the!
gendered! evolution! of! work! status! captured! by! blueL! versus! whiteLcollar! work.! Figure! 8!
shows! how! differences! in! the! work! status! among! men! and! women! emerged! during! the!
0%!
20%!
40%!
60%!
80%!
100%!
1895L99!
1900L09!
1910L19!
1920L29!
1930L39!
1940L49!
1950L59!
1960L69!
1970L79!
1980L89!
1990L99!
2000L11!
Working! Housewife! "Housewife"!
Page 24
23
colonial! economy! and! continued! to! grow! up! until! the! 1940s.! Three! decades! after! Uganda!
became!British! –! a! point! during!which! 50%! of! the! sampled!men!were! employed! in!whiteL
collar!work! –! only!10%!of! the! sampled!women!engaged! in! this! type!of!work.!But! from! the!
1950s!on,! the!gender!gap! in!work!status!narrowed,!and!today! it! is!virtually!gone.!When!we!
correct!for!ageLstructure!effects!(dotted!lines)!we!can!see!that!women!marrying!after!the!age!
of! 25! caught! up!with!men! even! earlier.! This! supports! the!Boserupian! idea! (Boserup!1970)!
that!native!social!norms!encouraged!women!to!marry!young,!and!that!women!who!were!able!
to!pursue!a!work!career!prior!to!marriage!were!perfectly!capable!of!entering!into!highLstatus!
work.!Our!regression!analysis!below!addresses!this!question!further.!
!
Figure"8"The!Share!of!WhiteLCollar!Workers!by!Sex!
!
Note:! A! whiteLcollar! worker! is! someone! who! is! deemed! so! according! to! the! HISCLASS! scheme! (van!Leeuwen!and!Maas!2011).!Housewives!and!imputed!housewives!are!not!included!in!the!graph.!Data:!see!text.!
! !
Inde
pend
ence
Col
oniz
atio
n
Mis
sion
arie
s
0.2
.4.6
.81
Shar
es o
f Non
-Man
ual W
orke
rs
1870
1880
1890
1900
1910
1920
1930
1940
1950
1960
1970
1980
1990
2000
2010
Year at Age 20
Men (all) Men (>25)Women (all) Women (>25)
Page 25
24
Figure"9"
The!Share!of!Skilled!Workers!by!Sex!
!
Note:! A! ‘skilled’! worker! is! a! worker! holding! an! occupation! deemed! mediumLskilled! or! highlyLskilled!according!to!the!HISCLASS!scheme!(van!Leeuwen!and!Maas!2011).!Housewives!and!imputed!housewives!are!not!included.!University!students!(2%)!and!chiefs!and!subLchiefs!(1%)!are!not!coded!by!the!HISCLASS!scheme,!but!they!appear!in!the!graph!coded!as!skilled!workers.!Data:!See!text.!
!
! Figure!9!illustrates!the!share!of!skilled!workers!by!sex.6!It!shows!skilled!workers!were!
highly!uncommon!during!the!preLcolonial!era,!but!that!they!became!much!more!common!for!
both! sexes!after!Uganda!became!British.!As!early!as!1910,! the! share!of! skilled!workers!had!
reached! 50%! for!men! and! 30%! for!women.! Interestingly,! although! skilled!work! paid!more!
than! twice!as!much!as!unskilled!work!did! in! the!early!1920s!and!more! than! three! times!as!
much! in! the!early!1940s!and! late!1950s! (Frankema!&!Van!Waijenburg!2012),! the! shares!of!
skilled!male!and!female!workers!stagnated!during!large!parts!of!these!periods.!After!1950,!the!
share! of! skilled!workers! gradually! rose! to! reach! 90%! for!men! and! 60%! for!women! today.!!!!!!!!!!!!!!!!!!!!!!!!!!!!!!!!!!!!!!!!!!!!!!!!!!!!!!!!!6!University!students!(2%)!and!chiefs!and!subLchiefs!(1%)!are!not!coded!by!the!HISCLASS!scheme,!so!we!have!coded!both!these!groups!as!skilled!and!waged!workers.!
Inde
pend
ence
Col
oniz
atio
n
Mis
sion
arie
s
0.2
.4.6
.81
Shar
es o
f Ski
lled
Wor
kers
1870
1880
1890
1900
1910
1920
1930
1940
1950
1960
1970
1980
1990
2000
2010
Year at Age 20
Men (all) Men (>25)Women (all) Women (>25)
Page 26
25
Remarkably,!most!of!the!formation!of!human!capital!(measured!this!way)!took!place!during!
the!early!colonial!period,!emphasising!the!role!of!Europeans!for!human!capital!accumulation!
among!Christian!Africans!in!and!around!Kampala.!Figure!9!also!shows!that!gender!inequality!
in!working!skills!increased!steadily!over!the!course!of!the!colonial!and!postLcolonial!periods.!
!
Figure"10"
Share!of!Workers!in!Waged!Employment!by!Sex!
!
Note:!Housewives!and!imputed!housewives!are!excluded.!
!
! The! occupational! titles! can! also! be! split! into! waged! and! unwaged! work.7!This! is!
especially! helpful! for! shedding! light! on! the! extent! of! women’s! formal! labour! market!
segregation.!Interestingly,!job!titles!that!in!a!western!context!would!be!categorised!as!waged!
!!!!!!!!!!!!!!!!!!!!!!!!!!!!!!!!!!!!!!!!!!!!!!!!!!!!!!!!7!We!are!particularly!grateful!to!former!Ugandan!Minister!of!Education,!Prof!Edward!Rugumayo,!for!his!help!with!coding!our!occupations!into!waged!and!unwaged!work.!
Inde
pend
ence
Col
oniz
atio
n
Mis
sion
arie
s
0.2
.4.6
.81
Shar
es o
f Wag
ed W
orke
rs
1870
1880
1890
1900
1910
1920
1930
1940
1950
1960
1970
1980
1990
2000
2010
Year at Age 20
Men (all) Men (>25)Women (all) Women (>25)
Page 27
26
work,! such! as! ‘Dressmaker’! and! ‘Weaver’,! indisputably! fall! into! the! category! of! selfL
employment!in!Uganda.!SelfLemployment!for!women!often!meant!informal!work!carried!out!
in! the! realm! of! the! domestic! sphere,!with! the! goods! produced! sold! in! a! local!market! place!
(hence! unwaged! work).! It! exemplifies! what! Boserup! (1970,! p.! 178)! meant! by! women!
‘working!on!their!own!account!in!bazaar!or!service!occupations’.!In!contrast,!job!titles!such!as!
‘Teacher’,!‘Nurse’,!and!‘Midwife’!all!fall!into!the!category!of!waged!(i.e.!formal)!employment.!!
!
! The! same! categorisation! applies! to!male! jobs,!with! job! titles! like! ‘Accountant’,! ‘Clerk’,!
and! ‘Teacher’! coded! as! formal! (waged)!work! and! ‘Peasant’,! ‘Farmer’,! and! ‘Tailor’! coded! as!
informal! (unwaged)! work.! Figure! 10! illustrates! the! rates! of! waged! employment! by! sex,!
showing! the! remarkable! transformation! of! Kampala! from! a! largely! informal! society! to! a!
largely!formal!economy.!It!demonstrates!how!men!rapidly!found!their!way!into!formalLsector!
jobs!after! colonisation:! in! just!30!years! the! share!of! formallyLemployed!men! rose! from! less!
than!10%!to!an!astonishing!90%.!!
!
! Figure! 10! also! shows! how! gender! inequality! in! waged! employment! was! linked! with!
women’s! segregation! from! formal! work:! as! late! as! the! 1940s,! some! after! 50! years! after!
Uganda!came!under!British!rule,! just!20%!of! the!sampled!women!were!employed! in! formal!
work!compared!with!90%!of!men.!The!reason!is!not!that!women!did!not!work:!only!12%!on!
average!were!recorded!as! ‘Housewife’!or! imputed!housewife!during! the!colonial!era.! It!was!
more! that!most!women!earned!a! living!outside!of! the! formal! labour!market! (Boserup!1970;!
Rodney!2012).!As!our!data!clearly!show,! it!was!not!until!after! the!1950s,!when!the!colonial!
power! made! considerable! effort! both! to! expand! the! civil! service! and! to! Africanize! it!
Page 28
27
(Lawrance! et! al! 2006),! that! women! began! to! enter! colonial! bureaucracies! as! clerks! and!
secretaries.!
!
! It! is! often! argued! that! colonial! gender! inequality! was! sustained! in! the! postLcolonial!
period,! because! maleLdominated! politics! did! little! to! correct! the! gender! imbalances!
(Akyeampong!and!Fofack!2013,!2014).!Our!data!thus!tell!a!rather!different!story:!after!1950,!
and! shortly! before!Uganda’s! independence,! the! share! of!women! employed! in! formalLsector!
jobs!began!to!increase,!growing!from!20%!in!1950!to!reach!80%!today.!While!it!is!true!that!a!
gender!gap!in!waged!employment!still!remains,!its!contemporary!size!is!tiny!compared!to!that!
of!the!colonial!era.!!
!
V"
Regression"Analysis"
Up!to!this!point!we!have!used!our!data!to!illustrate!some!developments!in!the!aggregate.!Our!
microLlevel!statistics!enable!us,!however,!to!take!a!deeper!look!at!the!role!of!time!and!social!
background! for! gender! inequality! and! women’s! economic! segregation.! To! this! end,! we!
construct!a!performance!score!for!each!of!our!sampled!individuals.!The!score!is!designed!so!
that! the! individual! receives! one! point! for! each! of! the! following! attainments:! literacy,!
numeracy,!working!skills,!whiteLcollar!work,!and!waged!work.!Hence,!the!performance!score!
has!a!maximum!of!five!and!a!minimum!of!zero.!We!then!use!the!individual!performance!scores!
to! calculate! an! index! for! gender! inequality! within! marriage.! This! comes! about! simply! by!
subtracting!the!bride’s!performance!score!from!the!performance!score!of!the!groom.!!
!
" "
Page 29
28
Figure"11"
Gender!Inequality!Within!Marriage!
!
Note:!Marital!gender! inequality! is! the!difference!between!the!groom’s!and!the!bride’s!performance!scores!(see!text).!Data:!see!text.!!
! Figure! 11! shows! the! index! for! marital! gender! inequality,! confirming! the! message! of!
previous!graphs!that!gender!inequality!first!increased!and!later!decreased!during!the!colonial!
era.! Furthermore,! in! order! to! explore! the! role! of! the! socioLeconomic! background! of! our!
grooms! and!brides,!we! subdivide! the! spousal! fathers! into! five! social! groups!based!on! their!
occupational! titles! (Table! 3).! These! five! groups! are:! chiefs,! peasants,! craftsmen,! mission!
waged!workers!and!nonLmission!waged!workers.!
!
" "
Inde
pend
ence
Col
oniz
atio
n
0.5
11.
52
With
in-m
arria
ge g
ende
r ine
qual
ity
1890
1900
1910
1920
1930
1940
1950
1960
1970
1980
1990
2000
2010
Year of Marriage
Marital gender inequality 95% CI
Page 30
29
Table"3"
Categorization!of!Fathers!by!Social!Group!
!
!
! Table! 4! reports! the! results! of! regressing! the! groom’s! and! bride’s! performance! score!
(columns!1!and!2,!respectively)!on!a!number!of!socioLeconomic!factors,!including!the!father’s!
social! group! and! controlling! for! time! fixed! effects.8!This! informs! us! about! several! matters.!
Starting!with!our! individual!background!variables,! it!does!not! surprise!us! that!grooms!who!
are!living!in!Kampala!perform!significantly!better!than!grooms!living!elsewhere!(i.e.!beyond!a!
radius!of!10!km!of!the!centre!of!Kampala).!The!same!is!true!of!brides!married!to!a!groom!who!
lives! in! Kampala.! The! location! of! the! groom! has,! however,! no! influence! on!marital! gender!
inequality!(Table!4,!columns!3!and!4),!so!gender!inequality!within!marriage!is!not!a!specific!
rural! or! a! specific! urban! phenomenon.! Another!matter! of! interest! concerns! the! size! of! the!
spousal!age!gap.!While!this!plays!no!significant!role!for!the!performance!of!the!groom,!the!size!
of!the!spousal!age!gap!exercises!a!negative!effect!on!the!bride,!both!in!terms!of!her!individual!!!!!!!!!!!!!!!!!!!!!!!!!!!!!!!!!!!!!!!!!!!!!!!!!!!!!!!!!8!For!ease!of!interpretation!of!the!estimates,!Table!4!reports!the!results!of!a!standard!OLS!regression!model.!The!results!are!identical,!in!terms!of!statistical!significance,!to!using!an!Ordered!Probit!model.!
Page 31
30
performance!and!for!her!gender!inequality!within!marriage.!This!conclusion!chimes!with!the!
findings!of!Carmichael!(2011)!that!the!size!of!the!spousal!age!gap!is!positively!correlated!with!
female!disempowerment!within!developing!countries.!
!
Social! background,! captured! by! the! father’s! social! group,! is! important! both! for! the!
performance!of! the! offspring! (the! grooms! and! the!brides)! and! for! their! gender! inequalities!
within! marriage.! Not! surprisingly,! offspring! of! the! elites! (chiefs! and! subLchiefs)! perform!
significantly!better!than!offspring!of!peasants!(the!socialLgroup!reference!category!in!Table!4).!
Gender! inequalities! within! marriage! are! also! lower! among! elite! offspring,! mainly! because!
elites!appear!to!put!relatively! large!emphasis!on!the!performance!of!their!daughters!(cf.! the!
size!of!the!estimate).!Offspring!of!fathers!employed!in!waged!work!(mission!and!other!waged!
jobs)! also!perform! significantly! better! than!descendants! of! peasants.! But!while! offspring! of!
fathers!employed!in!mission!work!have!the!lowest!gender!inequality!among!all!social!groups,!
offspring! whose! fathers! are! employed! in! nonLmission! waged! work! are! subject! to! higher!
inequality! within!marriage! than! descendants! of! peasants.! The! reason! for! this! may! be! that!
fathers!in!nonLmission!waged!work!place!relatively!greater!emphasis!on!the!performances!of!
sons!than!daughters!than!others!(cf.!the!size!of!the!estimates).!Descendants!of!fathers!that!are!
craftsmen,!i.e.!who!engage!in!informal,!unwaged!work,!perform!even!worse!than!descendants!
of!peasants.!This!has!no!significant!bearings!on! their!marriage! inequality,!probably!because!
craftsmen!place!equally!little!emphasis!on!the!education!of!their!daughters!and!sons.!
! !
Page 32
31
Table"4"Individual!Performances!and!Marital!Inequality!
!!! !! !! !! !!
! ! !Marital! Marital!
Model:! Performance! Performance! Inequality! Inequality!OLS! Score! Score! Score! Score!
!Groom! Bride! Groom! Bride!
!! !! !! !! !!
! ! ! ! !Groom!living! 0.08***! 0.07***! 0.02! 0.02!in!Kampala! (L0.66)! (L0.61)! (L0.66)! (L0.61)!
! ! ! ! !Spousal! L0.01! L0.02***! 0.01***! 0.01***!age!gap! (L7.28)! (L11.00)! (L4.47)! (L3.74)!
! ! ! ! !Father's!occ:! 0.14***! 0.27***! L0.04! L0.15**!Chief! (L2.91)! (L5.13)! (L0.57)! (L2.46)!
! ! ! ! !Father's!occ:! L0.15***! L0.08! L0.06! 0.03!Craftman! (L2.71)! (L1.56)! (L0.77)! (L0.48)!
! ! ! ! !Father's!occ:! 0.18***! 0.45***! L0.06! L0.34***!Mission!work! (L4.80)! (L11.06)! (L1.18)! (L7.16)!
! ! ! ! !Father's!occ:! 0.11***! 0.09***! 0.05! L0.02!Other!waged!work! (L3.90)! (L3.38)! (L1.43)! (L0.55)!
! ! ! ! !SubLperiod:! 1.78***! 0.20! 1.57***! 1.55***!1900L09! (L7.06)! (L0.71)! (L4.70)! (L4.68)!
! ! ! ! !SubLperiod:! 2.21***! 0.75***! 1.42***! 1.44***!1910L19! (L9.90)! (L2.99)! (L4.83)! (L4.93)!
! ! ! ! !SubLperiod:! 2.70***! 1.21***! 1.44***! 1.51***!1920L29! (L12.65)! (L5.08)! (L5.11)! (L5.39)!
! ! ! ! !SubLperiod:! 2.72***! 1.48***! 1.17***! 1.25***!1930L39! (L12.67)! (L6.17)! (L4.15)! (L4.42)!
! ! ! ! !SubLperiod:! 2.70***! 1.57***! 1.08***! 1.14***!1940L49! (L13.11)! (L6.81)! (L3.99)! (L4.18)!
! ! ! ! !!! ! ! ! !
Page 33
32
Table!4!cont’d!!SubLperiod:! 2.57***! 1.89***! 0.65**! 0.70**!1950L59! (L12.48)! (L8.16)! (L2.38)! (L2.58)!
! ! ! ! !SubLperiod:! 2.96***! 2.56***! 0.34! 0.41!1960L69! (L14.31)! (L11.06)! (L1.26)! (L1.50)!
! ! ! ! !SubLperiod:! 3.22***! 3.10***! 0.08! 0.13!1970L79! (L15.57)! (L13.39)! (L0.31)! (L0.49)!
! ! ! ! !SubLperiod:! 3.08***! 2.96***! 0.08! 0.13!1980L89! (L14.97)! (L12.86)! (L0.29)! (L0.46)!
! ! ! ! !SubLperiod:! 3.20***! 3.21***! L0.05! L0.01!1990L99! (L15.56)! (L13.95)! (L0.18)! (L0.04)!
! ! ! ! !SubLperiod:! 3.36***! 3.35***! 0.00! 0.02!2000L11! (L16.39)! (L14.59)! (L0.01)! (L0.08)!
! ! ! ! !Constant! 1.05***! 0.85***! 0.20! 0.19!
!(L5.15)! (L3.72)! (L0.74)! (L0.71)!
! ! ! ! !!! !! !! !! !!N! 10372! 10372! 10372! 10372!!! !! !! !! !!
!Note:! Housewives! and! imputed! housewives! were! excluded! from! the! analysis.! Individual! performance! scores!summarise!the!score!(one!or!zero)!in!each!of!these!five!areas:!literate,!numerate,!skilled!work,!whiteLcollar!work,!and!waged!work! (see! text).!Marital! Inequality! is! the! groom’s! performance! score!minus! that! of! the! bride.! The!spousal!age!gap!is!the!groom's!age!at!marriage!minus!the!age!at!marriage!of!the!bride.!The!reference!category!for!father’s! occupation! is! ‘Peasant’! and! for! time! is! the! subLperiod! 1895L99.! The! OLS! model! is! used! for! ease! of!interpretation;! the! statistical! significances! remain! if! we! use! an! Ordered! Probit! model! instead.! Because! of!problems!of!multicollinearity!between! the!occupational! groups!of! fathers,! the! regression!of!marital! inequality!was!run!separately!for!grooms!and!brides!(Columns!3!and!4).!tLstatistics!in!parentheses.!*!p<0.10,!**!p<0.05,!***!p<0.01.!Data:!see!text.!!
! The! difference! in! the! performances! of! females! by! social! background! show! that!
discrimination! against! women! was! very! much! an! African! social! class! phenomenon,! with!
certain! groups! placing!more! emphasis! on! the! performances! of! daughters! than! others.! The!
pattern!is!rather!clear:!daughters!of!fathers!involved!in!activities!directly!linked!to!Europeans!
(i.e.!chiefs,!mission!workers,!and!participants!in!the!formal!economy)!performed!significantly!
Page 34
33
better! than! those!whose! fathers!worked! in! the! traditional! sectors,! either! as! peasants! or! in!
informal! craftsman! trades! (basketmakers,! clothmakers! etc.).! Gender! inequality! within!
marriage!largely!repeats!that!pattern,!being!significantly!lower!among!the!offspring!of!elites!
or!mission!workers!than!among!those!of!fathers!working!in!traditional!sectors.!
!
!! One!of!the!key!questions!we!set!out!to!ask!was!whether!or!not!we!can!detect!a!colonial!
legacy!of! gender! inequality! and!of! female!marginalization.!The! time! fixedLeffects! in!Table!4!
can!help!cast!light!on!those!matters.!We!use!decadal!time!dummies!throughout,!except!for!the!
initial!period!that!covers!the!fiveLyear!period!from!1895!to!1899!(the!time!reference!category!
of!Table!4).!The!reasoning!behind!this! is!that!those!couples!that!married!very!early!into!the!
colonial!period!were!not!yet!influenced!by!colonial!activities.!Figures!5!and!6!above!provide!
ample!support!for!this:!major!changes!to!the!occupational!structures!among!men!and!women!
caused!by!the!colonizers!did!not!occur!before!1900.!Hence,!the!gender!inequality!existing!in!
the!preLcolonial!period!seem!to!be!captured!well!by!those!that!married!prior!to!1900.!
!
! The! time! dummies! show! that! Europeans! exerted! a! positive! influence! on! the! average!
performance!of!males!(Table!4,!Column!1).!In!the!first!decade!of!the!20th!century,!the!average!
performance!score!of!men!had!increased!by!1.76!points!compared!to!their!late!19thLcentury!
equivalents.!From!then!on,!the!male!performance!score!gradually!increased.!By!the!end!of!the!
colonial! period! (i.e.! in! 1950L99)! the! score!was! up! by! 2.54! points! compared! to! preLcolonial!
times.!The!postLcolonial! period!witnessed! further!progress,! and! the! average! score!of!males!
today!is!3.33!points!higher!than!that!of!their!preLcolonial!counterparts.!It!is!interesting!to!note!
that!most!of!the!improvements!in!the!men’s!performance!score!took!place!during!the!colonial!
period.!!
Page 35
34
! Turning!to!women,!it!was!only!after!1910!that!they!statistically!outperformed!their!preL
colonial!counterparts.!The!average!improvement!–!0.76!points!up!since!1895L99!–!was!not!as!
impressive!as!the!male!improvement!of!2.19!points!by!that!decade.!But!women!gradually!gain!
in!on!men,!having!increased!their!performance!score!by!1.90!points!by!the!end!of!the!colonial!
period!(in!1950L59)!against!an!increase!of!2.54!points!among!men.!They!further!gained!in!on!
men! during! the! postLcolonial! period,! and! today! the! improvement! in! women’s! average!
performance!score!matches!that!of!men!(3.35!point!for!women!against!3.33!points!for!men).!
The! only! setback! episode! across! the! entire! period! of! observation! was! during! Idi! Amin’s!
presidency! in! the! 1970s.! The! setback! concerned! men! and! women! alike,! and! it! is! barely!
detectable!in!terms!of!marital!gender!inequality.!
!
! Is! there! a! colonial! legacy! of! gender! inequality! among! our! sampled! population?! This!
question! is! easy! to! answer! using! our! time! dummies.! Marital! gender! inequality! increased!
significantly! immediately!after!1900.!After! the! initial!peak,!when!men!were!on!average!one!
and! a! half! points! ahead! of!women,! gender! inequality! gradually! declined.! By! the! end! of! the!
colonial!era,!in!1950L59,!men!were!roughly!half!a!point!ahead!of!women.!After!independence,!
gender! inequality!within!marriage!was!not!significantly!different! from!its!preLcolonial! level,!
which!was!some!0.2!points!in!the!favour!of!men!(cf.!the!constants!in!Table!4,!Columns!3!and!
4).! Today!marital! gender! inequality! among!our! sampled!population,! despite! the! fact! that! it!
was!very!large!during!the!colonial!era,!is!virtually!nonLexistent.!!
!
"
" "
Page 36
35
VI"
Conclusion"
The!purpose! of! our! study!was! to! investigate! the! hypothesis! that! gender! inequality! and! the!
marginalisation! of! women! could! be! traced! back! to! colonial! times.! Previous! studies! have!
emphasised!that!gender!inequality!and!female!disempowerment!already!existed!prior!to!the!
arrival!of!missionaries!and!colonizers! in!terms!of! the! limited!social!and!physical!mobility!of!
women!(Hattersley!1908;!Roscoe!1911;!Reid!2002).!But!even!if!gender!inequality!and!female!
labour! market! segregation! did! not! arrive! with! the! Europeans,! their! presence! certainly!
augmented! the! imbalances! between! African! men! and! women! concerning! educational! and!
occupational! opportunities.! Still,! our! regression! analysis! shows! that! gender! inequality! after!
colonial! independence! was! not! significantly! different! from! its! preLcolonial! level.! Also,! the!
colonialLperiod!segregation!of!women,!notably!in!terms!of!literacy!skills,!formal!employment,!
and!whiteLcollar!(highLstatus)!work,!is!largely!gone!today.!We!thus!refute!the!hypothesis!of!a!
colonial! legacy! of! gender! inequality! and! female! labour! market! segregation! in! Christian!
Kampala.!!
!
Our!social!background!analysis!offers! some!hints,!however,! that! rural!Africa!may! look!
very!different!in!this!regard!from!urban!Africa,!today!as!well!as!in!the!past.!Our!data!showed!
that!African!men!working!in!the!realm!of!the!traditional,!informal!economy!(mainly!peasants)!
appeared!more! prone! to! preserve! gender! inequality! and! female!marginalization! than!men!
working!in!the!modernized,!formal!economy.!This!in!turn!suggests!that!African!discrimination!
against! a! modernized! (EuropeanLstyle)! economy! could! be! key! in! understanding!
contemporary!women’s! lack! of! access! to! education! and! formal! employment! and! hence! the!
persistence!of!poverty!in!Africa.!
Page 37
36
References!!
Akyeampong,! E.,! and! H.! Fofack! (2014),! ‘The! Contribution! of! African! Women! to! Economic!
Growth!and!Development!in!the!Precolonial!and!Colonial!Periods:!Historical!Perspectives!and!
Policy!Implications,’!Economic!History!of!Developing!Regions!30(1).!
!
Akyeampong,! E.,! and! H.! Fofack! (2013),! ‘The! Contribution! of! African! Women! to! Economic!
Growth!and!Development!in!PostLColonial!Africa,’!World!Bank!Policy!Research!Working!Paper!
No!6537.!
!
Anderson,! S.! (2007),! ‘The! Economics! of! Dowry! and! Brideprice,’! Journal! of! Economic!
Perspectives!21(4):!151–174.!
!
Boserup,!E.!(1970),!Woman’s!Role!in!Economic!Development,!London:!George!Allen!and!Unwin!
Ltd.!
!
Carmichael,! S.G.! (2011),! ‘Marriage! and!Power:!Age! at! first!marriage! and! spousal! age! gap! in!
lesser!developed!countries,’!History!of!the!Family!16!(4):!416L436.!
!
Clark,! G.! (2007),! A! Farewell! to! Alms:! A! Brief! Economic! History! of! the! World,! Princeton:!
Princeton!University!Press.!
!
Crayen,!D.,!and!J.!Baten!(2010),! ‘Global!Trends! in!Numeracy!1820L1949!and!its! Implications!
for!LongLRun!Growth,’!Explorations!in!Economic!History!47(1):!82L99.!
Page 38
37
Duflo,! E.! (2012),! Women! Empowerment! and! Economic! Development.! Journal! of! Economic!
Literature!50:!1051–1079.!
!
Etherington,!N.!(2005),!Missions!and!Empire.!New!York:!Oxford!University!Press.!
!
Evans,! A.! (2014),! History! lessons! for! gender! equality! from! the! Zambian! Copperbelt,! 1900L
1990!Gender,!Place!&!Culture.!!
!
Frankema,!E.H.P.!(2012),! ‘The!origins!of!formal!education!in!subLSaharan!Africa:!was!British!
rule!more!benign?,’!European!Review!of!Economic!History!16:!335–355.!
!
Frankema,!E.H.P.!and!M.!van!Waijenburg!(2012),!‘Structural!impediments!to!African!growth?!
New! evidence! from! real! wages! in! British! Africa,! 1880–1960,’! Journal! of! Economic! History!
72(4):!895L926.!!
!
Hansen,! H.B.! (1984),! Mission,! Church! and! State! in! a! Colonial! Setting:!Uganda,! 1890W1925,!
London:!Heinemann.!
!
Hajnal,! J.! (1965),! ‘European! Marriage! Patterns! in! Perspective,’! in! Glass! and! Eversley,! eds.,!
Population! in! History,! Essays! in! Historical! Demography,! Aldine! Transaction! (reLprinted! in!
2008).!
!
Gallego,! F.A.,! and! R.! Woodberry! (2010),! Christian! Missionaries! and! Education! in! Former!
African!Colonies:!How!Competition!Mattered.!Journal!of!African!Economies!19(3):!294–329.!
Page 39
38
Hastings,!A.!(1973),!Christian!Marriage!in!Africa,!London:!SPCK!Publishing.!
!
Hastings,!A.!(1994),!The!Church!in!Africa,!1450W1950,!Oxford:!Clarendon!Press.!
!
Hattersley,!C.W.!(1908),!The!Baganda!at!Home,!London:!The!Religious!Tract!Society.!
!
Iliffe,!J.!(2007),!Africans:!The!History!of!a!Continent,!Cambridge:!Cambridge!University!Press.!
!
Katzenellenbogen,! J.,! D.! Yach,! &! R.E.! Dorrington! (1993),! ‘Mortality! in! a! rural! South! African!
mission,! 1837L1909:! An! historical! study! using! church! records,’! International! Journal! of!
Epidemiology!22:!965L75.!
!
Kyomuhendo,! G.B.! and! M.K.! McIntosh! (2006),!Women,! work! &! domestic! virtue! in! Uganda,!
1900W2003,!Oxford:!James!Currey.!
!
Lawrance,!B.N.,!E.L.!Osborn,!and!R.L.!Roberts!(2006),!Intermediaries,!Interpreters,!and!Clerks:!
African!Employees!in!the!Making!of!Colonial!Africa,!Madison:!University!of!Wisconsin!Press.!
!
Meier!zu!Selhausen,!F.P.!(2014),! ‘Missionaries!and!female!empowerment!in!colonial!Uganda:!
New!evidence!from!Protestant!marriage!registers,!1880L1945,’!Economic!History!of!Developing!
Regions!(forthcoming).!
Moon,! K.! (1994),! ‘St.! Paul's! Cathedral,! Namirembe:! A! History! and! Guide,’! Karen! Moon!
Publishing.!
!
Page 40
39
Notkola,! V.,! and! H.! Siiskonen! (2000),! Fertility,! Mortality! and! Migration! in! SubSaharan!
Africa!The!Case!of!Ovamboland!in!North!Namibia,!1925W90,!Palgrave!MacMillan.!
!
Nunn,! N.! (2014),! ‘Gender! and! Missionary! Activity! in! Colonial! Africa,’! in! Emmanuel!
Akyeampong,! Robert! H.! Bates,! Nathan! Nunn! and! James! A.! Robinson! (eds.),! African!
Development!in!Historical!Perspective!Cambridge:!Cambridge!University!Press!(forthcoming).!
!
Oliver,R.! (1952),!The!Missionary!Factor!in!East!Africa.!London:!Longmans,!Green!and!Co!Ltd.!
OmoloLOkalebo,!F.,!T.!Haas,! I.B.!Werner,!and!H.!Sengendo!(2010),! ‘Planning!of!Kampala!City!
1903–1962:!The!Planning! Ideas,!Values,! and!Their!Physical!Expression,’! Journal!of!Planning!
History!9(3):!151L169.!
!
Reid,!R.!(2002),!Political!Power!in!PreWColonial!Buganda,!Oxford:!James!Currey.!!
!
Robine,! J.LM.,! E.M.! Crimmins,! S.!Horiuchi,!and$Y.$ Zeng$ (2007),# ‘Human#Longevity,# Individual#
Life% Duration,% and% the% Growth% of% the% OldestLOld$ Population ,’! in! International! Studies! in!
Population!(volume!4),!Springer.!
!
Rodney,!W.! (2012),!How!Europe!Underdeveloped!Africa,!Revised!Edition,!Oxford:!Pambazuka!
Press.!
!
Roscoe,! J.! (1911),! The! Baganda:! An! account! of! their! native! customs! and! beliefs,! London:!
MacMillan.!
!
Page 41
40
Schofield,!R.S.!(1973),!‘Dimensions!of!illiteracy,!1750–1850,’!Explorations!in!Economic!History!
10:!437L454.!
!
Shryock,! H.S.! and! J.S.! Siegel! (1976),! Methods! and! Materials! of! Demography,! New! York:!
Academic!Press.!!
!
Taylor,!J.!V.!(1958),!The!Growth!of!the!Church!in!Buganda.!London:!SCM!Press!Ltd.!
!
Thornton,!J.!(1977),!‘Demography!and!history!in!the!Kingdom!of!Congo,!1550L1750,’!Journal!of!
African!History!18(4):!507L30.!
!
UBOS! (2006),! ‘Uganda! Population! and! Housing! Census! 2002,’! Uganda! Bureau! of! Statistics.!
Data! obtained! through! the! IPUMS! International! Database:! Minnesota! Population! Center.!
Integrated!Public!Use!Microdata!Series,!International:!Version!6.2.!Minneapolis:!University!of!
Minnesota,!2013.!
!
van! Leeuwen,!M.H.D.,! I.!Maas,! and!A.!Miles! (2002),!HISCO:!Historical! International!Standard!
Classification!of!Occupations,!Leuven:!Leuven!University!Press.!
!
van! Leeuwen,! M.H.D.,! and! I.! Maas! (2011),!HISCLASS:! A! Historical! International! Social! Class!
Scheme,!Leuven:!Leuven!University!Press.!
!
Walters,! S.! 2008.! Fertility,! Mortality! and! Marriage! in! Northwest! Tanzania,! 1920W1970:! a!
Demographic!Study!Using!Parish!Registers.!PhD!thesis,!Cambridge!University.!
Page 42
41
Ward,! K.! (1999),! ‘Africa,’! in! Hastings,! A! (Ed),! A! World! History! of! Christianity,! William! B.!
Eerdmans!Publishing!Co.,!Cambridge:!192L237.!
!
World! Bank! (2011).!World! Development! Report! 2012:! Gender! Equality! and! Development.!
The!World!Bank,!Washington!D.C.!
" "
Page 43
42
Appendix"
"
Table"A1"
The!Ten!Most!Common!Occupations!and!Their!Coding,!Men!
2000L11! Male!Occupation! Agri.! Manual! Skilled! Waged! Freq.! Percent! Cum.!1! Businessman! 0! 0! 1! 0! 432! 15.0! 15.0!2! Teacher! 0! 0! 1! 1! 276! 9.6! 24.5!3! Accountant! 0! 0! 1! 1! 269! 9.3! 33.8!4! Engineer! 0! 1! 1! 1! 190! 6.6! 40.4!5! Farmer! 1! 1! 1! 0! 110! 3.8! 44.2!6! Banker! 0! 0! 1! 1! 100! 3.5! 47.7!7! Doctor! 0! 0! 1! 1! 79! 2.7! 50.4!8! Driver! 0! 1! 0! 1! 78! 2.7! 53.1!9! Technician! 0! 0! 1! 1! 74! 2.6! 55.7!10! Marketer! 0! 0! 0! 1! 59! 2.0! 57.7!
! ! ! ! ! ! ! ! !1990L99! Male!Occupation! Agri.! Manual! Skilled! Waged! Freq.! Percent! Cum.!1! Businessman! 0! 0! 1! 0! 297! 15.6! 15.6!2! Teacher! 0! 0! 1! 1! 203! 10.7! 26.3!3! Driver! 0! 1! 0! 1! 101! 5.3! 31.6!4! Accountant! 0! 0! 1! 1! 100! 5.3! 36.8!5! Farmer! 1! 1! 1! 0! 94! 4.9! 41.8!6! Engineer! 0! 1! 1! 1! 80! 4.2! 46.0!7! Technician! 0! 0! 1! 1! 64! 3.4! 49.3!8! Banker! 0! 0! 1! 1! 56! 2.9! 52.3!9! Doctor! 0! 0! 1! 1! 47! 2.5! 54.7!10! Civil!Servant! 0! 0! 0! 1! 43! 2.3! 57.0!
! ! ! ! ! ! ! ! !1980L99! Male!Occupation! Agri.! Manual! Skilled! Waged! Freq.! Percent! Cum.!1! Businessman! 0! 0! 1! 0! 349! 16.9! 16.9!2! Farmer! 1! 1! 1! 0! 188! 9.1! 26.0!3! Teacher! 0! 0! 1! 1! 133! 6.4! 32.4!4! Accountant! 0! 0! 1! 1! 117! 5.7! 38.1!5! Driver! 0! 1! 0! 1! 101! 4.9! 42.9!6! Technician! 0! 0! 1! 1! 82! 4.0! 46.9!7! Mechanic! 0! 1! 1! 1! 65! 3.1! 50.1!8! Clerk! 0! 0! 0! 1! 63! 3.1! 53.1!9! Trader! 0! 0! 1! 1! 58! 2.8! 55.9!10! Banker! 0! 0! 1! 1! 57! 2.8! 58.7!
! ! ! ! ! ! ! ! !! !
Page 44
43
1970L99! Male!Occupation! Agri.! Manual! Skilled! Waged! Freq.! Percent! Cum.!1! Businessman! 0! 0! 0! 0! 247! 14.2! 14.2!2! Clerk! 0! 0! 1! 1! 115! 6.6! 20.7!3! Accountant! 0! 0! 0! 1! 106! 6.1! 26.8!4! Teacher! 0! 0! 1! 1! 104! 6.0! 32.8!5! Farmer! 1! 1! 1! 1! 81! 4.6! 37.4!6! Trader! 0! 0! 1! 0! 61! 3.5! 40.9!7! Salesman! 0! 0! 1! 1! 59! 3.4! 44.3!8! Mechanic! 0! 1! 0! 1! 54! 3.1! 47.4!9! Driver! 0! 1! 1! 1! 43! 2.5! 49.8!10! Gardener! 0! 1! 0! 1! 43! 2.5! 52.3!
! ! ! ! ! ! ! ! !1960L99! Male!Occupation! Agri.! Manual! Skilled! Waged! Freq.! Percent! Cum.!
!Clerk! 0! 0! 0! 1! 172! 15.7! 15.7!
2! Teacher! 0! 0! 1! 1! 152! 13.9! 29.6!3! Farmer! 1! 1! 1! 0! 68! 6.2! 35.8!4! Trader! 0! 0! 1! 1! 58! 5.3! 41.1!5! Salesman! 0! 0! 0! 1! 48! 4.4! 45.5!6! Mechanic! 0! 1! 1! 1! 30! 2.7! 48.2!7! Accountant! 0! 0! 1! 1! 28! 2.6! 50.8!8! Driver! 0! 1! 0! 1! 24! 2.2! 53.0!9! Shopowner! 0! 0! 1! 0! 21! 1.9! 54.9!10! Policeman! 0! 0! 1! 1! 20! 1.8! 56.7!
! ! ! ! ! ! ! ! !1950L59! Male!Occupation! Agri.! Manual! Skilled! Waged! Freq.! Percent! Cum.!1! Clerk! 0! 0! 0! 1! 294! 16.7! 16.7!2! Farmer! 1! 1! 1! 0! 220! 12.5! 29.1!3! Teacher! 0! 0! 1! 1! 157! 8.9! 38.0!4! Trader! 0! 0! 1! 1! 141! 8.0! 46.0!5! Builder! 0! 1! 0! 1! 126! 7.1! 53.1!6! Carpenter! 0! 1! 1! 1! 126! 7.1! 60.3!7! Mechanic! 0! 1! 1! 1! 84! 4.8! 65.0!8! Tailor! 0! 1! 1! 0! 79! 4.5! 69.5!9! Driver! 0! 1! 0! 1! 66! 3.7! 73.3!10! Medical!assistant! 0! 0! 0! 1! 34! 1.9! 75.2!
! ! ! ! ! ! ! ! !! !
Page 45
44
1940L49! Male!Occupation! Agri.! Manual! Skilled! Waged! Freq.! Percent! Cum.!1! Clerk! 0! 0! 0! 1! 253! 19.5! 19.5!2! Trader! 0! 0! 1! 1! 132! 10.2! 29.7!3! Farmer! 1! 1! 1! 0! 127! 9.8! 39.5!4! Teacher! 0! 0! 1! 1! 121! 9.3! 48.8!5! Carpenter! 0! 1! 1! 1! 83! 6.4! 55.3!6! Driver! 0! 1! 0! 1! 71! 5.5! 60.7!7! Builder! 0! 1! 0! 1! 64! 4.9! 65.7!8! Mechanic! 0! 1! 1! 1! 43! 3.3! 69.0!9! Medical!assistant! 0! 0! 0! 1! 40! 3.1! 72.1!10! Tailor! 0! 1! 1! 0! 32! 2.5! 74.5!
! ! ! ! ! ! ! ! !1930L39! Male!Occupation! Agri.! Manual! Skilled! Waged! Freq.! Percent! Cum.!1! Clerk! 0! 0! 0! 1! 198! 19.8! 19.8!2! Trader! 0! 0! 1! 1! 105! 10.5! 30.3!3! Teacher! 0! 0! 1! 1! 84! 8.4! 38.7!4! Farmer! 1! 1! 1! 0! 79! 7.9! 46.6!5! Driver! 0! 1! 0! 1! 58! 5.8! 52.4!6! Carpenter! 0! 1! 1! 1! 45! 4.5! 56.8!7! Policeman! 0! 0! 1! 1! 42! 4.2! 61.0!8! Chief! 0! 0! 1! 1! 40! 4.0! 65.0!9! Medical!assistant! 0! 0! 0! 1! 31! 3.1! 68.1!10! Tailor! 0! 1! 1! 0! 29! 2.9! 71.0!
! ! ! ! ! ! ! ! !1920L29! Male!Occupation! Agri.! Manual! Skilled! Waged! Freq.! Percent! Cum.!1! Clerk! 0! 0! 0! 1! 139! 22.6! 22.6!2! Teacher! 0! 0! 1! 1! 83! 13.5! 36.2!3! Trader! 0! 0! 1! 1! 67! 10.9! 47.1!4! Medical!assistant! 0! 0! 0! 1! 36! 5.9! 52.9!5! Carpenter! 0! 1! 1! 1! 33! 5.4! 58.3!6! Driver! 0! 1! 0! 1! 33! 5.4! 63.7!7! Farmer! 1! 1! 1! 0! 26! 4.2! 67.9!8! Servant!(peasant)! 1! 1! 0! 0! 26! 4.2! 72.2!9! Tailor! 0! 1! 1! 0! 22! 3.6! 75.7!10! Chief! 0! 0! 1! 1! 19! 3.1! 78.8!
! ! ! ! ! ! ! ! !! !
Page 46
45
1910L19! Male!Occupation! Agri.! Manual! Skilled! Waged! Freq.! Percent! Cum.!1! Clerk! 0! 0! 0! 1! 89! 17.0! 17.0!2! Tailor! 0! 1! 1! 0! 79! 15.1! 32.1!3! Servant!(peasant)! 1! 1! 0! 0! 65! 12.4! 44.5!4! Teacher! 0! 0! 1! 1! 39! 7.4! 51.9!5! Chief! 0! 0! 1! 1! 34! 6.5! 58.4!6! Carpenter! 0! 1! 1! 1! 32! 6.1! 64.5!7! Trader! 0! 0! 1! 1! 30! 5.7! 70.2!8! SubLchief! 0! 0! 1! 1! 19! 3.6! 73.9!9! Farmer! 1! 1! 1! 0! 13! 2.5! 76.3!10! Soldier! 0! 1! 0! 1! 11! 2.1! 78.4!
! ! ! ! ! ! ! ! !1900L09! Male!Occupation! Agri.! Manual! Skilled! Waged! Freq.! Percent! Cum.!1! Tailor! 0! 1! 1! 0! 63! 29.3! 29.3!2! Trader! 0! 0! 1! 1! 26! 12.1! 41.4!3! Teacher! 0! 0! 1! 1! 18! 8.4! 49.8!4! Carpenter! 0! 1! 1! 1! 17! 7.9! 57.7!5! Barkclothmaker! 0! 1! 0! 0! 16! 7.4! 65.1!6! Clerk! 0! 0! 0! 1! 10! 4.7! 69.8!7! Chief! 0! 0! 1! 1! 9! 4.2! 74.0!8! Servant!(peasant)! 1! 1! 0! 0! 9! 4.2! 78.1!9! Bricklayer! 0! 1! 1! 1! 6! 2.8! 80.9!10! Blacksmith! 0! 1! 1! 1! 5! 2.3! 83.3!
! ! ! ! ! ! ! ! !1895L99! Male!Occupation! Agri.! Manual! Skilled! Waged! Freq.! Percent! Cum.!1! Servant!(peasant)! 1! 1! 0! 0! 389! 73.4! 73.4!2! Peasant! 1! 1! 0! 0! 130! 24.5! 97.9!3! Chief! 0! 0! 1! 1! 5! 0.9! 98.9!4! Teacher! 0! 0! 1! 1! 3! 0.6! 99.4!5! Farmer! 1! 1! 1! 0! 2! 0.4! 99.8!6! Clerk! 0! 0! 0! 1! 1! 0.2! 100.0!7! !L! !L!
!!L! !L! !L! !L! !L!
8! !L! !L!!
!L! !L! !L! !L! !L!9! !L! !L!
!!L! !L! !L! !L! !L!
10! !L! !L!!
!L! !L! !L! !L! !L!!
" "
Page 47
46
Table"A2"
The!Ten!Most!Common!Occupations!and!Their!Coding,!Women!
2000L11! Female!Occupation! Agri.! Manual! Skilled! Waged! Freq.! Percent! Cum.!1! Teacher! 0! 0! 1! 1! 369! 12.8! 12.8!2! Businesswoman! 0! 0! 1! 0! 314! 10.9! 23.7!3! Housewife! NA! NA! NA! NA! 194! 6.7! 30.4!4! Accountant! 0! 0! 1! 1! 172! 6.0! 36.3!5! Nurse! 0! 0! 1! 1! 141! 4.9! 41.2!6! "Housewife"! NA! NA! NA! NA! 128! 4.4! 45.6!7! Farmer! 1! 1! 1! 0! 126! 4.4! 50.0!8! Secretary! 0! 0! 0! 1! 112! 3.9! 53.9!9! Banker! 0! 0! 1! 1! 109! 3.8! 57.7!10! Administrator! 0! 0! 1! 1! 91! 3.2! 60.8!
! ! ! ! ! ! ! ! !1990L99! Female!Occupation! Agri.! Manual! Skilled! Waged! Freq.! Percent! Cum.!1! Teacher! 0! 0! 1! 1! 291! 15.3! 15.3!2! Housewife! NA! NA! NA! NA! 255! 13.4! 28.7!3! "Housewife"! NA! NA! NA! NA! 157! 8.3! 36.9!4! Businesswoman! 0! 0! 1! 0! 151! 7.9! 44.9!5! Secretary! 0! 0! 0! 1! 123! 6.5! 51.3!6! Accountant! 0! 0! 1! 1! 76! 4.0! 55.3!7! Tailor! 0! 1! 1! 0! 62! 3.3! 58.6!8! Nurse! 0! 0! 1! 1! 59! 3.1! 61.7!9! Farmer! 1! 1! 1! 0! 56! 2.9! 64.6!10! University!student! 0! 0! 1! 0! 42! 2.2! 66.8!
! ! ! ! ! ! ! ! !1980L99! Female!Occupation! Agri.! Manual! Skilled! Waged! Freq.! Percent! Cum.!1! "Housewife"! NA! NA! NA! NA! 336! 16.3! 16.3!2! Housewife! NA! NA! NA! NA! 208! 10.1! 26.3!3! Teacher! 0! 0! 1! 1! 192! 9.3! 35.6!4! Secretary! 0! 0! 0! 1! 186! 9.0! 44.6!5! Businesswoman! 0! 0! 1! 0! 122! 5.9! 50.5!6! Farmer! 1! 1! 1! 0! 121! 5.9! 56.3!7! Tailor! 0! 1! 1! 0! 121! 5.9! 62.2!8! Craftswoman! 0! 1! 1! 0! 76! 3.7! 65.9!9! Nurse! 0! 0! 1! 1! 71! 3.4! 69.3!10! Clerk! 0! 0! 0! 1! 62! 3.0! 72.3!
! ! ! ! ! ! ! ! !! !
Page 48
47
!1970L99! Female!Occupation! Agri.! Manual! Skilled! Waged! Freq.! Percent! Cum.!
1! "Housewife"! NA! NA! NA! NA! 582! 33.3! 33.3!2! Housewife! NA! NA! NA! NA! 202! 11.6! 44.9!3! Secretary! 0! 0! 0! 1! 186! 10.7! 55.6!4! Teacher! 0! 0! 1! 1! 150! 8.6! 64.2!5! Nurse! 0! 0! 1! 1! 67! 3.8! 68.0!6! University!student! 0! 0! 1! 0! 58! 3.3! 71.3!7! Clerk! 0! 0! 0! 1! 57! 3.3! 74.6!8! Typist! 0! 0! 0! 1! 53! 3.0! 77.6!9! Tailor! 0! 1! 1! 0! 48! 2.8! 80.4!10! Farmer! 1! 1! 1! 0! 47! 2.7! 83.1!
! ! ! ! ! ! ! ! !1960L99! Female!Occupation! Agri.! Manual! Skilled! Waged! Freq.! Percent! Cum.!1! Teacher! 0! 0! 1! 1! 210! 19.2! 19.2!2! Needleworker! 0! 1! 0! 0! 207! 18.9! 38.1!3! Housewife! 0! 0! 0! 0! 101! 9.2! 47.3!4! Tailor! 0! 1! 1! 0! 99! 9.0! 56.4!5! Nurse! 0! 0! 1! 1! 80! 7.3! 63.7!6! "Housewife"! NA! NA! NA! NA! 73! 6.7! 70.3!7! Typist! 0! 0! 0! 1! 44! 4.0! 74.3!8! Secretary! 0! 0! 0! 1! 40! 3.7! 78.0!9! Midwife! 0! 0! 1! 1! 37! 3.4! 81.4!10! Weaver! 0! 1! 0! 0! 27! 2.5! 83.8!
! ! ! ! ! ! ! ! !1950L59! Female!Occupation! Agri.! Manual! Skilled! Waged! Freq.! Percent! Cum.!1! Tailor! 0! 1! 1! 0! 841! 47.7! 47.7!2! Weaver! 0! 1! 0! 0! 389! 22.0! 69.7!3! Teacher! 0! 0! 1! 1! 160! 9.1! 78.8!4! Nurse! 0! 0! 1! 1! 95! 5.4! 84.1!5! Matmaker! 0! 1! 0! 0! 90! 5.1! 89.2!6! Farmer! 1! 1! 1! 0! 64! 3.6! 92.9!7! Midwife! 0! 0! 1! 1! 33! 1.9! 94.7!8! Basketmaker! 0! 1! 0! 0! 32! 1.8! 96.5!9! Clerk! 0! 0! 0! 1! 10! 0.6! 97.1!10! Typist! 0! 0! 0! 1! 9! 0.5! 97.6!
! ! ! ! ! ! ! ! !! !
Page 49
48
1940L49! Female!Occupation! Agri.! Manual! Skilled! Waged! Freq.! Percent! Cum.!1! Weaver! 0! 1! 0! 0! 645! 49.8! 49.8!2! Tailor! 0! 1! 1! 0! 230! 17.8! 67.5!3! Matmaker! 0! 1! 0! 0! 177! 13.7! 81.2!4! Teacher! 0! 0! 1! 1! 112! 8.6! 89.8!5! Basketmaker! 0! 1! 0! 0! 46! 3.6! 93.4!6! Nurse! 0! 0! 1! 1! 31! 2.4! 95.8!7! Midwife! 0! 0! 1! 1! 18! 1.4! 97.2!8! Gardener! 0! 1! 1! 0! 13! 1.0! 98.2!9! "Housewife"! NA! NA! NA! NA! 8! 0.6! 98.8!10! Dressmaker! 0! 1! 1! 0! 4! 0.3! 99.1!
! ! ! ! ! ! ! ! !1930L39! Female!Occupation! Agri.! Manual! Skilled! Waged! Freq.! Percent! Cum.!1! Matmaker! 0! 1! 0! 0! 369! 36.9! 36.9!2! Tailor! 0! 1! 1! 0! 324! 32.4! 69.2!3! Weaver! 0! 1! 0! 0! 87! 8.7! 77.9!4! Teacher! 0! 0! 1! 1! 67! 6.7! 84.6!5! Basketmaker! 0! 1! 0! 0! 54! 5.4! 90.0!6! "Housewife"! NA! NA! NA! NA! 21! 2.1! 92.1!7! Farmer! 1! 1! 1! 0! 18! 1.8! 93.9!8! Midwife! 0! 0! 1! 1! 15! 1.5! 95.4!9! Seamstress! 0! 1! 0! 0! 10! 1.0! 96.4!10! Gardener! 1! 1! 1! 0! 8! 0.8! 97.2!
! ! ! ! ! ! ! ! !1920L29! Female!Occupation! Agri.! Manual! Skilled! Waged! Freq.! Percent! Cum.!1! Matmaker! 0! 1! 0! 0! 220! 35.8! 35.8!2! Tailor! 0! 1! 1! 0! 182! 29.6! 65.5!3! Basketmaker! 0! 1! 0! 0! 100! 16.3! 81.8!4! "Housewife"! NA! NA! NA! NA! 53! 8.6! 90.4!5! Farmer! 1! 1! 1! 0! 31! 5.1! 95.4!6! Teacher! 0! 0! 1! 1! 16! 2.6! 98.1!7! Trader! 0! 0! 1! 1! 3! 0.5! 98.5!8! Nurse! 0! 0! 1! 1! 2! 0.3! 98.9!9! University!student! 0! 0! 1! 0! 2! 0.3! 99.2!10! Midwife! 0! 0! 1! 1! 1! 0.2! 99.4!
! ! ! ! ! ! ! ! !! !
Page 50
49
1910L19! Female!Occupation! Agri.! Manual! Skilled! Waged! Freq.! Percent! Cum.!1! Matmaker! 0! 1! 0! 0! 253! 48.3! 48.3!2! Tailor! 0! 1! 1! 0! 83! 15.8! 64.1!3! Farmer! 1! 1! 1! 0! 70! 13.4! 77.5!4! Seamstress! 0! 1! 0! 0! 42! 8.0! 85.5!5! Basketmaker! 0! 1! 0! 0! 30! 5.7! 91.2!6! "Housewife"! NA! NA! NA! NA! 13! 2.5! 93.7!7! Teacher! 0! 0! 1! 1! 11! 2.1! 95.8!8! Cook! 0! 1! 1! 1! 7! 1.3! 97.1!9! Clerk! 0! 0! 0! 1! 4! 0.8! 97.9!10! Nurse! 0! 0! 1! 1! 3! 0.6! 98.5!
! ! ! ! ! ! ! ! !1900L09! Female!Occupation! Agri.! Manual! Skilled! Waged! Freq.! Percent! Cum.!1! Matmaker! 0! 1! 0! 0! 124! 57.7! 57.7!2! Gardener! 1! 1! 0! 0! 42! 19.5! 77.2!3! Farmer! 1! 1! 1! 0! 17! 7.9! 85.1!4! Tailor! 0! 1! 1! 0! 13! 6.1! 91.2!5! Basketmaker! 0! 1! 0! 0! 12! 5.6! 96.7!6! Cook! 0! 1! 1! 1! 3! 1.4! 98.1!7! "Housewife"! NA! NA! NA! NA! 2! 0.9! 99.1!8! Teacher! 0! 0! 1! 1! 2! 0.9! 100.0!9! !L! !L! !L! !L! !L! !L! !L! !L!10! !L! !L! !L! !L! !L! !L! !L! !L!
! ! ! ! ! ! ! ! !1895L99! Female!Occupation! Skilled! Manual! Skilled! Waged! Freq.! Percent! Cum.!1! "Housewife"! NA! NA! NA! NA! 509! 96.0! 96.0!2! Gardener! 1! 1! 0! 0! 19! 3.6! 99.6!3! Farmer! 1! 1! 1! 0! 2! 0.4! 100.0!4! !L! !L! !L! !L! !L! !L! !L! !L!5! !L! !L! !L! !L! !L! !L! !L! !L!6! !L! !L! !L! !L! !L! !L! !L! !L!7! !L! !L! !L! !L! !L! !L! !L! !L!8! !L! !L! !L! !L! !L! !L! !L! !L!9! !L! !L! !L! !L! !L! !L! !L! !L!10! !L! !L! !L! !L! !L! !L! !L! !L!
!
!