1 A Column Bioleaching Model for Chalcocite: An Investigation of Oxygen Limitation and Bacterial Inoculation on Leaching Martin J. Leahy, Malcolm R. Davidson and M. Philip Schwarz Bac-Min 2004 Conference Contact: Martin J. Leahy, Department of Chemical and Biomolecular Engineering, The University of Melbourne, 3010, Melbourne, Australia. pH.: +61 (03) 83447251, Fax +61 (03) 95628919, email: [email protected].
Transcript
1
A Column Bioleaching Model for Chalcocite: An Investigation of Oxygen Limitation and Bacterial Inoculation on Leaching
Martin J. Leahy, Malcolm R. Davidson and M. Philip Schwarz
Bac-Min 2004 Conference
Contact: Martin J. Leahy, Department of Chemical and Biomolecular Engineering, The University of Melbourne, 3010, Melbourne, Australia. pH.: +61 (03) 83447251, Fax +61 (03) 95628919, email: [email protected].
2
A Column Bioleaching Model for Chalcocite: An Investigation of Oxygen Limitation and Bacterial Inoculation on Leaching
Martin J. Leahy1,2, Malcolm R. Davidson1 and M. Philip Schwarz2
1Department of Chemical and Biomolecular Engineering, The University of Melbourne, 3010,
A model for column bioleaching is investigated to identify and understand aspects of bacteria in
bioleaching applications, which have implications in heap bioleaching operations. The model is used to
simulate scenarios that would otherwise be time consuming to perform experimentally.
This study uses a model of bacterial transport and attachment/detachment to ore particles, with a
bioleaching model for the depletion of a copper-sulphide, also accounting for liquid and gas flow and
gas/liquid oxygen mass transfer. The model includes aspects such as oxygen and ferrous ion
consumption, coupled with leaching of a copper-sulphide via the shrinking core model.
The model is used to investigate how the rate of leaching is affected by the bacterial concentration in
the columns, by the bacterial regeneration of the leaching oxidant ferric ions. The model is also used to
assess the impact of oxygen limitation and inoculation method on the copper leaching.
Some comparison of the model with experimental data will be shown.
INTRODUCTION
Heap bioleaching is a hydrometallurgical process by which large heaped piles of low-
grade ore (eg copper, zinc) are leached with acidic solution for long time periods. The
process involves the application of acid in water based solution and availability of
bacteria within the heap, which may occur either naturally or seeded in solution. The
injection of air into the heap (sparging) is of upmost importance to keep the aerobic
bacteria alive, for optimal leaching. The solution soaks into the ore and leaches the
metal into solution and is then processed. The copper sulfide chalcocite (Cu2S) is
considered in this work in combination with pyrite (FeS2). Ferric ions are used in
intra-particle leaching of copper, to produce ferrous and copper ions in solution
(equation (1)) for the leaching of chalcocite, and in the dissolution of pyrite (equation
(2)).
3
S4Fe2Cu4FeSCu 2232 ++→+ +++
(1)
+−++ ++→++ H162SO15FeFe14O8HFeS 24
2322 (2)
OHFe2H2O5.0Fe2 23bacteria
22 + →++ +++
(3)
Sulfur and iron oxidizing acidophilic bacteria such as Acidithiobacillus ferrooxidans
are involved when ferrous ions are catalyzed to ferric ions (equation (3)), which
increases the overall reaction rate significantly (Meruane and Vargas, 2003). The
optimal growth of bacteria is strongly coupled with iron, sulfur, oxygen, temperature
and pH levels. Bacteria are known to attach to ore surfaces (Escobar et al, 1996), and
this can be beneficial to leaching by maintaining a high bacterial concentration in the
heap.
To gain an understanding of the fundamental processes occurring in a heap,
experiments are often performed with a column of ore, and one can sample effluent
liquid data and record quantities such as iron levels, copper, bacteria (free) and the
solution (electric) potential. Consequently recent modelling efforts have been directed
towards the simulation of column bioleaching (Dixon and Petersen, 2003; Neuburg et
al, 1991). Indeed the only researchers to account for bacterial transport, growth and
attachment/detachment in the heap bioleaching model are Dixon and Petersen (2003)
and Neuburg et al (1991). Unfortunately these authors have not discussed particular
aspects of the model, including the effect of inoculation on the process, and the effect
that poor aeration can have on leaching. These researchers used a high sparging rate,
in an attempt to eliminate the oxygen limitation on bioleaching, however there are
circumstances in heap bioleaching whereby there may not be sufficient airflow and
hence oxygen. An understanding of oxygen limitation is of importance for a real heap
bioleaching operation, which can have lateral as well as vertical air flow (Leahy,
Schwarz and Davidson, 2003)), and regions of low air flow and hence low oxygen
levels (Bartlett, 1998). These may be due to variations in bed permeability (pore space
clogging due to jarosite precipitation or localized liquid saturation), or a large sparger
spacing and associated oxygen depleted regions in between spargers (Sidborn and
4
Moreno, 2003). Relying on natural convection has also been shown to result in
oxygen limitation (Casas et al, 1998). Consequently there is a need for an
investigation on how reduced aeration affects the bioleaching in a column.
In this work we aim to investigate the application of a model for the column
bioleaching process and use it to investigate the effects of oxygen limitation and
inoculation on the leaching process.
COLUMN BIOLEACHING MODEL
Problem Definition
There are many coupled processes occurring in the column, with the interaction of
bacteria, oxygen, ferric and ferrous ions, along with the copper-sulfide.
The process is summarized as follows, and is assumed to involve 8 components:
those in the solid phase (assumed to be stationary)
• the un-leached copper remaining in the ore, described by a shrinking core
model
• bacteria attached to the ore from the liquid phase, which detach proportionally
to the number attached, have Monod growth kinetics (dependent on oxygen
and ferrous ions), and also have a given death rate.
those species in the gas phase
• oxygen which exchanges with the liquid phase,
and those species in the (flowing) liquid phase
• oxygen which exchanges with the gas phase
5
• ferrous and ferric ions which are converted back and forth; ferric ions
regenerated from bacteria, and ferric ions converted to ferrous ions in leaching
• free bacteria which exchange with the attached bacteria, have Monod growth
kinetics (dependent on oxygen and ferrous ions), and also have a given death
rate.
The transport of these components is governed by an advection-diffusion equation
with source terms for each moving phase to describe the processes just mentioned.
The gas and liquid velocities are assumed to be constant and given by their respective
application flow rate divided by the area of application.
Model Formulation
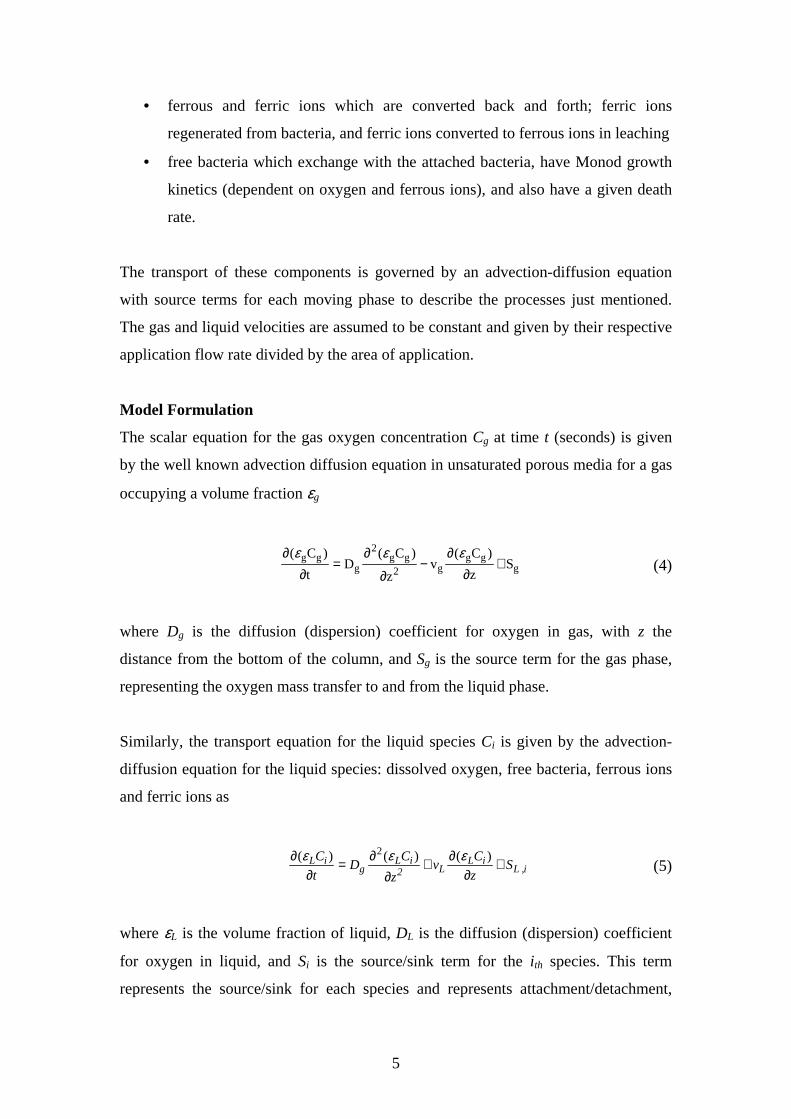
The scalar equation for the gas oxygen concentration Cg at time t (seconds) is given
by the well known advection diffusion equation in unsaturated porous media for a gas
occupying a volume fraction εg
ggg
g2gg
2
ggg S
z
)C(v
z
)C(D
t
)C(+
∂∂
−∂
∂=
∂∂ εεε
(4)
where Dg is the diffusion (dispersion) coefficient for oxygen in gas, with z the
distance from the bottom of the column, and Sg is the source term for the gas phase,
representing the oxygen mass transfer to and from the liquid phase.
Similarly, the transport equation for the liquid species Ci is given by the advection-
diffusion equation for the liquid species: dissolved oxygen, free bacteria, ferrous ions
and ferric ions as
i ,LiL
L2iL
giL S
z
Cv
z
CD
t
C +∂
∂+∂
∂=∂
∂ )()()( 2 εεε (5)
where εL is the volume fraction of liquid, DL is the diffusion (dispersion) coefficient
for oxygen in liquid, and Si is the source/sink term for the i th species. This term
represents the source/sink for each species and represents attachment/detachment,
6
bacterial growth and death, oxygen and ferrous ion consumption, and ferric ion
regeneration for the respective species as outlined above.
The attached population of bacteria ψ (to the stationary solid phase) have the form
ψψε
St
ore =∂
∂ )( (6)
where Sψ the source term for the attached bacteria population representing bacterial
growth and death, attachment and detachment. In (6) εore is the ore bed density
defined as εore = ρb(1- γ), ρb is the ore density and γ the porosity of the bed given by
γ=εL+εg.
The rate of copper sulfide leaching given by
tGR orecps ∂
∂−= αε (7)
where α is the copper fraction remaining in the ore given by the shrinking core
equation (Neuburg et al, 1991)
)(/ 1/3dc
32/3
16
Fe3
t αατταα
−+=
∂∂ +
31 (8)
where τc, τd are given by
ore
Febc M
M
βδϕρτ = (9)
and
oreeff
Febd MD
Mϕρσδτ G 2
= (10)
where G is the grade of the ore, σ is the stoichiometric coefficient, ϕ is the particle
shape factor, β is the intrinsic rate of oxidation and Deff is the effective diffusion
coefficient of the oxidant (Fe3+) through the particle.
7
Model Boundary Conditions
The system of partial differential equations was solved in CFX4 with the following
assumptions: initial levels of oxygen in the gas and liquid phase are atmospheric,
initially no bacteria either attached or in solution, and small levels of ferric and
ferrous ions. The boundary conditions are: atmospheric levels of oxygen at the top
and bottom of the column in the liquid and gas phases respectively, with a pulse of
bacteria injected at a known concentration, and dissolved iron inflow of: 0.7g/L
ferrous and 0.7g/L ferric ions.
NUMERICAL RESULTS AND DISCUSSION
Model Validation
An experimental data set from the literature is used for the validation of the model
(Dixon and Petersen, 2003), a column bioleaching operation of low grade chalcocite
ore mixed with pyrite, with the operation in a 5 metre column of 10 cm in diameter
lasting 120 days. It is assumed the column was operated on a once through basis but it
is uncertain whether the columns were inoculated and what the ferric and ferrous ions
and acid concentrations were in the leaching solution. In this work we assume the
column was inoculated for a small amount of time with bacteria at a fixed
concentration, and that the solution consisted of certain amounts of ferric and ferrous
ion as described above.
The ore contained chalcocite and pyrite with weight grades 0.9% and 3.5%
respectively, as well as acid soluble copper sulphide (presumably copper oxide), with
0.5% grade. It is assumed the acid soluble copper sulfide would have been flushed out
very quickly with the acid in solution and is not included in the simulation. To
compare the simulation with the copper leaching data, which includes the leaching of
the acid soluble copper sulfide, in Figure 1(a) the copper extracted α is plotted with
the value
1.4
0.5
1.4
0.9' += αα (11)
8
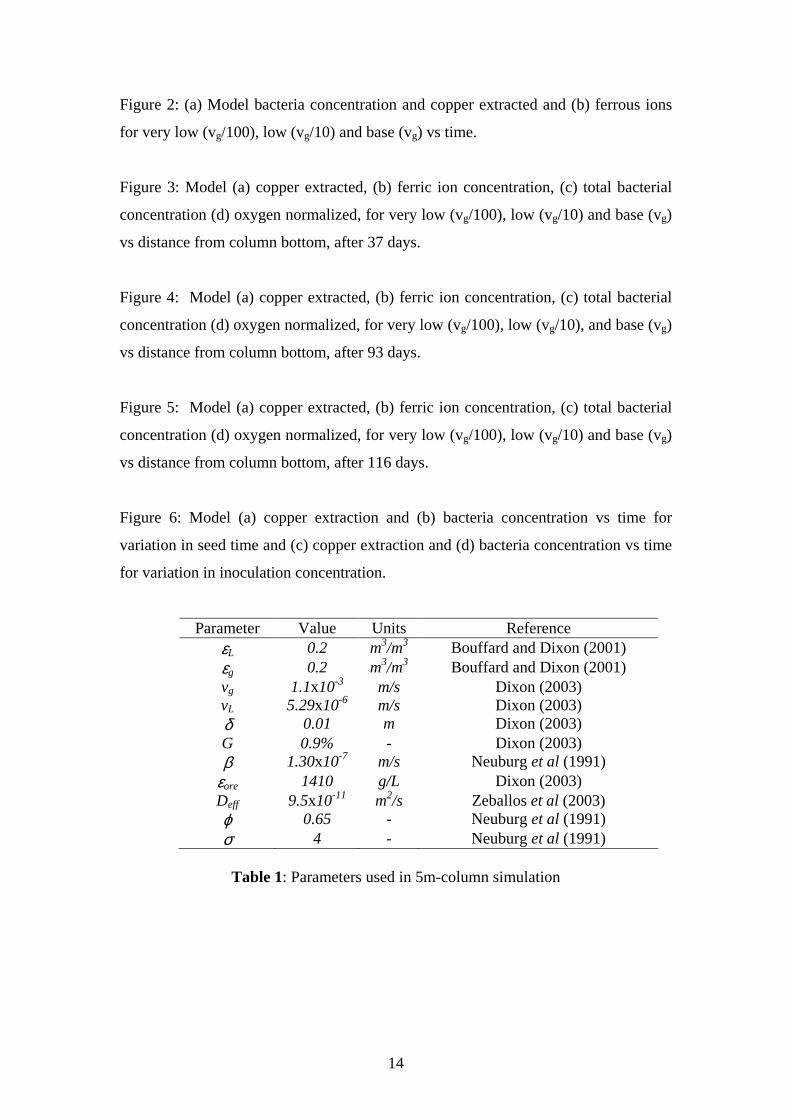
The model comparison to the effluent data of bacterial concentrations, solution
potential (Eh), iron levels and the overall copper extracted is shown in Figures 1(a)-(f)
(see Table 1 for simulation parameters). We see that the model successfully predicts
the variables involved in the copper extraction. The attached bacteria have a constant
distribution throughout the column (Figure 1(f)) with the concentration range in latter
stages of the simulation around 5x10¹¹ cells/kg ore, and this is a typical value found in
practice (Bouffard and Dixon, 2003).
The initial stage of the ferric ion comparison does not match the data, and there are
several reasons for this discrepancy. The actual operating conditions of the column
are unknown, and it is not even known whether the column was operated on a once
through basis, or whether the column was inoculated. It is possible also that some
ferric ions could also have been precipitated to jarosite, a hardening of ferric ion from
solution to the solid surface. Jarosite precipitation is complex process, but has been
reported (Readett et al, 2003) to be dominant (so that little ferric ions will remain in
solution) when the pH is above 3, and others have reported a pH over of 2.5 (Roman
and Benner, 1973). In this experiment Dixon and Petersen (2003) report a pH of up to
2.8 in the early stages where the ferric ions are low. However the timing of the
fraction of ferric ions to total iron is comparable to the data (Figure 1(e)) and this
model obtains a qualitative and quantative fit of bacteria to the data, whereas Dixon
and Petersen (2003) model this data and do not achieve such close comparison. The
model is able to predict the bioleaching of chalcocite, and associated phenomena and
this suggests the model can be used to investigate sub-processes within the column
such as oxygen limitation and inoculation method.
Oxygen Limitation in Column
The aeration rate was varied below the base case vg=1.1x10⁻³m/s to observe the effect
on copper extraction. It is expected that lower oxygen causes a lower bacterial
concentration in the column causing a decreased ferric ion concentration and hence
lower copper extraction rate. In Figure 2(a) we see that for the sparging rate (vg/10)
the copper extraction is slower initially compared to the base case, and the bacterial
concentration is not greatly different (Figure 2(b)) in the effluent initially. In the long
9
run the copper extraction for the middle aeration rate catches up to the highest
sparging rate so that although the middle air velocity slows the copper extraction, it
will not ultimately inhibit the copper extraction. Another decrease in the sparging rate
(vg/100) sees a much larger decrease in the copper extraction, which suggests air
velocities below 10-4m/s should be avoided.
We need to look inside the column to understand why the bacterial concentrations for
the lower sparging rates are eventually highest. At 37 days (Figure 3(a)-(d)) the total
bacteria is higher throughout the column for the highest sparging rate, and so the
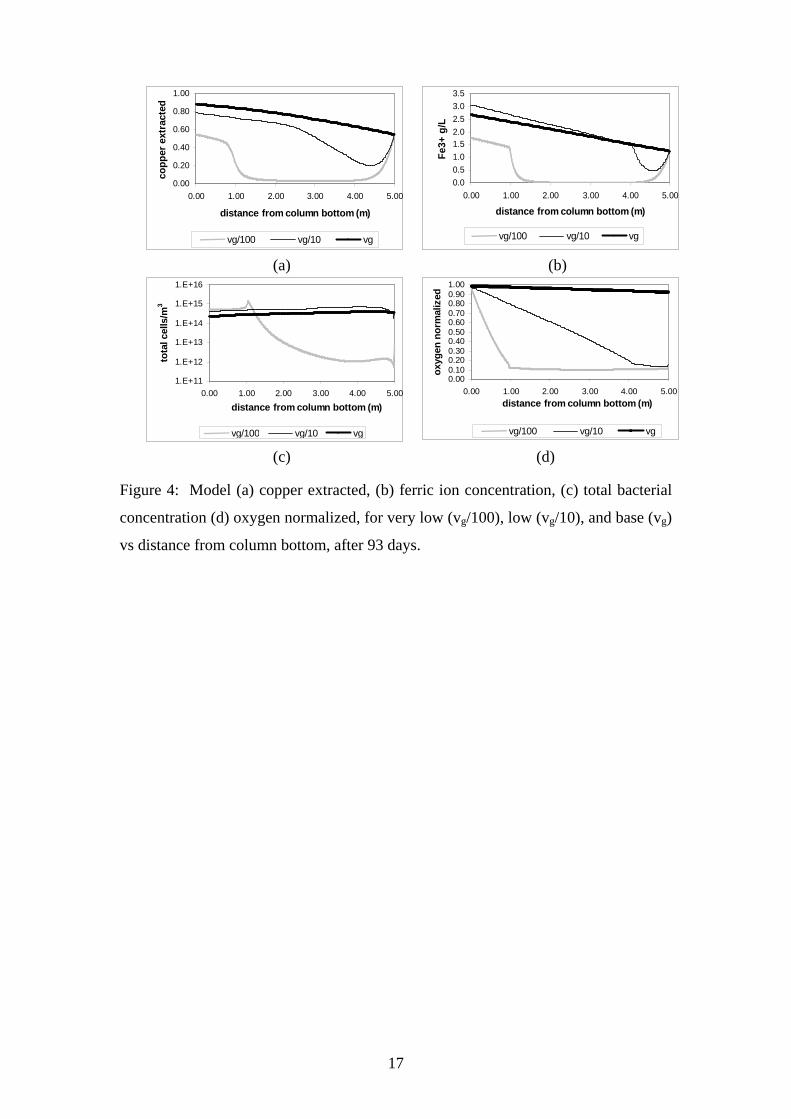
ferric ions concentration and associated copper extraction is higher. In Figure 4(a)-(d)
after 93 days the bacterial concentration is greater for the middle sparging rate (vg/10),
and as time increases (Figure 2(b)) the bacterial concentration start to decrease and
drop below those of the lower sparging rates. This is simply because the higher
sparging rate achieves faster copper extraction (high ferric ion and low ferrous ion
levels) with the ferrous ions becoming limiting to bacterial growth sooner.
In Figures 3, 4 and 5 we see that bacteria become growth limited when the oxygen
concentration drops below 15% (or 1.1 mg/L), which is similar to the experimentally
determined value range 1-1.2mg/L (Witne and Phillips 2001, Neuburg et al, 1991).
After 116 days (Figure 5(c)) the oxygen levels for the middle sparging rate have
increased through-out the column to be above 20%, and do not limit the bacteria,
which are now evenly distributed. This is only possible if the bacterial concentration
lower down in the column have decreased and less oxygen is used on the way up, and
this is the case, as can be seen on comparing the bacterial and oxygen levels at 93
days and 116 days in Figures 4(c),(d) and 5(c),(d) respectively. The decrease in
bacterial concentration further down the column is due to the significant decrease in
total ferrous ions in the column after 50 days (Figure 2(b)), causing a limitation to the
bacterial growth. This decrease in ferrous ions occurs gradually as the copper is
leached from the lower section of the column (where bacteria had earlier not been
limited by oxygen), and the reaction rate decreases, causing the source term for
ferrous ion to drop. Consequently the ferric ions concentration is high enough
everywhere to produce good leaching thereafter, and explains why the copper
extraction catches up the highest sparging rate (Figure 2(a)).
10
Effect of Inoculation
The effect of the inoculation method is discussed here, whereby the duration and
concentration of the bacterial injection is varied to observe the associated affect on the
bacteria in effluent and copper extraction.
Length of Inoculation
The length of time that the bacteria are injected in the column is investigated in this
section, to compare the resultant bacterial behaviour and copper extraction. In Figure
6(a)-(b), we see the effect of variation of the time period of inoculation, varying from
100 seconds to 80000 seconds. The results show that the bacteria in effluent are
essentially the same regardless of the length of inoculation and are shifted later in
time as the time period for inoculation decreases, so that the overall copper extraction
is also shifted later. For each case, eventually the same behaviour is evident, so that
the copper extraction is no different in the long term. This behaviour can be explained
by the fact that bacteria initially grow exponentially, and since the injection
concentration is the same, eventually the bacterial concentration all reach the same
peak (and drop due to ferrous ion limitation) regardless of the length of inoculation.
Effect of Concentration of Inoculation
The concentration of bacteria injected in the column is investigated in this section, to
observe the bacterial behaviour and associated copper extraction. In Figure 6(c)-(d)
we see a very similar effect to the proceeding section, whereby the inoculation
concentration does not significantly change the overall copper extraction. Again this
is because the growth is exponential and although the bacteria take longer to grow to
the peak concentration, the same behaviour is observed, regardless of the initial
bacterial concentration.
CONCLUSIONS
A simplified model for the bioleaching of copper sulfides is presented which
compares very well to experimental data of a column bioleaching operation. The
11
model was used to investigate several aspects that had previously not been discussed
in the literature, including the effect of poor oxygenation on copper extraction and the
effect of inoculation method. It was found that copper leaching was slowed by a
reduction in the air flow rate, but ultimately not inhibited for sparging air velocities of
at least 10-4 m/s. Interestingly, for the middle sparging rate, bacteria were initially low
at the top of the column causing poor extraction in the top. However, once the bottom
of the column was leached the top was re-oxygenated and bacteria grew to high
enough levels for the copper extraction to improve. For lower air velocities than 10-4
m/s a significant reduction in the long term copper extraction was observed due to low
bacterial concentrations throughout the majority of the column. It was also found that
the copper extraction is not sensitive to the inoculation method, in regard to the length
and concentration of inoculation. Further work should incorporate several more
aspects, including a 2D air flow model for a real heap configuration, the effect of
jarosite precipitation, and the effects of thermal variations within a heap.
Acknowledgements Help with CFX4 from Peter Witt, and with experimental aspects from Helen Watling was very appreciated. This work was supported by funding from an APA and a CSIRO top-up scholarship awarded to the first author. References
Bartlett, R W, 1992, Solution Mining: Leaching and Fluid Recovery of Materials, pp
24-53, Gordon and Breach Science Publishers: Amsterdam.
Bouffard, S C and Dixon, D G, (2001), Investigative study into the hydrodynamics of
heap leaching processes, Met Mat Trans, 32B:763-776.
Bouffard, S C and Dixon, D G, (2003), Mathematical modelling of pyritic refractory
gold ore heap biooxidation: model development and isothermal column simulations,
in Hydrometallurgy 2003 - Fifth International Conference in honour of Professor
Ian Ritchie Volume 1: Leaching and Solution Purification, (Ed(s): Young, C A ,
Alfantazi, A W, Anderson, C G , Dreisinger, D B, Harris, B and James, A), pp 275-
288 (TMS).
12
Casas, J M, Martinez, J, Moreno, L, and Vargas, T, (1998), Bioleaching model of a
copper-sulphide ore bed in heap and dump configurations, Met Mat Trans, 29B:899-
909.
Dixon, D G, (2003), Heap leach modelling-the current state of the art, in
Hydrometallurgy 2003 - Fifth International Conference in honour of Professor Ian
Ritchie Volume 1: Leaching and Solution Purification, (Ed(s): Young, C A,
Alfantazi, A W, Anderson, C G, Dreisinger, D B, Harris, B and James, A), pp 289-
314 (TMS).
Dixon D G and Petersen, J, (2003), Comprehensive modelling study of chalcocite
column and heap bioleaching, in Copper 2003-Cobre 2003 Volume VI -
Hydrometallurgy of Copper (Book 2), (Ed(s): Riveros, P A, Dixon, D G, Dreisinger,
D B and Menacho, J) pp 493-515.
Escobar, B, Jedlicki E, Wiertz, J and Vargas, T, (1996), A method for evaluating the
proportion of free and attached bacteria in the bioleaching of chalcopyrite with
Leahy, M J, Schwarz, M P and Davidson, M R, (2003), An Air Sparging CFD model
for heap bioleaching of copper-sulphide, in Proceedings Third International
Conference on CFD in the Minerals and Process Industries, pp 581-586, (CSIRO,
Melbourne, Australia)
Meruane, G and Vargas, T, (2003), Bacterial oxidation of ferrous iron by
Acidithiobacillus ferrooxidans in the pH range 2.5-7.0, Hydrometallurgy, 71:149-
158.
Neuburg, H J, Castillo, J A, Herrera, M N, Wiertz, J V, Vargas, T and Badilla-
Ohlbaum, R, (1996), A model for the bacterial leaching of copper sulphide ores in
pilot-scale columns, Int J Min Processing, 31:247-264.
13
Sidborn, M and Moreno, L, (2003), Model for bacterial leaching of copper sulphides
by forced aeration, in Proceedings of the 15th International Biohydrometallurgy
Symposium (IBS 2003), paper 33, Athens, Greece.
Readett, D, Sylwestrzak, L, Franzmann, P D, Plumb, J J, Robertson, W R, Gibson J A
E and Watling, H, (2003), The life cycle of a chalcocite heap bioleach system, in
Hydrometallurgy 2003 - Fifth International Conference in honour of Professor Ian
Ritchie Volume 1: Leaching and Solution Purification, (Ed(s): Young, C A,
Alfantazi, A W, Anderson, C G, Dreisinger, D B, Harris, B and James, A), pp 365-
374 (TMS).
Roman, R J and Benner, B R, (1973), The dissolution of copper concentrates,
Minerals Sci Engng, 5(1):3-24.
Witne, J Y, Phillips, C V, (2001), Bioleaching of OK Tedi copper concentrate in
oxygen and carbon dioxide-enriched air, Min Engng, 14(1):25-48.
Zeballos, F, Barbosa Filho, O, and Jose de Carvalho, R, (2003), Mathematical
modeling of the chemical and bacterial leaching of copper ores in stack, in
Proceedings of the 15th International Biohydrometallurgy Symposium (IBS 2003),
paper 32, Athens, Greece.
Captions
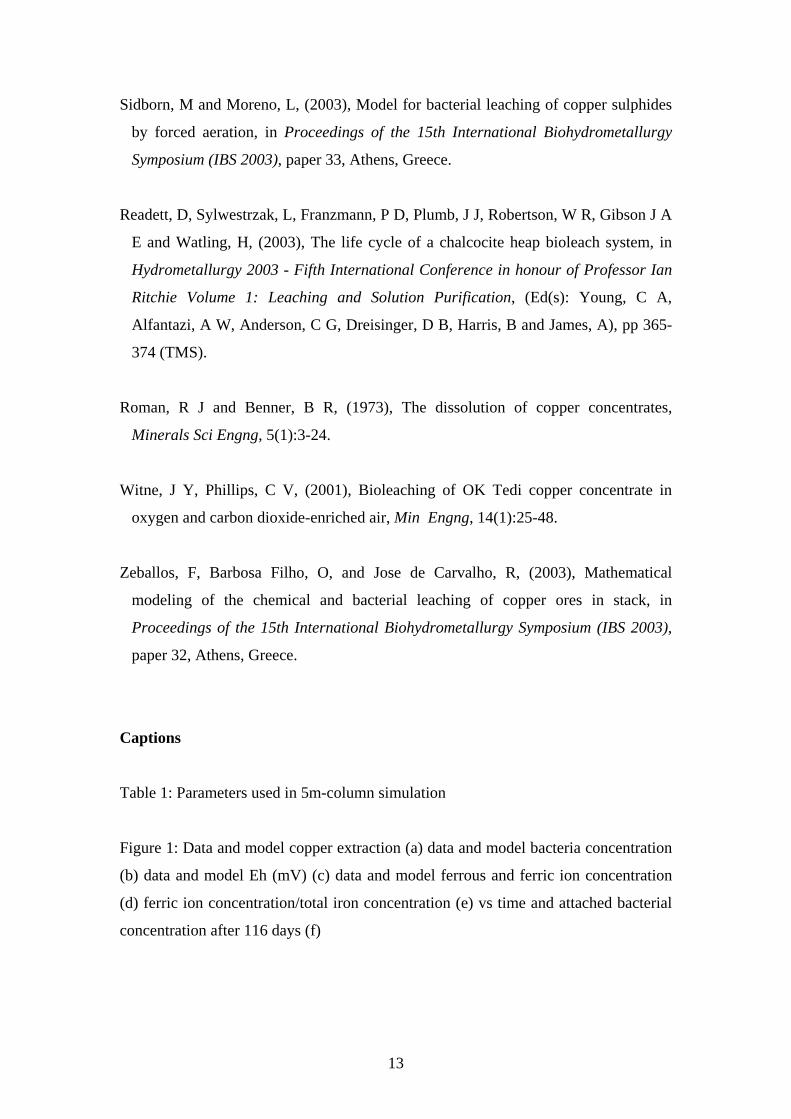
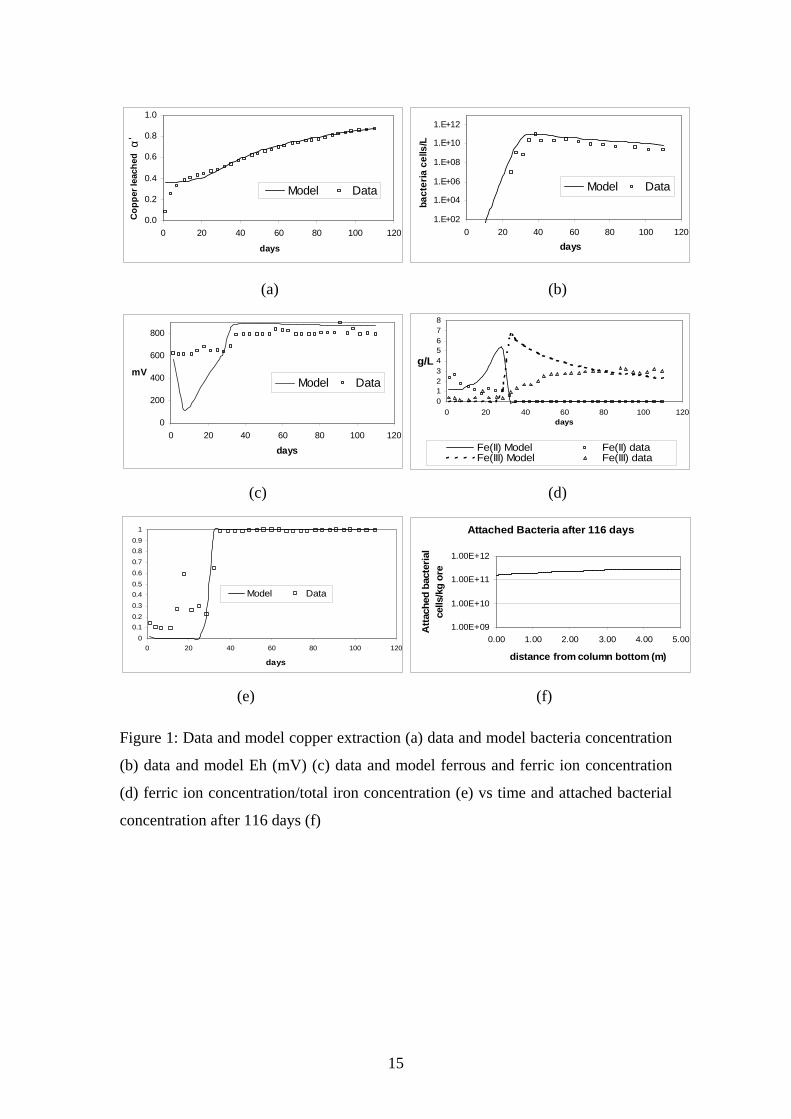
Table 1: Parameters used in 5m-column simulation
Figure 1: Data and model copper extraction (a) data and model bacteria concentration
(b) data and model Eh (mV) (c) data and model ferrous and ferric ion concentration
(d) ferric ion concentration/total iron concentration (e) vs time and attached bacterial
concentration after 116 days (f)
14
Figure 2: (a) Model bacteria concentration and copper extracted and (b) ferrous ions
for very low (vg/100), low (vg/10) and base (vg) vs time.
Figure 3: Model (a) copper extracted, (b) ferric ion concentration, (c) total bacterial
concentration (d) oxygen normalized, for very low (vg/100), low (vg/10) and base (vg)
vs distance from column bottom, after 37 days.
Figure 4: Model (a) copper extracted, (b) ferric ion concentration, (c) total bacterial
concentration (d) oxygen normalized, for very low (vg/100), low (vg/10), and base (vg)
vs distance from column bottom, after 93 days.
Figure 5: Model (a) copper extracted, (b) ferric ion concentration, (c) total bacterial
concentration (d) oxygen normalized, for very low (vg/100), low (vg/10) and base (vg)
vs distance from column bottom, after 116 days.
Figure 6: Model (a) copper extraction and (b) bacteria concentration vs time for
variation in seed time and (c) copper extraction and (d) bacteria concentration vs time
for variation in inoculation concentration.
Parameter Value Units Reference εL 0.2 m3/m3 Bouffard and Dixon (2001) εg 0.2 m3/m3 Bouffard and Dixon (2001) vg 1.1x10⁻³ m/s Dixon (2003) vL 5.29x10⁻⁶ m/s Dixon (2003) δ 0.01 m Dixon (2003) G 0.9% - Dixon (2003) β 1.30x10⁻⁷ m/s Neuburg et al (1991)
εore 1410 g/L Dixon (2003) Deff 9.5x10⁻¹¹ m2/s Zeballos et al (2003) ϕ 0.65 - Neuburg et al (1991) σ 4 - Neuburg et al (1991)
Table 1: Parameters used in 5m-column simulation
15
Figure 1: Data and model copper extraction (a) data and model bacteria concentration
(b) data and model Eh (mV) (c) data and model ferrous and ferric ion concentration
(d) ferric ion concentration/total iron concentration (e) vs time and attached bacterial
concentration after 116 days (f)
0.0
0.2
0.4
0.6
0.8
1.0
0 20 40 60 80 100 120
days
Co
pp
er le
ach
ed
α'
Model Data
1.E+02
1.E+04
1.E+06
1.E+08
1.E+10
1.E+12
0 20 40 60 80 100 120
days
bact
eria
cel
ls/L
Model Data
0
200
400
600
800
0 20 40 60 80 100 120
days
mVModel Data
012345678
0 20 40 60 80 100 120days
g/L
Fe(II) Model Fe(II) dataFe(III) Model Fe(III) data
0
0.1
0.2
0.3
0.4
0.5
0.6
0.7
0.8
0.9
1
0 20 40 60 80 100 120
days
Model Data
(e)
(a) (b)
(c)
(f)
(d)
Attached Bacteria after 116 days
1.00E+09
1.00E+10
1.00E+11
1.00E+12
0.00 1.00 2.00 3.00 4.00 5.00
distance from column bottom (m)
Att
ach
ed b
acte
rial
ce
lls/k
g o
re
`
16
Figure 2: (a) Model bacteria concentration and copper extracted and (b) ferrous ions
for very low (vg/100), low (vg/10) and base (vg) vs time.
Figure 3: Model (a) copper extracted, (b) ferric ion concentration, (c) total bacterial
concentration (d) oxygen normalized, for very low (vg/100), low (vg/10) and base (vg)