See discussions, stats, and author profiles for this publication at: https://www.researchgate.net/publication/262729533 A combined hydrochemical-statistical analysis of Saq aquifer, northwestern part of the Kingdom of Saudi Arabia Article in Geosciences Journal · April 2014 DOI: 10.1007/s12303-014-0016-8 CITATIONS 5 READS 206 7 authors, including: Some of the authors of this publication are also working on these related projects: NRA project View project geography View project Yousef Habous Nazzal King Saud University 32 PUBLICATIONS 581 CITATIONS SEE PROFILE Izrar Ahmed Dubai Municipality 24 PUBLICATIONS 348 CITATIONS SEE PROFILE Habes A. Ghrefat King Saud University 65 PUBLICATIONS 936 CITATIONS SEE PROFILE Awni T Batayneh King Saud University 71 PUBLICATIONS 923 CITATIONS SEE PROFILE All content following this page was uploaded by Faisal K. Zaidi on 14 October 2014. The user has requested enhancement of the downloaded file.
Transcript
See discussions, stats, and author profiles for this publication at: https://www.researchgate.net/publication/262729533
A combined hydrochemical-statistical analysis of Saq aquifer, northwestern
part of the Kingdom of Saudi Arabia
Article in Geosciences Journal · April 2014
DOI: 10.1007/s12303-014-0016-8
CITATIONS
5READS
206
7 authors, including:
Some of the authors of this publication are also working on these related projects:
NRA project View project
geography View project
Yousef Habous Nazzal
King Saud University
32 PUBLICATIONS 581 CITATIONS
SEE PROFILE
Izrar Ahmed
Dubai Municipality
24 PUBLICATIONS 348 CITATIONS
SEE PROFILE
Habes A. Ghrefat
King Saud University
65 PUBLICATIONS 936 CITATIONS
SEE PROFILE
Awni T Batayneh
King Saud University
71 PUBLICATIONS 923 CITATIONS
SEE PROFILE
All content following this page was uploaded by Faisal K. Zaidi on 14 October 2014.
The user has requested enhancement of the downloaded file.
Geosciences JournalDOI 10.1007/s12303-014-0016-8ⓒ The Association of Korean Geoscience Societies and Springer 2014
A combined hydrochemical-statistical analysis of Saq aquifer, northwestern part of the Kingdom of Saudi Arabia
ABSTRACT: The present study includes detailed hydrochemicalassessment of groundwater resources of Saq aquifer. The Saq aquifercovers a large area (about 375,000 km²) and lies in the arid regionwith low annual rainfall and extremely high evaporation. In the studyarea, groundwater serves as the major source for agricultural activityand for domestic usages. A total of 295 groundwater samples col-lected and were analyzed for physico-chemical parameters such ashydrogen ion concentration (pH), total dissolved solids (TDS) andelectrical conductivity (EC) , sodium (Na+), potassium (K+), mag-nesium (Mg2+), and calcium (Ca2+) ,bicarbonate (HCO3) chloride(Cl−), sulfate (SO4
2−) and nitrate (NO3). The goal and challenge forthe statistical overview was to delineate chemical distributions ina complex, heterogeneous set of data spanning over a large geographicrange. After de-clustering to create a uniform spatial sample dis-tribution with 295 samples, histograms and quantile-quantile (Q-Q)plots were employed to delineate subpopulations that have coherentchemical affinities. The elements showing significantly higher positivecorrelation are: TDS with EC; Ca with EC, TDS; Mg and EC,TDS, Ca, K; Cl and EC, TDS, Mg, Na, Ca; SO4 and EC, TDS, Ca,Cl, Na, Mg. The distribution of major ions in the groundwater isNa+ > Ca++ > Mg++ > K+ and Cl− > SO4
−2 > HCO3− > NO3
−. Ionicabundance plot of alkalis with Ca and Mg is suggestive of mix typetrends of concentrations as evident by moderate correlation (r =0.57). About 60% of the total samples have alkalis abundance andrests have more Ca + Mg concentrations than alkalis. Taking bothresults of cluster tree and geochemical features of variables intoconsideration, the authors classify the elements into two major groups,the first includes TDS, Na, EC, Cl, Ca, SO4, and Mg, where therelationship within the group are strong. The second group includesK, HCO3, pH, and NO3. This group has close relationship with group1 demonstrate that, the increase in the concentration to some elementscould be the same. Some of the analyzed parameters approach anormal distribution, as both their skewnesses and kurtoses reachclose to “0”. The study revealed that, all of the element pairs exhibitpositive relations.
Ground water is the major source of water supply fordrinking, irrigation, and industrial purposes. Groundwatercontamination includes natural sources or anthropogenicinfluences. The quality of groundwater is affected by residen-tial, municipal, commercial, industrial, and agricultural activi-ties. Contamination of groundwater results in poor groundwaterquality, loss of water supply, high cleanup costs, high costsfor alternative water supplies, and/or potential health prob-lems, (Bilgehan et al., 2010). The selected study area is Saqaquifer area is located in the northwestern part of the King-dom of Saudi Arabia. Focusing on the Saq aquifer which iscovering vast area in the northwestern part of the Kingdomof Saudi Arabia, this research works attempts to study thehydrochemical properties and quality of groundwater. Sta-tistical techniques applied to help in data interpretations,(MWE, 2008).
The groundwater resources of the Saq study area, covering375,000 km2 in the northern part of the Kingdom of SaudiArabia (Fig. 1) are intensively exploited. The current rate ofgroundwater abstraction by far exceeds the rate of ground-water recharge. As the wells tapping the various aquifers ofthe region are unevenly distributed, the consequences of thisunbalanced groundwater exploitation vary from one part ofthe Saq study area to another. Schematically, water levels ofthe main aquifers have dropped sharply over the past threedecades in areas where groundwater abstractions are con-centrated, but show little or no decline elsewhere.
The absence of a declining trend in a specific aquifer ora specific area is not an indicator of groundwater sustain-ability. Due to its very large lateral and vertical extent, themulti-layer aquifer system of the Saq study area reacts slowlyto any stresses imposed on it, and declining trends expandonly gradually outside the abstraction areas and towardsoverlying or underlying aquifers, (MWE, 2008).
Yousef Nazzal*Izrar AhmedNassir S.N.Al-ArifiHabes GhrefatAwni BataynehBassam A. AbuamarahFaisal K. Zaidi
}Department of Geology and Geophysics, King Saud University, Riyadh 11451, Saudi ArabiaCollege of Engineering, King Saud University, Riyadh 11451, Saudi Arabia
Department of Geology and Geophysics, King Saud University, Riyadh 11451, Saudi Arabia
Yousef Nazzal, Izrar Ahmed, Nassir S.N.Al-Arifi, Habes Ghrefat, Awni Batayneh, Bassam A. Abuamarah, and Faisal K. Zaidi
Statistical applications in hydrochemical studies werescarried out by many researches e.g., Zang et al. (2008),Cloutier et al. (2008), and Garcia et al. (2001). All thosestudies applied the statistical methods to link between thechemical elements and sources of pollutions. In the presentstudy the statistical methods such as histograms used toanalyze the data distribution, while quantile plot used foreach interval variable for visualizing the extent to which vari-ables is normally distributed. Also Kolmogorov-Smirnov (K-S) test used to measure the degree to which a given data setfollows a specific theoretical distribution. So far the technologyhere is not employed to characterize Saq aquifer chemistrywhich will further help in decision making plans.
Considering the complexity of the water balance in theSaq multi-layer aquifer system, with water leakage betweenthe various aquifers and the relatively large de-stockage ofthe aquifer and aquitard water, accurate long-term predictionson the evolution of the aquifer system require a groundwa-ter mathematical model covering the full extent of the Saqsystem. Impact of human interactions on the Saq aquifer isposing serious threats for groundwater sustainability. Besideexcessive abstraction, groundwater quality is being deteriorating
day by day. The present study main aim is to deal with detailedhydrochemical characterization of the Saq aquifer using classi-cal and statistical methods.
2. STUDY AREA DESCRIPTIONS
2.1. Study Area
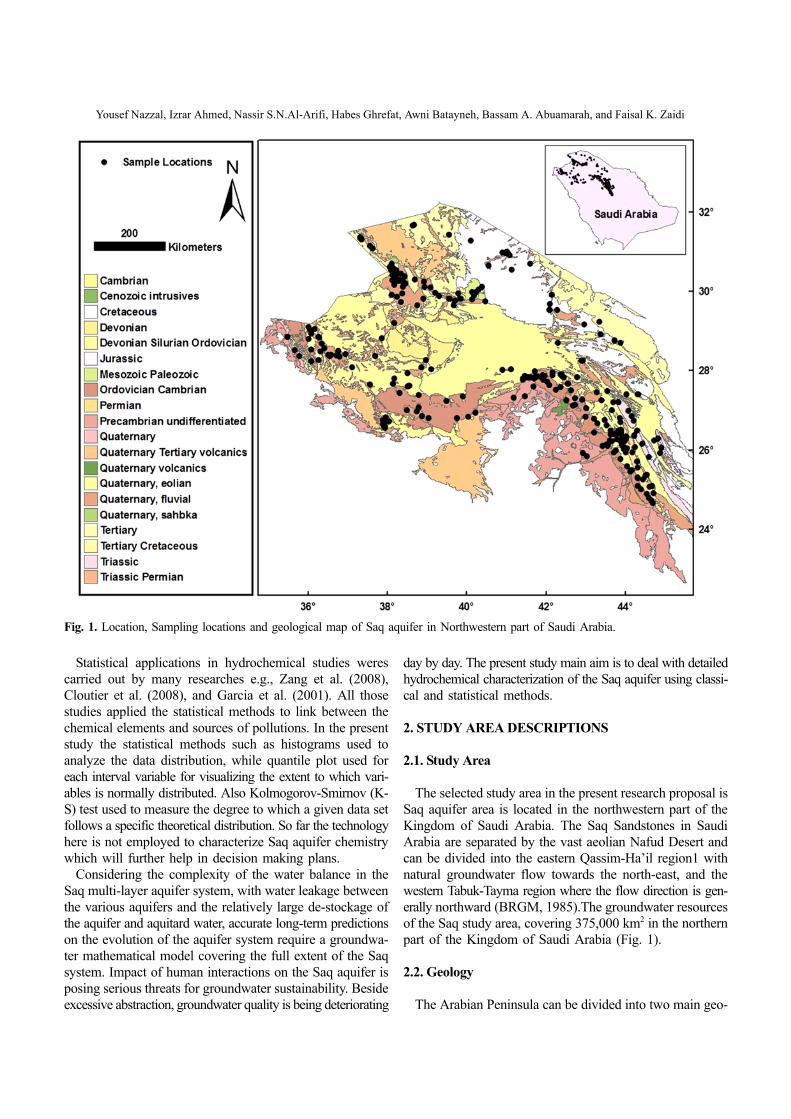
The selected study area in the present research proposal isSaq aquifer area is located in the northwestern part of theKingdom of Saudi Arabia. The Saq Sandstones in SaudiArabia are separated by the vast aeolian Nafud Desert andcan be divided into the eastern Qassim-Ha’il region1 withnatural groundwater flow towards the north-east, and thewestern Tabuk-Tayma region where the flow direction is gen-erally northward (BRGM, 1985).The groundwater resourcesof the Saq study area, covering 375,000 km2 in the northernpart of the Kingdom of Saudi Arabia (Fig. 1).
2.2. Geology
The Arabian Peninsula can be divided into two main geo-
Fig. 1. Location, Sampling locations and geological map of Saq aquifer in Northwestern part of Saudi Arabia.
Hydrochemical and statistical characterization of Saq Aquifer, Saudi Arabia
logical units. The western part is occupied by Precambrianrocks of the Arabian Shield. In the central and eastern partof the peninsula, a succession of continental and shallow-marine sedimentary rocks of the Arabian Shelf overlies thePrecambrian basement. This succession consists mainly ofsandstone and limestone that are exposed in a great curvedbelt along the eastern margin of the Shield. The westernboundary of the area is marked by the contact between Pre-cambrian basement and the overlying sedimentary rocks ofthe Arabian Shelf. The sedimentary cover is composed of athick succession of formations ranging in age from Cam-brian-Ordovician to Quaternary. Tilting of the Precambrianbasement resulted in a gentle dip of the sedimentary stratato the east. The Saq Sandstone is found at the base of thesedimentary sequence and crops out in a strip adjacent tothe basement, following the S-shape of the Arabian Shield(Fig. 1). Moving away from the contact with the basementtowards the east, the overlying formations appear one afterthe other in chronological order, (MWE, 2008).
2.3. Topography
Among the sedimentary formations, the less resistant stratahave been eroded into a series of lowland strips and the moreresistant sedimentary strata form escarpments. The highestelevations are encountered in the mountains along the west-ern boundary, from the border with Jordan down to Al Ula,where harrats (basalt plateau) form the crest line at eleva-tions above 1,800 m above mean sea level (msl) with Jabalal Juhayyir (36°43'20''E / 27°38'40''N) reaching 2,111 m msl.The boundary of Saq area, defined by the contact betweenSaq Sandstone and basement rocks, does not coincide withthe crest line as Saq Sandstone is exposed west of the harrats.As a result, along the western boundary of the Saq area thesurface-water drainage basins do not match with the ground-water basin.
The mountains along the western boundary of Saq areaare bordered to the east by the Tabuk and Al Ula valleys withflat valley-bottoms at an elevation around 800 m msl. Far-ther to the east a second ridge stretches from the Jordanianborder southward, passing east of Tabuk and then betweenAl Ula and Tayma, reaching elevations slightly above 1,000 min the central part with peaks above 1,200 m msl in thenorthern and southern part. The area to the east of this secondridge, representing 85% of the Saq aquifer’s area and ischaracterized by a flat topography gently dipping eastwardfrom elevations near 900 m msl in the west to below 400 mmsl along the eastern boundary (MWE, 2008).
2.4. Climate and Hydrogeological Setting
The climate in the entire Saq area is arid with low annualrainfall. Nevertheless some local differences exist, with thelowest mean annual rainfall (less than 30 mm/year) being
encountered in the western part of the area (Tabuk region)and the highest rainfall in the southeastern part (170 mm/year). With such a low rainfall and extremely high potentialevapotranspiration of approximately 2,400 mm/year, ground-water recharge can only occur where concentration of runoffwaters coincides with favourable infiltration characteristicsof the surface layers.
At a regional level, groundwater recharge has been assessedat 2.5 mm/year for the Saq Sandstone outcrops south of Tayma(MWE, 2008). At the scale of the entire Saq area, groundwaterrecharge most probably does not exceed 5 mm/year (MWE,2008).
Historical data on groundwater use are provided by BRGM(1985). An updated evaluation of groundwater abstractionsfor the year 2005 has been realized as part of this study. Thetotal groundwater volume abstracted in the Saq area in 2005(8,727 Mm3/year) equals a water column of 24 mm cover-ing the entire Saq area (~370,000 km2). This is 5 to 10 timeshigher than the recharge occurring during the same periodand is therefore it is not accorded with sustainable devel-opment (MWE, 2008).
Hydrogeologically, there are seven aquifers or aquifer groups,from bottom to top:
stone and limestone.Two layers act regionally as aquitards but they contain units
that are locally exploited as aquifer:• Jauf limestone and sandstone;• Unayzah and Berwath sandstones.
3. METHODS
A total of 283 samples of groundwater were collected forchemical analysis from different boreholes in the Saq aqui-fer area, Saudi Arabia (Fig. 1). Samples were collected inpolyethylene bottles of one-liter capacity. Prior to their fillingwith sampled water, these bottles were rinsed to minimizethe chance of any contamination. The samples preservationand the used of analytical techniques were in accordancewith the standard methods from American Public HealthAssociation (APHA, 1995). Unstable parameters such as hydro-gen ion concentration (pH), total dissolved solids (TDS) andelectrical conductivity (EC) were determined at the sam-pling sites with the help of a pH-meter, a portable EC-meterand a TDS-meter (Hanna Instruments, Michigan, USA). TheSodium (Na+), potassium (K+), magnesium (Mg2+), and cal-cium (Ca2+) ions were determined by atomic absorptionspectrophotometer (AAS). Bicarbonate (HCO3
−) and chloride
Yousef Nazzal, Izrar Ahmed, Nassir S.N.Al-Arifi, Habes Ghrefat, Awni Batayneh, Bassam A. Abuamarah, and Faisal K. Zaidi
(Cl−) were analyzed by volumetric methods. Sulfate (SO42−)
was estimated by the colorimetric and turbidimetric methods.Silicon dioxide (SiO2) was calorimetrically analyzed by ammo-nium molibdate method. Nitrate (NO3
−) was measured byionic chromatography. A statistical of physco-chemical param-eters was presented and explained in relation to humanconsumption criteria (WHO, 2011). Groundwater genesis wasexplained using various bi-variate plots.
For present study statistical analyses were carried out usingdescriptive statistics, histograms and normal quantile plots.The main statistical software in use was SPSS 15 softwarepackage (SPSS Inc., 2006) and JMPIN (version 4.0.4).
Histograms are used to analyze the data distribution; theyare tools for displaying frequency distributions and rely ondividing the data into classes (or bins). The data following anormal distribution will show a symmetric bell-shaped his-togram, where a tail towards high values implies that the dataare positively skewed. Histograms provide visual approxi-mations to distributions like the bell shape of a normal dis-tribution, but they have some limitations. The number of binsaffects the shape of the curve and this number can be deter-mined by the software. A curve representing the normal dis-tribution corresponding to the mean and standard deviationof the data set is superimposed on the histogram for the pur-pose of comparison. Extreme values occur at the high end,and they are separated and identified as outliers in order toshow the major tendency of the data. The limitations of the
histograms are offset by normal quantile plots.The normal quantile plot is graph for each interval vari-
able, which is useful for visualizing the extent to which thevariable is normally distributed. If a variable is normal, thenormal quantile plot is a diagonal straight line. This plot isalso referred to as a theoretical quantile-quantile plot or Q-Qplot. Normal quantile-quantile (Q-Q) plots are created byplotting observed values of a variable against the correspondingnormal quantiles. Display of data is done by plotting the normalquantiles (or scores) of the standard normal distribution onthe y-axis with values usually between −4 to 4, and the vari-able under study on the x-axis (Fig. 2).
The Kolmogorov-Smirnov (K-S) test measures the degreeto which a given data set follows a specific theoretical dis-tribution (such as normal, uniform, or Poisson). The statisticaltest of K-S is based on the largest absolute difference betweenthe observed and the theoretical cumulative distribution func-tions. The K-S test assumes that the parameters (e.g., meanand standard deviation) of the test distribution are specifiedin advance, whereas the Lilliefors correction for the K-S testis applied when means and variances are not known andmust be estimated from the data.
Results were obtained for K-S test values performed bySPSS statistical software which utilized the Lillierfos cor-rection automatically. If the p-value reported is less than0.05 (or some other alpha), then the distribution is not normal(Sall and Lehman, 1996). Therefore it is useful to use thenormal quantile plot to help assess the lack of normality inthe distribution.
The authors therefore used the K-S test to minimize theeffect of outlier populations for many of the elements. Duringcomparison studies, discrepant results were obtained for K-Stest values performed by SPSS and S-Plus statistical soft-ware. The problem was resolved when it was found that theK-S results obtained with the S-Plus application automati-cally utilized the Lilliefors correction. For comparison, theLilliefors significance correction for the K-S test using SPSSwas also applied. This method best applied by Zhang et al.(2008). The raw data were stored in a dBASE file (dbf for-mat), and basic calculations were performed using MicrosoftExcel. Most of the statistical calculations were accomplishedwith SPSS software (version 11.0). The sampling location mapswere produced with ArcView GIS software (version 3.3).
4. RESULTS AND DISCUSSIONS
4.1. Hydrochemistry
The waters are slightly acidic to alkaline with pH valuesranging from 6.4 to 9.6. Electrical conductivity (EC) rangesfrom 284 to 9902 μS/cm, with an average of 1599.4 μS/cm.About 31% of the samples are crossing the maximum per-missible limit of EC (1,500 μS/cm). The large variation inEC values is attributed to geochemical evolution of ground-Fig. 2. Histogram and normal quantile diagram.
Hydrochemical and statistical characterization of Saq Aquifer, Saudi Arabia
water through rock-water interaction during long residenttime period and the anthropogenic influences. The total dis-solved solids (TDS) were measured through summing upall major ions concentrations which range of 195.5−6771.7mg/L with an average value of 1072 mg/L. Only 27% samplehas TDS value <500 mg/L. As per TDS classification, 29%of the wells are brackish (TDS > 1,000) water type and 44%wells are fresh (TDS < 1,000) water (Freeze and Cherry, 1979).
The distribution of major ions in the groundwater is Na+
> Ca++ > Mg++ > K+ and Cl− > SO4−2 > HCO3 > NO3. The
concentration of Na+ shows a large variation from 3.8 to1640 mg/L, averaging 177.4 mg/L. About 23% of sampleshave Na values greater than permissible limit of 200 mg/L.The concentration of Ca2+ in the study area ranges from 17
to 820 mg/L with an average of 111.4 mg/L. As per WHO(2011) standards, 45% of the samples from this study exceedthe permissible limit of 75 mg/L, The major source of Ca2+
in the groundwater is due to ion exchange of minerals fromrocks of this area. Further, this may also be due to the pres-ence of CaCO3 and CaSO4 minerals present in the soil hori-zon, Gypsum, anhydrite, dolomite etc. The concentration ofMg2+ ranges from 1.1 to 335.5 mg/L with an average valueof 36.5 mg/L. Most of the Mg2+ concentrations (81%) are withinthe desirable limit of 50 mg/L. The concentration of K+ rangesfrom 0.9 to 91 mg/L with an average value of 15 mg/L.
The Cl− concentration ranges from 12.9 to 2622 mg/L,averaging 295.9 mg/L. About 45% sample has Cl− concen-tration more than the permissible limit of 200 mg/L. The
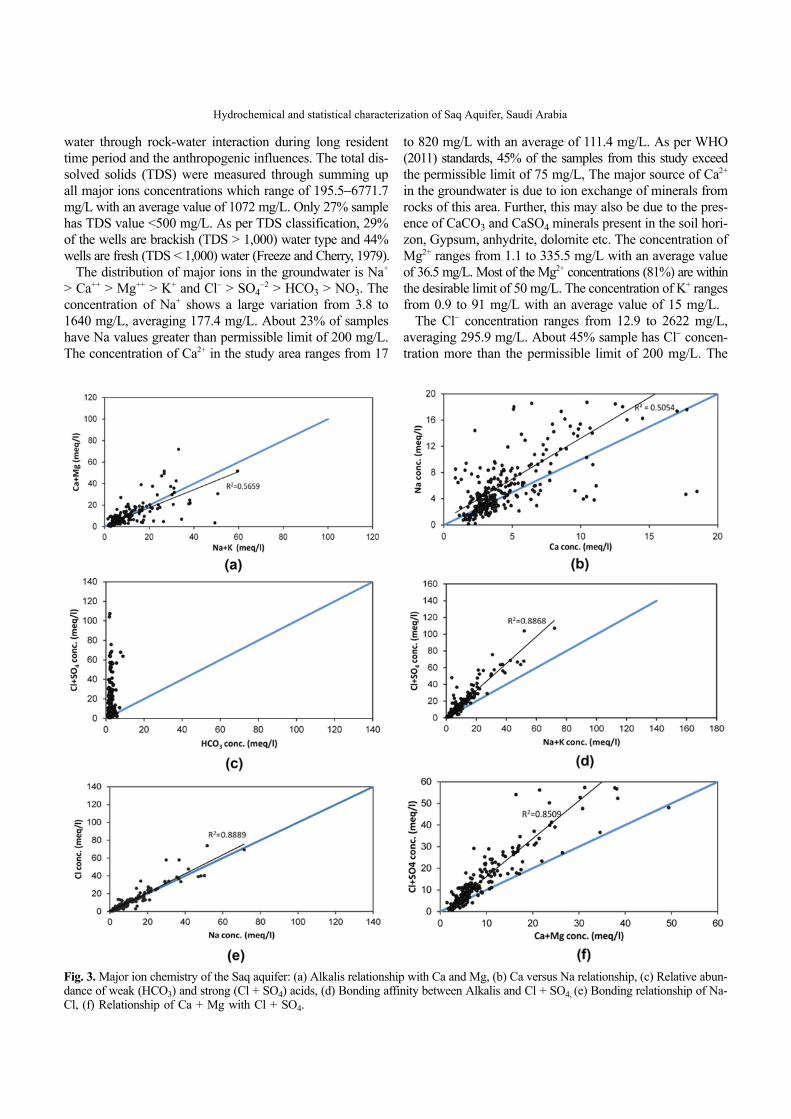
Fig. 3. Major ion chemistry of the Saq aquifer: (a) Alkalis relationship with Ca and Mg, (b) Ca versus Na relationship, (c) Relative abun-dance of weak (HCO3) and strong (Cl + SO4) acids, (d) Bonding affinity between Alkalis and Cl + SO4, (e) Bonding relationship of Na-Cl, (f) Relationship of Ca + Mg with Cl + SO4.
Yousef Nazzal, Izrar Ahmed, Nassir S.N.Al-Arifi, Habes Ghrefat, Awni Batayneh, Bassam A. Abuamarah, and Faisal K. Zaidi
sulphate concentration range from 15.1 to 2120 mg/L, withan average value of 256.4 mg/L. Out of the total 32% sam-ple has SO4 concentration greater than the permissible limitof 200 mg/L. The HCO3 concentration ranges from 65 to543 mg/L with an average of 149.1 mg/L. The NO3 concentra-tion ranges from 0.4 to 318.2 with an average of 30.3 mg/L.As much as 19% sample has more than permissible NO3concentration (45 mg/L).
Hardness of groundwater results from the presence of diva-lent metallic cations of which concentration of Ca2+, Mg2+, aremost abundant in groundwater. Adopting Sawyer and McCarty(1967) classification criteria, only 8% sample classified asmoderately hard type. The remaining 50% and 42% samplesclassified to 'hard' and 'very hard' water classes.
Ionic concentrations of major elements present in ground-water were analysed for relative abundances and ionic affinity.Ionic abundance plot of alkalis with Ca + Mg is suggestiveof mix type trends of concentrations as evident by moderatecorrelation (r = 0.57). About 60% of the total samples havealkalis abundance and rests have more Ca + Mg concentra-tions than alkalis (Fig. 3). Predominance of Ca and Mg overNa and K and abundances of Na with Ca concentration,individually (Fig. 3) are indicative of ion-exchange reactions(Subba Rao, 2012).
Relative abundance of anionic facies wase examined (Fig. 3);where Cl + SO4 is in far more abundant than HCO3. Ionicaffinity relationships were tested first between ionic pairs hav-ing primary affinity. The plot of Cl + SO4 concentrations againstHCO3 (Fig. 3) shows that majority of samples have excessCl and SO4. Cl + SO4 ratio (<1) which can be use to presentfresh recharge or meteoric nature of groundwater suggestedthat only 9 samples (5 Saq, 2 Jauf, 1 Tawil and 1 Kahfah) showmeteoric nature. Nonetheless, predominance of Ca + Mgover HCO3 could relate its genesis through extreme aridityand carbonate weathering (Al-Amry, 2008), ion exchange atfavorable lithology (Al-Bassam et al., 1997) and lack of peri-odic rainfall recharge. Further, ion exchange in groundwaterand host environment can be inferred through Chloro-alka-line indices (CAI) using equivalent concentrations of Cl, Na, K,SO4, HCO3, CO3 and NO3 (CAI-1 and CAI-2) (Schoeller,1965). The positive indices (in 96% sample) decipher BaseExchange reactions i.e., exchange of Na and K in water withMg and Ca at host environment (Shoeller, 1965; Garcia etal., 2001). The base exchange causes changes in the physicalproperties of soils causing deflocculating and permeabilityreduction (Todd, 1980).
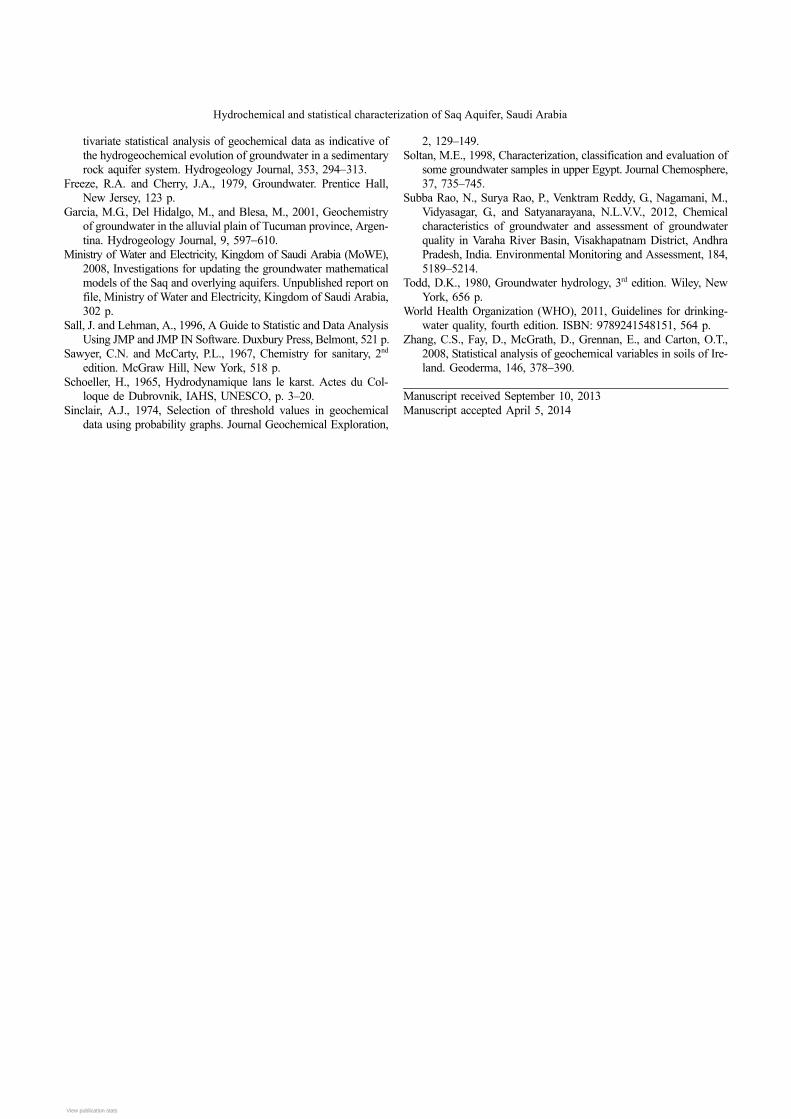
Alkalis have bonding affinity with Cl and SO4, show goodcorrelation with Cl and SO4 (r = 0.88) and also suggests thatalmost all alkalis are consumed while bonding with Cl andSO4 (Fig. 3). A good correlation indicates that this trend evolvedfrom a common source which is lithology of country rocksrather than anthropogenic origin (Subba Rao, 2012). Themeteoric genesis index (MGI) expressed by Na+ + K+ − Cl−/ SO4
2−; where all concentrations are in meq/l, helps in
determining whether groundwater source is of deep meteoricwater percolation type (MGI < 1) or shallow meteoric waterpercolation type (MGI > 1) (Soltan, 1998). The meteoric gen-esis indices demonstrated that most of the sample (96%)belongs to a deep meteoric water percolation type. Further,plot of Na with Cl shows a very good correlation (r = 0.9)indicating that halite dissolution could be the source ofgroundwater genesis. Besides, halite dissolution, the high Na/Clratios in groundwater may be explained by Na being derivedpredominantly from weathering of plagioclase in the overlyingbasaltic terrain. Samples away from 1:1 line on either sidesare suggestive of excess concentrations and possibility to havesecondary bonding affinity; Na with HCO3 and Cl with Ca.
The SO4 is showing a good correlation with Ca (r = 0.80)and with Mg (r = 0.78) suggests a possibility of originatingfrom source rocks containing dolomites and gypsum (Table 2).Apart from natural and geogenic processes, SO4 enrichmentmay enters groundwater system through different anthro-pogenic activity including sewage pollution, industrial wastes,specialized fertilizers etc. The spatial distribution of NO3,further advocates the widespread anthropogenic influenceon groundwater irrespective of lithology and depth.
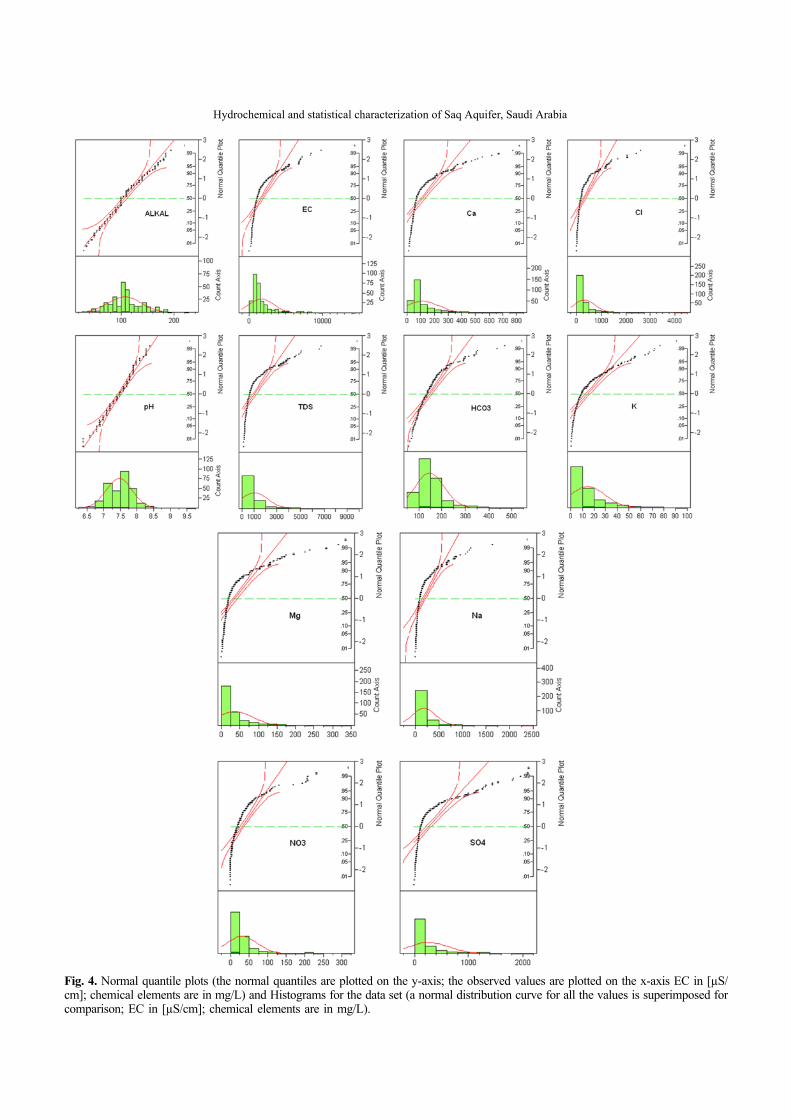
4.2. Histograms and Normal Quantile Diagrams
Probabilistic display delineates discrete populations thathave genetic or other affinities as line segments showingchanges in slope (i.e., kinks). The observed distributionsdiffer significantly from the synthetic distributions modeledby Sinclair (1974) and Zhang et al. (2008) for chemical dis-tributions. These pioneering authors appeared to superimposedifferent types of distributions having the same concentrationrange, which yielded curved changes in slope. The presentdata include elemental distributions with substantial overlapand curvatures. However, notable features are, in fact, the prom-inent role of line segments showing sharp angular change.Such features require largely discrete chemical subpopulations.
Histograms of data are shown in (Fig. 4) some elementshave high values, which are reflected in the histograms bydata being located on the right of the diagram (Fig. 4). Theseextreme values are well visualized on the normal quantilediagrams, and they are identified as outliers. Some elementshave values below or close to the detection limits (e.g., Na,K, Cl, NO3 and SO4) resulting in the high frequencies forthe lowest value group, near that limit of detection.
The frequency distributions of some of the elements arepositively skewed and include some very high values. Someextreme values appear (Cl, Mg, Na, EC, TDS, Ca, HCO3,K, SO4 and NO3) to be separated from the majority of thesamples, and do not appear to be part of a continuous dis-tribution (Fig. 4, Table 1). These extreme values might beregarded as evidence of natural or anthropogenic processes.
The normal quantile diagrams for data are shown in (Fig. 4).The straight-line segments are observed for some elements
Hydrochemical and statistical characterization of Saq Aquifer, Saudi Arabia
Fig. 4. Normal quantile plots (the normal quantiles are plotted on the y-axis; the observed values are plotted on the x-axis EC in [µS/cm]; chemical elements are in mg/L) and Histograms for the data set (a normal distribution curve for all the values is superimposed forcomparison; EC in [µS/cm]; chemical elements are in mg/L).
Yousef Nazzal, Izrar Ahmed, Nassir S.N.Al-Arifi, Habes Ghrefat, Awni Batayneh, Bassam A. Abuamarah, and Faisal K. Zaidi
including pH and Alkalinity. Samples below the detection limitform the vertical line on the left side of the diagram (e.g.,Na, Cl, NO3 and SO4). Most of the elements depart fromnormality towards the highest values, located on the rightside of the straight normal distribution line. The result isreferred to as the positively skewed or convex distributionfeature for most elements. Most of the elements demonstratesome form of convex shapes; they are composed of multiplegeochemical families and have closer to log-normal distri-butions. The diagrams provide useful information for outlierdetection. Many single samples are separated from the dis-tribution curve.
The diagrams indicate mixtures of populations or geochem-ical families by identified changes in slope for many elements.Most elements have high values, which are well visualizedin normal quantile diagrams (Fig. 4). The high concentrationsfor Ca, Mg, K and SO4 show a sharp reduction in slope at highconcentration values. These samples may are influenced bynatural or anthropogenic processes. Most elements shows acloser approach to normality with some departures fromnormality occurring in the highest values, located on the rightside of the straight normal distribution line.
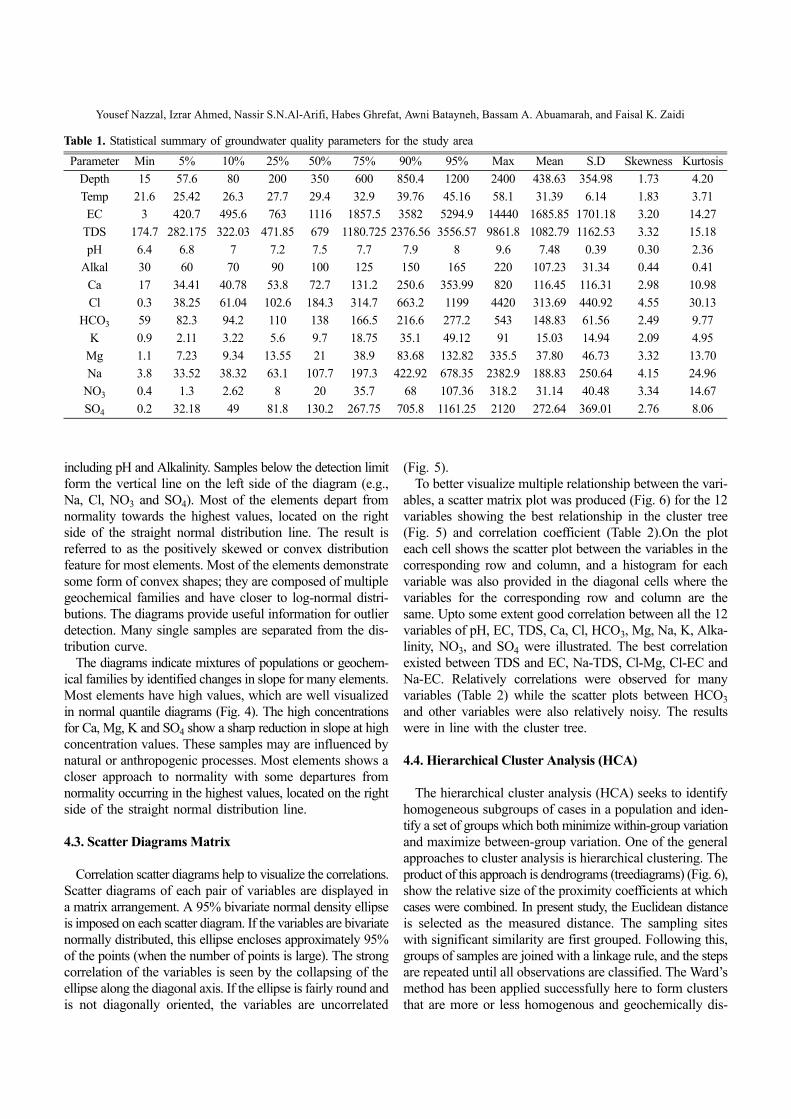
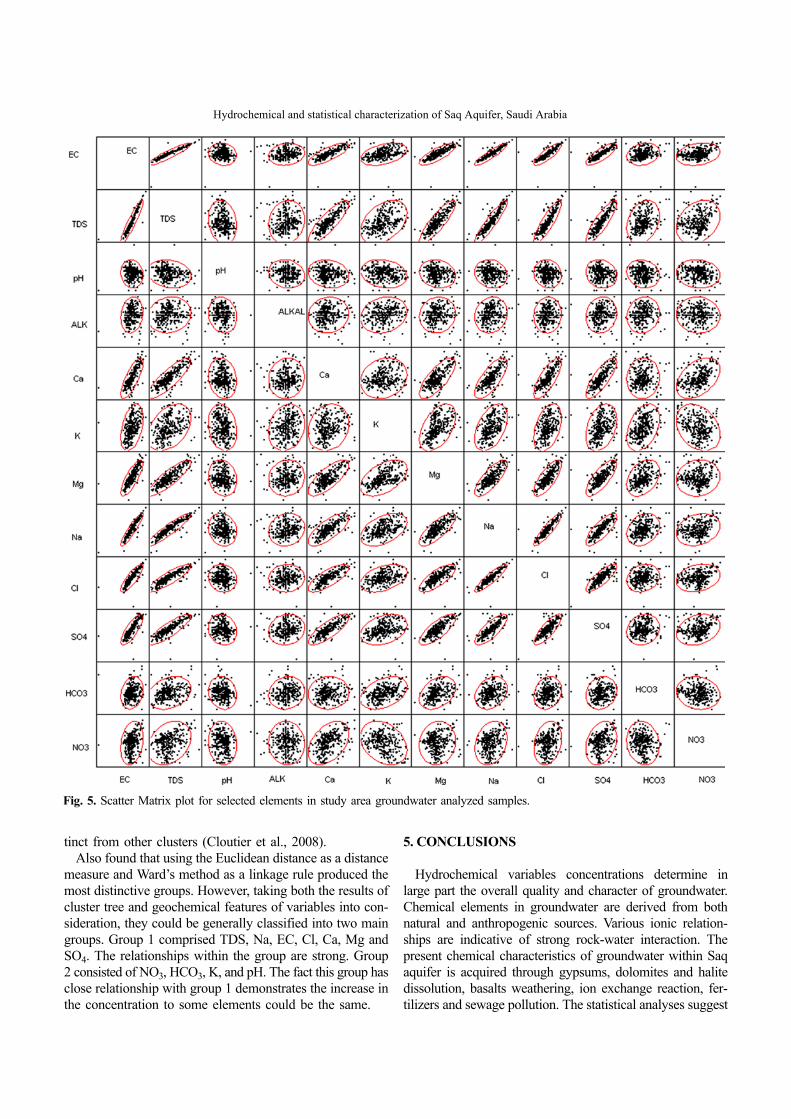
4.3. Scatter Diagrams Matrix
Correlation scatter diagrams help to visualize the correlations.Scatter diagrams of each pair of variables are displayed ina matrix arrangement. A 95% bivariate normal density ellipseis imposed on each scatter diagram. If the variables are bivariatenormally distributed, this ellipse encloses approximately 95%of the points (when the number of points is large). The strongcorrelation of the variables is seen by the collapsing of theellipse along the diagonal axis. If the ellipse is fairly round andis not diagonally oriented, the variables are uncorrelated
(Fig. 5).To better visualize multiple relationship between the vari-
ables, a scatter matrix plot was produced (Fig. 6) for the 12variables showing the best relationship in the cluster tree(Fig. 5) and correlation coefficient (Table 2).On the ploteach cell shows the scatter plot between the variables in thecorresponding row and column, and a histogram for eachvariable was also provided in the diagonal cells where thevariables for the corresponding row and column are thesame. Upto some extent good correlation between all the 12variables of pH, EC, TDS, Ca, Cl, HCO3, Mg, Na, K, Alka-linity, NO3, and SO4 were illustrated. The best correlationexisted between TDS and EC, Na-TDS, Cl-Mg, Cl-EC andNa-EC. Relatively correlations were observed for manyvariables (Table 2) while the scatter plots between HCO3and other variables were also relatively noisy. The resultswere in line with the cluster tree.
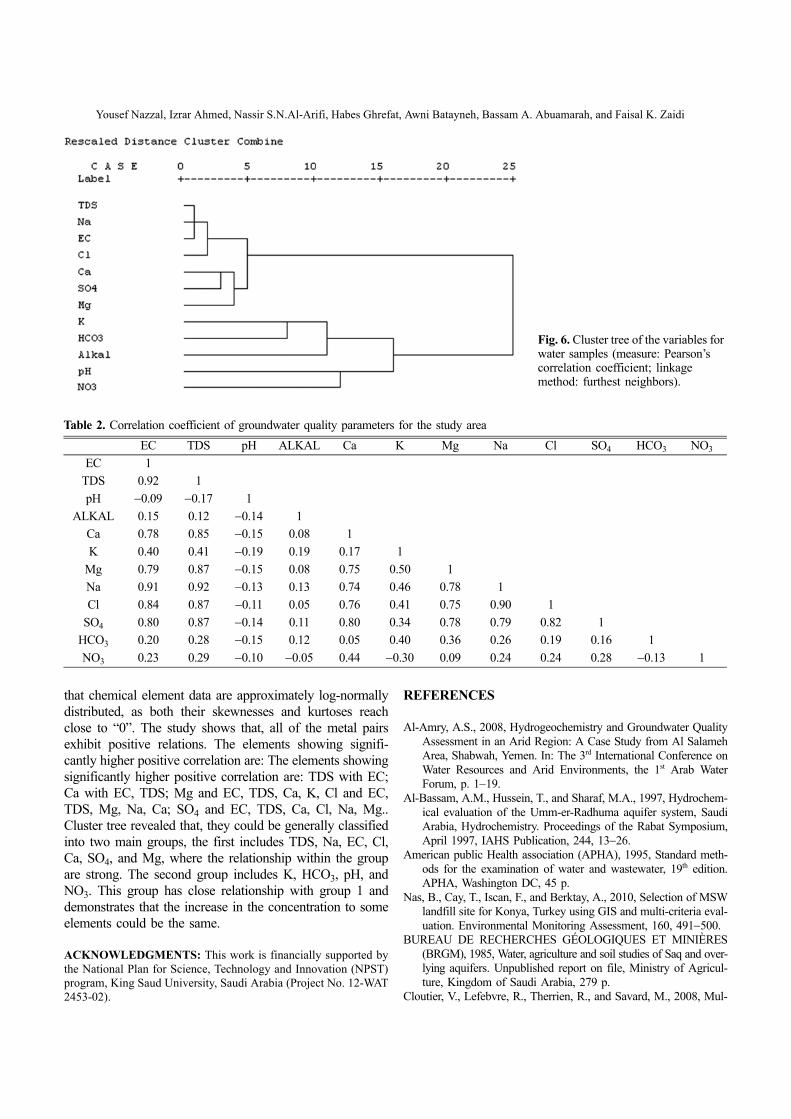
4.4. Hierarchical Cluster Analysis (HCA)
The hierarchical cluster analysis (HCA) seeks to identifyhomogeneous subgroups of cases in a population and iden-tify a set of groups which both minimize within-group variationand maximize between-group variation. One of the generalapproaches to cluster analysis is hierarchical clustering. Theproduct of this approach is dendrograms (treediagrams) (Fig. 6),show the relative size of the proximity coefficients at whichcases were combined. In present study, the Euclidean distanceis selected as the measured distance. The sampling siteswith significant similarity are first grouped. Following this,groups of samples are joined with a linkage rule, and the stepsare repeated until all observations are classified. The Ward’smethod has been applied successfully here to form clustersthat are more or less homogenous and geochemically dis-
Table 1. Statistical summary of groundwater quality parameters for the study areaParameter Min 5% 10% 25% 50% 75% 90% 95% Max Mean S.D Skewness Kurtosis
Hydrochemical and statistical characterization of Saq Aquifer, Saudi Arabia
tinct from other clusters (Cloutier et al., 2008).Also found that using the Euclidean distance as a distance
measure and Ward’s method as a linkage rule produced themost distinctive groups. However, taking both the results ofcluster tree and geochemical features of variables into con-sideration, they could be generally classified into two maingroups. Group 1 comprised TDS, Na, EC, Cl, Ca, Mg andSO4. The relationships within the group are strong. Group2 consisted of NO3, HCO3, K, and pH. The fact this group hasclose relationship with group 1 demonstrates the increase inthe concentration to some elements could be the same.
5. CONCLUSIONS
Hydrochemical variables concentrations determine inlarge part the overall quality and character of groundwater.Chemical elements in groundwater are derived from bothnatural and anthropogenic sources. Various ionic relation-ships are indicative of strong rock-water interaction. Thepresent chemical characteristics of groundwater within Saqaquifer is acquired through gypsums, dolomites and halitedissolution, basalts weathering, ion exchange reaction, fer-tilizers and sewage pollution. The statistical analyses suggest
Fig. 5. Scatter Matrix plot for selected elements in study area groundwater analyzed samples.
Yousef Nazzal, Izrar Ahmed, Nassir S.N.Al-Arifi, Habes Ghrefat, Awni Batayneh, Bassam A. Abuamarah, and Faisal K. Zaidi
that chemical element data are approximately log-normallydistributed, as both their skewnesses and kurtoses reachclose to “0”. The study shows that, all of the metal pairsexhibit positive relations. The elements showing signifi-cantly higher positive correlation are: The elements showingsignificantly higher positive correlation are: TDS with EC;Ca with EC, TDS; Mg and EC, TDS, Ca, K, Cl and EC,TDS, Mg, Na, Ca; SO4 and EC, TDS, Ca, Cl, Na, Mg..Cluster tree revealed that, they could be generally classifiedinto two main groups, the first includes TDS, Na, EC, Cl,Ca, SO4, and Mg, where the relationship within the groupare strong. The second group includes K, HCO3, pH, andNO3. This group has close relationship with group 1 anddemonstrates that the increase in the concentration to someelements could be the same.
ACKNOWLEDGMENTS: This work is financially supported bythe National Plan for Science, Technology and Innovation (NPST)program, King Saud University, Saudi Arabia (Project No. 12-WAT2453-02).
REFERENCES
Al-Amry, A.S., 2008, Hydrogeochemistry and Groundwater QualityAssessment in an Arid Region: A Case Study from Al SalamehArea, Shabwah, Yemen. In: The 3rd International Conference onWater Resources and Arid Environments, the 1st Arab WaterForum, p. 1−19.
Al-Bassam, A.M., Hussein, T., and Sharaf, M.A., 1997, Hydrochem-ical evaluation of the Umm-er-Radhuma aquifer system, SaudiArabia, Hydrochemistry. Proceedings of the Rabat Symposium,April 1997, IAHS Publication, 244, 13−26.
American public Health association (APHA), 1995, Standard meth-ods for the examination of water and wastewater, 19th edition.APHA, Washington DC, 45 p.
Nas, B., Cay, T., Iscan, F., and Berktay, A., 2010, Selection of MSWlandfill site for Konya, Turkey using GIS and multi-criteria eval-uation. Environmental Monitoring Assessment, 160, 491−500.
BUREAU DE RECHERCHES GÉOLOGIQUES ET MINIÈRES(BRGM), 1985, Water, agriculture and soil studies of Saq and over-lying aquifers. Unpublished report on file, Ministry of Agricul-ture, Kingdom of Saudi Arabia, 279 p.
Cloutier, V., Lefebvre, R., Therrien, R., and Savard, M., 2008, Mul-
Table 2. Correlation coefficient of groundwater quality parameters for the study areaEC TDS pH ALKAL Ca K Mg Na Cl SO4 HCO3 NO3
Fig. 6. Cluster tree of the variables for water samples (measure: Pearson’s correlation coefficient; linkage method: furthest neighbors).
Hydrochemical and statistical characterization of Saq Aquifer, Saudi Arabia
tivariate statistical analysis of geochemical data as indicative ofthe hydrogeochemical evolution of groundwater in a sedimentaryrock aquifer system. Hydrogeology Journal, 353, 294−313.
Freeze, R.A. and Cherry, J.A., 1979, Groundwater. Prentice Hall,New Jersey, 123 p.
Garcia, M.G., Del Hidalgo, M., and Blesa, M., 2001, Geochemistryof groundwater in the alluvial plain of Tucuman province, Argen-tina. Hydrogeology Journal, 9, 597−610.
Ministry of Water and Electricity, Kingdom of Saudi Arabia (MoWE),2008, Investigations for updating the groundwater mathematicalmodels of the Saq and overlying aquifers. Unpublished report onfile, Ministry of Water and Electricity, Kingdom of Saudi Arabia,302 p.
Sall, J. and Lehman, A., 1996, A Guide to Statistic and Data AnalysisUsing JMP and JMP IN Software. Duxbury Press, Belmont, 521 p.
Sawyer, C.N. and McCarty, P.L., 1967, Chemistry for sanitary, 2nd
edition. McGraw Hill, New York, 518 p.Schoeller, H., 1965, Hydrodynamique lans le karst. Actes du Col-
loque de Dubrovnik, IAHS, UNESCO, p. 3–20.Sinclair, A.J., 1974, Selection of threshold values in geochemical
data using probability graphs. Journal Geochemical Exploration,
2, 129–149.Soltan, M.E., 1998, Characterization, classification and evaluation of
some groundwater samples in upper Egypt. Journal Chemosphere,37, 735–745.
Subba Rao, N., Surya Rao, P., Venktram Reddy, G., Nagamani, M.,Vidyasagar, G., and Satyanarayana, N.L.V.V., 2012, Chemicalcharacteristics of groundwater and assessment of groundwaterquality in Varaha River Basin, Visakhapatnam District, AndhraPradesh, India. Environmental Monitoring and Assessment, 184,5189–5214.
World Health Organization (WHO), 2011, Guidelines for drinking-water quality, fourth edition. ISBN: 9789241548151, 564 p.
Zhang, C.S., Fay, D., McGrath, D., Grennan, E., and Carton, O.T.,2008, Statistical analysis of geochemical variables in soils of Ire-land. Geoderma, 146, 378−390.
Manuscript received September 10, 2013Manuscript accepted April 5, 2014