20
| Date post: | 17-Jul-2015 |
| Category: |
Economy & Finance |
| Upload: | grape |
| View: | 41 times |
| Download: | 0 times |

Up or down the value chain?A comparative analysis of the GVC position of the economies of the
NMS
Jan Hagemejer1 & Mahdi Ghodsi2
1NBP & University of Warsaw 2WIIW & UoWFunded by NSC grant no 2013/09/D/HS4/01519
February 27, 2015

Motivation: NMS production shares
Source: WIOD
I NMS maintain a high share of manufacturing in total output...
I ...despite ongoing growth in the service sector
I �The NMS are the backbone of the German manufacturing�

Motivation (2): NMS trade partners shares
Figure: Trade structure
Source: WIOD
I European integration has brought a relative increase of intra-NMStrade...
I ... but the fragmentation and globalization processes have boostedimports and exports from/to China and RoW
I International trade in substitutes or complements (competition vscooperation)?

Motivation (3): NMS production and trade structure
Figure: Imports, exports and output
Figure: Share of intermediates in exports and imports

Questions
I Q: What is the overall position of the NMS in the global value chain(GVC)?
I Q: Do NMS compete with China and other emerging markets or theEU15?
I Q: What is the sectoral composition of output that determines theposition of countries in the GVC?
I A: (Relatively) new data sources
I A: The upstreamness measure - the distance from �nal demand.
I This work is an INPUT to a larger project.

Upstreamness measure (1)
I Antras, Chor, Fally, and Hillberry [2012]: Output of sector is a sumof the �nal and intermediate demand
Yi = Xi+N∑j=1
zijYj
I Substituting recursively:
Yi = Xi+N∑j=1
zijXj+N∑j=1
N∑k=1
zijzjkXj+N∑j=1
N∑k=1
N∑l=1
zijzjkzklXj + · · ·
I Each element corresponds to one production stage. The distancefrom �nal demand is de�ned as a weighted average:
ui = 1· Xi
Yi+2·
N∑j=1
zijXj
Yi+3·
N∑j=1
N∑k=1
zijzjkXj
Yi+4·
N∑j=1
N∑k=1
N∑l=1
zijzjkzklXj
Yi+· · ·
(if only �nal demandui = 1)
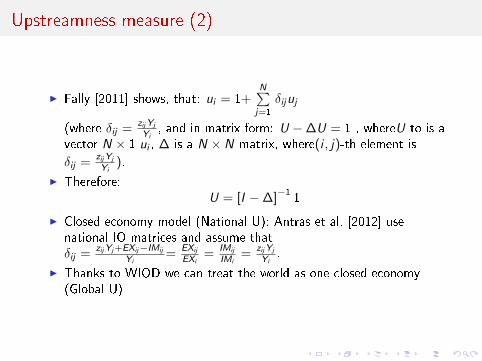
Upstreamness measure (2)
I Fally [2011] shows, that: ui = 1+N∑j=1
δijuj
(where δij =zijYj
Yi, and in matrix form: U − ∆U = 1 , whereU to is a
vector N × 1 ui , ∆ is a N × N matrix, where(i , j)-th element is
δij =zijYj
Yi).
I Therefore:U = [I − ∆]−1
1
I Closed economy model (National U): Antras et al. [2012] usenational IO matrices and assume thatδij =
zijYj+EXij−IMij
Yi=
EXij
EXi=
IMij
IMi=
zijYj
Yi.
I Thanks to WIOD we can treat the world as one closed economy(Global U)
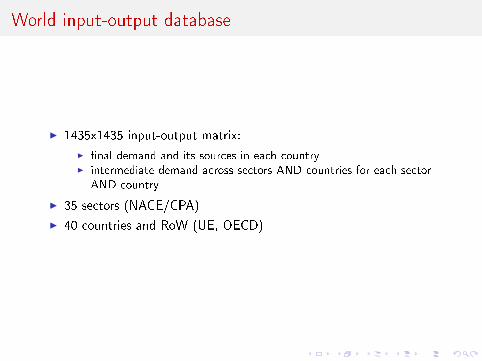
World input-output database
I 1435x1435 input-output matrix:
I �nal demand and its sources in each countryI intermediate demand across sectors AND countries for each sector
AND country
I 35 sectors (NACE/CPA)
I 40 countries and RoW (UE, OECD)

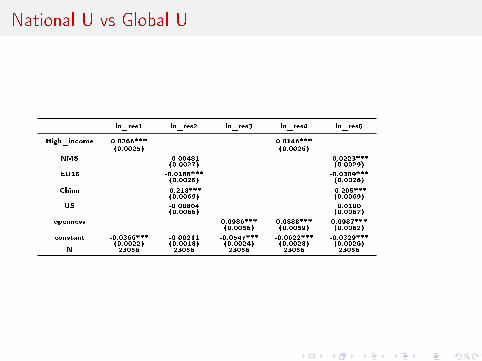
National U vs Global U
Figure: Global vs country-level upstreamness
Source: own calculations using WIOD data.
National U vs Global U
ln_res1 ln_res2 ln_res3 ln_res4 ln_res5
High_income 0.0266*** 0.0146***(0.0025) (0.0026)
NMS -0.00481 -0.0223***(0.0027) (0.0029)
EU15 -0.0188*** -0.0309***(0.0025) (0.0026)
China -0.218*** -0.205***(0.0069) (0.0069)
US -0.00804 0.0100(0.0066) (0.0067)
openness 0.0986*** 0.0888*** 0.0987***(0.0056) (0.0059) (0.0062)
constant -0.0366*** -0.00211 -0.0547*** -0.0622*** -0.0329***(0.0022) (0.0018) (0.0024) (0.0028) (0.0026)
N 23056 23056 23056 23056 23056

Global U: ongoing fragmentation and growth ofmanufacturing
Figure: Global and sectoral U. Shares in global output
Source: own calculations using WIOD data.

Manufacturing vs Overall Economies
Figure: Overall U (L) vs U for manufacturing (R)
Source: own calculations using WIOD data.

Imports vs exports
Figure: U weighted by exports and imports
Source: own calculations using WIOD data.
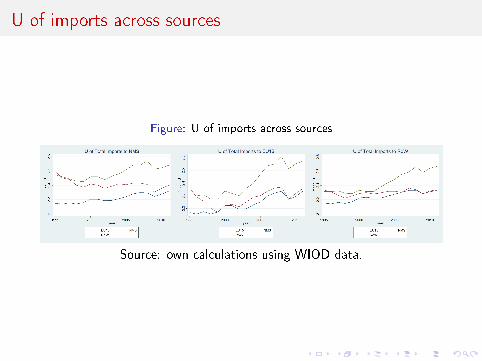
U of imports across sources
Figure: U of imports across sources
Source: own calculations using WIOD data.

Evolution of manufacturing structures
Figure: Evolution of industry shares for NMS
Source: own calculations using WIOD data.

Structure of manufacturing
Table: Structure of NMS manufacturing in 2011
Sector Share in output Share in exports
Leather, Leather and Footwear 0,6% 1,0%
Wood and Products of Wood and Cork 3,0% 2,0%
Textiles and Textile Products 3,0% 4,0%
Manufacturing, Nec; Recycling 3,7% 4,3%
Other Non-Metallic Mineral 4,1% 2,0%
Pulp, Paper, Paper , Printing and Publishing 4,7% 2,6%
Rubber and Plastics 5,5% 5,5%
Chemicals and Chemical Products 6,4% 8,1%
Coke, Re�ned Petroleum and Nuclear Fuel 6,9% 4,4%
Machinery, Nec 7,6% 9,7%
Electrical and Optical Equipment 11,8% 19,0%
Basic Metals and Fabricated Metal 13,2% 11,9%
Transport Equipment 14,0% 18,8%
Food, Beverages and Tobacco 15,4% 6,7%
Source: own calculations using WIOD

Selected sectors (with high output shares)

Across NMS...
Figure: U of the NMS (export-weighted)
Source: own calculations using WIOD data.

The pipeline
I Local vs global U:
I distill EU integration e�ects from world trendsI sectoral composition vs within sector changesI geographical composition vs sectoral compostition.
I U as a determinant of bilateral value added trade �ows
I Upstreamness vs domestic VA in exports - how does the relativeposition in the GVC translate to domestic VA creation?
I Upstreamness vs knowledge spillovers from FDI - do technologyspillovers depend on the distance from �nal demand?

Bibliography
Pol Antras, Davin Chor, Thibault Fally, and Russell Hillberry. Measuringthe Upstreamness of Production and Trade Flows. American Economic
Review, 102(3):412�16, May 2012.
Thibault Fally. On the fragmentation of production in the us. Universityof Colorado mimeo, 2011.


