IJSRST173813 | Received : 08 Nov 2017 | Accepted : 27 Nov 2017 | November-December-2017 [(3)8: 359-368]
© 2017 IJSRST | Volume 3 | Issue 8 | Print ISSN: 2395-6011 | Online ISSN: 2395-602X Themed Section: Science and Technology
359
A Comparative Model Approach to Pore Pressure Prediction Applied to
Central/Coastal Swamp Depobelt of the Niger Delta Basin Mkpese Ubon Udofia, Ekine Anthony Sotonye
Department of Physics, University of Port Harcourt, Rivers State, Nigeria
ABSTRACT
Overpressured zones and porosity values in shale beds have been estimated for selected fields of the central/coastal
swamp depo-belts of the Niger Delta. Pore pressure prediction (PPP), when done accurately can be used to avert
disaster and helps in safe drilling. Eaton‟s sonic model, Bowers‟ model and Zhang‟s porosity-based model have
been applied to predict overpressures using petrophysical log data from six 6 wells, each representing a field of the
studied area. Predicted zones of hard overpressures (HOVP > 0.70 psi/ft) are generally below the depth of 10000ft.
Top of geopressures (TOG) for the case study wells; WELL_A, WELL_B, WELL_D, WELL_G, WELL_H and
WELL_K are 7000ft, 10500ft, 10000ft, 12500ft, 9000ft and 10400ft respectively. Eaton exponent „5.5‟ and Bowers
model plotted with robust matches to measured pore pressures (MPP) everywhere except in one well. The porosity
model equally yielded better matches to MPPs with higher values of fluid-transit-times typical of hydrocarbon fluid
type (oil). These suggest, in combination with Vp-density analyses, a strong evidence of secondary mechanism
causing overpressure in the basin. Very hard overpressures characterizes the deeper section of the basin (lower part
of Agbada formation) at most of the well locations suggesting a strong evidence of fluid expansion mechanism
which is also related to sediments unloading. The robust concordance between PPP and MPP profiles validates the
results here and is a better guide for future drilling.
Keywords : Eaton‟s Model, Pore Pressure Prediction, Disequilibrium Compaction, Niger Delta, Porosity Model,
Overpressure Mechanism, Unloading Mechanism.
I. INTRODUCTION
Pore pressure is one essential phenomenon that must be
studied. Accurately predicting pore pressure is very
important in exploration, de-risking of hydrocarbons,
appraisal, reservoir integration studies, well design and
the drilling of wells in a safe and cost-effective manner.
Prediction difficulties are usually encountered in some
geologic settings with complexities and inaccurate
prediction would also be the outcome when“pressure-
generating mechanisms” are not properly diagnosed. A
few authors have reported on the overpressures
distribution in “the Niger Delta basin” and its
mechanism of generation (Anowai et al., 2003 and
Nwozor et al., 2013).
The basic principle underlying overpressure prediction
from log is that overpressured sedimentary rocks
maintain anomalously higher porosity than they do in
normally pressured zones. In formations with normal
pressures, pore fluids communicate efficiently with
surface during burial. Therefore, the fluids in the pore
spaces are squeezed out following normal compaction
rate and results to hydrostatic pressure regime.
Meanwhile the lithostatic (overburden pressure), S, is
the pressure resulting from weight of rock matrix and
pore fluids combined that is overlying the formation of
consideration. Mathematically, this is written as
(equation 1):
∫
(1)
Where is the bulk density dependent on depth and
given by;
(2)
where ϕ, , and are respectively the porosity,
density of pore fluid and grain density or rock matrix
densiy.
International Journal of Scientific Research in Science and Technology (www.ijsrst.com)
360
The resultant different between overburden pressure, S,
and pore pressure Pp gives us the differential pressure or
effective pressure and its acts on the rock matrix. This
effective pressure is given as:
σ = –
(3)
The poro-elastic coefficient, , is introduced in
Terzaghi‟s original equation when applied to
consolidated rocks to take care decreasing effect in fluid
pressure now applied on less of the grain surface.
Generally, ≤ 1 but the values between 0.7 and 1.0 are
commonly used. For overpressured rocks, is usually
around 0.8 (Ugwu, 2015). The process of sediment
compaction is actually controlled by the effective stress
and as such if the effective stress is reduced in anyway,
then compaction rate is slowed down.
Accurate prediction of geopressures would, however,
depend on the suitability of prediction model chosen for
the sedimentary basin under study, the prediction expert,
data availability and not limited to these alone. This
work is aimed at predicting zones that are overpressured
within the sediments of some fields in the central/coastal
swamp depo-belts of the Niger Delta basin by
comparative models method. Several models of
prediction exist but those of Eaton, Bowers and Zhang
(Eaton, 1975; Bowers, 1995 and Zhang, 2011) were
applied, taking into consideration the uniqueness of each
of the methods and equally examine their suitabilities to
the Niger Delta sedimentary formations.
Study location, Geologic Setting and Clay
Mineralogy
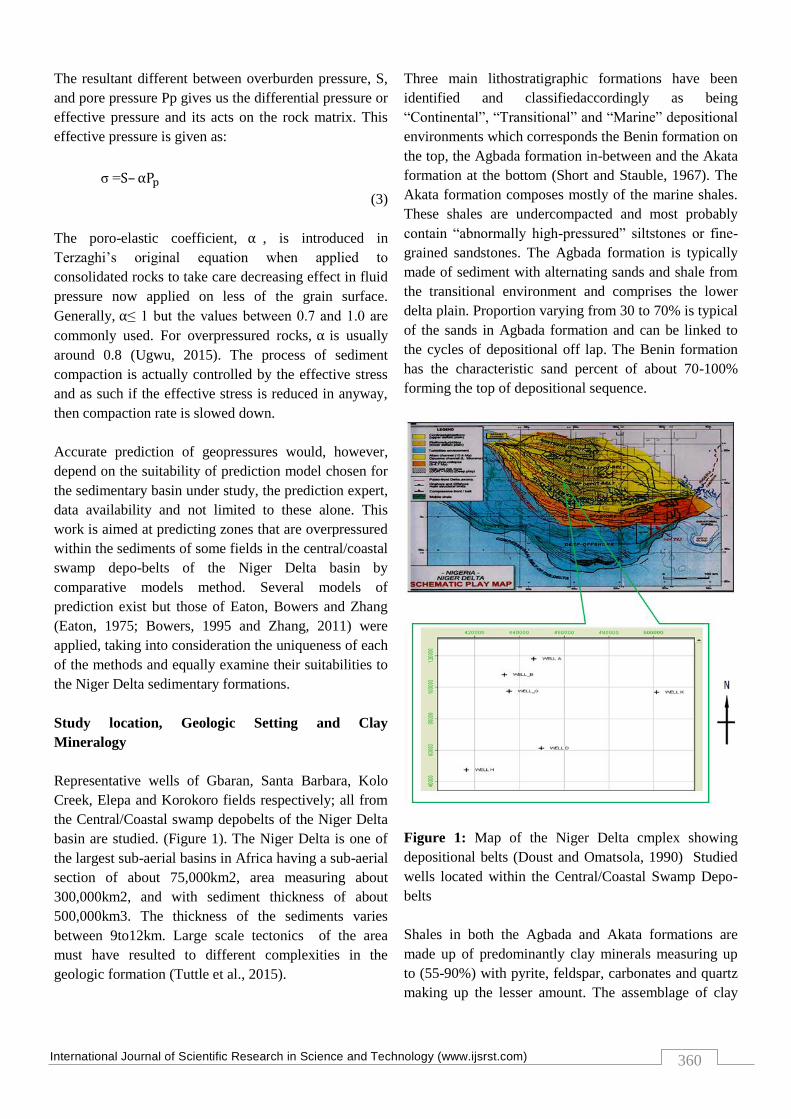
Representative wells of Gbaran, Santa Barbara, Kolo
Creek, Elepa and Korokoro fields respectively; all from
the Central/Coastal swamp depobelts of the Niger Delta
basin are studied. (Figure 1). The Niger Delta is one of
the largest sub-aerial basins in Africa having a sub-aerial
section of about 75,000km2, area measuring about
300,000km2, and with sediment thickness of about
500,000km3. The thickness of the sediments varies
between 9to12km. Large scale tectonics of the area
must have resulted to different complexities in the
geologic formation (Tuttle et al., 2015).
Three main lithostratigraphic formations have been
identified and classifiedaccordingly as being
“Continental”, “Transitional” and “Marine” depositional
environments which corresponds the Benin formation on
the top, the Agbada formation in-between and the Akata
formation at the bottom (Short and Stauble, 1967). The
Akata formation composes mostly of the marine shales.
These shales are undercompacted and most probably
contain “abnormally high-pressured” siltstones or fine-
grained sandstones. The Agbada formation is typically
made of sediment with alternating sands and shale from
the transitional environment and comprises the lower
delta plain. Proportion varying from 30 to 70% is typical
of the sands in Agbada formation and can be linked to
the cycles of depositional off lap. The Benin formation
has the characteristic sand percent of about 70-100%
forming the top of depositional sequence.
Figure 1: Map of the Niger Delta cmplex showing
depositional belts (Doust and Omatsola, 1990) Studied
wells located within the Central/Coastal Swamp Depo-
belts
Shales in both the Agbada and Akata formations are
made up of predominantly clay minerals measuring up
to (55-90%) with pyrite, feldspar, carbonates and quartz
making up the lesser amount. The assemblage of clay
International Journal of Scientific Research in Science and Technology (www.ijsrst.com)
361
mineral comprises of 35-60% kaoline, 20-50% smectite
and 10-30% illnite. Burial diagenesis has such effect on
clay mineralogy in shales within these formations which
appear to its minimal. Temperature of burial principally
controls the diagenetic process even though other factor
also may contribute their influence to smectite
transformation, mixed-layer phase, overburden pressure,
reaction rates and pore water chemistry (Lambert-
Aikhionbare and Shaw, 1982).
Overpressure-Generating Mechanisms and
Identification Methods
Known causes of overpressures include (Bower, 1995;
Osborne and Swarbrick, 1997; Swarbrick and Osborne ,
1998 and Traugott 1997):
1. Mechanically induced Mechanisms which are
mechanical compaction disequilibrium in low
permeability sediments, and lateral stresses or
compressive tectonics.
2. Thermally/Chemically Induced Mechanisms relating
to normal loading of sediments and are referred to as
“secondary mechanisms”. They are processes
involving volume-alteration (fluid expansion)
including such like hydrocarbon generation and
maturation, diagenesis of clay minerals, and sea
water expansion; they dominate in this group.
3. Dynamic Transfers and Other Minor Mechanisms
including such processes like hydraulic head,
osmosis, lateral drainage and buoyancy effect
arising from contrast in density. Piezometric fluid
level and thermodynamic processes are other two
potential causal mechanisms.
In the Niger Delta basin, undercompaction is seen as the
number one cause of overpressures. Most recent
researches, however, support other causes.
Various authors (Bowers, 1995; Zhang, 2011; Kumar et
al., 2012) have been able to show that plotting certain
petrophysical parameters together can provide useful
information on overpressure mechanisms at play. The
cross-plots of vertical effective stress and velocity
(VES-Vp), vertical effective stress and density (VES-
density), and velocity against density are effective
analyzing tools for this purpose. On the plots,
disequilibrium compaction goes alone the normal/virgin
curve. Various secondary mechanisms such as an
unloading episode can be identified when there is a
significant deviation from the normal trend; the
deviation can equally be a reflection of a change in shale
composition. Figure 2 shows a standard model for
identifying overpressure generation mechanisms.
Figure 2: Standard Hoesni-type curves from velocity-
density cross-plots with associated “overpressure
generating mechanisms” (O‟Connor et al., 2011)
II. METHODS AND MATERIAL
Pore pressure prognosis studies yield results
depending on the data quality used and the
techniques applied. In this study, overpressured
zones are predicted using petrophysical log data
obtained from six 6 exploration wells in the
Central/Coastal swamp depositional belts of the
Niger Delta. The data were made available by Shell
Petroleum Development Company (SPDC), Port
Harcourt. The Eaton‟s, Bowers‟ and Porosity based
prediction methods were applied on the RokDoc
software. The first two models are inbuilt on the
software while the porosity based model (Zhang,
2011) was inputted to the software by means of log
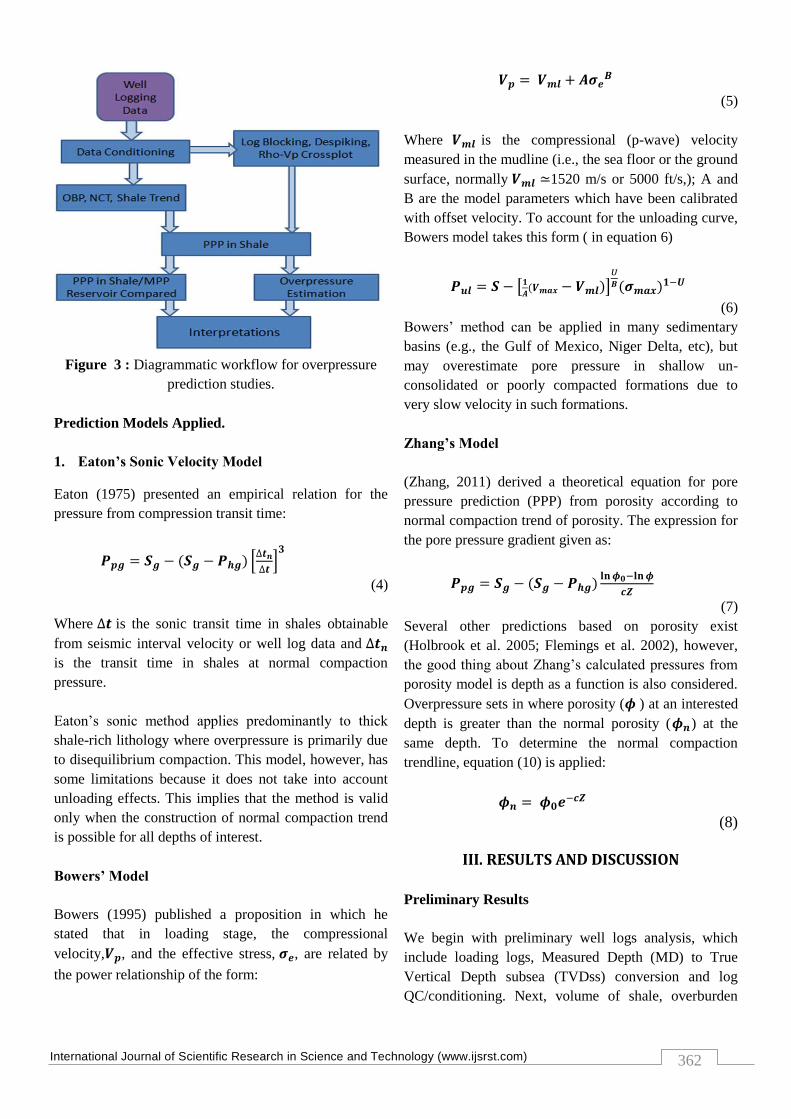
calculator function. Figure 3 is the adopted
workflow pattern.
International Journal of Scientific Research in Science and Technology (www.ijsrst.com)
362
Figure 3 : Diagrammatic workflow for overpressure
prediction studies.
Prediction Models Applied.
1. Eaton’s Sonic Velocity Model
Eaton (1975) presented an empirical relation for the
pressure from compression transit time:
[
]
(4)
Where is the sonic transit time in shales obtainable
from seismic interval velocity or well log data and
is the transit time in shales at normal compaction
pressure.
Eaton‟s sonic method applies predominantly to thick
shale-rich lithology where overpressure is primarily due
to disequilibrium compaction. This model, however, has
some limitations because it does not take into account
unloading effects. This implies that the method is valid
only when the construction of normal compaction trend
is possible for all depths of interest.
Bowers’ Model
Bowers (1995) published a proposition in which he
stated that in loading stage, the compressional
velocity, , and the effective stress, , are related by
the power relationship of the form:
(5)
Where is the compressional (p-wave) velocity
measured in the mudline (i.e., the sea floor or the ground
surface, normally 1520 m/s or 5000 ft/s,); A and
B are the model parameters which have been calibrated
with offset velocity. To account for the unloading curve,
Bowers model takes this form ( in equation 6)
[ ]
(6)
Bowers‟ method can be applied in many sedimentary
basins (e.g., the Gulf of Mexico, Niger Delta, etc), but
may overestimate pore pressure in shallow un-
consolidated or poorly compacted formations due to
very slow velocity in such formations.
Zhang’s Model
(Zhang, 2011) derived a theoretical equation for pore
pressure prediction (PPP) from porosity according to
normal compaction trend of porosity. The expression for
the pore pressure gradient given as:
(7)
Several other predictions based on porosity exist
(Holbrook et al. 2005; Flemings et al. 2002), however,
the good thing about Zhang‟s calculated pressures from
porosity model is depth as a function is also considered.
Overpressure sets in where porosity ( ) at an interested
depth is greater than the normal porosity ( ) at the
same depth. To determine the normal compaction
trendline, equation (10) is applied:
(8)
III. RESULTS AND DISCUSSION
Preliminary Results
We begin with preliminary well logs analysis, which
include loading logs, Measured Depth (MD) to True
Vertical Depth subsea (TVDss) conversion and log
QC/conditioning. Next, volume of shale, overburden
International Journal of Scientific Research in Science and Technology (www.ijsrst.com)
363
gradient, normal-compaction-trend, shale trend and
porosity are generated from various logs which are the
required variables for the various models to be used in
this work. The models applied include the Eaton's Model,
Bower's Model and PPP from Porosity. Finally, the
results of predictions are presented, compared and
discussed. Preliminary analysis were done for all the
wells but are only a few are demonstrated here for well
A (Figure 5and 6)
One Dimensional (1-D) Predicted Pore Pressure (PPP)
in Shale
Thick shale beds were considered for the predictions and
prediction points picked were at depths within the shale
beds where washouts are minimal or even without
washouts at all. The responses of logs to overpressure
are easily noticeable in thick shale beds, hence, the
choice of them for prediction. Sand formations allow for
easy dewatering during “sediment compaction” and are
more porous. This would usually not support
overpressure build-ups giving reverse log responses.
Also, washout zones are interpretations from the caliper
log data which describes how deviated the diameter of
the wellbore is from normal; this also may affect the
results of predictions. This is because the widening of
the wellbore, in the first place, would reduce the
accuracy of logging data.
Key logs requirement for the 1-D prediction were
conditioned and checked for quality. Measured pore
pressures (MPPs) in the form of repeat formation tester
(RFT) data and predicted pore pressures (PPPs) from the
three models; Results from the analysis reveal the
presence of mild overpressures at all depths in well A
location. The calculation is done using the depth-
dependent porosity compaction model and Wyllie
transit-time equation (Zhang, 2011) with = 73µs/ft,
=200µs/ft, C = 0.00016 /ft and mudline porosity
( ) for well A, the result is presented in figure 4
and shows fair
Figure 4 : Pressure-Depth plot showing top of
overpressure for well A.
Figure 4 presents an interpreted section of pressure-
depth plot for well A. In the Niger Delta area generally,
hydrostatic pressure gradient averages to a value of
about 0.44psi/fit for the fresh water formations and
0.46psi/ft for the saline water formations.
The result shows that well A maintains hydrostatic
pressure mudline to a depth of about 7000ft where an
onset of overpressure measuring between 0.55 and 0.60
psi/ft are predicted.The responses from “key logs”
compared with standard models also confirm the
presence of overpressures in the well. Robust matches
also exist between the Measure Pressure (MPP) and
Predicted Pressures at the well location, a result which
approves the suitability of prediction models used.
Formation pressure gradient averaging about 0.65 psi/ft
is observed; falling to the class called mild
overpressure. The “mild overpressures” are seen
continuing steadily down to about 11000ft beyond
which “hard overpressures” measuring up to about
0.80psi/ft are observed.
International Journal of Scientific Research in Science and Technology (www.ijsrst.com)
364
Other Case-Study Wells
All case study wells were chosen because of the history
of overpressures of their associated fields. Predictions
from all three models applied to the wells confirm that
overpressures are present at the well locations.
All Eaton‟s plots were calculated using exponent of „5.5‟
except in well H where exponents higher than „3‟
yielded over predictions. Generally, in applying the
Bowers model to the wells, the parameters A and B were
set to the range of values 2.0000 to 2.26206 and 0.89 to
1.00 respectively. For the porosity model, suitable transit
times were inputted in the calculation of the porosities
and compaction constant were computed from the
constructed normal compaction porosity trends. The
values for each well set are; WELL B ( = 72µs/ft,
=224µs/ft, C = 0.00020); WELL D ( =
70µs/ft, =219µs/ft, C = 0.00023); WELL G
( = 73µs/ft, =237µs/ft, C = 0.00012); WELL
K ( = 79µs/ft, =239µs/ft, C = 0.00053) and
WELL H ( = 73µs/ft, =209µs/ft, C = 0.00042).
Mudline porosity value used for all studied wells
is .
Discussion of Results from Other Case study Wells
Results from all the case studies indicate the presence of
overpressured zones, hydrostatic formations and even
zones characterized with certain degrees of
underpressures. Top of overpressures are generally
within depth of 6000ft to about 12500ft across all
studied wells; mild overpressures are observed at
shallow depths while hard overpressures occur at depths
generally below 10000ft (TVDss) for all studied wells.
Well B (Figure 8) is characterized with hydrostatic
pressure from the beginning to about 10500ft where very
mild overpressure (<0.6psi/ft) sets in. Hard
overpressures zone predicted at about a depth of 15500ft
to about 16000ft where the well is terminated probably
suggesting why the well is terminated at that depth
(MPP values approaching lithostatic pressure). All PPPs
from the “prediction models” each compares favorably
with MPPs except at the terminating depths; an
observation which cannot be resolved.
At well D (Figure 9) location, similar result has been
obtained at shallow depths as that in well B but slightly
different at deeper zones. Hydrostatic pressure is
observed until about 10000ft where an onset of mild
overpressure begins. The zone between 13000ft and
15000ft can be referred to as a “wavy” pore pressure
zone, since there are switches between overpressures
and hydrostatic pressures at short intervals. This zone is
a transition zone within which there are quick
alternations between shale and sand beds before
penetrating the thick shale bed just below the zone
(below 15000ft) where the well is overpressured until
last drilled depth. The wavy nature of the pore pressure
gradient may be due to a varying volume of quartz
within the shale beds which would help in dewatering
process. In well G (Figure 10), the reading of RFT starts
at about 11000ft with hydrostatic status to around a
depth of 12000ft where it reads sub-normal (under)
pressures and mild overpressures (0.6 to 0.7psi/ft) from
12500ft to the last drilled depth. Predicted pressures
compare favourably with the measured pressures;
Eaton‟s model provided a better match at the hydrostatic
zone while Bowers model however does at the deeper
depth with overpressures. Well G is a much deviated
well and mud losses were also reported during the
course of well drilling. The sub-normal pressure
conditions must have been responsible for these drilling
challenges. The fact that the predicted plots are also
matching these rather discordant MPP; the data should
be validated and accounted for as it can possibly give
clue on mechanisms causing the pressuring and bleed-
off occurrence.
Well H (Figure 11) maintains hydrostatic condition from
the beginning to about 9000ft where mild overpressures
begin to set in and returns to hydrostatic at 11000ft.
Another overpressure regime is observed at about
11600ft and to hard overpressure at terminating depth
about 16200ft. The last value of MPP shows a further
increase in overpressures down depth; since predictions
were done for thick shale beds rather than reservoir
sands where the last MPP value was read, this could not
be ascertain. However, prediction models for this well
are in perfect match with “Measured Pore Pressures
(MPPs)”.
And finally in the case study well K (Figure 12), the
result demonstrates hydrostatic pressure down to a depth
International Journal of Scientific Research in Science and Technology (www.ijsrst.com)
365
of about 10,400ft where an “onset of overpressure” is
observed. Hard overpressures in the well location exist
within the range of 12000ft to 12400ft. Before the
overpressure zone, a subnormal pressure zone is also
observed. A slight mismatch is however seen between
the predicted and measured pressures within these
depths range of subnormal pressures. This could
probably be owed to information mix-up in the data
provided. Since the mismatch is just not too out of place,
the depth range can be put between 8000ft and 11000ft
where the subnormal pressures are observed, although
this result cannot be validated for future exploration
need otherwise drilling information is incorporated to
these interpretations (these were not provide for this
well). Logs reversals just below the hard overpressure
zone suggest a return to hydrostatic pressure regime.
Evident Overpressure Mechanisms and Suitability of
Models
The results of this work have produced perfect matches
between Predicted Pore Pressures (PPP) and Measured
Pore Pressure (MPP) for each of the applied models and
in all the wells, making the models suitable for the study
area. However, certain parameters were adjusted to
achieve their suitabilities. Eaton exponent 5.5 and
Bowers‟ model which produced concordant results with
MPP in a good number of the studied wells suggest a
strong evidence of unloading mechanism. Also, porosity
model predicted with better match to MPP in most of the
wells when values for pore fluid transit times
approached or were above 230µs/ft; a value known for
hydrocarbon (oil) fluid type (Carmichael, 1982 ). With
this we can infer fluid expansion mechanism ensued
from expansion of formation fluids (hydrocarbon
cracking) since most overpressures occur within the
deep Agbada shales.
Cross-plots of velocity against density for all of the
wells show a twin exponential increase in both
parameters as it is expected for a disequilibrium
compaction mechanism. In some wells, however, there
are notable downward trending which depicts unloading
paths when compared with the typical Hoesni cuve-
types from velocity-density cross plots.
Finally, zones predicted in this work as having hard
overpressures (>0.75psi/ft) are generally within the
depth of 10,000ft to 16,000ft corresponding to the
hydrocarbon generative window described by
(Akpononu et al., 2012). At these depths, it is believed
that thermal cracking of hydrocarbon takes place at high
temperatures with volume increment. This further
confirms the views in (Opara, 2011 and Nwozor et al.,
2013) that fluid expansion mechanism is also a major
source of overpressures in the Niger Delta basin as
against the earlier believe where all emphasis were laid
on compaction disequilibrium alone as the major cause
of overpressuring in the sedimentary basin.
IV. CONCLUSION
Zones of overpressures have been predicted from the
three models applied; Eaton‟s, Bowers‟ and Porosity
models, each of which yielded results with good match
to MPPs and with various degrees of accuracy.
Geopressures are correspondingly higher in thick shale
zones with sharp increase in porosity values and hard
overpressures are generally at depths below 10,000ft.
The predictability and suitability of each of the models
are however, majorly dependent on overpressure
mechanisms at play. Analysis of Vp and density logs
revealed an interplay of mechanisms causing
overpressures other than compaction disequilibrium.
Bowers give better matches at much deeper zones with
the hard overpressures indicating sediments unloading
probably due to fluid expansion mechanism resulting
from hydrocarbon cracking/generation Therefore, these
results have successfully met the objectives of this work
and are also in agreement with results from similar
works.
V. RECOMMENDATIONS
The results of this work are valid for whatever purpose
as the reference could be made namely; future
exploration works, academic research, economic
evaluation and otherwise. An integrated approach is
recommended and with pre-drilled predictions more
confidence can be built for the drillers. With the
knowledge that temperature affects the density of rocks
and permeability of formations/fault-sittings in an area
will give an idea of pore fluid mobility, I also
recommend that temperatures and hydrodynamics be
integrated to future research in this area for better
interpretations.
International Journal of Scientific Research in Science and Technology (www.ijsrst.com)
366
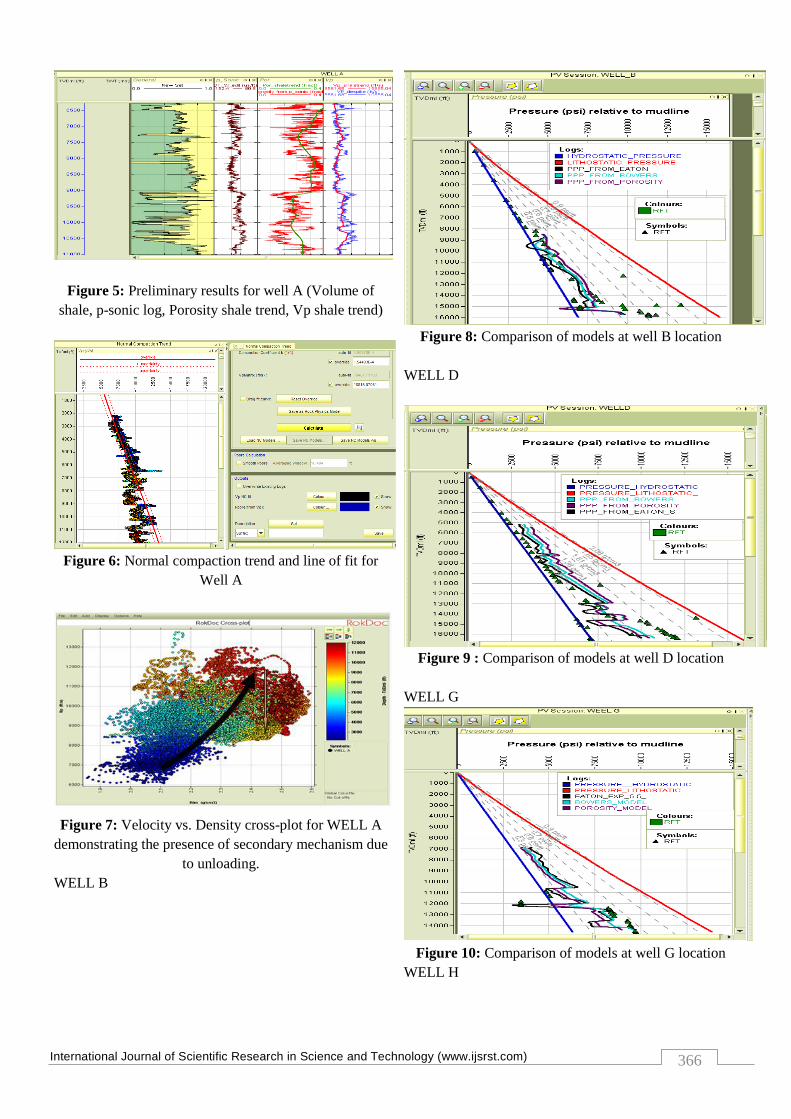
Figure 5: Preliminary results for well A (Volume of
shale, p-sonic log, Porosity shale trend, Vp shale trend)
Figure 6: Normal compaction trend and line of fit for
Well A
Figure 7: Velocity vs. Density cross-plot for WELL A
demonstrating the presence of secondary mechanism due
to unloading.
WELL B
Figure 8: Comparison of models at well B location
WELL D
Figure 9 : Comparison of models at well D location
WELL G
Figure 10: Comparison of models at well G location
WELL H
International Journal of Scientific Research in Science and Technology (www.ijsrst.com)
367
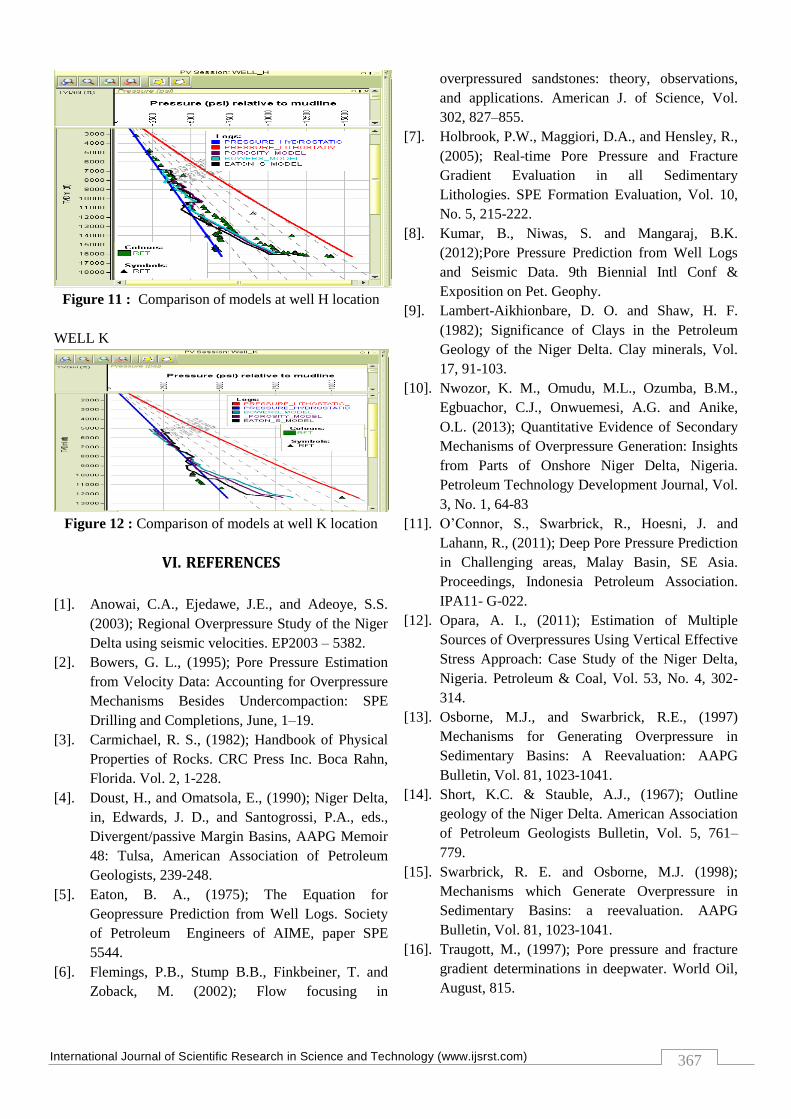
Figure 11 : Comparison of models at well H location
WELL K
Figure 12 : Comparison of models at well K location
VI. REFERENCES
[1]. Anowai, C.A., Ejedawe, J.E., and Adeoye, S.S.
(2003); Regional Overpressure Study of the Niger
Delta using seismic velocities. EP2003 – 5382.
[2]. Bowers, G. L., (1995); Pore Pressure Estimation
from Velocity Data: Accounting for Overpressure
Mechanisms Besides Undercompaction: SPE
Drilling and Completions, June, 1–19.
[3]. Carmichael, R. S., (1982); Handbook of Physical
Properties of Rocks. CRC Press Inc. Boca Rahn,
Florida. Vol. 2, 1-228.
[4]. Doust, H., and Omatsola, E., (1990); Niger Delta,
in, Edwards, J. D., and Santogrossi, P.A., eds.,
Divergent/passive Margin Basins, AAPG Memoir
48: Tulsa, American Association of Petroleum
Geologists, 239-248.
[5]. Eaton, B. A., (1975); The Equation for
Geopressure Prediction from Well Logs. Society
of Petroleum Engineers of AIME, paper SPE
5544.
[6]. Flemings, P.B., Stump B.B., Finkbeiner, T. and
Zoback, M. (2002); Flow focusing in
overpressured sandstones: theory, observations,
and applications. American J. of Science, Vol.
302, 827–855.
[7]. Holbrook, P.W., Maggiori, D.A., and Hensley, R.,
(2005); Real-time Pore Pressure and Fracture
Gradient Evaluation in all Sedimentary
Lithologies. SPE Formation Evaluation, Vol. 10,
No. 5, 215-222.
[8]. Kumar, B., Niwas, S. and Mangaraj, B.K.
(2012);Pore Pressure Prediction from Well Logs
and Seismic Data. 9th Biennial Intl Conf &
Exposition on Pet. Geophy.
[9]. Lambert-Aikhionbare, D. O. and Shaw, H. F.
(1982); Significance of Clays in the Petroleum
Geology of the Niger Delta. Clay minerals, Vol.
17, 91-103.
[10]. Nwozor, K. M., Omudu, M.L., Ozumba, B.M.,
Egbuachor, C.J., Onwuemesi, A.G. and Anike,
O.L. (2013); Quantitative Evidence of Secondary
Mechanisms of Overpressure Generation: Insights
from Parts of Onshore Niger Delta, Nigeria.
Petroleum Technology Development Journal, Vol.
3, No. 1, 64-83
[11]. O‟Connor, S., Swarbrick, R., Hoesni, J. and
Lahann, R., (2011); Deep Pore Pressure Prediction
in Challenging areas, Malay Basin, SE Asia.
Proceedings, Indonesia Petroleum Association.
IPA11- G-022.
[12]. Opara, A. I., (2011); Estimation of Multiple
Sources of Overpressures Using Vertical Effective
Stress Approach: Case Study of the Niger Delta,
Nigeria. Petroleum & Coal, Vol. 53, No. 4, 302-
314.
[13]. Osborne, M.J., and Swarbrick, R.E., (1997)
Mechanisms for Generating Overpressure in
Sedimentary Basins: A Reevaluation: AAPG
Bulletin, Vol. 81, 1023-1041.
[14]. Short, K.C. & Stauble, A.J., (1967); Outline
geology of the Niger Delta. American Association
of Petroleum Geologists Bulletin, Vol. 5, 761–
779.
[15]. Swarbrick, R. E. and Osborne, M.J. (1998);
Mechanisms which Generate Overpressure in
Sedimentary Basins: a reevaluation. AAPG
Bulletin, Vol. 81, 1023-1041.
[16]. Traugott, M., (1997); Pore pressure and fracture
gradient determinations in deepwater. World Oil,
August, 815.
International Journal of Scientific Research in Science and Technology (www.ijsrst.com)
368
[17]. Tuttle, M., Charpentier, R., and Brownfield, M.
(2015); The Niger Delta Petroleum System: Niger
Delta Province, Nigeria, Cameroon, and
Equatorial Guinea, Africa. United States Geologic
Survey.
[18]. Ugwu, G.Z. (2015); An Overview of Pore
Pressure Prediction Using Seismically–Derived
Velocities. Journal of Geology and Mining
Research, Vol. 7, No. 4, 31-40.
[19]. Zhang, J. (2011); Pore Pressure Prediction from
Well Logs: Methods, Modifications, and New
Approaches. Earth-science Reviews, Vol. 108, 50-
63.