13
•

Loughborough UniversityInstitutional Repository
A comparative study inultrasound breast imaging
classification
This item was submitted to Loughborough University's Institutional Repositoryby the/an author.
Citation: YAP, M.H., EDIRISINGHE, E.A. and BEZ, H.E., 2009. A compar-ative study in ultrasound breast imaging classification. IN: Pluim, J.P.W. andDawant, B.M. (eds.), Medical Imaging 2009: Image Processing, Proc. of SPIE7259, 72591S, 12pp.
Additional Information:
• Copyright 2010 Society of Photo-Optical Instrumentation Engineers. Oneprint or electronic copy may be made for personal use only. Systematicelectronic or print reproduction and distribution, duplication of any ma-terial in this paper for a fee or for commercial purposes, or modificationof the content of the paper are prohibited. This paper can also be foundat: http://dx.doi.org/10.1117/12.811208
Metadata Record: https://dspace.lboro.ac.uk/2134/6495
Version: Published
Publisher: c© 2009 SPIE
Please cite the published version.

This item was submitted to Loughborough’s Institutional Repository (https://dspace.lboro.ac.uk/) by the author and is made available under the
following Creative Commons Licence conditions.
For the full text of this licence, please go to: http://creativecommons.org/licenses/by-nc-nd/2.5/

A Comparative Study in Ultrasound Breast Imaging Classification
M.H.Yap, E.A.Edirisinghe, H.E.Bez
Department of Computer Science, Loughborough University, LE11 3TU {m.h.yap, e.a.edirisinghe, h.e.bez}@lboro.ac.uk
ABSTRACT
American College of Radiology introduces a standard in classification, the breast imaging reporting and data system (BIRADS), standardize the reporting of ultrasound findings, clarify its interpretation, and facilitate communication between clinicians. The effective use of new technologies to support healthcare initiatives is important and current research is moving towards implementing computer tools in the diagnostics process. Initially a detailed study was carried out to evaluate the performance of two commonly used appearance based classification algorithms, based on the use of Principal Component Analysis (PCA), and two dimensional linear discriminant analysis (2D-LDA). The study showed that these two appearance based classification approaches are not capable of handling the classification of ultrasound breast image lesions. Therefore further investigations in the use of a popular feature based classifier – Support Vector Machine (SVM) was conducted. A pre-processing step before feature based classification is feature extraction, which involve shape, texture and edge descriptors for the Region of Interest (ROI). The input dataset to SVM classification is from a fully automated ROI detection. We achieve the success rate of 0.550 in PCA, 0.500 in LDA, and 0.931 in SVM. The best combination of features in SVM classification is to combine the shape, texture and edge descriptors, with sensitivity 0.840 and specificity 0.968. This paper briefly reviews the background to the project and then details the ongoing research. In conclusion, we discuss the contributions, limitations, and future plans of our work.
Keywords: breast, ultrasound, classification, feature extraction, feature selection
1. INTRODUCTION The BIRADS descriptors are widely used by radiologists in manual classification of lesions [1]. Therefore a Computer-Aided Diagnosis (CADx) based system that is capable of providing a automated description of ultrasound image lesions can provide vital input to BIRADS and its use by radiologists. The main purpose is to study in ultrasound (US) breast imaging classification. The novelty lies in the proposed classification algorithms in comparing the appearance based approaches (PCA [2] and 2D-LDA [3]) with the feature based approach (SVM classifier [4]). In particular the performance of a significant number shape, texture and edge descriptors are compared with the aim of identifying the best feature set to be used in conjunction with SVM classifier.
2. METHODOLOGY Based on reviews on previous work and BIRADS as the guide of classification, we studied the classification methods and implemented the algorithms to our database. The test images used in this paper are obtained from a professionally compile Breast Ultrasound CD [5], which consists of explanations and verifications from several qualified expert radiologists.
2.1 Appearance Based Classification
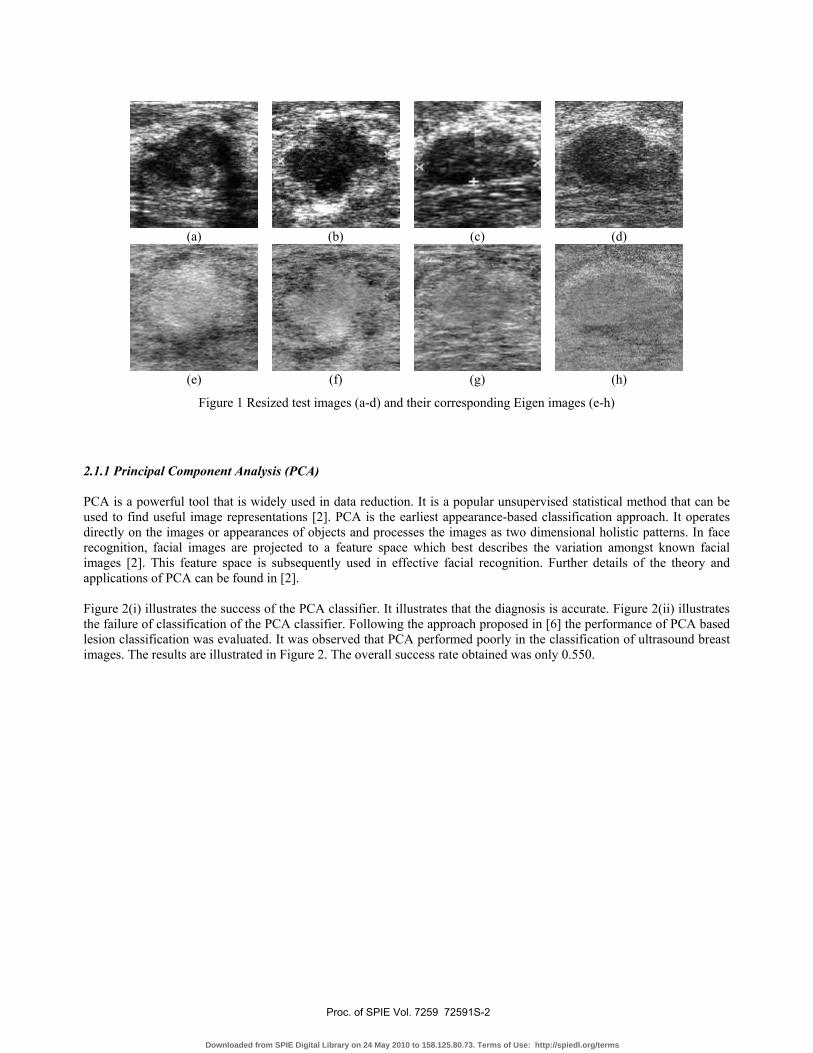
This section presents two popular appearance based approaches to US lesion classification, namely PCA and 2D-LDA. It further provides information on the dataset used in the evaluation of the two approaches. For the preliminary study of the performance of PCA and 2D-LDA approaches, 40 images from the original test image database was chosen and resized to 128 pixel by 128 pixel. Figure 1 illustrates some of the resized images with the correspondence Eigen images.
Medical Imaging 2009: Image Processing, edited by Josien P. W. Pluim, Benoit M. Dawant,Proc. of SPIE Vol. 7259, 72591S · © 2009 SPIE
CCC code: 1605-7422/09/$18 · doi: 10.1117/12.811208
Proc. of SPIE Vol. 7259 72591S-1
Downloaded from SPIE Digital Library on 24 May 2010 to 158.125.80.73. Terms of Use: http://spiedl.org/terms
(a)
(b)
(c)
(d)
(e)
(f)
(g)
(h)
Figure 1 Resized test images (a-d) and their corresponding Eigen images (e-h)
2.1.1 Principal Component Analysis (PCA) PCA is a powerful tool that is widely used in data reduction. It is a popular unsupervised statistical method that can be used to find useful image representations [2]. PCA is the earliest appearance-based classification approach. It operates directly on the images or appearances of objects and processes the images as two dimensional holistic patterns. In face recognition, facial images are projected to a feature space which best describes the variation amongst known facial images [2]. This feature space is subsequently used in effective facial recognition. Further details of the theory and applications of PCA can be found in [2]. Figure 2(i) illustrates the success of the PCA classifier. It illustrates that the diagnosis is accurate. Figure 2(ii) illustrates the failure of classification of the PCA classifier. Following the approach proposed in [6] the performance of PCA based lesion classification was evaluated. It was observed that PCA performed poorly in the classification of ultrasound breast images. The results are illustrated in Figure 2. The overall success rate obtained was only 0.550.
Proc. of SPIE Vol. 7259 72591S-2
Downloaded from SPIE Digital Library on 24 May 2010 to 158.125.80.73. Terms of Use: http://spiedl.org/terms

III
I
gIIIaII
(a)
(b)
Figure 2(i) Successful classifications in PCA Classifier
test image
best match 2nd match 3rd match
test image
best match 2nd match 3rd match
Proc. of SPIE Vol. 7259 72591S-3
Downloaded from SPIE Digital Library on 24 May 2010 to 158.125.80.73. Terms of Use: http://spiedl.org/terms

S I I I I I
Iuus
u
V a a I I III
(a)
(b)
Figure 2(ii) miss-classifications in PCA Classifier
test image
best match 2nd match 3rd match
test image
best match 2nd match 3rd match
Proc. of SPIE Vol. 7259 72591S-4
Downloaded from SPIE Digital Library on 24 May 2010 to 158.125.80.73. Terms of Use: http://spiedl.org/terms

2.1.2 Two Dimensional Linear Discriminant Analysis (2D-LDA) LDA is a further appearance based approach that may be used in lesion classification. It optimizes the low-dimensional representation of image objects with the aim of most discriminant feature extraction [3]. In LDA, the image is linearly projected into a feature subspace. The projection method is based upon Fisher’s linear discriminant and produces well separated classes in a low-dimensional subspace [3]. In pattern recognition research it has been shown that LDA based algorithms outperform PCA-based algorithms [7] in image classification. A variant of LDA, 2D-LDA (Two Dimensional – LDA), proposed by Li et al. [3], directly extracts features from the image matrix, rather than a feature vector created out of an image to compute the between-class and within-class scatter matrices. Interested readers are referred to [7] and [3] for further details of LDA and 2D-LDA. By using the same dataset as used with PCA, the success rate of the 2D-LDA approach to classification of lesions was reported to be 0.500. Therefore it can be concluded that both PCA and 2D-LDA base approaches, i.e. appearance based approaches, are inefficient in the classifications of lesions of US images.
2.2 Support Vector Machine (SVM)
The support vector machines (SVMs) were introduced by Vapnik [4] and are based on statistical learning theory. In pattern classification applications, it has been proved that SVMs provide better generalization performance than the traditional techniques, such as neural networks [8]. The benefits of SVMs include, rapid and excellent classification capability [9] and the ability to generalize in high-dimensional spaces. Hence it is widely accepted as an excellent choice in classification. In addition, the task of classifying malignant tumors from benign tumors can be defined as a so-called binary classification problem. According to [4], SVM is powerful in solving binary classification problems. This paper implements John Platt's [10] sequential minimal optimization (SMO) algorithm for training a support vector classifier. For further discussions on SVM, readers are referred to [10]. Feature based approaches to image classification generally consists of two stages, namely, feature extraction and feature classification. The input set, i.e., the tumor segments, is extracted by using Yap et al.’s algorithm [11]. Yap et al. implemented a fully automated ROI detection. Our work is a continuation in classification stage. To our knowledge, classifying the lesion from a fully automated ROI is a new contribution. 2.2.1 Features Extraction Features can generally be used as a concise representation of an image. In particular feature extraction in ultrasound images is a challenging task due to the speckle noise. For ease of discussion and analysis, we classify the typical features of an ultrasound image into three groups, namely, shape, texture and edge descriptors. These categories are detailed in the following sub-sections. 2.2.1.1 Shape descriptors Shape analysis has been widely utilized in computer vision and has been intensively developed over the past decades in both theoretical and applied domains [12]. Due to the fact that most US image lesions vary in shape according to their type (e.g. cyst, malignant etc.), shape descriptors have been used their classification. This section discusses the shape descriptors utilized by previous methods of feature based US lesion classification and a number of further shape descriptors that have been utilized in general within other computer vision applications [10]:
Area to Perimeter ratio (AP): perimeter
areaAP= , where area is the area of the tumor, and perimeter is the perimeter of
the tumor. Tumor perimeter and tumor area are dependent on size of a tumor. Hence as a standalone feature, it does not provide useful information. However, the aspect ratio of the area to perimeter will provide useful information as a malignant tumor has an irregular boundary, which implies a higher value in perimeter.
Proc. of SPIE Vol. 7259 72591S-5
Downloaded from SPIE Digital Library on 24 May 2010 to 158.125.80.73. Terms of Use: http://spiedl.org/terms

Convex hull provides important information in the description of shape. Figure 3 illustrate the shape of the lesions that correspond to their convex hulls. From the above analysis, the convexity and solidity of the lesions can be calculated as follows:
(a)
(b)
(c)
(d)
Figure 3 Lesions and Convex hull. (a), (b) malignant tumours, (c), (d) benign tumours.
Solidity: areaconvex
areaSolidity = , where area is the area of the tumor region, and convexarea is the area of the convex
hull. It is clearly shown that the malignant tumors (as in Figure 3 (a) and (b)) has a larger convex hull area as compared to the benign tumors (as in Figure 3 (c) and (d)).
Convexity: perimeter
perimeterconvexConvexity = , where perimeter is the perimeter of the tumor, and convexperimeter
represents the perimeter of the convex hull. Figure 3 clearly illustrates that a malignant tumor has a higher perimeter value as a result of it’s irregular nature. Hence, this feature is fairly important in boosting the separability of the lesions.
Elongation: widthlengthElongation= , where length and width denotes the length and width of the bounding rectangle as
illustrated in the following figure 4.
Figure 4 Illustration of the bounding rectangle with it’s width and length.
Extent: rectangleboundingofarea
areaExtent = , where area is the area of the tumor, and the area of bounding rectangle
is the area of the rectangle as illustrated in figure 4.
width
length
Proc. of SPIE Vol. 7259 72591S-6
Downloaded from SPIE Digital Library on 24 May 2010 to 158.125.80.73. Terms of Use: http://spiedl.org/terms

t
Aspect ratio (AR):
axisminor axismajor AR = , where major axis is the line passing through the foci, centre and vertices of the
ellipse, and minor axis is a line through the centre of an ellipse which is perpendicular to the major axis, as illustrated in figure 5.
Figure 5 illustration of the major axis and minor axis
Compactness: axismajorareasCompactnes ×
=π4 , where area is the area of the tumor, and major axis as defined in Figure 5.
Roundness: 2_
4DiameterMaxareaRoundness
××
=π
, where area denotes the area of the tumor, and Max_Diameter denotes
the length of the major axis. Figure 6 illustrates the roundness values for benign and malignant tumors. Note that a benign tumor has a higher roundness value as compare to a malignant tumor.
(a)
(b)
Roundness=0.65 Form factor=0.74
Roundness=0.37 Form factor=0.32
Figure 6 Illustration of the shape of a: (a) benign tumor, (b) malignant tumor with the respective roundness and form factor values.
Form factor: perimeter
areafactorForm ×=
π4 , where area and perimeter denotes the area and the perimeter of the tumor.
Figure 6 shows that a benign tumor has a higher form factor value than a malignant tumor.
major axis
minor axis
Proc. of SPIE Vol. 7259 72591S-7
Downloaded from SPIE Digital Library on 24 May 2010 to 158.125.80.73. Terms of Use: http://spiedl.org/terms

Max/Min radii: centerscirclethefromradiusMinimumcenterscirclethefromradiusMaximumradiiMinMax
''/ = . The detail explanation of this
parameter is illustrated in figure 7.
Figure 7 Illustration of maximum radius and minimum radius.
2.2.1.2 Texture descriptors Texture descriptors can be used to differentiate between lesions having differences in internal texture. The texture can be represented in the form of four central moments and by entropy of a pixel value distribution: Mean/Average Intensity: This refers to the first central moment, i.e. the average intensity of the lesion, in gray-scale. Standard Deviation: This refers to the second central moment, i.e. a measure of the sparsity of the pixel value intensity within a lesion. Skewness: This refers to the third central moment, i.e. a measure of the degree of asymmetry of the pixel value distribution. Kurtosis: This refers to the normalized form of the fourth central moment of a distribution, or the degree of peakedness of a distribution. It measures if the data are peaked or flat relative to a normal distribution. Minimum Cross Entropy (MCE): The cross entropy of a probability distribution q with respect to a prior distribution p is defined by
∑=j j
jj p
qqpqH log),(
The idea of MCE is to choose the distribution q that has the least cross entropy, with respect to the given prior p [113]. In classifying benign tumors from malignant tumors, a particular challenge met is that typically the pixel intensity value distribution of a fibroadenoma lesion is close in resemblance to pixel intensity value distribution of a normal lesion. Therefore if a normal lesion acts as the prior distribution p, it is expected that fibroadenoma lesions will have the least MCE as compared to the MCEs that results from other types of diagnosis. Hence, MCE can be used to separate fibroadenoma lesions from lesions of the benign class. 2.2.1.3 Edge descriptors Fourier descriptors, and fractal analysis are widely used in literature as edge descriptors. The following sections define these parameters and summarises their potential use in classification. Fourier descriptor: Fourier descriptors are common used in pattern recognition applications due to their invariance to the starting point of the boundary and rotation [13]. Figure 8 illustrates the efficiency of Fourier descriptors in differentiating malignant tumors from benign tumors. In low frequency domain, it provides the general shape information of an edge, while the details of the edges are represented by the relevant high frequency domain. Therefore it is expected that
Min radius
Max radius
Proc. of SPIE Vol. 7259 72591S-8
Downloaded from SPIE Digital Library on 24 May 2010 to 158.125.80.73. Terms of Use: http://spiedl.org/terms

260
240
220
200
160
Original Shape Restored with ID descriptors
60 100 120
Restored with 20 descriptors Restored with 50 descriptors
26U
240
220
200
160
60 100 120
160
140
120
Restored with 10 descripto
150 200t
malignant tumors, with irregular edges, produce higher values in high frequency domain as compared to benign tumor. The Fourier descriptors of a lesion boundary is presented by an array of complex numbers which correspond to the pixels of the object boundary if the image is placed in the complex plane. Fourier descriptors are calculated by combining Fourier transform coefficients of the complex array [13]. It is noted that using a lower number of Fourier descriptors, the general shape can be described (figure 8(a) and 8(b), 10 descriptors). The detail information of the shape is described by using the high frequency components of the series (as shown in figure 8(a) and figure 8(b), 50 descriptors). For consistency, in our preliminary experiments the boundaries are re-sampled to the same size and 100 descriptors are obtained for each. Note that in our experiments the descriptor Fourier1 represents the summation of the coefficients of real numbers while descriptor fourier2 represents the summation of the coefficients of the complex numbers.
(a)
(b)
Figure 8 Fourier Descriptors for a (a) malignant tumor and a (b) benign tumor, and their corresponding reconstructions of edges using different numbers of descriptors/coefficients.
Fractal Dimension: The simple box-counting method is used in extracting the edge information. In the other words, fractal dimension can be used to describe the roughness of the edges. Note that in our experiments, the descriptor, Fractal1 represents the mean of the fractal dimension, while Fractal2 represents the standard deviation of the fractal dimension.
Proc. of SPIE Vol. 7259 72591S-9
Downloaded from SPIE Digital Library on 24 May 2010 to 158.125.80.73. Terms of Use: http://spiedl.org/terms

3. RESULTS AND DISCUSSION From the observation, PCA performs better than LDA in ultrasound images classification. We achieve success rate of 0.550 in PCA, and 0.500 in LDA. The fact is that the nature of ultrasound images is not easily neither in the process of finding similarity nor detecting differences. Table 1 shows the summary statistics in using different groups of features in SVM based classification. Our result shows that SVM is the most reliable classification method, the best combination of features in SVM classification is to combine the shape, texture and edge descriptors. The success rate of SVM classification is 0.931, with sensitivity 0.840, specificity 0.968, F-measure 0.875, and predicted area under curve (Az) 0.904. It proves that shape, texture, and edge are important in ultrasound classification.
The input dataset was generated by a fully automated system [11] (normally CAD takes in the manual ROI labeling) is the major breakthrough in this work.
Table 1 Summary statistics in using different groups of features in SVM based classification
Features Success rate
Sensitivity Specificity PPV NPV F-measur
e
Az
All features 0.931 0.840 0.968 0.913 0.938 0.875 0.904 Shape descriptors
0.931 0.800 0.984 0.952 0.924 0.870 0.892
Texture descriptors
0.851 0.680 0.919 0.773 0.877 0.723 0.800
Edge descriptors
0.712 0 1 0 0.713 0 0.500
4. CONCLUSIONS Our project shows the study in ultrasound breast imaging classification by different classifiers. The future trend of medical world is towards digitized. However, ultrasound images segmentation remains a serious problem in development of Ultrasound Computer aided diagnosis (US CAD). In future, we will concentrate in improving the algorithms, and study the relation between the human vision and computer vision.
REFERENCES
[1] Heinig, J., Witteler, R., Schmitz, R., Kiesel, L., and Steinhard, J., “Accuracy of Classification of Breast Ultrasound Findings based on Criteria used for BIRADS”, Ultrasound Obstet. Gynecol., (2008).
[2] Turk, M. and Pentland, A., “Eigenfaces for Recognition,” Journal of Cognitive Neuroscience, vol. 3, 71-86 (1991). [3] Li, M. and Yuan, B., “2D-LDA: A Statistical Linear Discriminant Analysis for Image Matrix,” Pattern Recognition
Letters, vol. 26, 527-532 (2005). [4] Vapnik, C., [The Nature of Statistical Learning Theory], Springer-Verlag, (1995). [5] Prapavesis, S.T., Fornage, B.D., Weismann, C.F., Palko, A., Zoumpoulis, P., [Breast Ultrasound and US-Guided
Interventional Techniques]. Thessaloniki Greece (2001). [6] Mandlebrot, B.B. and Sarkar, N., “Texture segmentation using fractal dimension,” IEEE Trans on Pattern Analysis
and Machine Intell., vol 17, 72-76 (1995). [7] Lu, J., Plataniotis, K.N., Venetsanopoulos, A.N., “Face Recognition Using LDA-Based Algorithms,” IEEE Trans.
on Neural Networks, vol. 14, 195-200 (2003).
Proc. of SPIE Vol. 7259 72591S-10
Downloaded from SPIE Digital Library on 24 May 2010 to 158.125.80.73. Terms of Use: http://spiedl.org/terms

[8] Witten, I.H. and Frank, E., [Data Mining – Practical Machine Learning Tools and Techniques], United States of America: Morgan Kaufmann, Elsevier (2005).
[9] Huang, Y.L., Chen, D.R., Jiang, Y.R., Kuo, S.J., Wu, H.K., and Moon, W.K., “Computer-aided Diagnosis Using Morphological Features for Classifying Breast Lesions on Ultrasound,” Ultrasound Obstet. Gynecol. (2008).
[10] Platt, J., Scholkopf, B., Burges, C. And Smola, A.,“Fast Training of Support Vector Machines using Sequential Minimal Optimization,” Ed: MIT Press (2006).
[11] Yap, M.H., Edirisinghe, E.A. and Bez, H.E., “Fully automatic Lesion Boundary Detection in Ultrasound Breast Image”, SPIE Medical Imaging Conference, 651265123I, 17th-22nd February, San Diego, CA, US (2007).
[12] Russ, J.C., [The image processing handbook, 5th Edition], Boca Raton, Fla: CRC Press (2007). [13] Costa, L.D.R.D. and Cesar, R.M., [Shape Analysis and Classification: Theory and Practise, 1st Edition], Boca Raton,
FL, USA: CRC Press Inc, 2000.
Proc. of SPIE Vol. 7259 72591S-11
Downloaded from SPIE Digital Library on 24 May 2010 to 158.125.80.73. Terms of Use: http://spiedl.org/terms


