INTERNATIONAL ENERGY POLICIES & PROGRAMMES EVALUATION CONFERENCE (IEPPEC) 2014, BERLIN, GERMANY 10 SEPTEMBER 2014 A COMPARATIVE STUDY ON THE CONSEQUENCE AND IMPACT OF PUBLIC POLICIES IN FAVOR OF SOLAR PHOTOVOLTAIC DEVELOPMENT (GERMANY & CHINA) JULIE HYUN JIN YU CEA SACLAY, INSTITUTE FOR TECHNO-ECONOMICS OF ENERGY SYSTEMS PARIS DAUPHINE UNIVERSITY, CHAIR OF EUROPEAN ELECTRICITY MARKETS & CENTRE OF GEOPOLITICS OF ENERGY AND RAW MATERIALS
Transcript
INTERNATIONAL ENERGY POLICIES &
PROGRAMMES EVALUATION CONFERENCE
(IEPPEC) 2014, BERLIN, GERMANY
10 SEPTEMBER 2014
A COMPARATIVE STUDY ON THE
CONSEQUENCE AND IMPACT OF
PUBLIC POLICIES IN FAVOR OF SOLAR
PHOTOVOLTAIC DEVELOPMENT
(GERMANY & CHINA)
JULIE HYUN JIN YU
CEA SACLAY, INSTITUTE FOR TECHNO-ECONOMICS
OF ENERGY SYSTEMS
PARIS DAUPHINE UNIVERSITY, CHAIR OF EUROPEAN
ELECTRICITY MARKETS & CENTRE OF GEOPOLITICS
OF ENERGY AND RAW MATERIALS
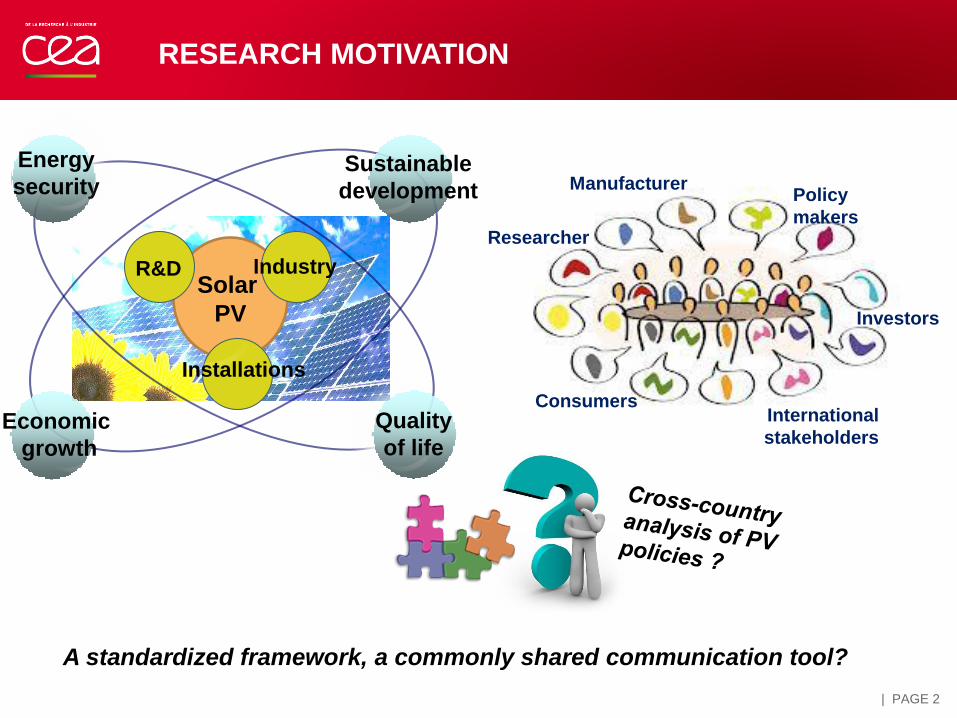
RESEARCH MOTIVATION
Researcher
Policy
makers
Investors
Consumers International
stakeholders
Manufacturer
2
A standardized framework, a commonly shared communication tool?
Solar
PV
R&D
Energy
security
Quality
of life
Industry
Installations
Economic
growth
Sustainable
development
| PAGE 2
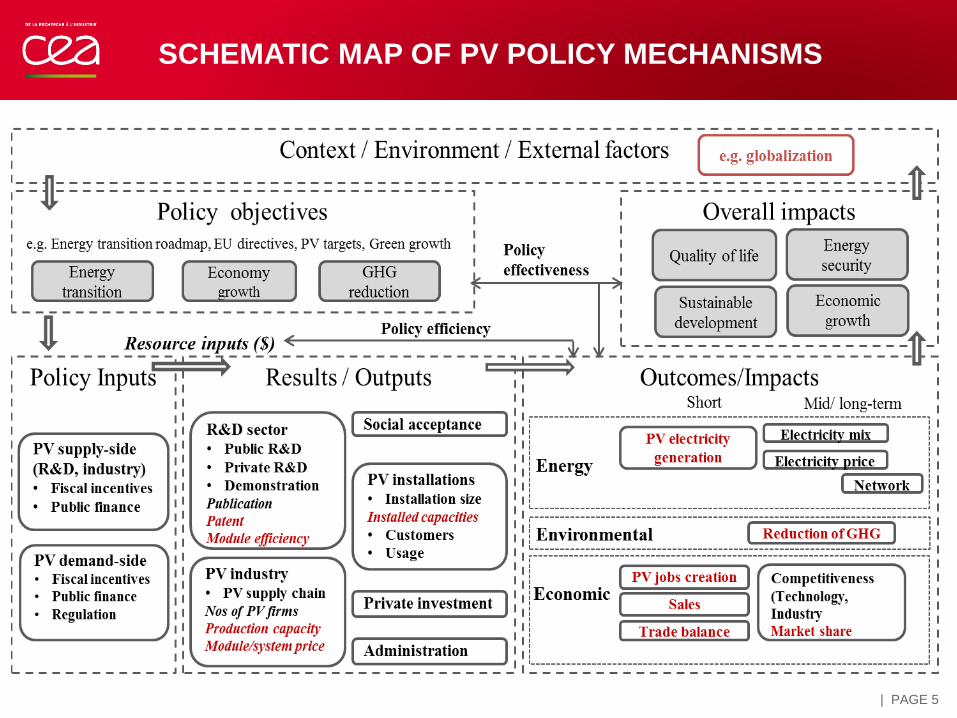
The schematic PV policy system diagram
Identifies important measurable variables of PV policy
mechanisms at a single glance within a global perspective.
A comparative analysis of Germany (largest installer) & China
(biggest supplier) to review characteristics and differences
of policy decisions and results under different contexts
Interactions of their policy decisions and impact on the
schematic map of the PV policy mechanism
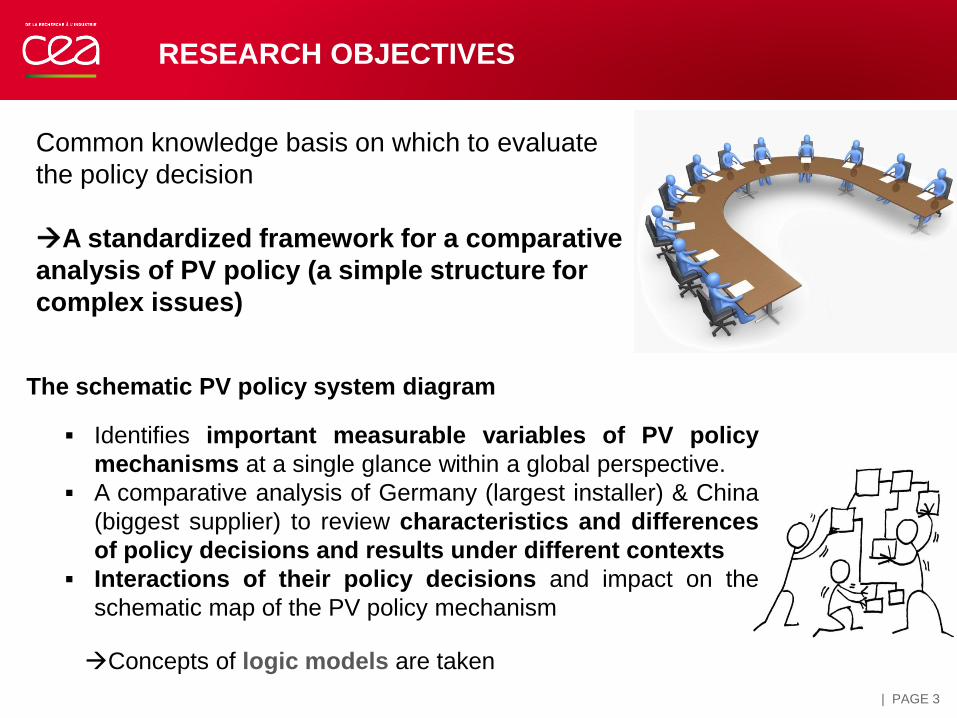
RESEARCH OBJECTIVES
Common knowledge basis on which to evaluate
the policy decision
A standardized framework for a comparative
analysis of PV policy (a simple structure for
complex issues)
Concepts of logic models are taken
| PAGE 3
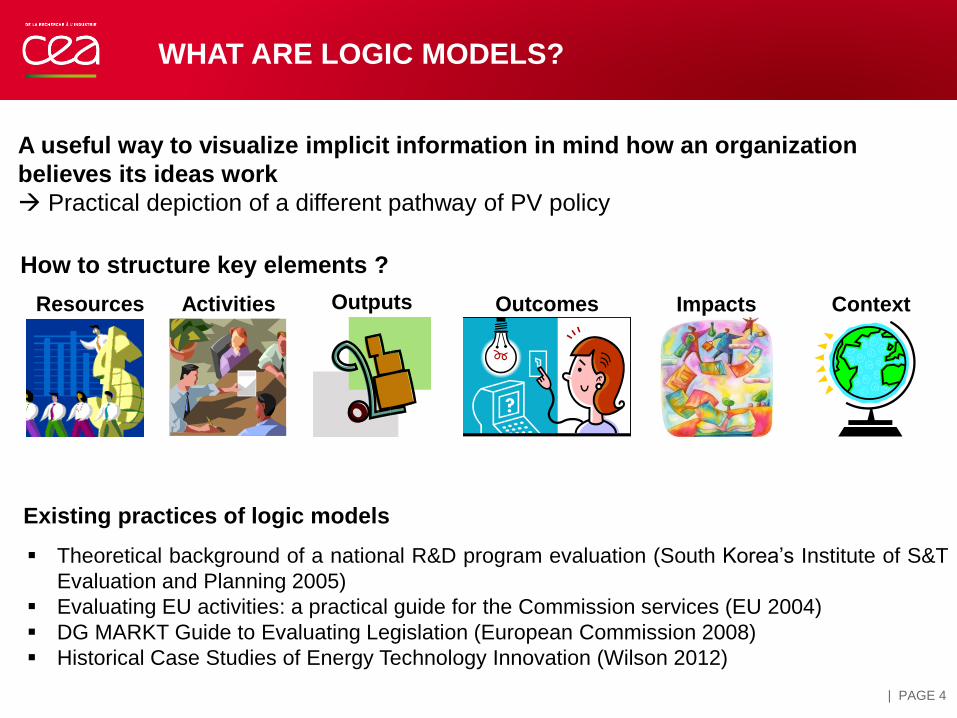
Resources Activities Outputs Impacts Outcomes
Theoretical background of a national R&D program evaluation (South Korea’s Institute of S&T
Evaluation and Planning 2005)
Evaluating EU activities: a practical guide for the Commission services (EU 2004)
DG MARKT Guide to Evaluating Legislation (European Commission 2008)
Historical Case Studies of Energy Technology Innovation (Wilson 2012)
Existing practices of logic models
A useful way to visualize implicit information in mind how an organization
believes its ideas work
Practical depiction of a different pathway of PV policy
WHAT ARE LOGIC MODELS?
How to structure key elements ?
Context
| PAGE 4
SCHEMATIC MAP OF PV POLICY MECHANISMS
| PAGE 5
| PAGE 6
APPLICATION OF SCHEMATIC MAP OF
PV POLICY MECHANISMS WITH CASE
STUDIES OF GERMANY & CHINA
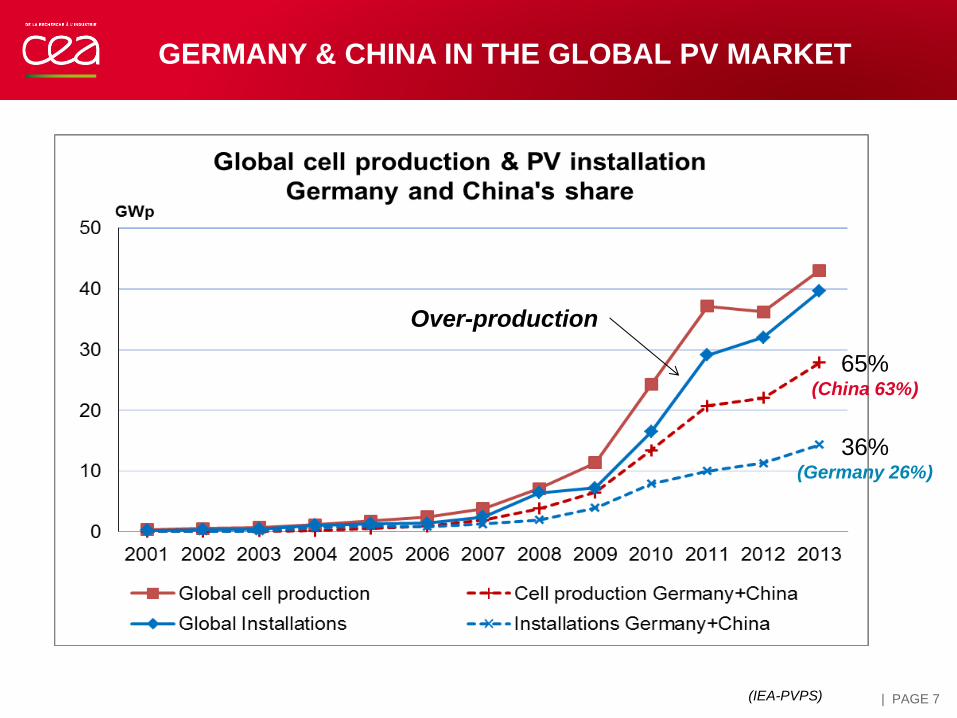
GERMANY & CHINA IN THE GLOBAL PV MARKET
Over-production
65% (China 63%)
36% (Germany 26%)
(IEA-PVPS) | PAGE 7
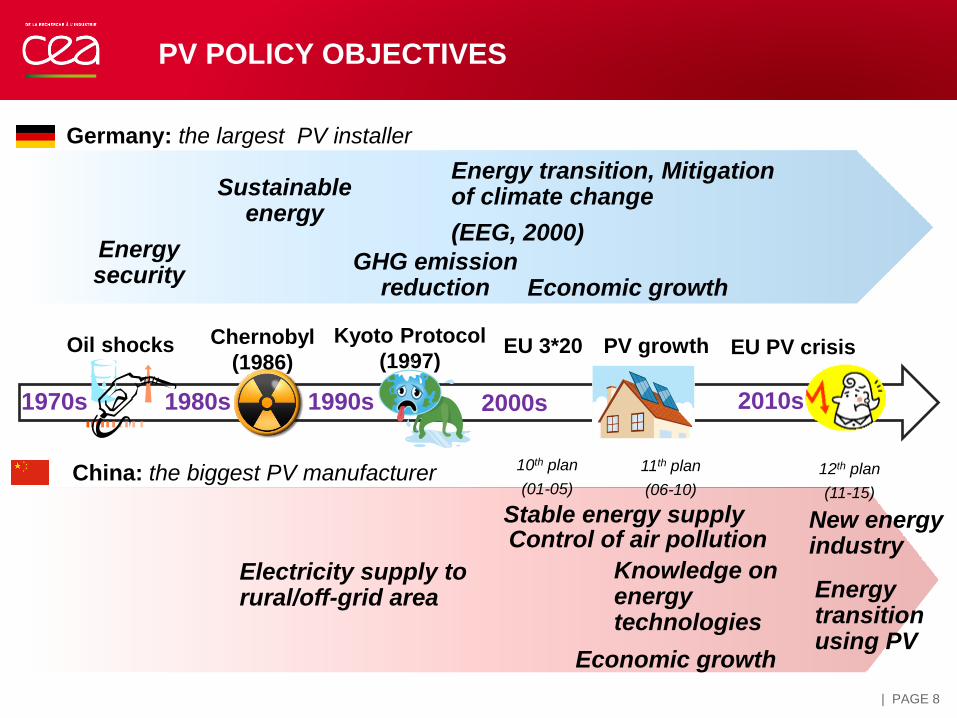
PV POLICY OBJECTIVES
Germany: the largest PV installer
China: the biggest PV manufacturer
Oil shocks Chernobyl
(1986)
1970s 1980s 1990s 2000s 2010s
Kyoto Protocol
(1997) EU 3*20 EU PV crisis PV growth
Economic growth
Energy security
Energy transition, Mitigation of climate change
(EEG, 2000)
Electricity supply to rural/off-grid area
New energy industry
Energy transition using PV
Sustainable energy
GHG emission reduction
Stable energy supply Control of air pollution
Knowledge on energy technologies
10th plan
(01-05)
11th plan
(06-10)
12th plan
(11-15)
Economic growth
| PAGE 8
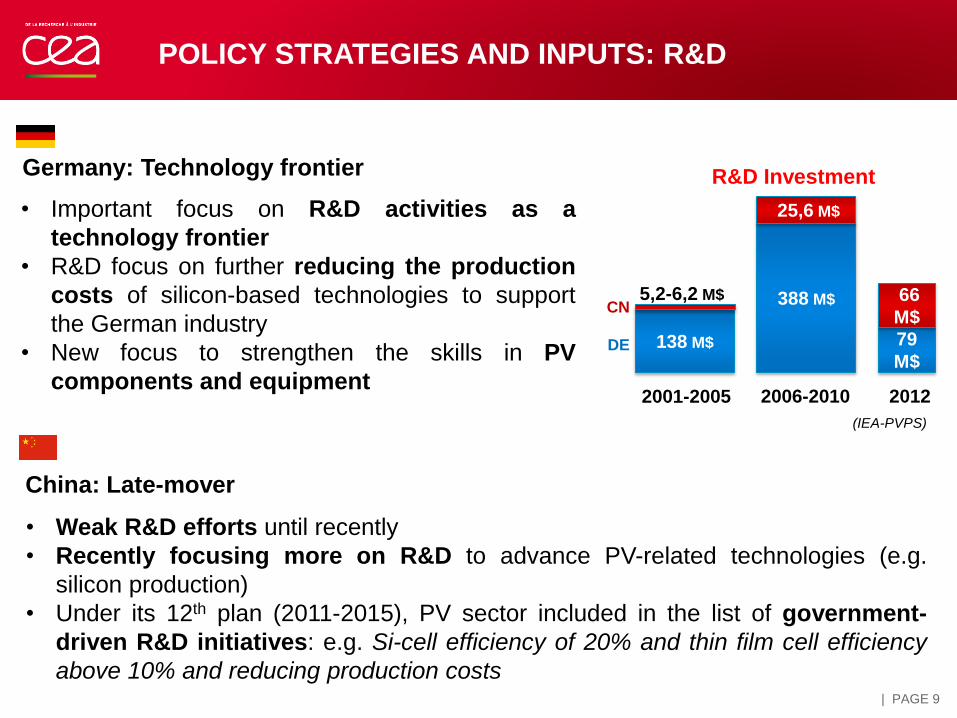
POLICY STRATEGIES AND INPUTS: R&D
• Important focus on R&D activities as a
technology frontier
• R&D focus on further reducing the production
costs of silicon-based technologies to support
the German industry
• New focus to strengthen the skills in PV
components and equipment
• Weak R&D efforts until recently
• Recently focusing more on R&D to advance PV-related technologies (e.g.
silicon production)
• Under its 12th plan (2011-2015), PV sector included in the list of government-
driven R&D initiatives: e.g. Si-cell efficiency of 20% and thin film cell efficiency
above 10% and reducing production costs
138 M$
388 M$
25,6 M$
79
M$
66
M$
2001-2005 2006-2010 2012
DE
CN 5,2-6,2 M$
R&D Investment Germany: Technology frontier
China: Late-mover
(IEA-PVPS)
| PAGE 9
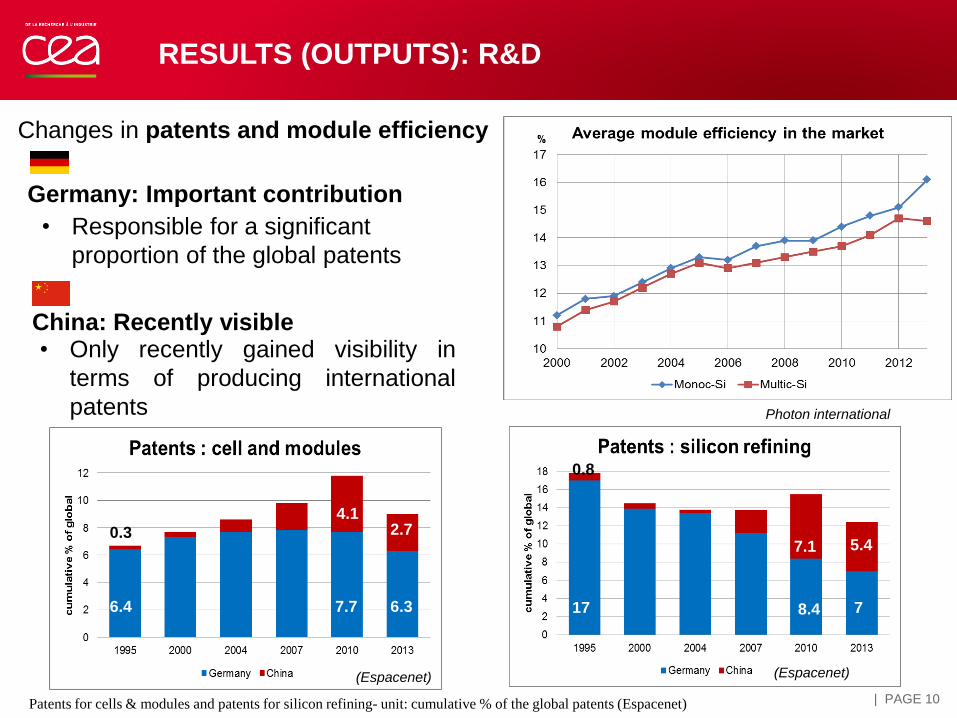
RESULTS (OUTPUTS): R&D
Patents for cells & modules and patents for silicon refining- unit: cumulative % of the global patents (Espacenet)
• Responsible for a significant
proportion of the global patents
• Only recently gained visibility in
terms of producing international
patents
Changes in patents and module efficiency
Germany: Important contribution
China: Recently visible
(Espacenet) (Espacenet)
Photon international
6.4 6.3
2.7 0.3
17 7
5.4
0.8
8.4
7.1
7.7
4.1
| PAGE 10
• R&D to industry (demonstration & commercialization)
• A policy mix of technology-push & demand-pull strategies
• A close network between research centers, universities, and industry
Funding, grants, cash incentives, reduced-interest loans, public guarantees
POLICY STRATEGIES AND INPUTS :INDUSTRY
• Easy-to-follow technology industry (manufacturing of labor-intensive cells and
modules) to higher-skilled, more capital-intensive upstream ( silicon purifying,
ingots shaping and making thin wafers)
• Price competitiveness through economies of scale
• Export-oriented policies
Innovation funds for small technology-based firms, regional investment
support policies (local), simplified loan and credit conditions (national)
Germany: Research to industry
China: Industry growth first, export-oriented
| PAGE 11
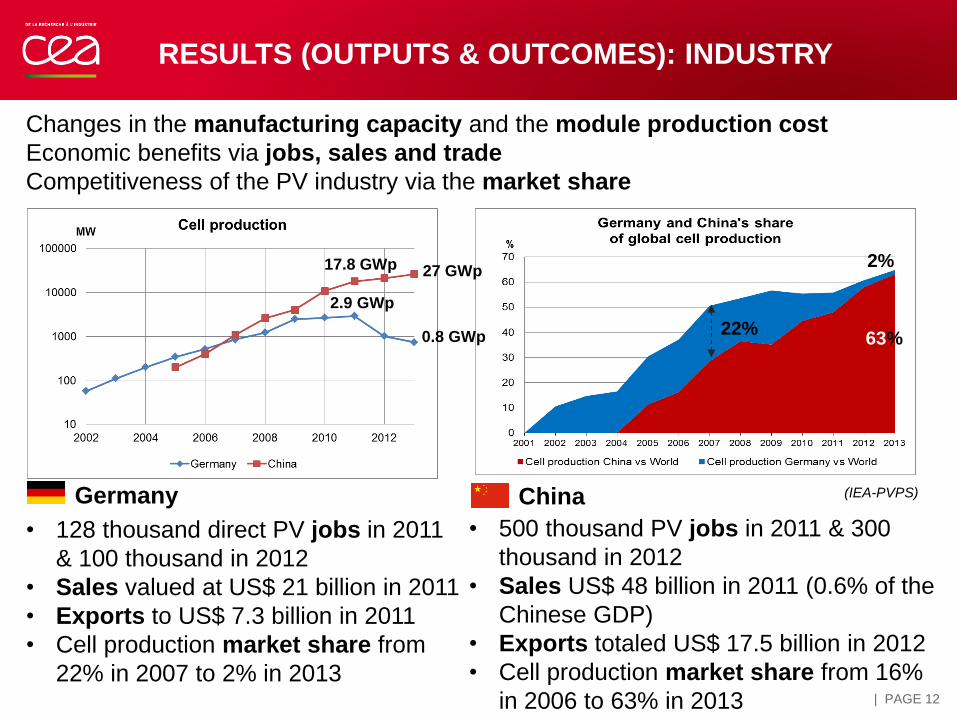
RESULTS (OUTPUTS & OUTCOMES): INDUSTRY
• 500 thousand PV jobs in 2011 & 300
thousand in 2012
• Sales US$ 48 billion in 2011 (0.6% of the
Chinese GDP)
• Exports totaled US$ 17.5 billion in 2012
• Cell production market share from 16%
in 2006 to 63% in 2013
• 128 thousand direct PV jobs in 2011
& 100 thousand in 2012
• Sales valued at US$ 21 billion in 2011
• Exports to US$ 7.3 billion in 2011
• Cell production market share from
22% in 2007 to 2% in 2013
Changes in the manufacturing capacity and the module production cost
Economic benefits via jobs, sales and trade
Competitiveness of the PV industry via the market share
Germany China (IEA-PVPS)
22%
2%
63%
2.9 GWp
27 GWp
0.8 GWp
17.8 GWp
| PAGE 12
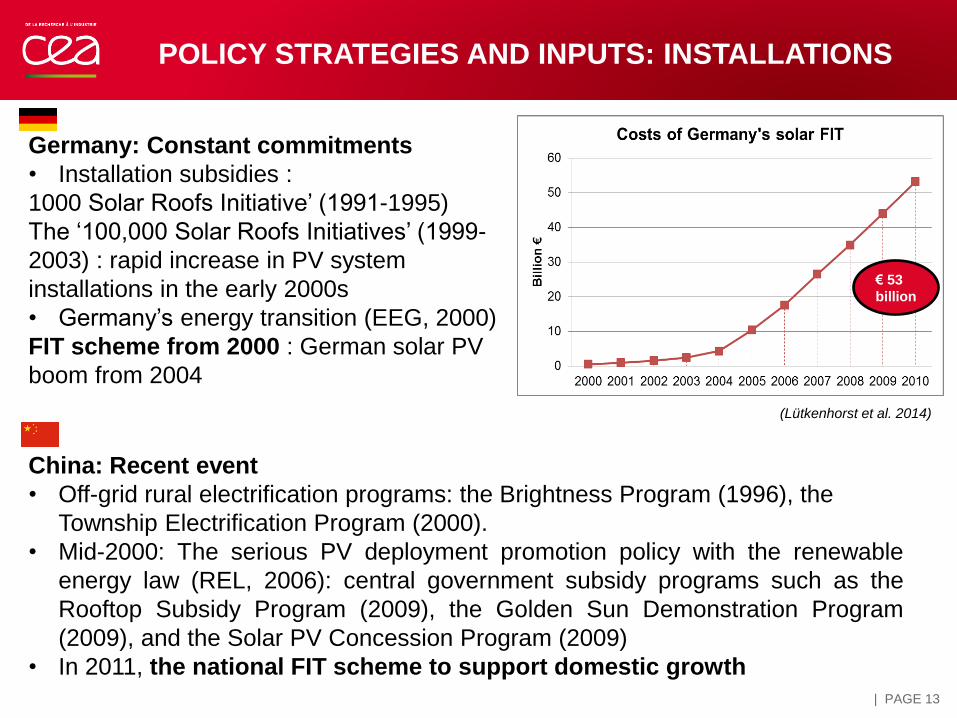
Germany: Constant commitments
• Installation subsidies :
1000 Solar Roofs Initiative’ (1991-1995)
The ‘100,000 Solar Roofs Initiatives’ (1999-
2003) : rapid increase in PV system
installations in the early 2000s
• Germany’s energy transition (EEG, 2000)
FIT scheme from 2000 : German solar PV
boom from 2004
POLICY STRATEGIES AND INPUTS: INSTALLATIONS
China: Recent event
• Off-grid rural electrification programs: the Brightness Program (1996), the
Township Electrification Program (2000).
• Mid-2000: The serious PV deployment promotion policy with the renewable
energy law (REL, 2006): central government subsidy programs such as the
Rooftop Subsidy Program (2009), the Golden Sun Demonstration Program
(2009), and the Solar PV Concession Program (2009)
• In 2011, the national FIT scheme to support domestic growth
(Lütkenhorst et al. 2014)
€ 53
billion
| PAGE 13
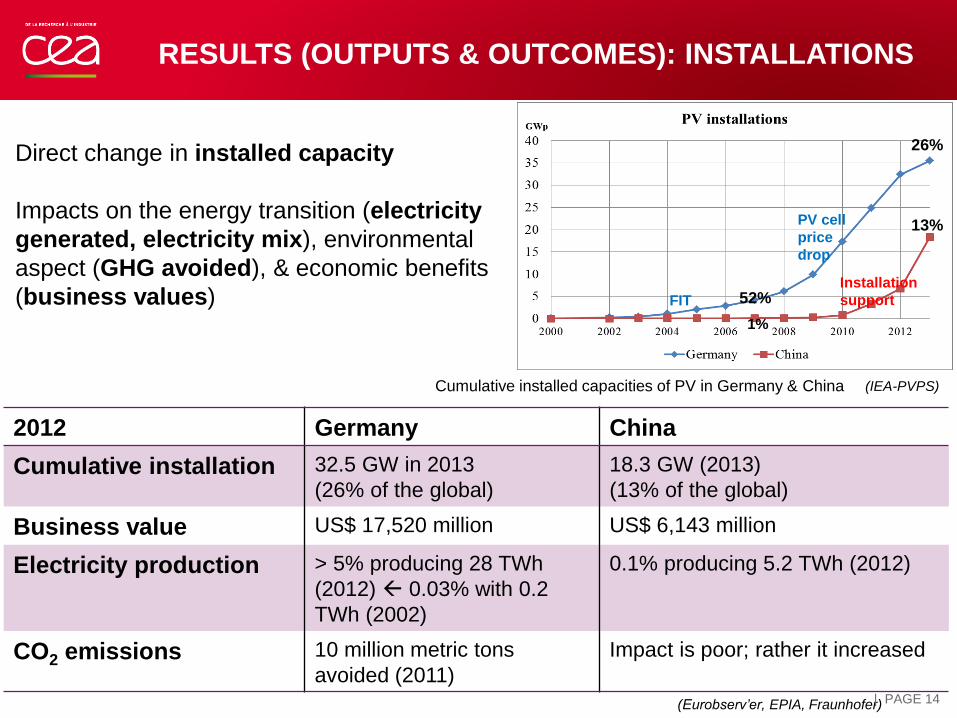
Cumulative installed capacities of PV in Germany & China
2012 Germany China
Cumulative installation 32.5 GW in 2013
(26% of the global)
18.3 GW (2013)
(13% of the global)
Business value US$ 17,520 million US$ 6,143 million
Electricity production > 5% producing 28 TWh
(2012) 0.03% with 0.2
TWh (2002)
0.1% producing 5.2 TWh (2012)
CO2 emissions 10 million metric tons
avoided (2011)
Impact is poor; rather it increased
RESULTS (OUTPUTS & OUTCOMES): INSTALLATIONS
Direct change in installed capacity
Impacts on the energy transition (electricity
generated, electricity mix), environmental
aspect (GHG avoided), & economic benefits
(business values)
Installation
support FIT
PV cell
price
drop
(IEA-PVPS)
(Eurobserv’er, EPIA, Fraunhofer)
52%
26%
13%
1%
| PAGE 14
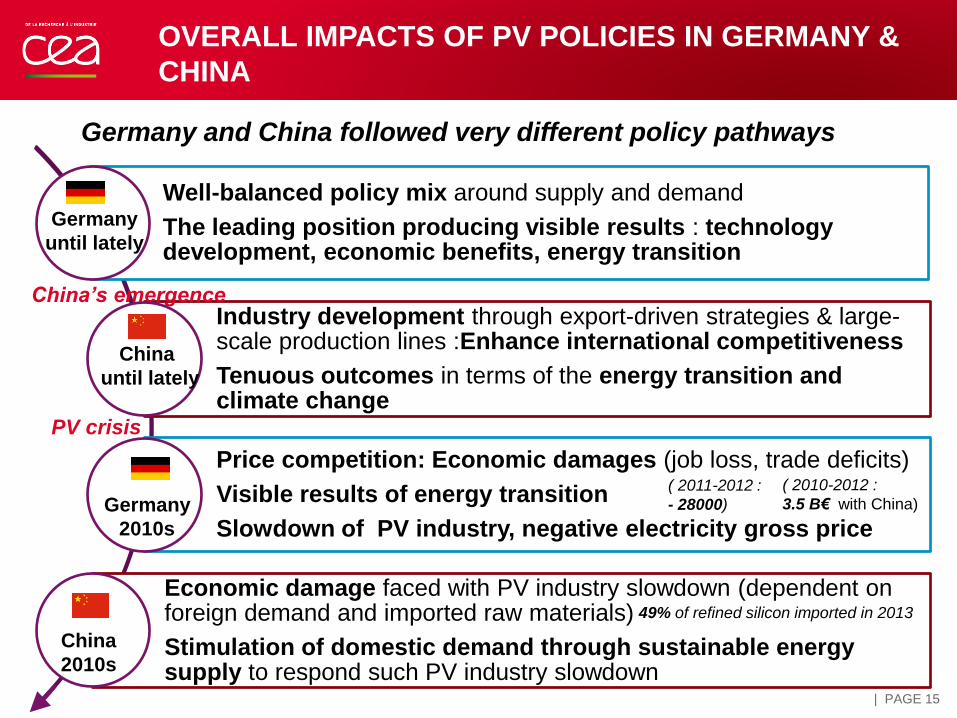
OVERALL IMPACTS OF PV POLICIES IN GERMANY &
CHINA
Well-balanced policy mix around supply and demand
The leading position producing visible results : technology development, economic benefits, energy transition
Industry development through export-driven strategies & large-scale production lines :Enhance international competitiveness
Tenuous outcomes in terms of the energy transition and climate change