econstor Make Your Publications Visible. A Service of zbw Leibniz-Informationszentrum Wirtschaft Leibniz Information Centre for Economics Ueda, Masashi; Park, Yousin; Chen, Yunju Conference Paper A comparison analysis of smart phone competition model: Korean case and Japanese case 19th ITS Biennial Conference 2012, Bangkok, Thailand, 18 - 21 November 2012: Moving Forward with Future Technologies: Opening a Platform for All Provided in Cooperation with: International Telecommunications Society (ITS) Suggested Citation: Ueda, Masashi; Park, Yousin; Chen, Yunju (2012) : A comparison analysis of smart phone competition model: Korean case and Japanese case, 19th ITS Biennial Conference 2012, Bangkok, Thailand, 18 - 21 November 2012: Moving Forward with Future Technologies: Opening a Platform for All, ITS, Bangkok This Version is available at: http://hdl.handle.net/10419/72494 Standard-Nutzungsbedingungen: Die Dokumente auf EconStor dürfen zu eigenen wissenschaftlichen Zwecken und zum Privatgebrauch gespeichert und kopiert werden. Sie dürfen die Dokumente nicht für öffentliche oder kommerzielle Zwecke vervielfältigen, öffentlich ausstellen, öffentlich zugänglich machen, vertreiben oder anderweitig nutzen. Sofern die Verfasser die Dokumente unter Open-Content-Lizenzen (insbesondere CC-Lizenzen) zur Verfügung gestellt haben sollten, gelten abweichend von diesen Nutzungsbedingungen die in der dort genannten Lizenz gewährten Nutzungsrechte. Terms of use: Documents in EconStor may be saved and copied for your personal and scholarly purposes. You are not to copy documents for public or commercial purposes, to exhibit the documents publicly, to make them publicly available on the internet, or to distribute or otherwise use the documents in public. If the documents have been made available under an Open Content Licence (especially Creative Commons Licences), you may exercise further usage rights as specified in the indicated licence. www.econstor.eu
Transcript
econstorMake Your Publications Visible.
A Service of
zbwLeibniz-InformationszentrumWirtschaftLeibniz Information Centrefor Economics
Ueda, Masashi; Park, Yousin; Chen, Yunju
Conference Paper
A comparison analysis of smart phone competitionmodel: Korean case and Japanese case
19th ITS Biennial Conference 2012, Bangkok, Thailand, 18 - 21 November 2012: MovingForward with Future Technologies: Opening a Platform for All
Provided in Cooperation with:International Telecommunications Society (ITS)
Suggested Citation: Ueda, Masashi; Park, Yousin; Chen, Yunju (2012) : A comparison analysisof smart phone competition model: Korean case and Japanese case, 19th ITS BiennialConference 2012, Bangkok, Thailand, 18 - 21 November 2012: Moving Forward with FutureTechnologies: Opening a Platform for All, ITS, Bangkok
This Version is available at:http://hdl.handle.net/10419/72494
Standard-Nutzungsbedingungen:
Die Dokumente auf EconStor dürfen zu eigenen wissenschaftlichenZwecken und zum Privatgebrauch gespeichert und kopiert werden.
Sie dürfen die Dokumente nicht für öffentliche oder kommerzielleZwecke vervielfältigen, öffentlich ausstellen, öffentlich zugänglichmachen, vertreiben oder anderweitig nutzen.
Sofern die Verfasser die Dokumente unter Open-Content-Lizenzen(insbesondere CC-Lizenzen) zur Verfügung gestellt haben sollten,gelten abweichend von diesen Nutzungsbedingungen die in der dortgenannten Lizenz gewährten Nutzungsrechte.
Terms of use:
Documents in EconStor may be saved and copied for yourpersonal and scholarly purposes.
You are not to copy documents for public or commercialpurposes, to exhibit the documents publicly, to make thempublicly available on the internet, or to distribute or otherwiseuse the documents in public.
If the documents have been made available under an OpenContent Licence (especially Creative Commons Licences), youmay exercise further usage rights as specified in the indicatedlicence.
www.econstor.eu
The 19th ITS Biennial Conference 2012 “Moving Forward with Future Technologies:
Opening a Platform for All” 18 -‐ 21 November 2012, Thailand
A comparison analysis of smart phone competition model: Korean
case and Japanese case Masashi Ueda1, Yousin Park2, and Yunju Chen3
Economist, Competition Policy Research Center, Japan Fair Trade Commission1, Asc. Prof., Ube National Collage of Technology2, Asc. Prof., Shiga University3
This paper investigated the driving force of diffusion in smart phone market by analysing usage of them and making their component model. Main findings are following four: 1) In Korea and Japan their average smart phones’ traffic per user has been the world's highest level. But its diffusion pattern is very different. 2) The Korean government and private companies strongly support diffusion of smart phones but not so much in Japan. 3) Korean and Japanese Mobile phone companies and/or manufacturers try to build their application stores. They collect funds for developing tools and application developers. 4) Importance of customises or localise for drastic diffusion.
Keywords: Smartphone, diffusion pattern, path dependency, Component Model. JEL Classification for Economic and Laws: L22, L21
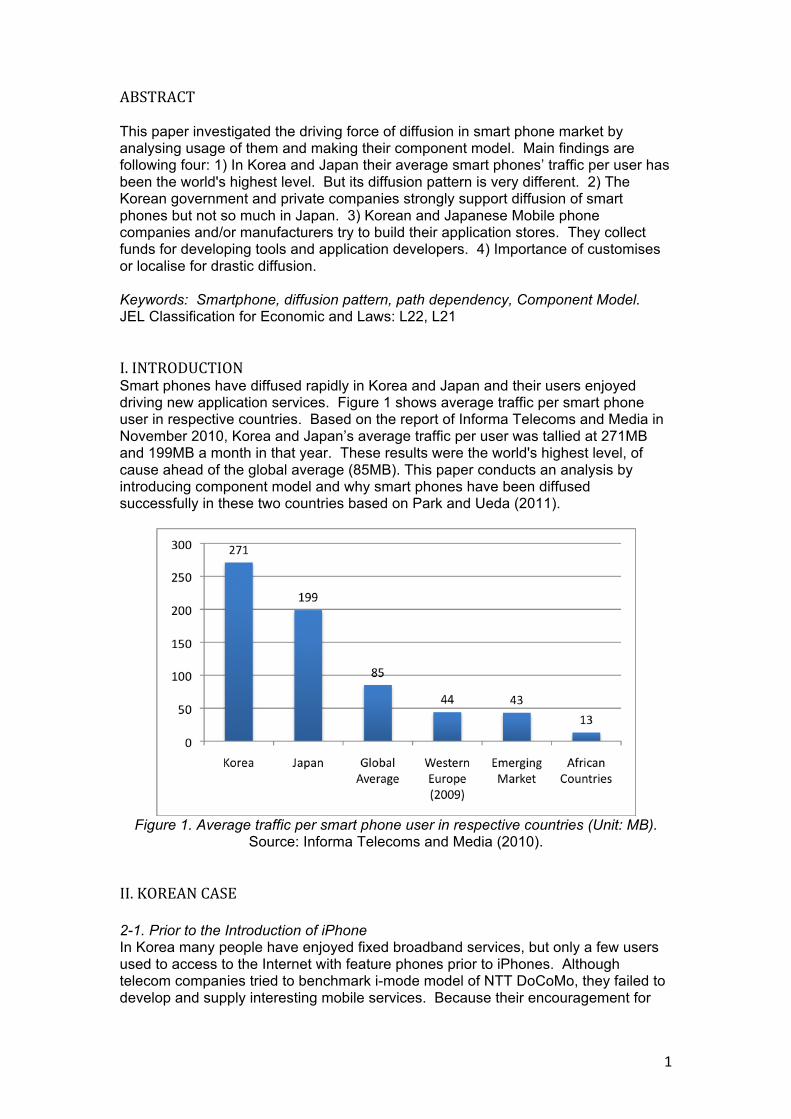
I. INTRODUCTION Smart phones have diffused rapidly in Korea and Japan and their users enjoyed driving new application services. Figure 1 shows average traffic per smart phone user in respective countries. Based on the report of Informa Telecoms and Media in November 2010, Korea and Japan’s average traffic per user was tallied at 271MB and 199MB a month in that year. These results were the world's highest level, of cause ahead of the global average (85MB). This paper conducts an analysis by introducing component model and why smart phones have been diffused successfully in these two countries based on Park and Ueda (2011).
Figure 1. Average traffic per smart phone user in respective countries (Unit: MB). Source: Informa Telecoms and Media (2010).
II. KOREAN CASE
2-1. Prior to the Introduction of iPhone In Korea many people have enjoyed fixed broadband services, but only a few users used to access to the Internet with feature phones prior to iPhones. Although telecom companies tried to benchmark i-mode model of NTT DoCoMo, they failed to develop and supply interesting mobile services. Because their encouragement for
2
contents provider was very limited and contents market over mobile network was still inactive condition. 2-2. iPhone’s Shock In November 2009, Korea Telecom (KT) introduced iPhone 3 and acquired 1.67million subscribers in December 2010. iPhone provided interesting third-party application services like Twitter and Facebook, etc., and many people rush to enjoy them. Figure 2 shows the cumulative subscribers of smart phone, iPhone and Galaxy S users in Korea. As shown, SK Telecom, SKT, released Galaxy S, and KT, released iPhone, have acquired the number of smart phone subscribers quickly, and telecom companies had about 6.26 million subscribers in November 2010. They provided a strong impact in the Korean life. For example, taking the subway in Korea, you may see an interesting phenomenon. There are many people including men or women, young or old busy driving smart phones (see Figure 3).
Figure 2. The cumulative subscribers of iPhone and Galaxy S in Korea (Unit: ten
thousand). Source: Based on Respective Company’s Released Data.
Figure 3. Riders’ Driving Usage of Smart phones in Seoul’s Subway in Korea.
Source: http://blog.naver.com/shinsuper/50097706770?copen=1. To figure out what they do with their smart phones, we cited the surveys of Korea Internet and Security Agency (KISA). It conducted a questionnaire survey three times in 2010. Smart phone users drive about 1.9 hour per day on the average and 39.9% of all users enjoy smart phones for over 2 hours daily. They drive frequently
3
smart phones at lunch break (from 12:00 to 13:00) and during rush hours (from 18:00 to 19:00) on weekdays and at the daytime on holiday and weekends. Over 70% of smart phone users enjoy driving smart phones in transportation on the move (79%) and at home (73%). It is consistent with the previous result that they drive frequently smart phones during rush hours. In particular, the use of smart phones in Transportation on the move (from 77% in May to 79% in Nov.), Home (from 55% to 73%) and Workplaces (from 44% to 50%) has increased. So, we can say people start using smart phones at work and for fun as well.
Table 1. The Purposes of Smart phones Driving Usage.
Purposes FP Usage (%)
SP Usage (%)
Change Rate (%)
1 Decoration 80.0 82.7 3.4 2 MMS 76.4 74.5 -2.5 3 Downloading or streaming music 33.7 54.8 62.6
4 Information search and general web surfing 27.0 46.1 70.7
5 Gaming or downloading game 22.5 34.6 53.8 6 e-mail 8.0 21.5 168.8 7 Mobile banking 11.9 19.4 63.0 8 News 9.6 17.2 79.2 9 Blog 4.8 15.9 231.3 10 Downloading/streaming video 6.7 14.9 122.4
Source: Korea Internet and Security Agency (2010c). Figure 5 illustrates that purposes of smart phones driving. Among all smart phone users, 78.8% use it for communicating via ‘MMS (71.7%)’, 'e-mail (16.4%)’, etc., and 66.8% use it for leisure activities such as 'Decorating phone (e.g. downloading ringtones or background images)’ at 57.3% or 'Downloading or streaming music’ at 35.6%. Meanwhile, those who are getting information or data by 'Information search and general web surfing (19.9%)’, 'News (19.8%)’, etc. account for 38.9%, while the rate of using location-based services such as 'Navigation (9.9%)’ and economic activities such as 'Mobile banking (13.4%)’ are 19.3% and 18.4%, respectively.
Figure 4. Employer’ Providing Mobile Office Service for Employees Aged 18 or over
(Unit: %). Source: Korea Internet and Security Agency (2010a, 2010b).
Some companies started supporting their employees’ purchase of smart phone devices and share their monthly charge. 16.8% provide full support (including full
4
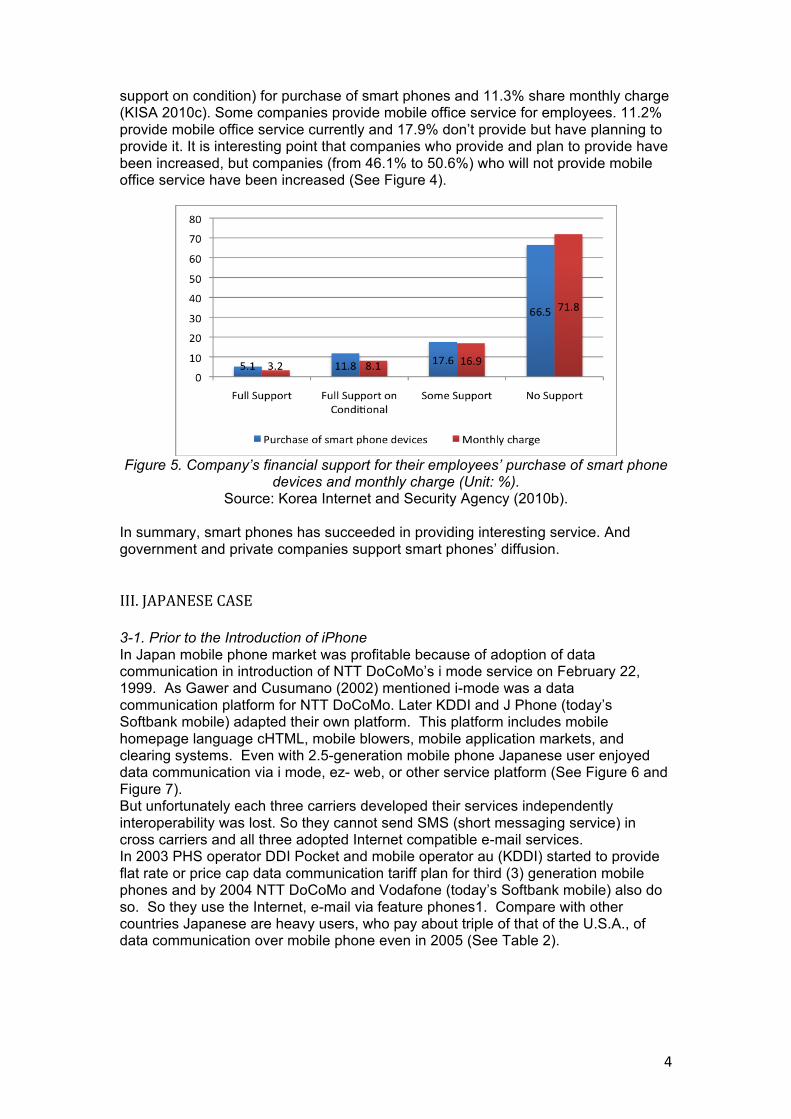
support on condition) for purchase of smart phones and 11.3% share monthly charge (KISA 2010c). Some companies provide mobile office service for employees. 11.2% provide mobile office service currently and 17.9% don’t provide but have planning to provide it. It is interesting point that companies who provide and plan to provide have been increased, but companies (from 46.1% to 50.6%) who will not provide mobile office service have been increased (See Figure 4).
Figure 5. Company’s financial support for their employees’ purchase of smart phone
devices and monthly charge (Unit: %). Source: Korea Internet and Security Agency (2010b).
In summary, smart phones has succeeded in providing interesting service. And government and private companies support smart phones’ diffusion. III. JAPANESE CASE 3-1. Prior to the Introduction of iPhone In Japan mobile phone market was profitable because of adoption of data communication in introduction of NTT DoCoMo’s i mode service on February 22, 1999. As Gawer and Cusumano (2002) mentioned i-mode was a data communication platform for NTT DoCoMo. Later KDDI and J Phone (today’s Softbank mobile) adapted their own platform. This platform includes mobile homepage language cHTML, mobile blowers, mobile application markets, and clearing systems. Even with 2.5-generation mobile phone Japanese user enjoyed data communication via i mode, ez- web, or other service platform (See Figure 6 and Figure 7). But unfortunately each three carriers developed their services independently interoperability was lost. So they cannot send SMS (short messaging service) in cross carriers and all three adopted Internet compatible e-mail services. In 2003 PHS operator DDI Pocket and mobile operator au (KDDI) started to provide flat rate or price cap data communication tariff plan for third (3) generation mobile phones and by 2004 NTT DoCoMo and Vodafone (today’s Softbank mobile) also do so. So they use the Internet, e-mail via feature phones1. Compare with other countries Japanese are heavy users, who pay about triple of that of the U.S.A., of data communication over mobile phone even in 2005 (See Table 2).
5
Figure 6. Mobile Subscribers of NTT DoCoMo.
Source: NTT DoCoMo Financial Reports.
Figure 7. ARPU of each three mobile phone carriers (Unit: Japanese Yen)
Source: each company’s financial reports.
Table 2. Mobile ARPU in 2005 (Unit: USD) Voice Data Total Data ratio
Table 4. The Purposes of Smart phones Driving Usage Service/functions Usage rate Smart phone usage
1 e-mail 92.0% 60.2% 2 Camera 77.0% 3 Decoration 69.0% 4 Internet 63.5% 78.2% 5 Photo mail 56.0% 6 TV player 39.2%
7 Applications Games 34.7% 63.0%
52.8% 8 Security 34.5% 9 Movie 34.1%
10 Video mail 32.5% 50.9% 11 PC file view 26.5% 12 Ringtone songs download 24.8% 57.40% 13 Music player 24.7% 14 GPS 24.0% 49.50% 15 e Books 19.5% 16 SNS/Blog 19.3% 17 Scheduling 17.2% 50.90% 18 Infrared communication 17.2% 19 Wallpaper download 16.3% 20 Mobile wallet 16.0% 21 File download from PC 15.0% 22 International roaming 15.0% 23 Ringtone download 14.7% 24 RSS 14.0% 25 Twitter 13.5% 26 Bluetooth 10.0% 27 Mobile banking 9.7% 28 Pedometer 3.3% 29 Video chat 1.2%
Source: Communications and Information network Association of Japan (CIAJ) 3-2. iPhone’s Shock By 2010 switching cost to smart phone in Japan was relatively higher than other countries and only third largest operator Softbank mobile officially provided Japanese iPhone. So iPhone shock was mild. After introduction of non-iPhone handset including Galaxy S, REGZA Phone, Lynx/IS03, and Japanese smart phone market
7
was expanded because some of them provide useful functions of feature phones. According to CIAJ’s report (2010), usages of smart phones are globally practical use now and some popular function was lack, like TV player, mobile wallet, and Infrared communication (See Table 4). So switch over speed was slow than other countries. In December 2010 smart phones’ share was recorded as 48.1% (See Figure 8). In summary although there are excess inertia for feature phones Japanese smart phone market is glowing adapting Galapagos functions now.
Table 5. Smart phone diffusion in Japan (Unit: thousand). FY 2008 2009
Total shipments 35,890 34,440
Smart phone shipments 1,200 2,340
Smart phone contracts 1,200 3,150
Smart phones’ share 3.3% 6.8% Source: MM Research Institute.
Figure 8. Smart phone sales share.
Source: BCN news release. IV. MARKET STRUCTURE OF SMART PHONE FOR VENDORS AND OPERATORS 4-‐1. Feature Phones of Korea and Japan In general both feature phone is almost same; mobile wallet, infrared-‐ray communication, dual camera, and carrier based platform service, like e-‐mail, cHTML, settlement service, etc. Different point is that this domestic proprietary services and software were very rich in Japan while there is no flat rate mobile data plan and most of user are contented just using fixed broadband in Korea. 4-‐2. Impact of iPhone for Korea and Japan. Apple started to provide application market cross over the countries over the iPhone platform while we used familiar services over carrier-‐based platform. In the case of
8
Korea it’s very limited and easy to move to Apple’s platform but not the case in Japan. Here we should pay switching cost by giving up regency useful platform. Instead of it in each mobile phone markets domestic smart phones were introduced. They provided both huge service market and familiar services over carrier-‐based platform. This reduced users’ switching costs. 4-‐3. Modelling and Imprecations We used component model for smart phones based up on both countries competitive situation (Ueda 2008, Ueda et al. 2009).
Figure 9 Component modelling of mobile phone and applications.
In smart phone market bargaining power of each entity are changed. Traditionally Telecom companies had strong power for handset in both Korea and Japan while Nokia was a key player in European market (See Figure 9). In Korea, KT, SKT and Samsung had strong bargaining power. But after introduction of smart phones, they utilize Android market and tried to build their Application Store and support funds for developing tools and application developers. In Japan, NTT DoCoMo governed the mobile market from application/service layer to handset layer. But after introduction of smart phone DoCoMo utilize Android market instead of their own official site and they have a revenue share agreement. More over in feature phone world it provided certain amount of R&D cost for vendors while smart phone world it’s support fund was very limited (See Figure 9).
Figure 10. Three steps model of smart phone handset diffusion.
9
Finally both countries introduce their domestic branded smart phones. This phenomenon is thought to be a kind of reduction of switching cost of users. Figure 10 illustrates three steps of smart phone handset diffusion. At first stage overseas smart phone was introduced in domestic market. At that time early adapters rush to them though any cost but majorities still use feature phone. In the second stage domestic branded smart phone or locally cauterised smart phone should be introduced. Then diffusion level will be matured.
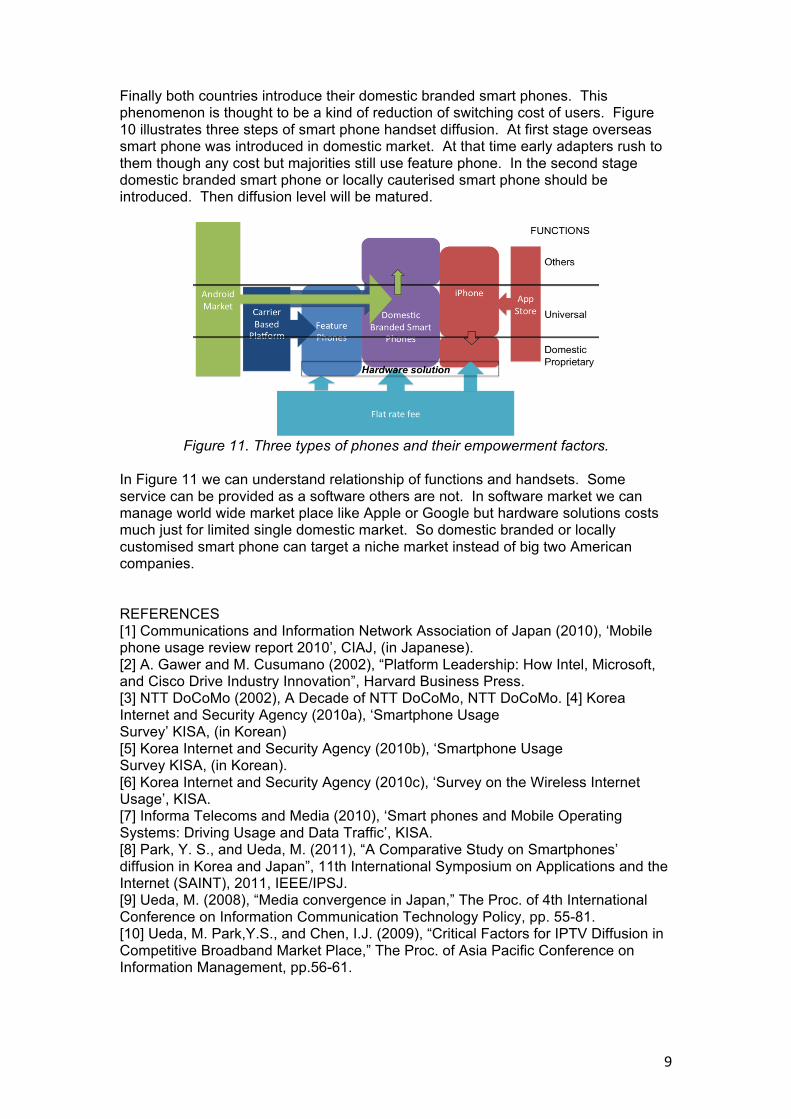
Figure 11. Three types of phones and their empowerment factors.
In Figure 11 we can understand relationship of functions and handsets. Some service can be provided as a software others are not. In software market we can manage world wide market place like Apple or Google but hardware solutions costs much just for limited single domestic market. So domestic branded or locally customised smart phone can target a niche market instead of big two American companies. REFERENCES [1] Communications and Information Network Association of Japan (2010), ‘Mobile phone usage review report 2010’, CIAJ, (in Japanese). [2] A. Gawer and M. Cusumano (2002), “Platform Leadership: How Intel, Microsoft, and Cisco Drive Industry Innovation”, Harvard Business Press. [3] NTT DoCoMo (2002), A Decade of NTT DoCoMo, NTT DoCoMo. [4] Korea Internet and Security Agency (2010a), ‘Smartphone Usage Survey’ KISA, (in Korean) [5] Korea Internet and Security Agency (2010b), ‘Smartphone Usage Survey KISA, (in Korean). [6] Korea Internet and Security Agency (2010c), ‘Survey on the Wireless Internet Usage’, KISA. [7] Informa Telecoms and Media (2010), ‘Smart phones and Mobile Operating Systems: Driving Usage and Data Traffic’, KISA. [8] Park, Y. S., and Ueda, M. (2011), “A Comparative Study on Smartphones’ diffusion in Korea and Japan”, 11th International Symposium on Applications and the Internet (SAINT), 2011, IEEE/IPSJ. [9] Ueda, M. (2008), “Media convergence in Japan,” The Proc. of 4th International Conference on Information Communication Technology Policy, pp. 55-81. [10] Ueda, M. Park,Y.S., and Chen, I.J. (2009), “Critical Factors for IPTV Diffusion in Competitive Broadband Market Place,” The Proc. of Asia Pacific Conference on Information Management, pp.56-61.