Bachelor of Science Thesis KTH School of Industrial Engineering and Management Energy Technology EGI-2015 SE-100 44 STOCKHOLM A comparison between two different methods of combustion; Grate-fired and Fluidized bed, applied to a CHP-plant with MSW as fuel Belkiz Hasan Aidin Ahsant Kandidatexamensarbete KTH – Skolan för Industriell Teknik och Management Energiteknik EGI- 2015
Transcript
Bachelor of Science Thesis
KTH School of Industrial Engineering and Management
Energy Technology EGI-2015
SE-100 44 STOCKHOLM
A comparison between two different
methods of combustion; Grate-fired and
Fluidized bed, applied to a CHP-plant with
MSW as fuel
Belkiz Hasan
Aidin Ahsant
Kandidatexamensarbete
KTH – Skolan för Industriell Teknik och Management Energiteknik EGI-
2015
Bachelor of Science Thesis EGI-2015
A performance comparison between the
Grate-fired and Fluidized bed combustion of
Municipal Solid Waste and RDF as a fuel for
CHP plant applications
Belkiz Hasan
Aidin Ahsant Approved
2015-05-18
Examiner
Peter Hagström
Supervisor
Jeevan Jayasuriya
Commissioner
Department of Energy
Technology , KTH
Contact person
Abstract In this study, the two most frequently used incineration systems, fluidized bed and grate-firing
have been compared and analyzed. The performance of Mälarenergi’s combined heat and power
(CHP) plant in Västerås, which consists of a fluidized bed incinerator, has been used as
benchmark to elaborate the different calculations made in this study. It extracts electricity and
heat amounting to 50 and 100 MW respectively.
On average, 75-85% of the weight of Municipal Solid Waste (MSW) is converted into Refuse
Derived Fuel (RDF). One ton of RDF which is used as fuel in fluidized bed boilers has a calorific
value of 16.6 MJ/kg while the calorific value of one ton MSW used as fuel in grate-fired boilers
was calculated to 9.15 MJ/kg. The total amount of extracted energy in regards of heat and
electricity for the grate-fired incineration was computed to 2.54 MWh/ton, while it was calculated
to 4.63 MWh/ton using the fluidized bed incineration.
A simple Rankine cycle was used to understand the significance of better steam qualities in the
incinerators, and to learn the difference between the total power output and the turbine
efficiency. The total power output was provided with enthalpy values of different steam
conditions using a constant mass flow in the cycle. For grate-firing, the amount was calculated to
10 829 kJ/s and for fluidized bed it was calculated to 11 245 kJ/s. Using the different enthalpy
values, the isentropic turbine efficiency of grate-firing and fluidized bed were calculated to 71 and
80%, respectively.
The yearly amount of waste each incinerator requires to reach the performance of Mälarenergi’s
CHP-plant was calculated and used to perform a profitability analysis. The efficiency of this plant
using a fluidized bed is 90%, whilst two different efficiencies of 75 and 85% were used for the
grate-firing. The higher net present value was concluded belonging to the fluidized bed plant
with an amount of 9978 Mkr, whilst the net present value of the grate-firing measured to 8146
and 6407 Mkr.
Emissions of carbon dioxide (CO2) were calculated to be higher when incinerating one ton of
MSW in a grate-fire, than of incinerating one ton RDF in a fluidized bed. In comparison,
emissions of nitrogen oxides (NOx) became higher in a fluidized bed than in a grate-fire, with the
same amount of fuel. CO2 emissions from a grate-fire respectively fluidized bed were measured
to 47.24 and 23.75 kg, whilst the NOx emissions were measured to 0.73 respectively 1.16 kg.
The fluidized bed incinerator was considered the preferable alternative when incinerating waste,
from all three different regarded perspectives - energy based, financial and environmental.
Sammanfattning I den här rapporten har de två mest användbara förbränningssystemen, rosterpannan och den
fluidiserade pannan, jämförts och analyserats. Prestandan av Mälarenergis kraftvärmeverk i
Västerås, som består av en fluidiserad panna, har använts som utgångspunkt i undersökningens
olika beräkningar med en prestanda uppmätt till 50 MW elektricitet respektive 100 MW värme.
I genomsnitt konverteras cirka 75-85% av mängden Municipal Solid Waste (MSW) till Refuse
Derived Fuel (RDF). Vid förbränning av ett ton RDF i en fluidiserad panna ges ett värmevärde
på 16.6 MJ/kg medan motsvarande värmevärde vid förbränning av ett ton MSW i rosterpanna
beräknades till 9.15 MJ/kg. Den totala mängden energi i avseende på elektricitet och värme vid
förbränning i rosterpanna uppmättes till 2.54 MWh/ton medan den vid förbränning i fluidiserad
panna gav ett värde på 4.63 MWh/ton.
En enkel Rankine cykel användes för att förstå betydelsen av förbättrad ångdata i förbrännarna,
samt för att undersöka skillnaden i den totala kraften ut från systemet och turbin effektiviteten.
Den totala mängden utvunnen energi ges av entalpivärden för olika nivåer av ångdata med ett
konstant massflöde i cykeln. Gällande rosterpanna beräknades den totala mängden till 10 829
kJ/s medan den för fluidiserad panna uppmättes till 11 245 kJ/s. Med hjälp av olika
entalpivärden kunde sålunda den isentropiska turbineffektiviteten för rosterpanna och fluidiserad
panna beräknas till 71 respektive 80%.
Den årliga mängden avfall som respektive system behöver för att uppnå prestandan hos
Mälarenergis kraftvärmeverk räknades ut och användes i en lönsamhetsanalys. Effektiviteten vid
förbränning hos detta kraftvärmeverk med en fluidiserad panna ligger på 90% medans två olika
effektiviteter, 75 och 85% ansattes som rosterpannans effektivitet. Det högsta nuvärdet
beräknades och gavs av den fluidiserade pannan och uppmättes till 9978 miljoner kronor medan
nuvärdet för rosterpannan beräknades till 8146 och 6407 miljoner kronor.
Utsläppen av koldioxid (CO2) bevisades vara högre vid förbränning av ett ton MSW i en
rosterpanna, än vid förbränning av ett ton RDF i en fluidiserad panna. Med samma mängd
förbränt bränsle gavs en högre mängd utsläppt kväveoxid (NOx) från en fluidiserad panna än
från en rosterpanna. CO2 utsläppen uppmäts till 47.24 och 23.75 kg medan NOx utsläppen
uppmäts till 0.73 och 1.16 kg för en rosterpanna respektive fluidiserad panna.
Den fluidiserade pannan bedömdes vara det fördelaktiga valet vid förbränning av avfall i
avseende på alla de tre olika betraktade perspektiven – energibaserade, finansiella och
miljömässiga.
Acknowledgment This report is a bachelor thesis, written at the Department of Energy at the Royal Institute of
Technology (KTH), during the spring of 2015. It has been an intense, providing and especially
instructive project.
Several people have helped us tremendously in our journey. We would like to thank our
supervisor Jeevan Jayasuriya for his continuous guidance and help during the project, and also for
extending our interest in this subject.
We would also like to direct our special gratitude to Fredrik Starfelt, who took time to be
interviewed and enabled a study visit to Mälarenergi in Västerås, where invaluable information
was provided.
Nomenclature Term Index Unit
Temperature 𝑇 °C
Pressure 𝑃 𝑏𝑎𝑟
Higher heating value 𝐻𝐻𝑉 𝑀𝐽/𝑘𝑔
Lower heating value 𝐿𝐻𝑉 𝑀𝐽/𝑘𝑔
Lower heating value household waste 𝐿𝐻𝑉𝐻𝑜𝑢𝑠𝑒ℎ𝑜𝑙𝑑 𝑀𝐽/𝑘𝑔
Lower heating value industry waste 𝐿𝐻𝑉𝐼𝑛𝑑𝑢𝑠𝑡𝑟𝑦 𝑀𝐽/𝑘𝑔
Total extracted energy grate-firing 𝐸𝐺𝑟𝑎𝑡𝑒−𝑓𝑖𝑟𝑖𝑛𝑔 𝑀𝑊ℎ/𝑡𝑜𝑛
Total extracted energy fluidized bed 𝐸𝐹𝑙𝑢𝑖𝑑𝑖𝑧𝑒𝑑 𝑏𝑒𝑑 𝑀𝑊ℎ/𝑡𝑜𝑛
The turbine work 𝑤𝑡𝑢𝑟𝑏,𝑜𝑢𝑡 𝑘𝐽/𝑘𝑔
Enthalpy ℎ 𝑘𝐽/𝑘𝑔
Isentropic enthalpy ℎ𝑖𝑠 𝑘𝐽/𝑘𝑔
Mass flow MSW 𝑘𝑔/𝑠
Carbon dioxide 𝐶𝑂2 𝑘𝑔
Nitrogen oxide 𝑁𝑂𝑥 𝑘𝑔
Isentropic turbine efficiency η𝑇 %
The payback period 𝑃𝑃 𝑌𝑒𝑎𝑟
The net present value 𝑁𝑃𝑉 𝐾𝑟
The total power output - 𝑘𝐽/𝑠
Abbreviations and symbols MSW Municipal Solid Waste
RDF Refuse Derived Fuel
EU European Union
US United States
CHP Combined Heat and Power Plant
WTE Waste to Energy
GF Grate-firing/fired
FB Fluidized bed
FBC Fluidized bed combustor
FBI Fluidized bed incineration
BFB Bubbling Fluidized Bed
CFB Circulating Fluidized Bed
RFB Rotating Fluidized Bed
C Proportion of combustible materials
W Moisture content
LHV Lower Heating Value
HHV Higher Heating Value
F Fraction
η Efficiency
𝑀𝑊 Megawatt
𝑀𝐽 Mega joule
𝑀𝑊ℎ Megawatt hour
𝑀𝑊ℎℎ Megawatt hour heat
𝑀𝑊ℎ𝑒 Megawatt hour electricity
𝐶𝑜 The initial outlay
𝐼𝑛𝑐 The sum of the yearly or monthly incomes
𝐸𝑥𝑝 The sum of the yearly or monthly expenses
𝑟 The rate of discount
𝑖 The amount of years
𝐾𝑟 Swedish krona
𝑀𝑘𝑟 Million kronor
𝑘𝑊𝑒 Kilowatt electricity
𝑡𝑜𝑛/𝑦 Tons per year
𝑚/𝑠 Velocity
𝐺𝐹 − 75 Grate-firing with an efficiency of 75%
𝐺𝐹 − 85 Grate-firing with an efficiency of 85%
List of figures
Figure 1.1 MSW generation and management chain ............................................................................. 1
Figure 1.2 The waste hierarchy of the EU ............................................................................................... 2
Figure 2.1 Schematic description of the process of grate-firing ............................................................ 5
Figure 2.2 Schematic description of the process of fluidized bed systems .......................................... 5
Figure 2.3 Schematic description of the gasification process ................................................................ 6
Figure 2.4 Illustrative image of the process of the work ........................................................................ 7
Figure 3.1 Treatment methods for Municipal Solid Waste in Sweden between 1975-2013 ............. 8
Figure 3.2 The RDF-process .................................................................................................................... 10
Figure 3.3 Complete overview of the Grate-firing system ................................................................... 12
Figure 3.4 The grate-firing combustor of moving grates ..................................................................... 13
Figure 3.5 System description of the process of fluidized bed incinerators ...................................... 15
Figure 4.1 The simple Rankine cycle for grate-fired boilers ................................................................ 20
Figure 4.2 The simple Rankine cycle for fluidized bed boilers ............................................................ 21
Figure 4.3 Display of the cash flows being considered and calculated upon to reach the results of
the NPV and PP formulas. ....................................................................................................................... 24
Figure 5.1 Extracted energy in regards of heat and electricity of each incineration system ............ 26
Figure 5.2 The net present value for each incinerator .......................................................................... 27
Figure 5.3 The payback period for each incinerator ............................................................................. 27
Figure 5.4 The relation of the emissions of CO2 and NOx ................................................................. 28
Figure 6.1 Extracted energy in regards of heat and electricity for the FB incineration with two
different lower heating values ................................................................................................................... 29
Figure 6.2 Net present value with changing electricity and heating prices ........................................ 30
List of tables Table 4.1 Higher heating value, combustible and moisture contents of the household waste ...... 18
Table 4.2 Waste fractions for household- and industrial waste ........................................................... 18
Table 4.3 The percentage of heat and electricity generated at the CHP plant in Västerås .............. 19
Table 4.4 Effects and efficiencies with/without the flue gas condenser ........................................... 22
Table 11.1 Lower heating value for each combustible material. ......................................................... 40
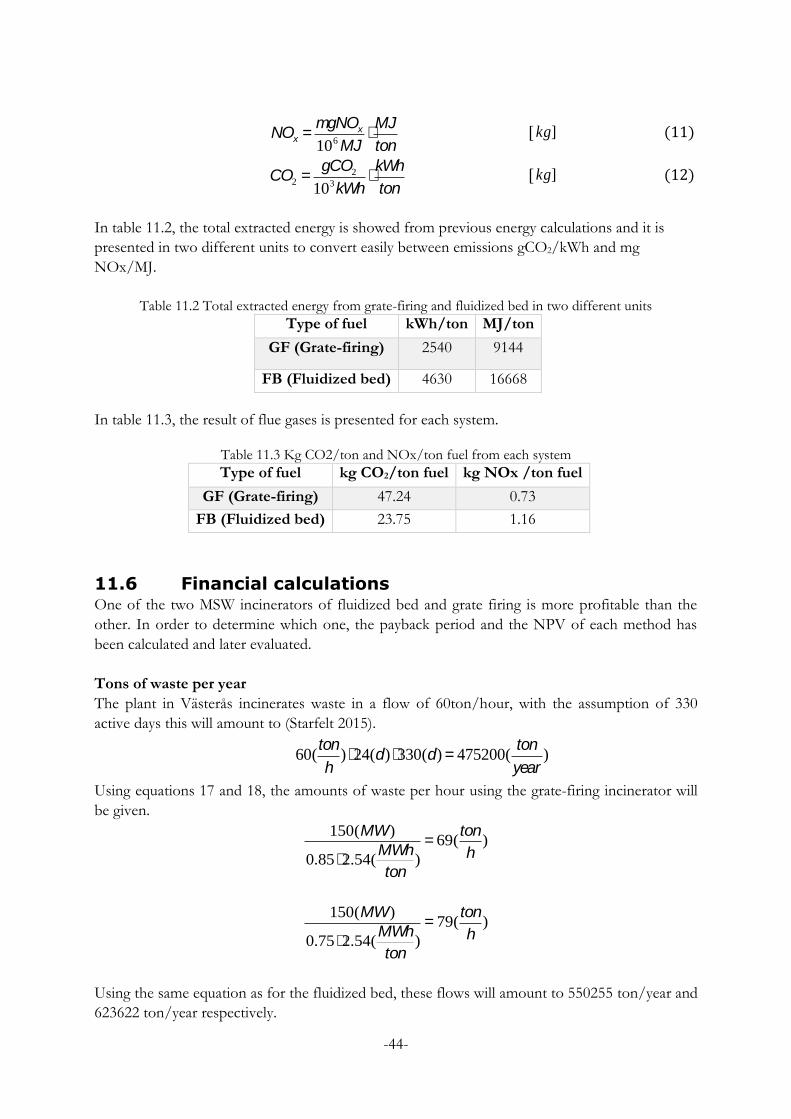
Table 11.2 Total extracted energy from grate-firing and fluidized bed in two different units ....... 44
Table 11.3 Kg CO2/ton and NOx/ton fuel from each system .......................................................... 44
Table 11.4 Initial investment costs for FB and grate-firing incinerators ........................................... 45
Table 11.5 Waste costs for the FB and grate-firing plants .................................................................. 45
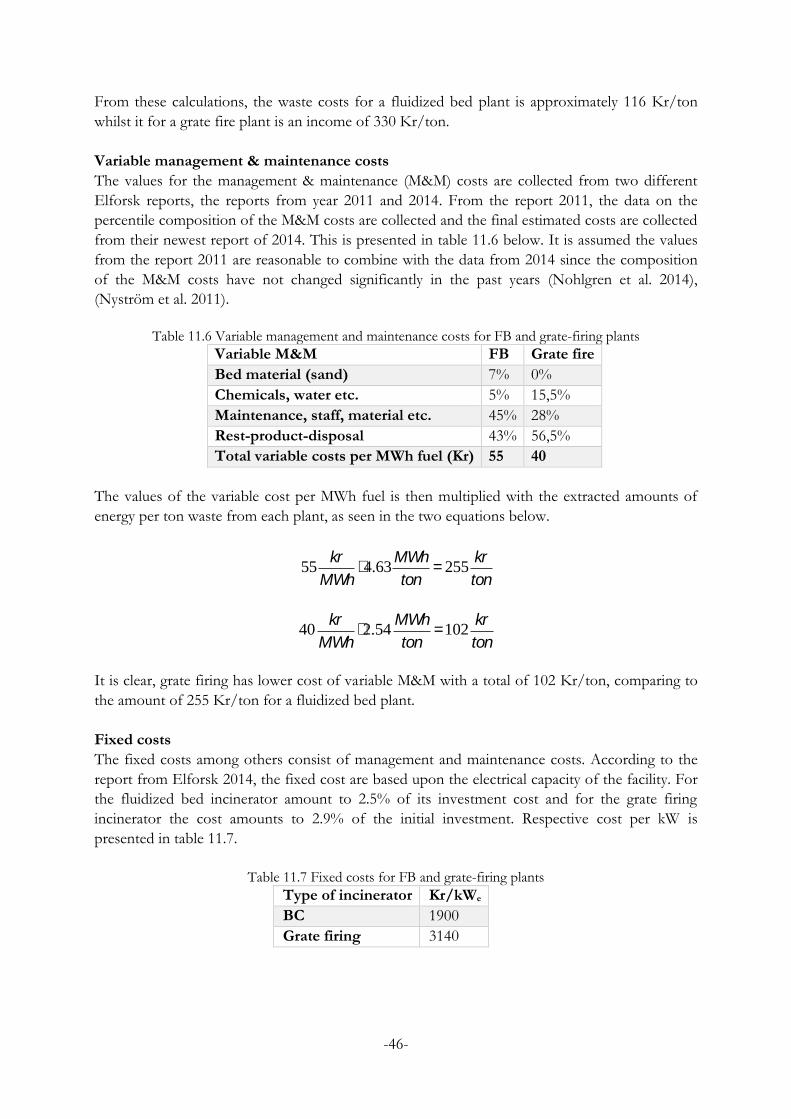
Table 11.6 Variable management and maintenance costs for FB and grate-firing plants ............... 46
Table 11.7 Fixed costs for FB and grate-firing plants........................................................................... 46
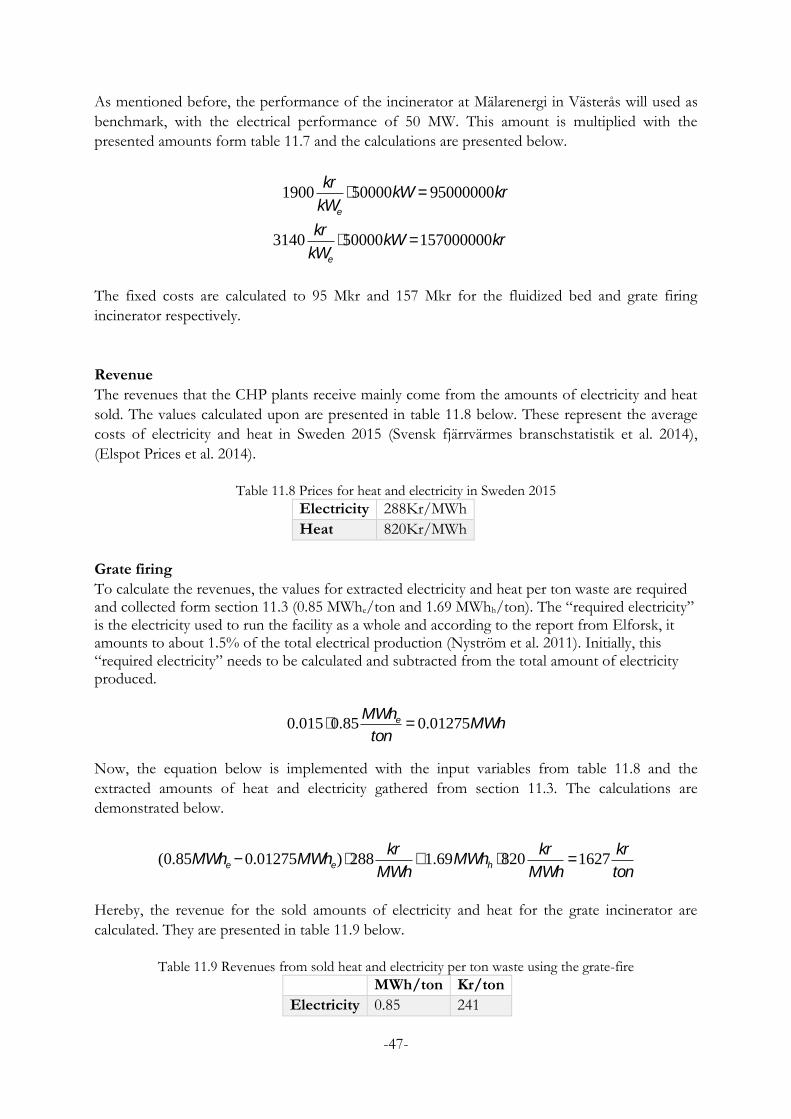
Table 11.8 Prices for heat and electricity in Sweden 2015 ................................................................... 47
Table 11.9 Revenues from sold heat and electricity per ton waste using the grate-fire ................... 47
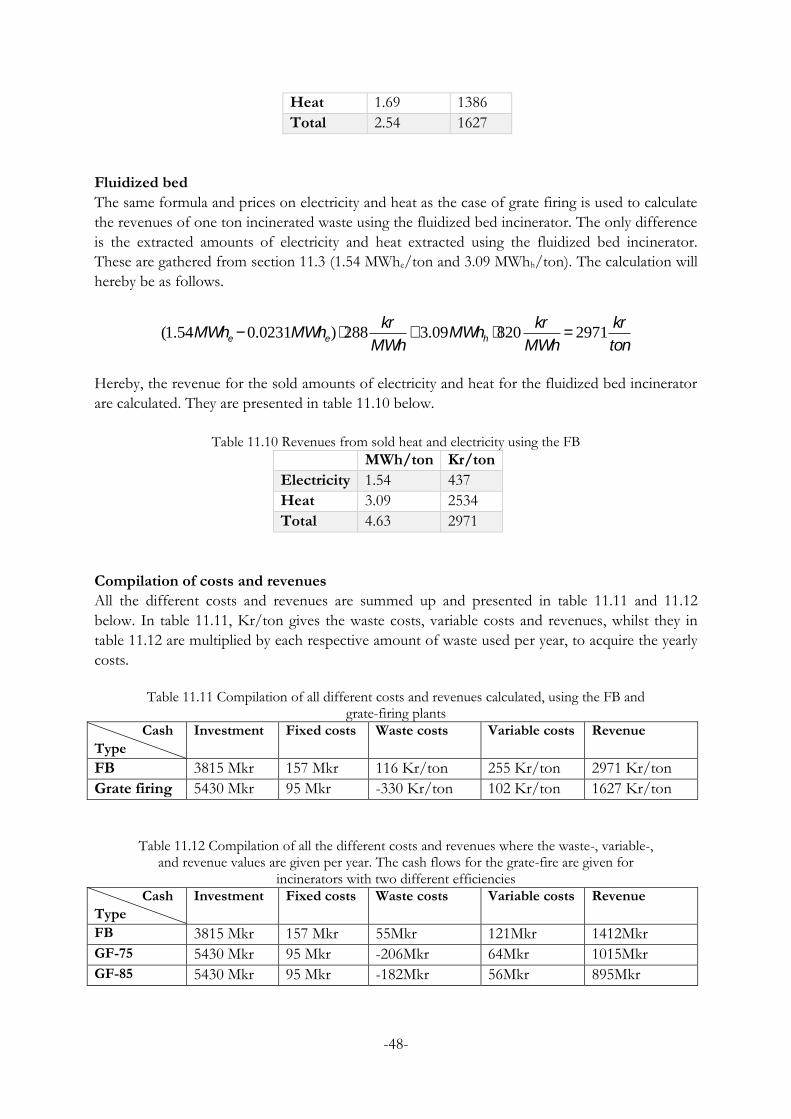
Table 11.10 Revenues from sold heat and electricity using the FB .................................................... 48
Table 11.11 Compilation of all different costs and revenues calculated, using the FB and grate-
Table 11.12 Compilation of all the different costs and revenues where the waste-, variable-, and
revenue values are given per year. The cash flows for the grate-fire are given for incinerators with
two different efficiencies ........................................................................................................................... 48
Table 11.13 The result of the payback period for each incinerator .................................................... 49
Table 11.14 The result of the NPV for each incinerator ...................................................................... 49
Table of Contents 1 Introduction ........................................................................................................................................... 1
1.1 Municipal solid waste and waste treatment methods ............................................................... 1
1.2 Problem description ...................................................................................................................... 3
2.2 The process of the study .............................................................................................................. 6
3 Literature study ...................................................................................................................................... 8
9 Future work .......................................................................................................................................... 34
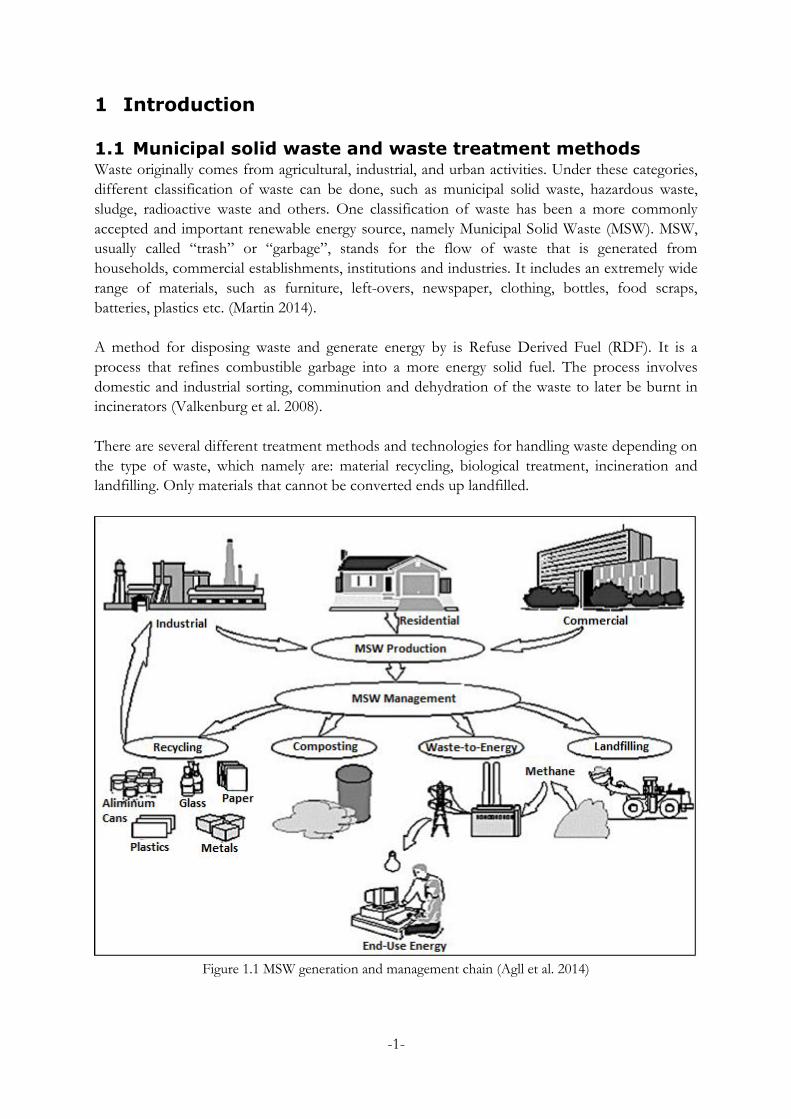
1.1 Municipal solid waste and waste treatment methods Waste originally comes from agricultural, industrial, and urban activities. Under these categories,
different classification of waste can be done, such as municipal solid waste, hazardous waste,
sludge, radioactive waste and others. One classification of waste has been a more commonly
accepted and important renewable energy source, namely Municipal Solid Waste (MSW). MSW,
usually called “trash” or “garbage”, stands for the flow of waste that is generated from
households, commercial establishments, institutions and industries. It includes an extremely wide
range of materials, such as furniture, left-overs, newspaper, clothing, bottles, food scraps,
batteries, plastics etc. (Martin 2014).
A method for disposing waste and generate energy by is Refuse Derived Fuel (RDF). It is a
process that refines combustible garbage into a more energy solid fuel. The process involves
domestic and industrial sorting, comminution and dehydration of the waste to later be burnt in
incinerators (Valkenburg et al. 2008).
There are several different treatment methods and technologies for handling waste depending on
the type of waste, which namely are: material recycling, biological treatment, incineration and
landfilling. Only materials that cannot be converted ends up landfilled.
Figure 1.1 MSW generation and management chain (Agll et al. 2014)
-2-
In figure 1.1, the entire MSW generation and management are displayed including each treatment
method. As shown in the figure, waste comes from different areas, primarily industries and
households.
MSW generation has been recognized as an important resource of fuel, partly due to the
increasing industrialization in Sweden and in the EU, where the amount of waste has grown
11.5% in 12 years and is expected to grow an additional 45% by the year of 2020. In 2009, the
average EU generation was measured to 513kg per capita, where the composition was; 38%
landfilled, 20% incinerated, 24% recycled, and the remaining 18% composted. (Ionescu et al.
2013). In Sweden, the environmental goal for waste treatment is to handle at least 50% of the
household waste trough recycling and biological treatment. In 2007, the amount of treated
household waste in Sweden was 4.7 million tons, of which 46.4% was treated and the energy was
extracted in waste-to-energy plants. From material recycling including biological treatment, 48.7%
of the waste could be handled, further 4% of the waste could was handled through landfilling
(Martin 2014).
Figure 1.2 The waste hierarchy of the EU (Avfallshantering 2014)
In figure 1.2 the stages of waste priority is shown, compiled by the EU. The waste prevention is
the first step in the waste hierarchy and it is a priority in both the European and Swedish waste
legislation. Products which require less material and have longer shelf pursued. The second step
means that products containing health and environmentally harmful substances should no longer
exist in the cycle, but be phased out or treated separately before being landfilled, recycled or
incinerated. Thereafter, the energy recovery should be as efficient as possible. In addition to the
energy which is extracted in regards of heat and power, greenhouse gas emissions and the need of
landfilling also reduces. Finally, emissions from disposal of the waste is regulated and reduced as
far as possible (Avfallshantering 2014).
Each EU-country has national policies to minimize waste and reduce the amount of hazardous
substances in waste. In Sweden, Environmental Protection Agency (Naturvårdsverket 2014) is
responsible for this particular work (Avfallshantering 2014).
-3-
1.2 Problem description Every day, tons and tons of municipal solid waste are generated around the globe. They are
managed and treated differently, some ways are better and more efficient than others. The waste
brings huge potential in extracting renewable energy to a planet that consumes more energy than
it reproduces.
There are many different conversion technologies for municipal solid waste generation. This
study will investigate two different thermal treatments of waste, named grate-fire and fluidized
bed to acknowledge their potentials and learn their limitations. These two methods are the most
popular technologies for solid waste treatment and are traditionally used for burning mass. The
input materials are considered to be MSW, the output material in the incinerator is steam in
different conditions due to different limitations. In comparison, better steam conditions in
regards of higher pressure and temperature will generate higher output efficiency in the fluidized
bed than it will in the grate-firing systems. Pre-handled fuel, RDF in fluidized bed systems
provides better steam conditions which lead to higher efficiency, but at the same time costs for
pre-handling is added.
Since gasification still is in development stages, only fluidized bed and grate-firing will be
compared, evaluated and analyzed. Generally, each stage of the thermal processes when
generating heat or electricity from MSW will lead to higher efficiency of the output, but, each
stage naturally also leads to higher costs for the extraction. Evaluations of the two systems must
be made to conclude what alternative is the most efficient, in regards of financial, environmental
and energy aspects.
1.3 Objectives To reach specific goals with this project, objectives are set to explain the problems that eventually
will be answered.
The study will determine:
To analyze the current Municipal Solid Waste (MSW) and Refused Derived Fuel (RDF)
treatment processes and describe the processes involved with energy conversion from
each of them.
Different waste treatment systems (grate-firing and fluidized bed) have different steam
conditions. The effect they make on each incinerator’s efficiency will be analyzed and
calculated on to conclude its influence.
To compare and analyze the different performances of a combined heat and power plant
(CHP) using grate-fired and fluidized bed combustion systems in regards of technical,
environmental and financial aspects and to conclude which incinerator is better in regards
of these perspectives.
-4-
1.4 Limitations Since this particular topic is so wide, several limitations will be set to concentrate the study. They
are shown below.
- The study is restricted to the area of Sweden.
- The study focuses on the thermal treatment of MSW incineration, with the two energy
conversion systems: grate-firing and fluidized bed.
- Energy recovery will be made per ton combusted waste and thereafter implemented in
the calculations.
- Weighted average data on incinerators across Sweden will be the base for the technical
and economical calculations.
- The calculations will also be based on performance of the CHP-plant in Västerås, which
extracts 50 MW electricity and 100 MW heat.
-5-
2 Method
2.1 Models To initiate the project, three different models of the different thermal treatment processes have
been developed. These clarify the differences that are present to the treatments in regards of
different stages in each process.
Figure 2.1 Schematic description of the process of grate-firing
One of the main technologies that will be focused on in this project is described schematically in
figure 2.1. The input material is MSW which is put in a grate-fired boiler as burning fuel. Steam
conditions in regards of pressure and temperature will be provided depending on the input
materials. For the output material, energy will be delivered as electricity and heat.
Figure 2.2 Schematic description of the process of fluidized bed systems
The second main technology, fluidized bed, is revealed in figure 2.2. One of the main points in
this system is the pre-processed material, which is put in a fluidized bed. From the both stages of
pre-processing and the fluidized bed, better steam conditions will be delivered in return of higher
costs for implementation and operation.
-6-
Figure 2.3 Schematic description of the gasification process
In figure 2.3, gasification which will not be focused on in this project, is schematically described.
Cost and steam conditions will be higher than for fluidized bed because of increased amounts of
stages at the pre-processing stages of the input materials.
2.2 The process of the study In this bachelor thesis, an interview and an extended literature study will set the base for the work
and results of the work. Different tools that will be frequently used to reach the goals are e.g.
different databases at the library of KTH to gain extensive knowledge for this particular subject
and Microsoft Excel, which have been used to construct graphs and calculations.
I. After an informative interview with Mälarenergi in Västerås, the efficiency of their plant was set as a benchmark for the calculations. The capacity of the plant is 150 MW, whereas 50 MW consists of extracted electricity, and 100 MW extracted heat.
II. The amounts of waste that will be calculated upon to reach financial conclusions are
based on the efficiency of the CHP in Västerås and amount to 550255 ton/year for the
fluidized bed and 623622 ton/year for the grate-fire.
Three types of calculations have been made.
I. Financial - to conclude which plant is the most profitable.
II. Technical - to conclude which plant the most efficient one is in regards of energy extraction.
III. Environmental – to conclude which plant release most flue gases after combustion.
-7-
Figure 2.4 Illustrative image of the process of the work
Figure 2.4 above illustrates the model of this thesis that has been created in order to reach the
best possible results. These results will be evaluated through a sensitivity analysis and thereafter,
proper conclusions will be made. The model in the figure illustrates the structure of the work. In
an extensive paper as this, such a model contributes greatly to an understanding of the different
steps throughout the project.
-8-
3 Literature study
3.1 Treatment methods Material recycling is considered the friendliest method of MSW treatment and management in
regards of the environment. The input materials for recycling of MSW are restricted to metals,
plastics, glasses, and parts of paper products. Recycling will be easier if the place where the waste
is sorted is located nearer to the source of the waste (Martin 2014).
The biological treatment uses anaerobic digestion as process to extract biogas as the output
where biological materials such as food waste are the input. This method is strictly dependent on
the input material. Therefor it is crucial that the waste is separated before the treatment, materials
such as plastics will reduce the efficiency of the process (UNEP-DTIE Energy Branch et al.
2007).
Incineration, which is done by controlled burning at high temperatures is defined as “thermal
treatment”. With incineration, the volume of MSW is reduced. Incineration of MSW materials
converts the waste to energy and the main products of incineration are received as CO2 (carbon
dioxide), H2O (water) and ash (Martin 2014).
Traditionally, landfilling has been the most common method for handling waste and it still
remains that way in many developing countries. Landfills are also used for temporary storage,
consolidation and transfer or processing of waste materials. In European countries, only
materials which cannot be converted in other forms will be landfilled according to the Council
Directive on the Landfill of Waste (1999) (Leckner 2014).
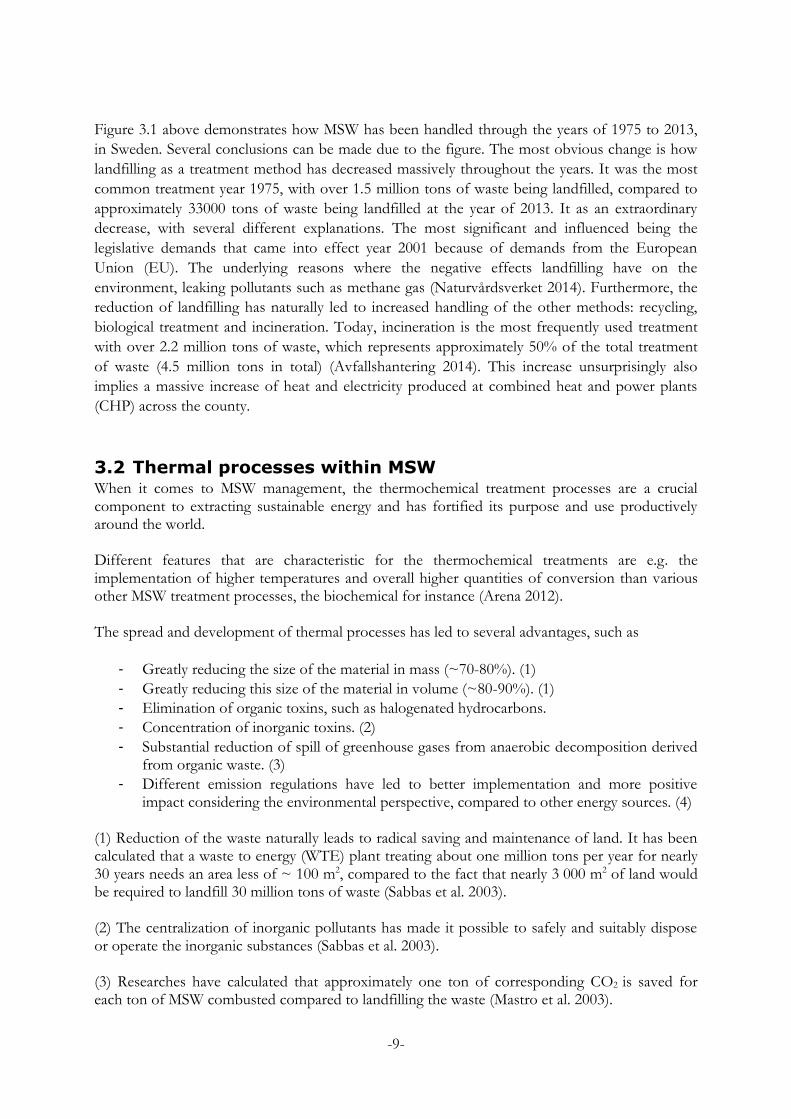
Figure 3.1 Treatment methods for Municipal Solid Waste in Sweden between 1975-2013
(Avfallshantering 2014)
0
0,5
1
1,5
2
2,5
1975 1985 1994 1997 2000 2005 2009 2011 2013
Mil
lio
n T
on
s W
ast
e
Year
Treatment methods for Municipal Solid Waste in Sweden 1975-2013
Figure 3.1 above demonstrates how MSW has been handled through the years of 1975 to 2013,
in Sweden. Several conclusions can be made due to the figure. The most obvious change is how
landfilling as a treatment method has decreased massively throughout the years. It was the most
common treatment year 1975, with over 1.5 million tons of waste being landfilled, compared to
approximately 33000 tons of waste being landfilled at the year of 2013. It as an extraordinary
decrease, with several different explanations. The most significant and influenced being the
legislative demands that came into effect year 2001 because of demands from the European
Union (EU). The underlying reasons where the negative effects landfilling have on the
environment, leaking pollutants such as methane gas (Naturvårdsverket 2014). Furthermore, the
reduction of landfilling has naturally led to increased handling of the other methods: recycling,
biological treatment and incineration. Today, incineration is the most frequently used treatment
with over 2.2 million tons of waste, which represents approximately 50% of the total treatment
of waste (4.5 million tons in total) (Avfallshantering 2014). This increase unsurprisingly also
implies a massive increase of heat and electricity produced at combined heat and power plants
(CHP) across the county.
3.2 Thermal processes within MSW When it comes to MSW management, the thermochemical treatment processes are a crucial component to extracting sustainable energy and has fortified its purpose and use productively around the world. Different features that are characteristic for the thermochemical treatments are e.g. the implementation of higher temperatures and overall higher quantities of conversion than various other MSW treatment processes, the biochemical for instance (Arena 2012). The spread and development of thermal processes has led to several advantages, such as
- Greatly reducing the size of the material in mass (~70-80%). (1)
- Greatly reducing this size of the material in volume (~80-90%). (1)
- Elimination of organic toxins, such as halogenated hydrocarbons.
- Concentration of inorganic toxins. (2)
- Substantial reduction of spill of greenhouse gases from anaerobic decomposition derived from organic waste. (3)
- Different emission regulations have led to better implementation and more positive impact considering the environmental perspective, compared to other energy sources. (4)
(1) Reduction of the waste naturally leads to radical saving and maintenance of land. It has been calculated that a waste to energy (WTE) plant treating about one million tons per year for nearly 30 years needs an area less of ~ 100 m2, compared to the fact that nearly 3 000 m2 of land would be required to landfill 30 million tons of waste (Sabbas et al. 2003). (2) The centralization of inorganic pollutants has made it possible to safely and suitably dispose or operate the inorganic substances (Sabbas et al. 2003). (3) Researches have calculated that approximately one ton of corresponding CO2 is saved for each ton of MSW combusted compared to landfilling the waste (Mastro et al. 2003).
-10-
(4) Different studies demonstrate WTE as a source of electricity with substantially less environmental impact than other sources (Arena 2012). Furthermore, besides these areas of use and advantages, the thermal process plants have the ability to convert the energy value extracted from MSW to other useful forms of energy. For example, electricity consumed at industrial residents and turbines (Arena 2012).
3.3 Refuse Derived Fuel Fuel that is a crushed and sorted MSW where a large part of the inert materials have been separated out is called Refuse Derived Fuel (RDF). The fuel being sorted implies a somewhat simple system with respect to fuel handling, in comparison to non-reprocessed household waste. Instead of burning waste directly, a refinement of the waste could be done to raise its calorific value. This is done when fractions of waste with higher calorific value are separated, dried out and crushed to become RDF. Although the flue gases can be affected depending on the extent to which the sorting is done (Nohlgren et al. 2014).
Figure 3.2 The RDF-process (Murdoch 2015)
Figure 3.2 illustrates the entire RDF-process, from received MSW to fuel storage. As shown in
the figure, all MSW is not processed into RDF since some materials are non-combustible and it is
therefore environmental-friendly to recycle some materials such as iron, metals and plastics.
The main benefits of converting MSW to RDF are a homogeneous fuel with higher calorific
value, lower pollutant emissions, reduced excess air requirement during combustion, and also
easier transportation and storing than the original waste (Valkenburg et al. 2008).
Data on the RDF that can be refined from MSW varies depending on the waste composition and
processing methods. On average however, 75%-85% of the weight of MSW is converted into
RDF according to a report from U.S. Department of Energy (Valkenburg et al. 2008). The cost
of the process of converting waste into RDF also fluctuates.
In many cases, the sorting and burning could be done at the same location, e.g. at the combined
heat and power (CHP) plant in Västerås, but the waste may also be classified elsewhere and
transported to the combustion plant as fuel. There are three separate lines for the fuel
preparation. The waste is crushed to magnitudes described as “credit card size”, magnetic and
-11-
non-magnetic waste are separated from each other and lastly the CHP plant also uses an air
classifier which blows the fuel to separate heavy stones and metal pieces from it. After these
processes the fuel can be transported to the conveyor and into the fluidized bed (Starfelt 2015).
The smaller size of the waste, which is characteristic to RDF, improves the reaction kinetics. At
the same time, the amount of combustion air required for combustion of the waste will be
reduced. The reduced amount of air supplied to the combustion also leads to a reduction of flue
gas created which in turn results in lower costs for the flue gas cleaning system. The purpose of
the gas cleaning is to purify these gases. Ultimately, smaller and more homogenous particles
combusted also reduces the total time of combustion (Fitzgerald et al. 2009).
3.4 Flue gases and air pollution control Incineration of MSW and RDF generates large volumes of flue gases. The flue gases carry
remains from incomplete incineration and a wide range of damaging pollutants. The composition
of the fuel and the combustion conditions determines the pollutants and their concentration.
These gases consist of boiled ash, fly ash, heavy metals, and a variety of organic and inorganic
compounds. Some of these gases such as sulphur dioxide (SO2), carbon dioxide (CO2), heavy
metals and particles such as dust are included in the pollutants. Some damaging compounds such
as mercury (Hg), dioxins, and nitrogen oxides (NOx), can only be removed through advanced
and costly chemical treatment technologies to reduce the risk of their spread. They are usually
humidified (The World Bank et al. 1999).
The fuel burns out better in a fluidized bed boiler (FB), which leads to smaller ash formation in
FB boilers than the ash created in grate boilers. At the CHP plant in Västerås, the emitted gases
are treated through a flue gas cleaning system which includes a scrubber and a filter, placed after
the boiler. Here, activated ammonia (NH3) and carbon (C) are injected to clean the NOx and
lime. The plant has fierce demands for handling these gases and pollutants (Starfelt 2015).
In the CHP-plant boiler in Västerås, no dioxins are formed if the system works without any
unexpected stops, otherwise these gases are formed in the boiler. Dioxins are a collective name
for a group of chlorinated organic substances formed during combustion of chlorine-containing
fuels. It is important during the combustion process to supply good amounts of oxygen to reduce
its formation. The temperature of combustion should be at least 850°C during at least two
second residence time (Starfelt 2015). This will prevent the formation of smaller dioxins (Lind et
al. 2007).
Factors affecting emissions created from combustion are e.g. the type of fuel, combustion
technology and purification steps. Environmentally harmful emissions caused as a result of
combustion are CO2 and NOx, which will be specifically considered in this report. The data of
emissions is used from the report of Elforsk 2011.
CO2 – Carbon dioxide emissions are caused by any combustion of carbonaceous fuels.
Currently, no existing technologies have been developed to completely capture the
carbon dioxide formed during the combustion (Nohlgren et al. 2014). According to the
report from Elforsk 2011, CO2 emissions are lower with RDF in fluidized bed (FB)
-12-
boilers, with an amount of 110g/kWh, than MSW in grate-fired (GF) boilers with an
amount of 120g/kWh (Nyström et al. 2011).
NOx – The flue gas forms from the air and nitrogen fuels. Nitrogen oxides have
significant effects on the environmental due to their impacts on acid rain, ozone layer,
greenhouse gas effect, and photochemical smog. Emissions of NOx during RDF
incineration in FB boilers are about 70mg/MJ and with MSW incineration in a grate-fired
boiler about 80mg/MJ (Nyström et al. 2011).
3.5 Grate-firing systems The utilization of grate furnaces as a thermal treatment of incinerating municipal solid waste has
been used and established technology for over a century. Because of the growing awareness of
environmental aspects regarding waste treatments, the last decades researches on this topic has
focused on reducing emissions and pollutants due to legislative regulations (Freya et al. 2003).
Nevertheless, MSW incinerators are still considered as great pollutant sources, especially due to
their gaseous emissions from the stack (Morselli et al. 2005). The modern utilization of
incineration processes emphasizes its aims at energy recovery in pursuance of exploiting energy in
form of electricity and heat from materials with advantageous heat power (Hunsinger et al. 2002).
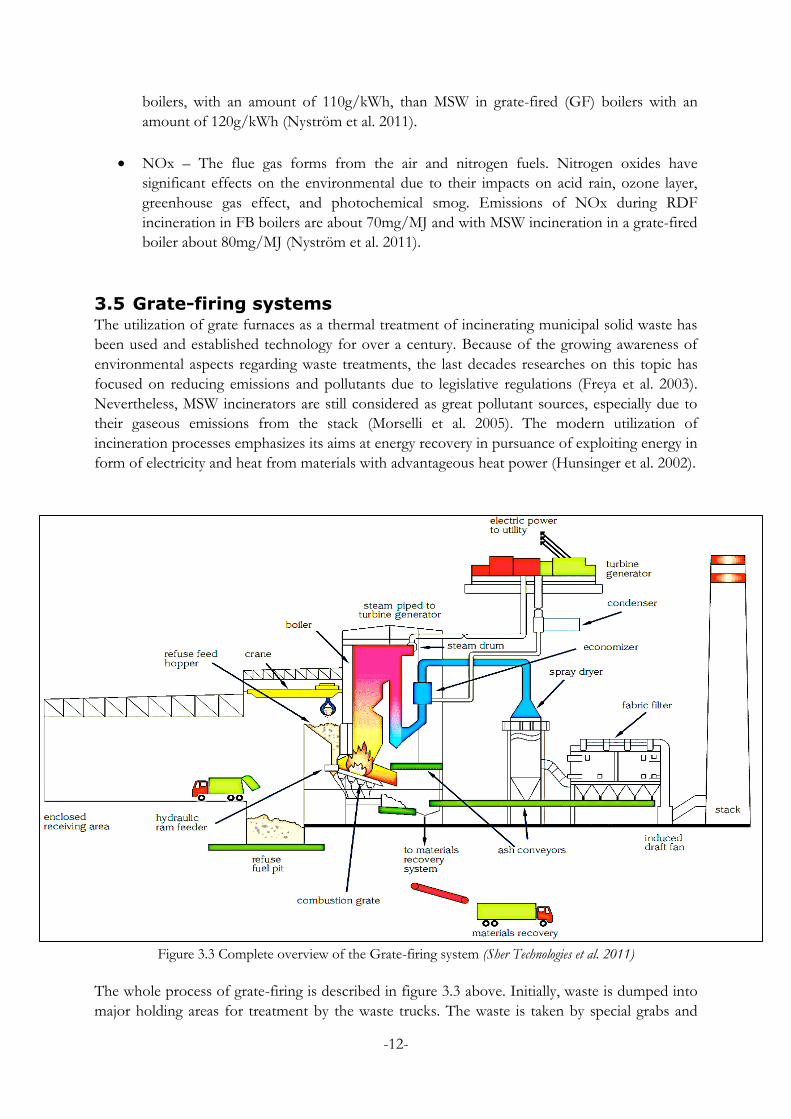
Figure 3.3 Complete overview of the Grate-firing system (Sher Technologies et al. 2011)
The whole process of grate-firing is described in figure 3.3 above. Initially, waste is dumped into
major holding areas for treatment by the waste trucks. The waste is taken by special grabs and
-13-
dropped into a bunker waiting to be processed. Piece by piece, the waste is slowly and
controllably pushed into a burning chamber, the combustion grate. The temperature of which the
waste is burnt varies but is between 850°C and 1000°C (Ionescu et al. 2013). The heat that is
produced from the burning waste is utilized to heat a boiler, which in turn, produces great and
valuable amounts of steam. This steam is then used to propel turbines which in turn generate
electricity.
Furthermore, ash with scattered pieces of remains is collected in a different basement chambers
where it is somewhat separated in order for recycling to take place. For instance, metals from the
debris is collected by using magnets and is then later recycled (Vandecasteele et al. 2007).
The treatment as mentioned produces quantities of pollutants and emissions which need to be
treated correctly to minimize its environmental damage. Therefore, gases containing acid
pollutants such as SO2 and dioxins are treated in a so called scrubber reactor.
To summarize, incinerators use large amounts of air to burn municipal solid waste. They produce
pollutants that can only be cleaned up after combustion and they leave behind ash that must be
carefully disposed of. The grates combusts the waste and the heat generated by incinerators is
used to make steam and generate electricity (Vandecasteele et al. 2007).
Figure 3.4 The grate-firing combustor of moving grates (Leckner 2014)
To more thoroughly explain the combustion process, figure 3.4 above is demonstrated. The grate
fuel bed (fixed or moving), which is one of the most common used conversion devises, is shown
in figure 3.4. After the waste is inserted to the refuse feed hopper and grabbed by the cranes
(figure 3.3), it is then pressed onto the grate by a feed mechanism. The fuel is later transported
through the tilting grate at an approximate speed of 0.0016 m/s (Leckner 2014) and moved
-14-
forward by flexible bars that also form the grate. Whilst in the grate chamber, the top layer of the
fuel surface is exposed to radiation from the refractory structures and the fire. Volatile gases
located higher than the layer of fuel in turn create these. Consequently, as the temperature of the
heated fuel grows, the fuel devolatilizes as it continues on the grate (Leckner 2014).
As the ignition temperature finally is reached, the actual combustion takes place and is endorsed
by the primary air from below. The combustion moves downwards towards the bed and against
the airflow simultaneously as the bed moves forward. The produced ash is led to the ash quench
and later transported to be utilized or landfills (figure 3.3) Metals and other unwanted objects are
separated and removed (Freya et al. 2003).
Occasionally, the primary air will not be sufficient enough for the volatiles. Therefore,
recirculated flue gases are implemented to provide mixing for the combustion. The rising gases
from the bed is mixed with the secondary air (figure 3.4). Finally, the gases move through the
boiler and later to the economizer.
3.6 Fluidized bed systems Fluidized bed combustion systems have been one of the most efficient methods for handling and
burning MSW in a fluidized bed combustor (FBC). The fluidized bed combustion system offers a
high potential for the thermal processes of different types of industrial waste, sewage sludge and
more recently even MSW (Martin 2014). FBC systems can be used in many different areas. It is
possible due to the fact that the operating principle of the vessels is relatively simple and applying
them to different facilities is quite easy. Besides the conventional methods of burning MSW,
other low-grade fuels that are difficult or impractical to burn can be processed in fluidized bed
boilers, but the input materials require preprocessing in order to be made more homogeneous for
the generated mass to be generated more efficiently.
From the explanations above, RDF, which is crushed and sorted waste, becomes more suitable to
fluidized bed technology. There are smaller plants using bubbling fluidized bed technology and
likewise, larger boilers that are utilized with circulating fluidized bed technology. One advantage
with the circulating fluidized bed technology is that the last superheater can be placed in the sand
trap. With this placement of the superheater, less corrosive impurities in the fuel are developed
(Nohlgren et al. 2014).
The basis of fluidized bed combustion systems is a bed of hot inert particles, such as sand or
limestone through which air is blown from below in these applications, where fuel is burned.
Fuel represents only a few percent of the bed materials. The combustion air is injected upwards
from the bottom of the combustor in enough amount and volume and at a high enough pressure
to keep the bed in a “fluidized” state and to trail the small particles of the bed material so that
they behave much like a fluid (UNEP-DTIE Energy Branch et al. 2007).
-15-
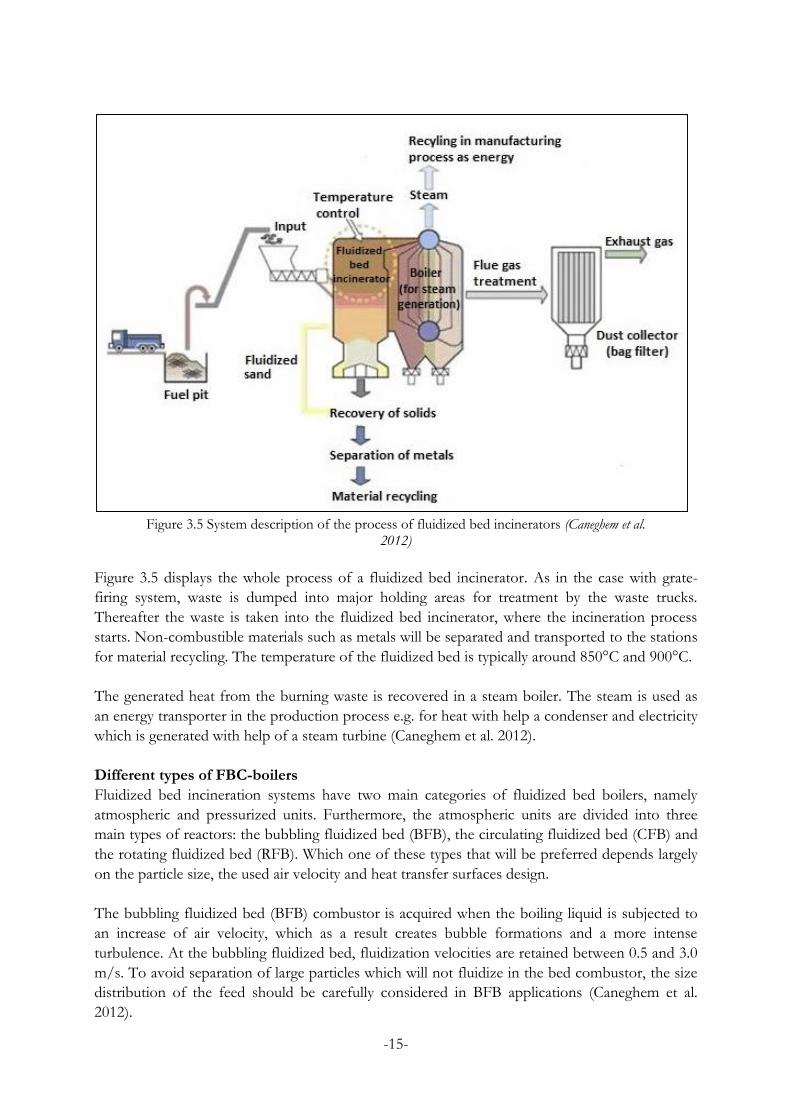
Figure 3.5 System description of the process of fluidized bed incinerators (Caneghem et al.
2012)
Figure 3.5 displays the whole process of a fluidized bed incinerator. As in the case with grate-
firing system, waste is dumped into major holding areas for treatment by the waste trucks.
Thereafter the waste is taken into the fluidized bed incinerator, where the incineration process
starts. Non-combustible materials such as metals will be separated and transported to the stations
for material recycling. The temperature of the fluidized bed is typically around 850°C and 900°C.
The generated heat from the burning waste is recovered in a steam boiler. The steam is used as
an energy transporter in the production process e.g. for heat with help a condenser and electricity
which is generated with help of a steam turbine (Caneghem et al. 2012).
Different types of FBC-boilers
Fluidized bed incineration systems have two main categories of fluidized bed boilers, namely
atmospheric and pressurized units. Furthermore, the atmospheric units are divided into three
main types of reactors: the bubbling fluidized bed (BFB), the circulating fluidized bed (CFB) and
the rotating fluidized bed (RFB). Which one of these types that will be preferred depends largely
on the particle size, the used air velocity and heat transfer surfaces design.
The bubbling fluidized bed (BFB) combustor is acquired when the boiling liquid is subjected to
an increase of air velocity, which as a result creates bubble formations and a more intense
turbulence. At the bubbling fluidized bed, fluidization velocities are retained between 0.5 and 3.0
m/s. To avoid separation of large particles which will not fluidize in the bed combustor, the size
distribution of the feed should be carefully considered in BFB applications (Caneghem et al.
2012).
-16-
In RFB combustors, rough distribution of the primary air over the distributor can be applied.
These kind of systems extend the use of BFB combustors with a wide range of input materials,
from sludge to RDF and comparable industrial waste. Additionally, to reach the required
incineration temperatures, which is between 850°C and 900°C, the pre-heating fluidization air
and/or pre-drying of sludge and other types of wet fuels are required. By elimination of CO2 and
solid residuals which are formed around the fuel particles, the quality of the combustion process
will be increased. With this process, oxygen will reach the combustible materials in the hot bed
more readily, and the efficiency of the combustion process will increase (Chigier 2008).
With even higher air velocities, the bubbling forms dissolve and the particles are due to the
increased velocity thrown out of the bed. In order to maintain the liquid without any waste,
another approach is required. That is to re-circulate the solid particles to preserve a stable system
- the circulating fluidized bed (CFB). In a CFB boiler the sand circulates similarly to a hot cyclone
through the entire combustion chamber, resulting in lower particle density where the sand is
separated and cooled after combustion before it is returned to the bed. Higher gas velocities
between 3.0-9.0m/s are considered in CFB (Caneghem et al. 2012).
Regarding the pressurized fluidized bed boiler, the bed vessel is operated at high-pressure
between 5-20bar. A mixing of crashed coal, limestone and water is fed into the fluidized bed and
the temperature of the fluidized bed is kept around 850°C (Basu et al. 1998).
3.7 The steam conditions Incinerators in general usually have low steam conditions with low steam- pressure and
temperatures. The low pressure in the vapor disables the risk of corrosion in the bed while the
relatively low vapor temperature is selected to avoid high temperature corrosion on re-heaters.
One reason that waste is a fuel which increases the risk for corrosion is typically high contents of
chloride (Cl), together with the waste content of alkali metals, sodium (Na), potassium (K), lead
(Pb) copper (Cu) and zinc (Zn) (Nohlgren et al. 2014).
Another reason for increased corrosion risk is that it is difficult to avoid string formation which
are the areas where the flue gas does not completely burn out.
A mixture of input materials and non-pre handled materials are generally difficult to handle with
higher steam conditions. To avoid the risk of corrosion and erosion on the tubes lower pressure
and temperature are required. Otherwise the boilers will be destroyed.
Steam data in regards of pressure and temperature for grate-firing systems are usually 40-50bar
and 400-450°C (Nohlgren et al. 2014). Steam conditions in the CFB combustion boiler which is
used in the CHP plant in Västerås are better than the grate-firing with 75bar and 470°C (Starfelt
2015).
-17-
4 Methodology
4.1 Waste composition and the calorific value The amount of energy that can be extracted from waste is determined by the waste mix, its
moisture and combustible portions. The combustion efficiency depends on different waste types
and their contents. In order to reach higher combustion efficiency and steady combustion
characteristics, different waste types have different ratio depending on their chemical
composition, physical properties (e.g. state of aggregation) and thermal characteristics (e.g.
heating value and moisture contents). If the added fuel in the grate-fired bed or fluidized bed is
less moisture and contains combustible contents, the energy output in regards of electricity and
heat will be much higher. When the composition of fuel includes for instance water, volatile
substances and ash, the energy output will be lower in comparison to the less moisture fuel.
According to the CHP-plant in Västerås, the fuel should not contain more moisture than 40%.
The fuel that is used in their applications normally contains 20-25% moisture. There are no
specific demands regarding the water contents, but it is not recommended for the fuel to contain
too much water. On the other hand, the ash rate is quite high (Starfelt 2015).
Calorific value of waste indicates the rate of potential energy available in the fuel. There is a high
and a low heating value, also called effective heating value. The difference is that the higher
heating value (HHV) indicates how much heat that could be released from fuel during
combustion when water vapor condenses, whereas the lower heating value (LHV) indicates how
much energy that could be released without water vapor condenses. As shown in equation 1
below, LHV can be obtained by multiplying HHV with the proportion of combustible waste
types (C) [%] and then subtracting the product of the heat of vaporization at 25°C (for water)
and the moisture content (W) [wt. %], in the fuel (The World Bank et al. 1999). The heat of
vaporization for water has the value 2.442 𝑀𝐽/𝑘𝑔 at 25°C (Alam et al. 2001).
[ ] (1)
In conventional incineration, such as in grate-fired incinerators where the waste is not sorted and
dried before, the humidity and the combustible proportions are included in the calculation of
calorific value of waste. The higher the moisture content of the waste, the lower the calorific
value. Therefore, combustion will not be as effective as with the lower moisture content of the
waste. Waste has a varying calorific value depending on its diverse content of various types of
waste. Table 4.1 shows different waste’s high calorific value, the proportion of waste types and
the moisture contents.
The LHV will be calculated according to equation 1. As is revealed in table 4.1, the plastic and
plastic package has the highest calorific value. In contrast, iron, metal package, glass and inert
materials have the lowest heating value with negative values. This is because these materials are
non-combustible and therefore they need to be sorted out before combustion to provide a higher
calorific value of the waste. That is the reason these materials do not exist in this table (The
World Bank et al. 1999).
WCHHVLHV 442.2 kgMJ /
-18-
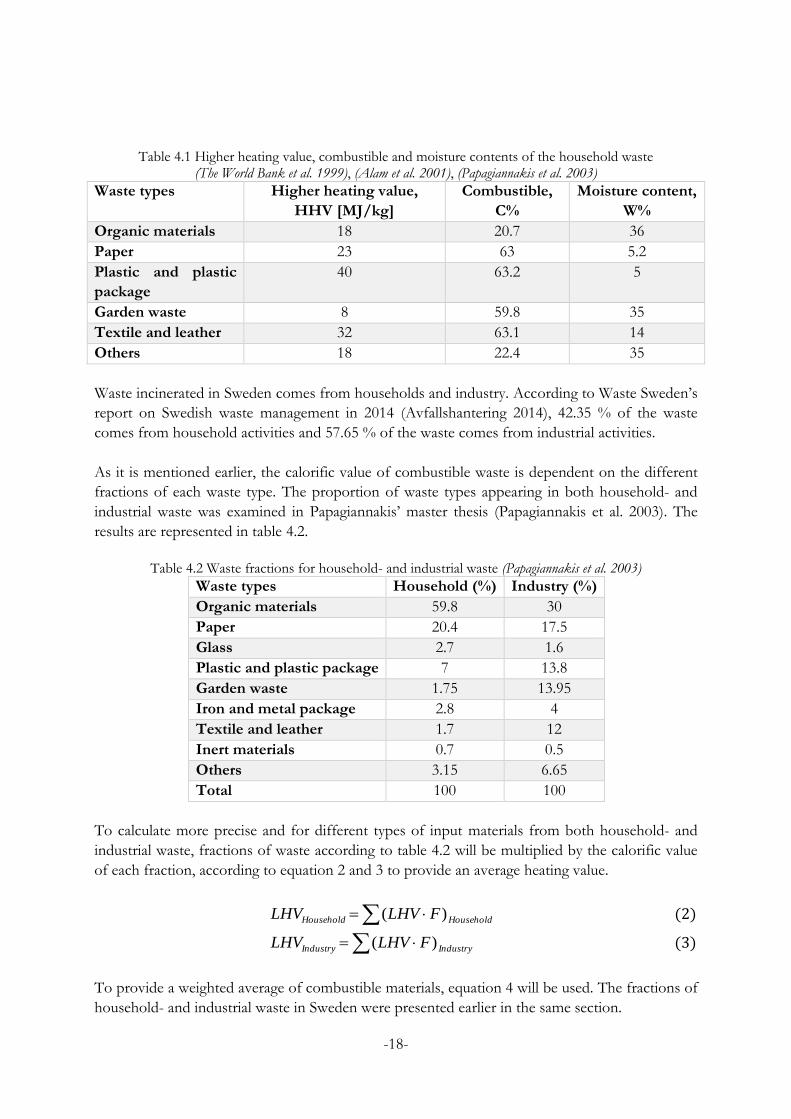
Table 4.1 Higher heating value, combustible and moisture contents of the household waste
(The World Bank et al. 1999), (Alam et al. 2001), (Papagiannakis et al. 2003)
Waste types Higher heating value,
HHV [MJ/kg]
Combustible,
C%
Moisture content,
W%
Organic materials 18 20.7 36
Paper 23 63 5.2
Plastic and plastic
package
40 63.2 5
Garden waste 8 59.8 35
Textile and leather 32 63.1 14
Others 18 22.4 35
Waste incinerated in Sweden comes from households and industry. According to Waste Sweden’s
report on Swedish waste management in 2014 (Avfallshantering 2014), 42.35 % of the waste
comes from household activities and 57.65 % of the waste comes from industrial activities.
As it is mentioned earlier, the calorific value of combustible waste is dependent on the different
fractions of each waste type. The proportion of waste types appearing in both household- and
industrial waste was examined in Papagiannakis’ master thesis (Papagiannakis et al. 2003). The
results are represented in table 4.2.
Table 4.2 Waste fractions for household- and industrial waste (Papagiannakis et al. 2003)
Waste types Household (%) Industry (%)
Organic materials 59.8 30
Paper 20.4 17.5
Glass 2.7 1.6
Plastic and plastic package 7 13.8
Garden waste 1.75 13.95
Iron and metal package 2.8 4
Textile and leather 1.7 12
Inert materials 0.7 0.5
Others 3.15 6.65
Total 100 100
To calculate more precise and for different types of input materials from both household- and
industrial waste, fractions of waste according to table 4.2 will be multiplied by the calorific value
of each fraction, according to equation 2 and 3 to provide an average heating value.
HouseholdHousehold FLHVLHV )( (2)
IndustryIndustry FLHVLHV )( (3)
To provide a weighted average of combustible materials, equation 4 will be used. The fractions of
household- and industrial waste in Sweden were presented earlier in the same section.
For calculations regarding fluidized bed, a lower heating value, LHV is expected of 16.6 MJ/kg
for RDF according to the study of Elforsk in 2014 (Nohlgren et al. 2014).
4.2 Energy calculations To provide the energy from combustible waste in MWh per ton from the grate-firing boiler,
equation 5 is used with the effective heating value, EffectiveLHV of MSW and the lower heating
value which is collected from Elforsk 2014, RDFLHV of RDF. The conversion factor between
MWh and MJ is 3600 (Alam et al. 2001).
3600
)(ton
MJLHV
EMSW
firingGrate [ ] (5)
The extraction of energy from a FBC will be computed according to equation 6.
3600
)(ton
MJLHV
ERDF
bedFluidized [ (6)
To calculate the percentage of heat and electricity generated from the burning processes, these
initial equations of section 4.2 (5, 6, 7, 8) will be used, as well as table 4.3 which shows the shares
of electricity and heat from the CHP-plant in Västerås (Alam et al. 2001).
firingGrateh EtageHeatprocenMWh (7)
firingGratee EeyprocentagElectricitMWh (8)
Table 4.3 The percentage of heat and electricity generated at the CHP plant in Västerås
(Starfelt 2015)
Amount (MW) Percentage (%)
Electricity 50 33.3
Heat 100 66.7
Total 150 100
The Rankine cycle
To predict the performance of steam turbines, a cycle called the Rankine cycle is used. The
Rankine cycle is a heat engine with a vapor power cycle. The steam is used as the working fluid in
the simple Rankine cycle and this saturated steam continues into the turbine. There, its internal
energy is converted into mechanical work to run an electric generator. The turbine provides a
ton
MWh
]ton
MWh
-20-
controlled pressure drop between state 1 and 2. The temperature also drops after the turbine
caused by the turbine work out of the system.
Figure 4.1 The simple Rankine cycle for grate-fired boilers (VAPOUR & COMBINED
POWER CYCLE 2015)
In figure 4.1, a simple Rankine cycle for grate-fired boilers is shown which usually is used to
avoid problems with wet steam. Steam data in regards of pressure and temperature for grate-
firing at state (1) is usually 40-50bar and 400-450°C (Nohlgren et al. 2014). In the calculations, the
lowest pressure and temperature, 40 bar and 400°C will be used to show how the lowest pressure
and temperature affect the total power output. Furthermore, the calculations will be shown with
the highest steam conditions in the sensitivity analysis, section 6. The boiler used for burning the
MSW and the condenser does not generate any work. Isentropic state for both components can
therefore be assumed. The steam conditions at state (2) for CHP-plants are estimated to 100°C and 1bar. To determine the potential power output from the turbine, the data of mass flow from
the interview with the CHP-plant in Västerås will be used.
-21-
Figure 4.2 The simple Rankine cycle for fluidized bed boilers (VAPOUR & COMBINED
POWER CYCLE 2015)
Figure 4.2 shows a simple Rankine cycle for fluidized bed boilers which works with RDF as its
fuel. The superheated vapor at state (1) enters the turbine under the same isentropic conditions as
the Rankine cycle for grate-fired boiler, but temperature and pressure will vary. At state (1), the
temperature is 470°C and the pressure is 75bar (Starfelt 2015). Work is produced inside the
turbine by rotation of the shaft which is connected to an electric generator. The steam conditions
after the turbine are assumed being the same as in the Rankine cycle for grate-fired boilers with a
temperature of 100°C and a pressure of 1bar at state (2). To determine the total power output
from this system, equations (9) and (10) will be used.
21, hhw outturb [ (9)
SteammhhoutputTotalpower
)( 21 [ (10)
In equation 9, the turbine work is described as the difference in enthalpy before and after the
turbine. Enthalpy is described as the amount of heat content used or released in a system at
constant pressure. With a mass flow of 60 ton/hour (16.66 kg/s) from the CHP-plant and
enthalpy data from Havtun's collection of formulas (page 57), equation 10 provides the total
power output from the system (Havtun 1997).
4.3 Environmental calculations As mentioned before, values for calculating the emissions of CO2 and NOx will be used from
Elforsk’s 2011 report. These values with the total amounts of extracted energy from grate-firing
and fluidized bed incinerators inserted in equations 11 and 12 will provide numbers on the
emissions in kg NOx/ton and CO2/ton from each incinerator (Engström et al. 2009).
]kg
kJ
]s
kJ
-22-
NOx =mgNOx
106 MJ×MJ
ton [ (11)
CO2 =gCO2
103kWh×kWh
ton [ (12)
4.4 Efficiency calculations The CHP-plant in Västerås based on a CFB boiler for combustion of RDF has a total effect 150
MW. The plant also has a flue gas condenser which is used to avail these flue gases before they
leave the system. This leads to an extra amount of provided heat which approximately measures
to 25-30 MW (Starfelt 2015). A small part of the produced electricity is used for internal
purposes. In Table 4.4, the effects and efficiencies with and without the flue gas condenser is
presented.
Table 4.4 Effects and efficiencies with/without the flue gas condenser (Starfelt 2015)
Without flue gas condensation With flue gas condensation
Electricity effect (MWe) 50 50
Heat effect (MWh) 100 130
Electricity efficiency (%) 33 33
Total efficiency (%) 89.8 107.7
The total combined electricity and heat efficiency will be calculated according equation 13. The
data for these calculations are based on the interview with the CHP-plant in Västerås.
(13)
The total power input is 167 MW and as it is shown in table 4.4, the total efficiency is varying
depending on the output of the flue gas condenser. The total power output is therefore 180 MW
including the output heat from the flue gases. For the CHP-plant in Västerås, the data provides
an efficiency of 107.7% (Starfelt 2015). The calculation leading to this result is based on the LHV
instead of the HHV. The calorific value can be calculated in different ways depending on the
afterburning of water vapor (there is water and hydrogen in the fuel, this forms water vapor when
burnt), if the fuel is in the vapor phase or whether it is in the liquid phase after (burning).
For the Rankine cycle, the isentropic turbine efficiency can be calculated according to equation
14.
(14)
In this formula, is the enthalpy before the turbine, is the enthalpy after the turbine and
is the enthalpy after the turbine with isentropic conditions.
]kg
]kg
Usefulpoweroutput
Totalpowerinput
1h 2hish ,2
-23-
4.5 Financial calculations As a part of this bachelor thesis, financial calculations for both of the incineration systems are
made to evaluate their profitability. To be able to make a conclusion about the analysis, two
different calculations will be made, namely the payback-period and net present value calculations.
Payback period
The payback period (PP) calculation is made to determine and evaluate the amount of time it will
take an organization/company/manufacturer to recoup the initial invested amount of money in a
project, in our case, two different incineration systems.
[ (15)
In formula 15, (PP) is the payback period, (C0) is the initial outlay, (Inc) is the sum of the yearly
incomes and (Exp) the sum of the yearly expenses. Based on this calculation, the incineration
method with the least payback period will be considered the better one to invest in (Finance
Formulas et al. 2015).
Net present value
The Net Present Value (NPV) calculation is a formula that determines an investment’s present
value by the discounted sum of all cash flows received in the used time period of the project.
[𝐾𝑟] (16)
Equation 16 is dependent on a given rate of discount (r) and the amount of years (i) considered.
As with the payback period calculation, (Inc) and (Exp) are the annual in- and out cash flows.
The initial investment is given by (C0). If the value of the NPV is positive, the investment will be
considered profitable and the incineration system with the highest calculated NPV will naturally
be considered the more preferable method (Finance Formulas et al. 2015). The rate of discount
(r) will be set to 6%. This number is widely used for in technical contexts. For example, the
reports from Elforsk used for this thesis uses the same rate of discount. The amount of years (i)
will be set to 25 years since it is a recognized lifecycle-value in these purposes.
Cash flows
In order to make reasonable calculations, different required “in-data” will be collected from the
latest annual report made by Elforsk (Nohlgren et al. 2014). Observe, in this report, the costs for
the total electricity production for a CHP-plant like the one in Västerås, is calculated by
subtracting the cost of its heat production from its total CHP production cost.
The performance of the incinerator at Mälarenergi in Västerås will used as benchmark, with the
performance of 50 MW extracted electricity and 100 MW extracted heat. The CHP plant in
Västerås only has a circulating fluidized bed plant, not a grate-firing plant (Starfelt 2015). To
make the calculations comparable, an assumption of both plants being available with the same
amounts extracted heat and electricity will be made.
ExpInc
CPP
0
o
T
ii
ii Cr
ExpIncNPV
1 )1(
-24-
Figure 4.3 Display of the cash flows being considered and calculated upon to reach the
results of the NPV and PP formulas.
The amounts that will be considered are shown in figure 4.3. These values will be put into
equations 15 and 16 to perform the payback period and NPV and conclusions will be made
thereafter.
Amounts of waste per year
No data on the exact efficiency of the grate-fire plant is available. In the financial calculations, the
amount of waste incinerated per year is required to fulfill the equations. Therefore, with
background from the literate study, two different efficiencies will be used to determine the
amount of waste required for the grate-fire incineration. This is possible since all the calculations
regarding the grate-fire plant are based on the performance of the fluidized bed plant at
Mälarenergi (50 MW electricity, 100 MW heat) (Starfelt 2015). The two efficiencies will be 85%
and 75% and the amount of energy extracted per ton is 𝐸𝐺𝑟𝑎𝑡𝑒−𝑓𝑖𝑟𝑖𝑛𝑔. The equations used to do
this are presented below, equation 17 and 18.
(17)
(18)
In equations 17 and 18, (x) represents the amount of waste required (ton/h) to extract 150 MW
energy. For the fluidized bed incinerator in Västerås, the same variable amounts to 60ton/h.
Furthermore, according to the interview, the plant in Västerås is paused approximately three
weeks per year due to inspections and revisions. The plant stays still some additional days due to
150(MW)
EGrate- firing(MWh
ton) × x(
ton
h)
= 0.85
150(MW)
EGrate- firing(MWh
ton) × x(
ton
h)
= 0.75
-25-
unexpected events, because of this, the total amount of days the plant maintains still will be
assumed to a total of 30 days (Starfelt 2015).
-26-
5 Results
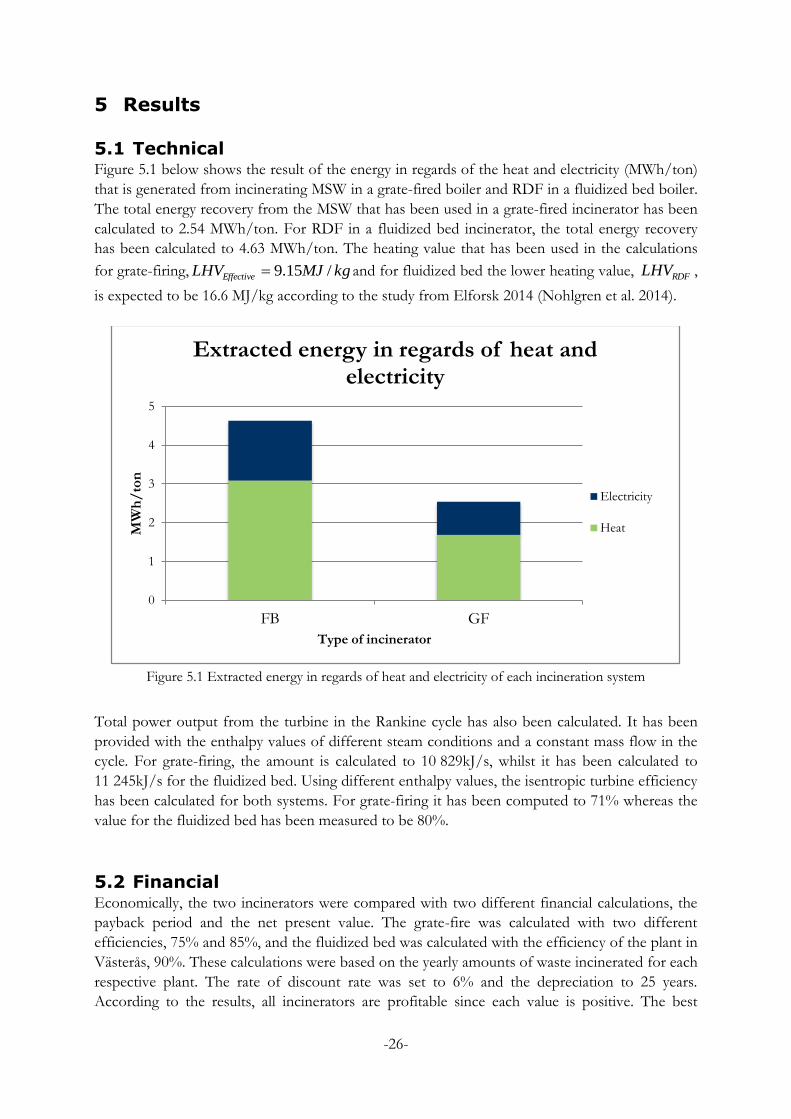
5.1 Technical Figure 5.1 below shows the result of the energy in regards of the heat and electricity (MWh/ton)
that is generated from incinerating MSW in a grate-fired boiler and RDF in a fluidized bed boiler.
The total energy recovery from the MSW that has been used in a grate-fired incinerator has been
calculated to 2.54 MWh/ton. For RDF in a fluidized bed incinerator, the total energy recovery
has been calculated to 4.63 MWh/ton. The heating value that has been used in the calculations
for grate-firing, kgMJLHVEffective /15.9 and for fluidized bed the lower heating value, RDFLHV ,
is expected to be 16.6 MJ/kg according to the study from Elforsk 2014 (Nohlgren et al. 2014).
Figure 5.1 Extracted energy in regards of heat and electricity of each incineration system
Total power output from the turbine in the Rankine cycle has also been calculated. It has been
provided with the enthalpy values of different steam conditions and a constant mass flow in the
cycle. For grate-firing, the amount is calculated to 10 829kJ/s, whilst it has been calculated to
11 245kJ/s for the fluidized bed. Using different enthalpy values, the isentropic turbine efficiency
has been calculated for both systems. For grate-firing it has been computed to 71% whereas the
value for the fluidized bed has been measured to be 80%.
5.2 Financial Economically, the two incinerators were compared with two different financial calculations, the
payback period and the net present value. The grate-fire was calculated with two different
efficiencies, 75% and 85%, and the fluidized bed was calculated with the efficiency of the plant in
Västerås, 90%. These calculations were based on the yearly amounts of waste incinerated for each
respective plant. The rate of discount rate was set to 6% and the depreciation to 25 years.
According to the results, all incinerators are profitable since each value is positive. The best
0
1
2
3
4
5
FB GF
MW
h/
ton
Type of incinerator
Extracted energy in regards of heat and electricity
Electricity
Heat
-27-
performing plant was shown to be the fluidized bed with 9978 Mkr, followed by the GF-75 with
8146 Mkr, and lastly GF-85 with 6407 Mkr. The results are presented in figure 5.2 and the
seemingly odd result regarding the order of the grate-firing plants will be discussed further.
Figure 5.2 The net present value for each incinerator
According to the payback period formula, once again the fluidized bed plant is the most
profitable one, with the lowest payback period of 3.54 years. This is followed by GF-75 with 5.11
years and lastly GF-85 with a payback period of 5.86 years. The result is presented graphically in
figure 5.3 below.
Figure 5.3 The payback period for each incinerator
0
2000
4000
6000
8000
10000
12000
FB GF-75 GF-85
NP
V i
n M
kr
Type of incinerator
NPV
0
1
2
3
4
5
6
7
FB GF-75 GF-85
Years
Type of incinerator
Payback period
-28-
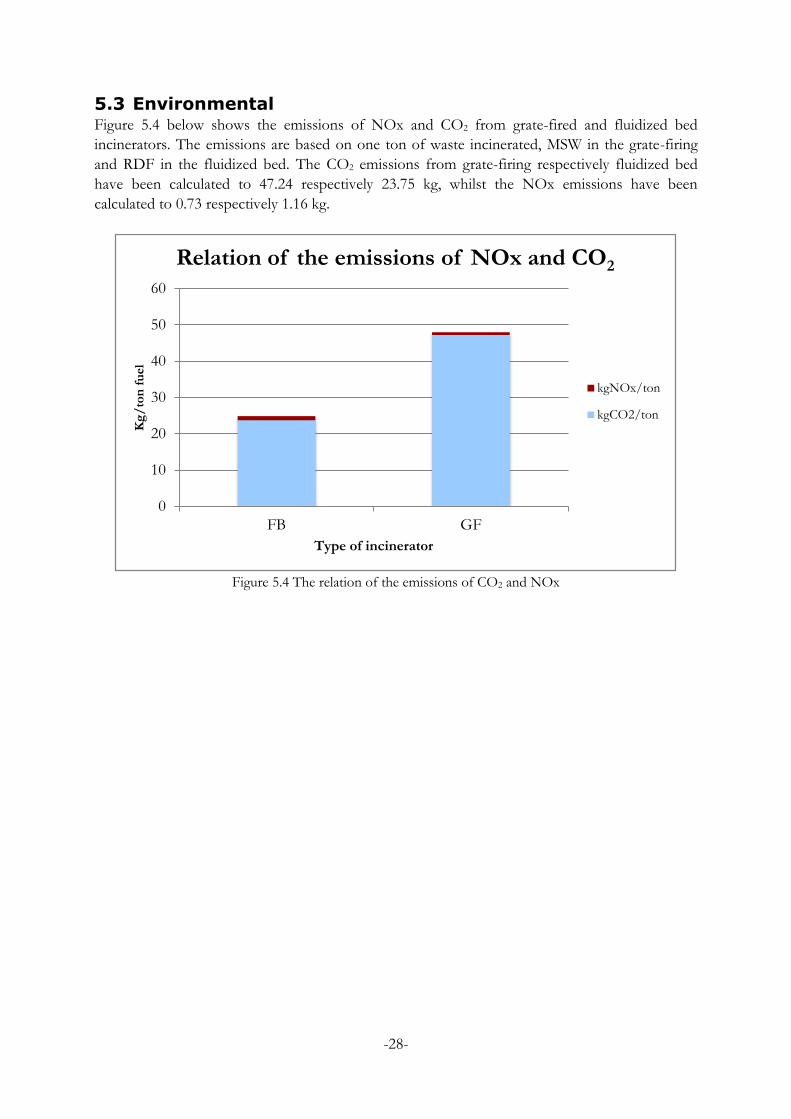
5.3 Environmental Figure 5.4 below shows the emissions of NOx and CO2 from grate-fired and fluidized bed
incinerators. The emissions are based on one ton of waste incinerated, MSW in the grate-firing
and RDF in the fluidized bed. The CO2 emissions from grate-firing respectively fluidized bed
have been calculated to 47.24 respectively 23.75 kg, whilst the NOx emissions have been
calculated to 0.73 respectively 1.16 kg.
Figure 5.4 The relation of the emissions of CO2 and NOx
0
10
20
30
40
50
60
FB GF
Kg
/to
n f
uel
Type of incinerator
Relation of the emissions of NOx and CO2
kgNOx/ton
kgCO2/ton
-29-
6 Sensitivity analysis One of the parameters that are estimated in this report is the heating value. For the calculations
with fluidized bed, a LHV of 16.6 MJ/kg has been used (Nohlgren et al. 2014). To analyze this
further, a different study of the lower heating value has been considered. According to this study,
the lower heating value can vary between 16-20 MJ/kg for commercial- and household waste
(Gendebien et al. 2003). Using the LHV of 20 MJ/kg, the extracted energy calculations will be
changed. The total amount of energy will be 5.55 MWh/ton in which 3.70 MWh/ton is heat and
1.85 MWh/ton is electricity, as it is shown in figure 6.1 below. A higher LHV thus provides a
higher amount of total extracted energy in comparison to the energy that was initially computed
for the fluidized bed.
Figure 6.1 Extracted energy in regards of heat and electricity for the FB incineration with
two different lower heating values
Steam data in regards of pressure and temperature for grate-fired boilers are frequently about 40-
50bar and 400-450°C (Nohlgren et al. 2014). In the Rankine cycle for a grate-fired boiler, the
calculations have been made with the lowest pressure and temperature, 40bar and 400°C. Now,
that highest values of the intervals (50bar, 450°C) will be used to acknowledge the impact on the
efficiency. With these values (put into equation 14) a higher turbine efficiency for the grate-fired
boiler is generated, 78%. In comparison with the lowest steam conditions, which generated an
efficiency of 71%, it has thereby been increased by 7%. The steam conditions for a fluidized bed
boiler, gathered from the CHP plant in Västerås has not changed.
Environmentally, the flue gases CO2 and NOx have been observed in this report, however the
amount of released gases has been used from the study of Elforsk 2011. Presumably, emissions
of these gases have been treated and reduced to lower values during these past years.
0
1
2
3
4
5
6
FB with the calculated LHV FB with the highest LHV
MW
h/
ton
Type of incinerator
Extracted energy in regards of heat and electricity
Electricity
Heat
-30-
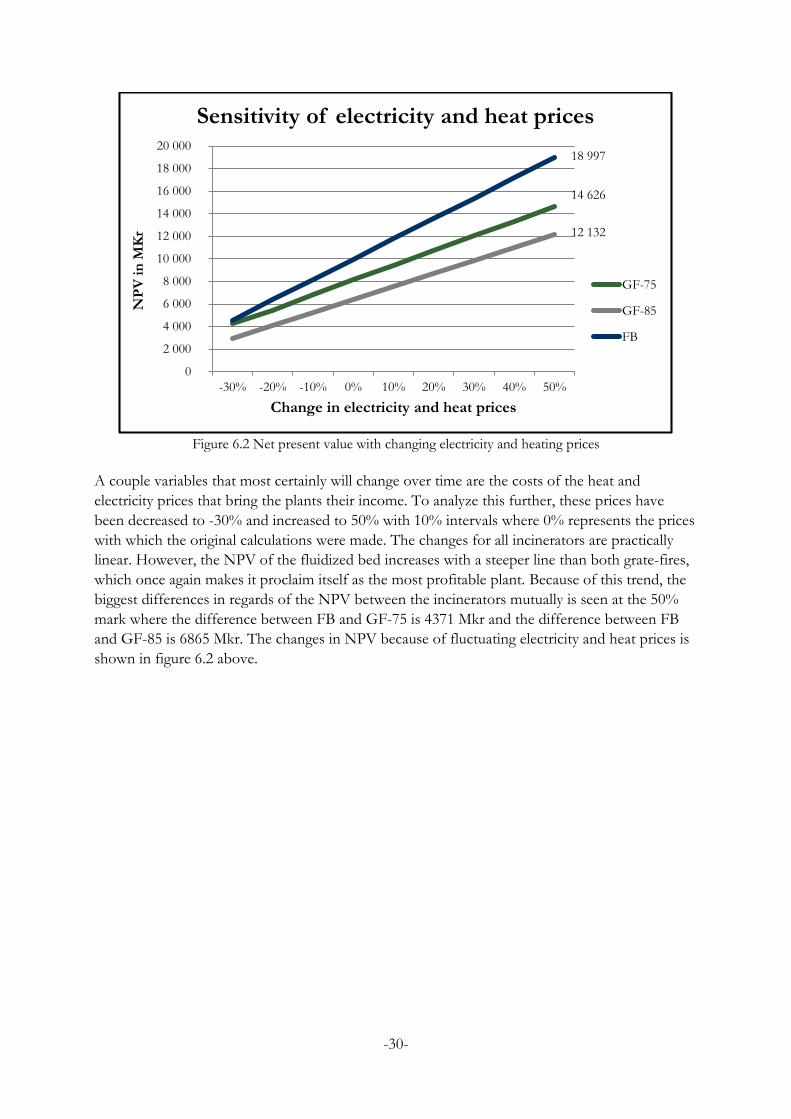
Figure 6.2 Net present value with changing electricity and heating prices
A couple variables that most certainly will change over time are the costs of the heat and
electricity prices that bring the plants their income. To analyze this further, these prices have
been decreased to -30% and increased to 50% with 10% intervals where 0% represents the prices
with which the original calculations were made. The changes for all incinerators are practically
linear. However, the NPV of the fluidized bed increases with a steeper line than both grate-fires,
which once again makes it proclaim itself as the most profitable plant. Because of this trend, the
biggest differences in regards of the NPV between the incinerators mutually is seen at the 50%
mark where the difference between FB and GF-75 is 4371 Mkr and the difference between FB
and GF-85 is 6865 Mkr. The changes in NPV because of fluctuating electricity and heat prices is
shown in figure 6.2 above.
14 626
12 132
18 997
0
2 000
4 000
6 000
8 000
10 000
12 000
14 000
16 000
18 000
20 000
-30% -20% -10% 0% 10% 20% 30% 40% 50%
NP
V i
n M
Kr
Change in electricity and heat prices
Sensitivity of electricity and heat prices
GF-75
GF-85
FB
-31-
7 Discussion Reviewing the results of the extracted energy, a quick observation could initially be made. The
total amount extracted energy from the fluidized bed incineration is higher than for grate-firing
incineration. This amount depends on the characteristics of the fuel that is used in the grate-firing
and fluidized bed incinerators. Pre-handled fuel which is combusted in the fluidized bed
incinerator provides higher energy output in regards of electricity and heat and better
performance for combustion which ultimately leads to higher calorific value and higher
efficiency.
In this study, two simple Rankine cycles for grate-fired and fluidized bed incinerators have been
considered. The total power output which has been calculated is higher for the fluidized bed
boiler than for the grate-fired boiler. Better steam conditions for the fluidized bed boiler in the
Rankine cycle have likewise contributed to higher turbine efficiency.
Environmental aspects from these two systems regarding ashes, flue gases and air pollution have
been considered and supported with calculations. CO2 emissions are higher in grate-fired
incinerators than in fluidized bed incinerators as the report from Elforsk suggested. Because of
the lower weight of RDF, less CO2 emissions are spilt from a fluidized bed. NOx emissions are
in comparison lower in the grate-fired incinerators than in fluidized bed incinerators, which
contradict the data from Elforsk’s report. This might be explained due to the type of fluidized
bed incinerator that was used to compute the data in that report. It might have been gathered
from usage of a CFB boiler which has higher gas velocity than any other fluidized bed boiler,
such as the one used in this report. Furthermore, higher gas velocities could be a reason for lower
released amounts of NOx, which is why the CFB boiler from the report released relatively less
NOx emission than the one calculated on in this report.
For the financial calculations, an efficiency scale between 75- and 85% for the grate-fire has been
used to show how dependent the economical results are on the efficiency. Since the visited CHP-
plant in Västerås does not have any grate-firing applications, the efficiency scale has been
assumed. For the fluidized bed calculations, the efficiency of the plant in Västerås has been used,
which was 90%. Reviewing the results, a notable observation is quickly made. According to them,
GF-75, with the lower efficiency is the seemingly cheaper option compared to the higher efficient
GF-85. How come? All the plants receive a fee from the supplier for handling the waste. Since
the lower efficient GF also receives larger amounts of waste, its income of fee’s naturally also
increases. However, MSW is a complicated type of fuel, compared to e.g. oil. Consequently,
larger amounts of waste leads to higher portions of unexpected stops in the machinery and the
biggest cost for any plant is in fact the lost incomes that accompany a freezingly still power plant,
due to less amounts of sold heat and electricity. The number of days the incinerators were
inactive in the calculations were constant. This value should have been increased for the GF-75
incinerator to be more realistic and thus, create a much higher expense.
As mentioned before, the performance of the CHP-plant in Västerås, which extracts 50 MW
electricity and 100 MW heat, has been used in the calculations for both incinerators. However,
this comprehensive size is generally too big for one single grate-firing incinerator to manage. If
this performance was to be expected from a grate-firing incinerator, two separate ones would
-32-
probably be needed. To simplify the calculations however, it has therefore been assumed both
incinerators manage to fulfill this performance.
-33-
8 Conclusion The study quantifies and compares two types of incinerators, namely grate-firing and fluidized
bed. These are used for handling waste in many areas in Sweden. The incinerators have been
compared from three different perspectives; technical, financial and environmental.
Reviewing the result and discussion, some conclusions will be ratiocinated. The study has shown
that processing one ton of combustible waste provides higher energy from RDF in a fluidized
bed boiler with 4.63 MWh/ton than of MSW in a grate-fired boiler with 2.54 MWh/ton.
Furthermore, the turbine efficiency and total power output is concluded higher in fluidized bed
systems with 80% than in grate-fired systems with 71% because of better steam qualities, as
shown in the models in section 2.1.
Emissions of CO2 are higher in the combustion of MSW in grate-fired boilers than of RDF in
fluidized bed boilers, as expected from the literature study. Consequently, this is a major
disadvantage for MSW. On the other hand, NOx emissions were proved to be higher in the
combustion of RDF in FB boilers, which should be taken under consideration.
From a financial perspective, the study strongly indicate the fluidized bed incinerator as the better
alternative for thermal treatment of waste compared to the grate-fire, with the highest calculated
net present value of 9978 Mkr and the lowest measured payback period of 3.54 years.
The fluidized bed incinerator is therefore considered as the preferable alternative for incineration
of waste from all the three different regarded perspectives - energy, financial and environmental.
-34-
9 Future work Future exertion for studies within RDF and waste incineration is to search different applications
of burning RDF instead of in fluidized bed incinerators and to discover whether the energy
production will be affected. For studies within MSW, the grate-firing boiler should be improved
for handling waste which increases the efficiency.
Still, emissions of the flue gases are high and impact environment negatively. From an
environmental perspective, both incinerators must reduce the rate of the flue gases to decrease
the environmental impacts.
An enhancement of steam conditions of the CHP plant could increase the turbine efficiency and
total power output in the Rankine cycle for both incinerators. One of these improvements could
be superheating the steam to high temperatures before the steam continues into the turbine.
A combined cycle power plant, which uses both gas and steam turbines together to produce
more electricity has recently been attractive, in a technical as well as in an economical perspective.
The efficiency can be increased using the combined cycle without increasing the initial cost
directly. Consequently, the usage of the combined-cycle power plant could provide both technical
and economical advantages in many power plants in the future.
-35-
10 Bibliography
Agll et al., 2014. "Study of energy recovery and power generation from alternative energy source."
Case Studies in Thermal Engineering, 2014: 92-98.
Alam et al., 2001. "ENERGY RECOVERY FROM MUNICIPAL SOLID WASTE IN
DHAKA CITY." 4th International Conference on Mechanical Engineering. Dhaka, Bangladesh:
Dept. of SESAM, University of Flensburg, Germany, 2001. 125-130.
Arena. "Process and technological aspects of municipal solid waste gasification. A review." Waste
Equation 4 has given an effective LHV value of kgMJLHVEffective /15.9 .
According to the study from Elforsk 2014, the lower heating value RDFLHV is expected to be
16.6 MJ/kg for RDF (Nohlgren et al. 2014). This LHV has been used in the calculations for the
fluidized bed combustion.
11.3 The energy calculations To provide the energy in MWh per ton of combustible waste in the grate-firing boiler, equation 5
is used, with the effective heating value, EffectiveLHV and the conversion factor 3600 between
MWh and MJ.
3600
)(ton
MJLHV
EMSW
firingGrate [ ] (5)
The energy in the grate-fired system has been calculated to 2.54 MWh/ton.
The relation between heat and power has been provided from the interview with the CHP-plant
in Västerås. In Table 4.3, the percentages have been calculated according to the plant’s capacity.
Table 4.3The percentage of heat and electricity that is generated at the CHP-plant in Västerås (Starfelt 2015)
Amount (MW) Percentage (%)
Electricity 50 33.3
Heat 100 66.7
Total 150 100
ton
MWh
-42-
firingGrateh EtageHeatprocenMWh (7)
firingGratee EeyprocentagElectricitMWh (8)
With Table 4.3 and equations 7 and 8, the percentage of heat and electricity has been calculated,
and presented below.
𝑀𝑊ℎℎ = 1.69 𝑀𝑊
𝑀𝑊ℎ𝑒 = 0.85 𝑀𝑊
The extraction of energy from a fluidized bed combustor has been calculated according to
equation 6 and with the value kgMJLHVRDF /6.16 from Elforsk’s study 2014 (Nohlgren et al.
2014).
3600
)(ton
MJLHV
ERDF
bedFluidized [ (6)
The energy has been calculated to 4.63 MWh/ton.
With equations (7) and (8) and if the same boiler efficiency is assumed for both systems, heat and
electricity from the fluidized bed combustor will be divided as follows.
𝑀𝑊ℎℎ = 3.09 𝑀𝑊
𝑀𝑊ℎ𝑒 = 1.54 𝑀𝑊
11.4 Rankine cycle calculations In figure 4.1, for a grate-fired boiler, the enthalpy in each state has been read from Havtun’s
collection of formulas in page 57 (Havtun 1997), with the steam conditions, barp 40 and
400°CT at state (1), barp 1 and 100°CT at state (2), the following result is derived.
In figure 4.2 for a fluidized bed boiler, the enthalpy has been read from the same table with steam
conditions, barp 75 and 470°CT at state (1) and the same conditions for state (2) as figure
4.1 shows. The following result is derived.
]ton
MWh
kgkJh
kgkJh
kgkJh
is /2450
/2675
/3225
,2
2
1
-43-
To determine the total power output, equations (9) and (10) have been used for both grate-firing
and fluidized bed systems.
21, hhw outturb [ (9)
SteammhhoutputTotalpower
)( 21 [ (10)
In equation 9, the turbine work is described as the difference of the enthalpy before and after the
turbine. With mass flow skgmSteam /66.16
from the CHP-plant and enthalpy data from each
system, the total power output from turbine has been calculated (Starfelt 2015).
For the Rankine cycle, isentropic turbine efficiency can be calculated according the following
equation.
(14)
With the collected values of 1h , 2h and ish ,2 of each system, the isentropic turbine efficiency has
been calculated and the following values have been provided.
11.5 Environmental calculations As mentioned before, the values of emissions of CO2 and NOx will be used from Elforsk’s
report 2011 (Nyström et al. 2011). These values with total extracted energy from grate-firing and
fluidized bed in equations 11 and 12 will provide the amount of kg NOx/ton and kg CO2/ton
fuel that are released from each systems.
CO2 emissions with RDF incineration in fluidized bed boilers are 110g/kWh, and with
MSW incineration in grate-firing it amount to 120g/kWh.
NOx emissions during RDF incineration in fluidized bed boilers are about 70mg/MJ and
MSW incineration in grate-fired boilers gives 80mg/MJ.
kgkJh
kgkJh
kgkJh
is /2500
/2675
/3375
,2
2
1
]kg
kJ
]s
kJ
skJoutputTotalpower
skJoutputTotalpower
bedFluidized
firingGrate
/11245)(
/10829)(
is
Thh
hh
,21
21
%71, firingGrateT
%80, bedFluidizedT
-44-
NOx =mgNOx
106 MJ×MJ
ton [ (11)
CO2 =gCO2
103kWh×kWh
ton [ (12)
In table 11.2, the total extracted energy is showed from previous energy calculations and it is
presented in two different units to convert easily between emissions gCO2/kWh and mg
NOx/MJ.
Table 11.2 Total extracted energy from grate-firing and fluidized bed in two different units
Type of fuel kWh/ton MJ/ton
GF (Grate-firing) 2540 9144
FB (Fluidized bed) 4630 16668
In table 11.3, the result of flue gases is presented for each system.
Table 11.3 Kg CO2/ton and NOx/ton fuel from each system
Type of fuel kg CO2/ton fuel kg NOx /ton fuel
GF (Grate-firing) 47.24 0.73
FB (Fluidized bed) 23.75 1.16
11.6 Financial calculations One of the two MSW incinerators of fluidized bed and grate firing is more profitable than the
other. In order to determine which one, the payback period and the NPV of each method has
been calculated and later evaluated.
Tons of waste per year
The plant in Västerås incinerates waste in a flow of 60ton/hour, with the assumption of 330
active days this will amount to (Starfelt 2015).
Using equations 17 and 18, the amounts of waste per hour using the grate-firing incinerator will
be given.
150(MW)
0.85 ×2.54(MWh
ton)
= 69(ton
h)
150(MW)
0.75 ×2.54(MWh
ton)
= 79(ton
h)
Using the same equation as for the fluidized bed, these flows will amount to 550255 ton/year and
623622 ton/year respectively.
]kg
]kg
60(ton
h) ×24(d) ×330(d) = 475200(
ton
year)
-45-
Initial investment
The initial cost to consider and calculate when estimating a project’s profitability is the starting
investment cost. The costs collected from Elforsk’s report 2011 for this particular calculation is
displayed in table 11.4 below.
Table 11.4 Initial investment costs for FB and grate-firing incinerators (Nyström et al. 2011)
Type of incinerator Kr/kWe
FB 76300
Grate fire 108600
From these values the investment cost for each plant can be calculated.
From these calculations, the grate firing plant is the seemingly higher value investment with 5430
Mkr comparing with the cost of 3815 Mkr for the fluidized bed plant.
Waste costs
The prices for the wastes are shown in table 11.5 below. They are collected from Elforsk’s report
from 2014 and are given per extracted MWh.
Table 11.5 Waste costs for the FB and grate-firing plants (Nohlgren et al. 2014)
Type of plant Kr/MWh
FB 25
Grate fire -130
When it comes to the grate firing system, disposal plants in Sweden receive a fee for the to-be-
treated waste. Therefore, the waste cost actually is negative and the expense becomes revenue.
The value of -130 Kr/MWh represents a receiving-fee of approximately 400 Kr/ton gross (the
price varies from 300-450 Kr/ton depending on the concerned county, but in this report the
value of 400 Kr/ton is estimated and used).
The CHP plant in Västerås, using fluidized bed also receives a fee for the amounts of waste they
have shipped, however, since the waste needs to be sorted, crushed and pre-processed, the fee
ultimately turns to an expense, as shown in table 11.5. The calculated values for the waste costs
are shown below.
25kr
MWh× 4.63
MWh
ton=116
kr
ton
-130kr
MWh×2.54
MWh
ton= -330
kr
ton
76300kr
kWe
×50kWe = 3815Mkr
108600kr
kWe
×50kWe = 5430Mkr
-46-
From these calculations, the waste costs for a fluidized bed plant is approximately 116 Kr/ton
whilst it for a grate fire plant is an income of 330 Kr/ton.
Variable management & maintenance costs
The values for the management & maintenance (M&M) costs are collected from two different
Elforsk reports, the reports from year 2011 and 2014. From the report 2011, the data on the
percentile composition of the M&M costs are collected and the final estimated costs are collected
from their newest report of 2014. This is presented in table 11.6 below. It is assumed the values
from the report 2011 are reasonable to combine with the data from 2014 since the composition
of the M&M costs have not changed significantly in the past years (Nohlgren et al. 2014),
(Nyström et al. 2011).
Table 11.6 Variable management and maintenance costs for FB and grate-firing plants
Variable M&M FB Grate fire
Bed material (sand) 7% 0%
Chemicals, water etc. 5% 15,5%
Maintenance, staff, material etc. 45% 28%
Rest-product-disposal 43% 56,5%
Total variable costs per MWh fuel (Kr) 55 40
The values of the variable cost per MWh fuel is then multiplied with the extracted amounts of
energy per ton waste from each plant, as seen in the two equations below.
55kr
MWh× 4.63
MWh
ton= 255
kr
ton
40kr
MWh×2.54
MWh
ton=102
kr
ton
It is clear, grate firing has lower cost of variable M&M with a total of 102 Kr/ton, comparing to
the amount of 255 Kr/ton for a fluidized bed plant.
Fixed costs
The fixed costs among others consist of management and maintenance costs. According to the
report from Elforsk 2014, the fixed cost are based upon the electrical capacity of the facility. For
the fluidized bed incinerator amount to 2.5% of its investment cost and for the grate firing
incinerator the cost amounts to 2.9% of the initial investment. Respective cost per kW is
presented in table 11.7.
Table 11.7 Fixed costs for FB and grate-firing plants
Type of incinerator Kr/kWe
BC 1900
Grate firing 3140
-47-
As mentioned before, the performance of the incinerator at Mälarenergi in Västerås will used as
benchmark, with the electrical performance of 50 MW. This amount is multiplied with the
presented amounts form table 11.7 and the calculations are presented below.
The fixed costs are calculated to 95 Mkr and 157 Mkr for the fluidized bed and grate firing
incinerator respectively.
Revenue
The revenues that the CHP plants receive mainly come from the amounts of electricity and heat
sold. The values calculated upon are presented in table 11.8 below. These represent the average
costs of electricity and heat in Sweden 2015 (Svensk fjärrvärmes branschstatistik et al. 2014),
(Elspot Prices et al. 2014).
Table 11.8 Prices for heat and electricity in Sweden 2015
Electricity 288Kr/MWh
Heat 820Kr/MWh
Grate firing
To calculate the revenues, the values for extracted electricity and heat per ton waste are required and collected form section 11.3 (0.85 MWhe/ton and 1.69 MWhh/ton). The “required electricity” is the electricity used to run the facility as a whole and according to the report from Elforsk, it amounts to about 1.5% of the total electrical production (Nyström et al. 2011). Initially, this “required electricity” needs to be calculated and subtracted from the total amount of electricity produced.
0.015×0.85MWhe
ton= 0.01275MWh
Now, the equation below is implemented with the input variables from table 11.8 and the
extracted amounts of heat and electricity gathered from section 11.3. The calculations are
demonstrated below.
(0.85MWhe -0.01275MWhe) ×288kr
MWh+1.69MWhh ×820
kr
MWh=1627
kr
ton
Hereby, the revenue for the sold amounts of electricity and heat for the grate incinerator are
calculated. They are presented in table 11.9 below.
Table 11.9 Revenues from sold heat and electricity per ton waste using the grate-fire
MWh/ton Kr/ton
Electricity 0.85 241
1900kr
kWe
×50000kW = 95000000kr
3140kr
kWe
×50000kW =157000000kr
-48-
Heat 1.69 1386
Total 2.54 1627
Fluidized bed
The same formula and prices on electricity and heat as the case of grate firing is used to calculate
the revenues of one ton incinerated waste using the fluidized bed incinerator. The only difference
is the extracted amounts of electricity and heat extracted using the fluidized bed incinerator.
These are gathered from section 11.3 (1.54 MWhe/ton and 3.09 MWhh/ton). The calculation will
hereby be as follows.
(1.54MWhe -0.0231MWhe) ×288kr
MWh+3.09MWhh ×820
kr
MWh= 2971
kr
ton
Hereby, the revenue for the sold amounts of electricity and heat for the fluidized bed incinerator
are calculated. They are presented in table 11.10 below.
Table 11.10 Revenues from sold heat and electricity using the FB
MWh/ton Kr/ton
Electricity 1.54 437
Heat 3.09 2534
Total 4.63 2971
Compilation of costs and revenues
All the different costs and revenues are summed up and presented in table 11.11 and 11.12
below. In table 11.11, Kr/ton gives the waste costs, variable costs and revenues, whilst they in
table 11.12 are multiplied by each respective amount of waste used per year, to acquire the yearly
costs.
Table 11.11 Compilation of all different costs and revenues calculated, using the FB and