A Comparison of Energy Efficiency Programmes for Existing Homes in Eleven Countries Australia Canada Denmark France Germany Italy Japan The Netherlands Norway Sweden The United States Prepared for the Department of Energy and Climate Change United Kingdom by The Regulatory Assistance Project Blair Hamilton Project Manager 19 February 2010 The Regulatory Assistance Project China ♦ India ♦ European Union ♦ Latin America ♦ United States
Transcript
A Comparison of Energy Efficiency Programmes
for Existing Homes in Eleven Countries
Australia Canada Denmark France Germany Italy Japan
The Netherlands Norway Sweden
The United States
Prepared for the Department of Energy and Climate Change
United Kingdom by
The Regulatory Assistance Project
Blair Hamilton Project Manager
19 February 2010
The Regulatory Assistance ProjectChina ♦ India ♦ European Union ♦ Latin America ♦ United States
ii
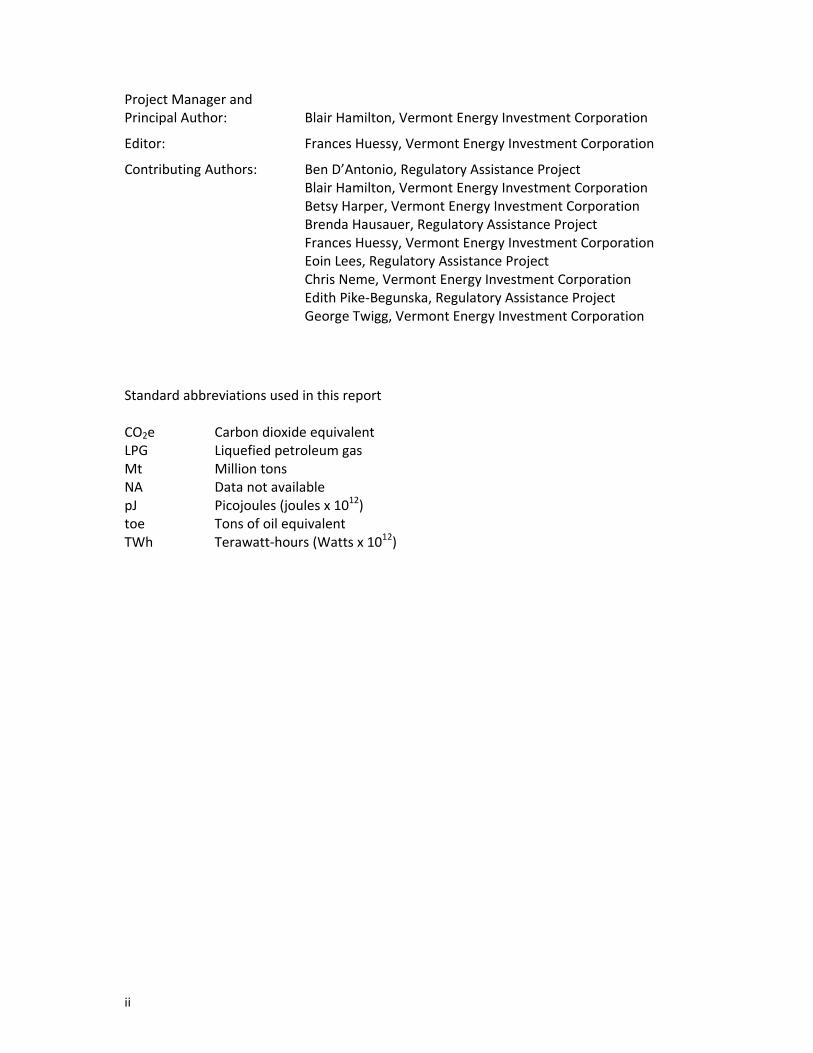
Project Manager and Principal Author: Blair Hamilton, Vermont Energy Investment Corporation
Editor: Frances Huessy, Vermont Energy Investment Corporation
Contributing Authors: Ben D’Antonio, Regulatory Assistance Project Blair Hamilton, Vermont Energy Investment Corporation Betsy Harper, Vermont Energy Investment Corporation Brenda Hausauer, Regulatory Assistance Project Frances Huessy, Vermont Energy Investment Corporation Eoin Lees, Regulatory Assistance Project Chris Neme, Vermont Energy Investment Corporation Edith Pike‐Begunska, Regulatory Assistance Project George Twigg, Vermont Energy Investment Corporation
Standard abbreviations used in this report CO2e Carbon dioxide equivalent LPG Liquefied petroleum gas Mt Million tons NA Data not available pJ Picojoules (joules x 1012) toe Tons of oil equivalent TWh Terawatt‐hours (Watts x 1012)
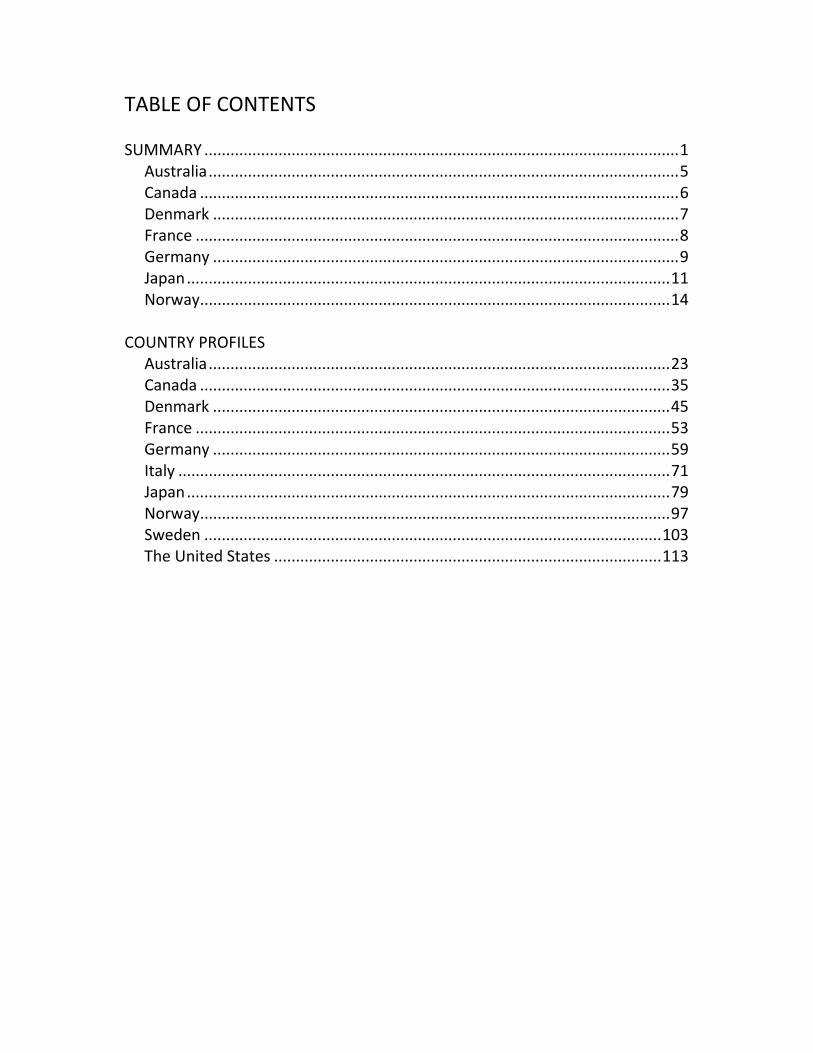
TABLE OF CONTENTS SUMMARY .............................................................................................................1 Australia............................................................................................................5 Canada ..............................................................................................................6 Denmark ...........................................................................................................7 France ...............................................................................................................8 Germany ...........................................................................................................9 Japan...............................................................................................................11 Norway............................................................................................................14 COUNTRY PROFILES Australia..........................................................................................................23 Canada ............................................................................................................35 Denmark .........................................................................................................45 France .............................................................................................................53 Germany .........................................................................................................59 Italy .................................................................................................................71 Japan...............................................................................................................79 Norway............................................................................................................97 Sweden .........................................................................................................103 The United States .........................................................................................113
Summary
Introduction
Carbon emissions from existing homes represent as much as 25% of total emissions in many countries, and are an increasing focus of national and local climate initiatives. Recognizing that efficiency is both a least‐cost emission reduction strategy and that achieving widely accepted climate goals will likely require massive de‐carbonization of the building sector, there is high interest in policy and program options that address existing homes.
This report presents a high‐level comparison of current public energy efficiency programs for existing homes in eleven countries. The purpose is to assist policy makers in the UK by:
1. compiling benchmark data on the varying context and current programs addressing energy efficiency in existing homes in a selected sample of countries, and
2. presenting some of the key opportunities identified and lessons learned from these programs.
The eleven countries contained in this report were selected with the objective of being of the most relevance and value to European policy makers, as well as representing a range of global experience.
Summary of Observations and Findings
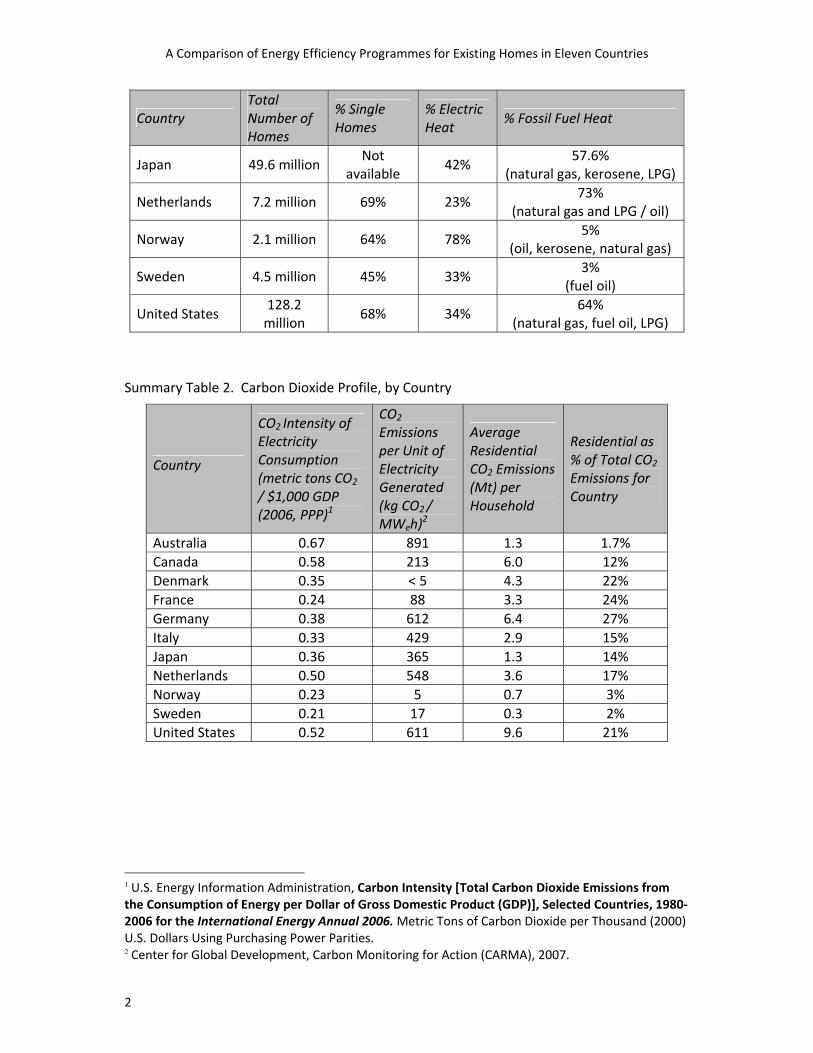
The eleven countries that are the subject of this report vary widely in key characteristics that are relevant to their development and implementation of energy efficiency policies and programs for existing homes. Summary Tables 1, 2, and 3 present some of these key characteristics.
Summary Table 1. Residential Energy Use Characteristics, by Country
Country Total Number of Homes
% Single Homes
% Electric Heat
% Fossil Fuel Heat
Australia 7.9 million 84% 32% 33%
(natural gas)
Canada 12.8 million 67% 34% 61%
(natural gas and fuel oil)
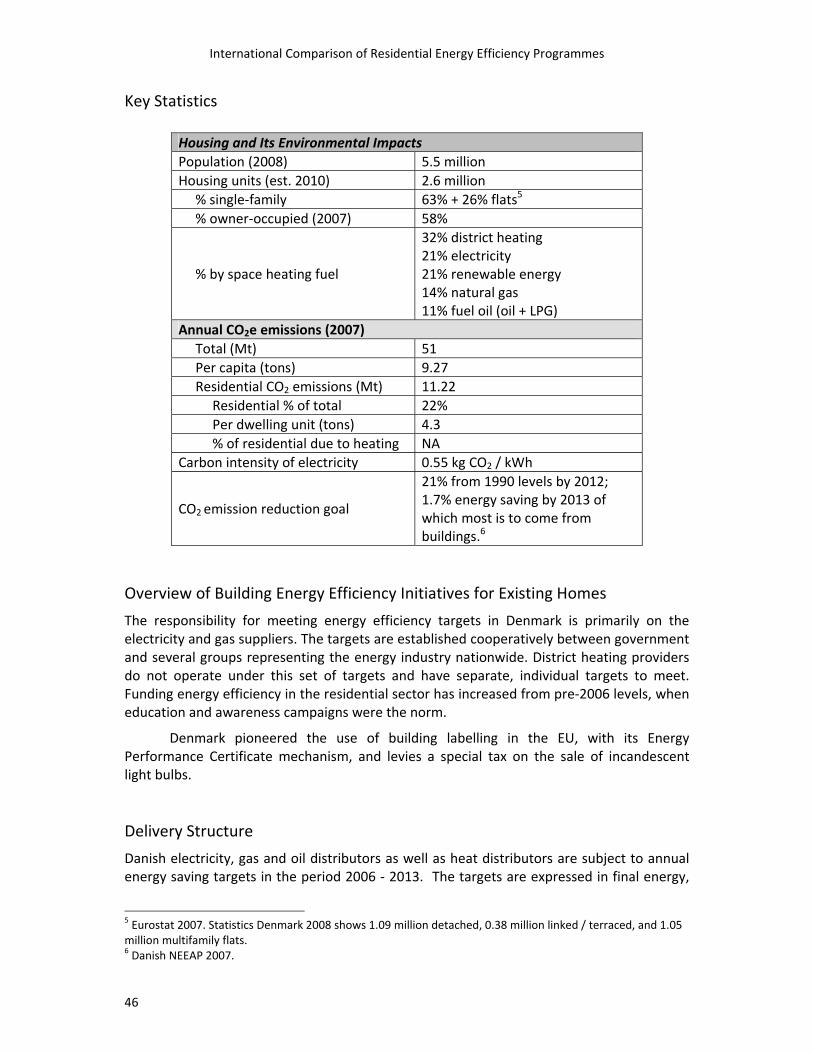
Denmark 2.6 million 63% 21% 25%
(natural gas and LPG / oil)
France 26.7 million 59% 30% 51%
(natural gas and LPG / oil)
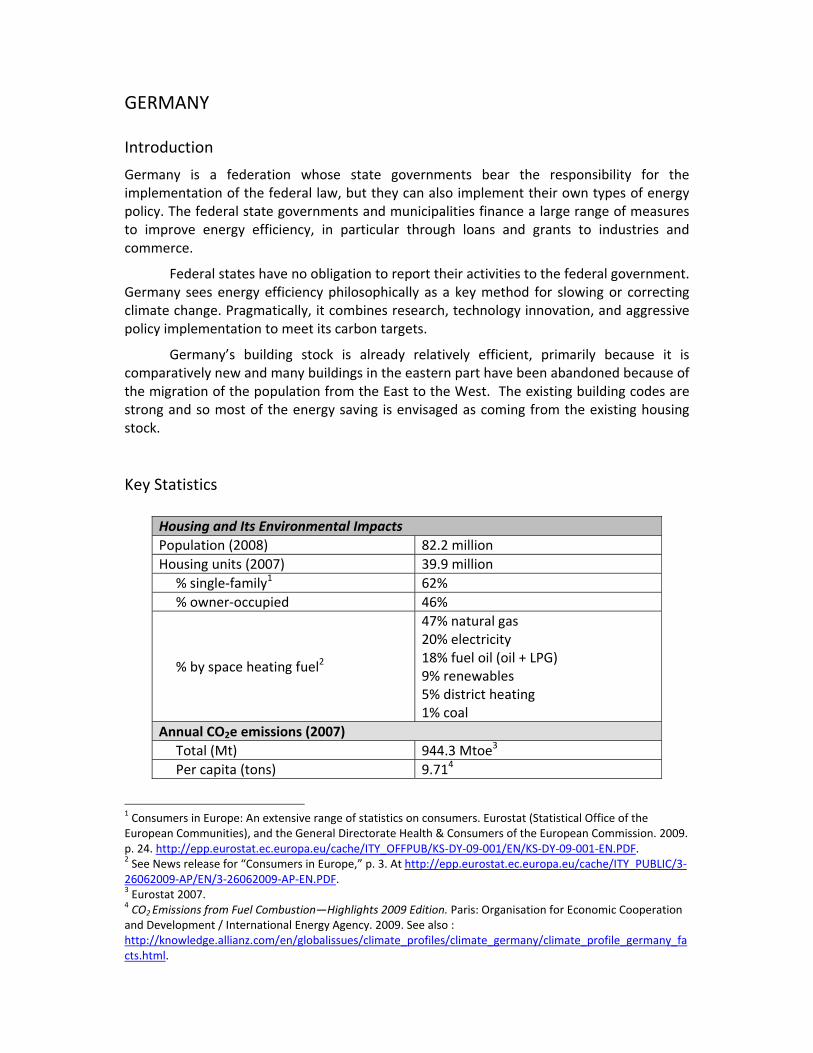
Germany 39.9 million 62% 20% 65%
(natural gas and LPG / oil)
Italy 22.9 million 41% 21% 65%
(natural gas and LPG / oil)
A Comparison of Energy Efficiency Programmes for Existing Homes in Eleven Countries
2
Country Total Number of Homes
% Single Homes
% Electric Heat
% Fossil Fuel Heat
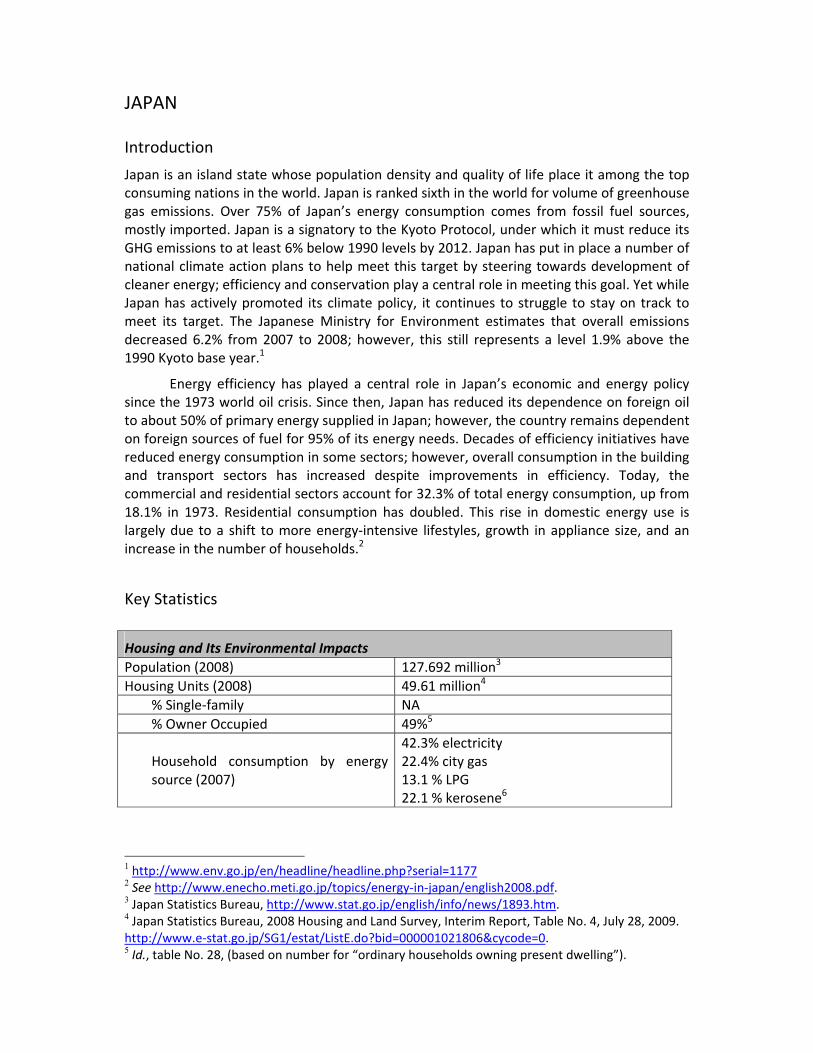
Japan 49.6 million Not
available 42%
57.6% (natural gas, kerosene, LPG)
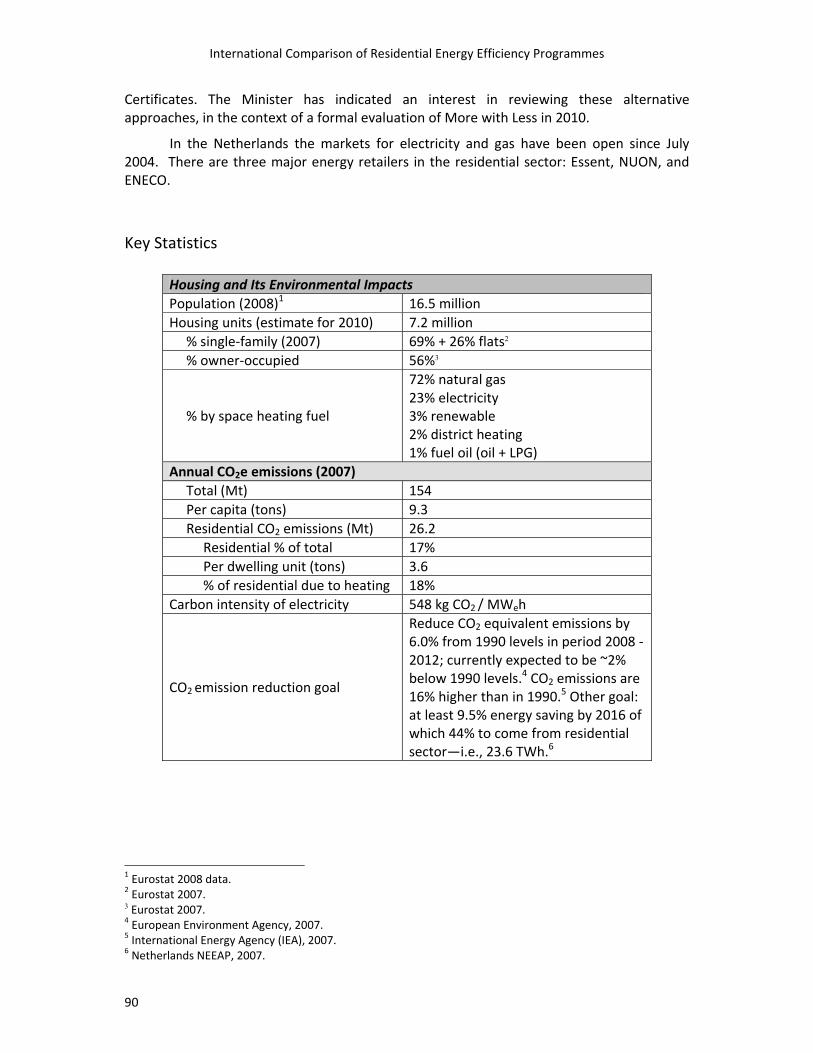
Netherlands 7.2 million 69% 23% 73%
(natural gas and LPG / oil)
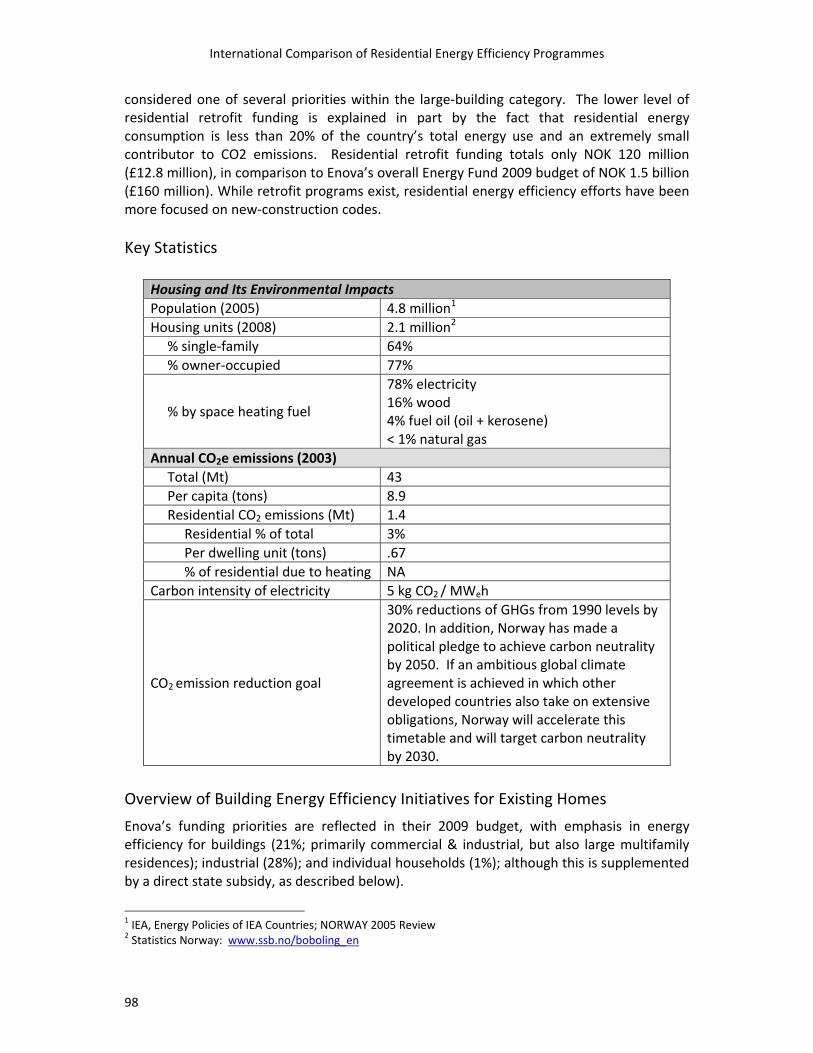
Norway 2.1 million 64% 78% 5%
(oil, kerosene, natural gas)
Sweden 4.5 million 45% 33% 3%
(fuel oil)
United States 128.2 million
68% 34% 64%
(natural gas, fuel oil, LPG)
Summary Table 2. Carbon Dioxide Profile, by Country
Country
CO2 Intensity of Electricity Consumption (metric tons CO2 / $1,000 GDP (2006, PPP)1
CO2 Emissions per Unit of Electricity Generated (kg CO2 / MWeh)
2
Average Residential CO2 Emissions (Mt) per Household
Residential as % of Total CO2
Emissions for Country
Australia 0.67 891 1.3 1.7% Canada 0.58 213 6.0 12% Denmark 0.35 < 5 4.3 22% France 0.24 88 3.3 24% Germany 0.38 612 6.4 27% Italy 0.33 429 2.9 15% Japan 0.36 365 1.3 14% Netherlands 0.50 548 3.6 17% Norway 0.23 5 0.7 3% Sweden 0.21 17 0.3 2% United States 0.52 611 9.6 21%
1 U.S. Energy Information Administration, Carbon Intensity [Total Carbon Dioxide Emissions from the Consumption of Energy per Dollar of Gross Domestic Product (GDP)], Selected Countries, 1980‐2006 for the International Energy Annual 2006. Metric Tons of Carbon Dioxide per Thousand (2000) U.S. Dollars Using Purchasing Power Parities. 2 Center for Global Development, Carbon Monitoring for Action (CARMA), 2007.
Summary
3
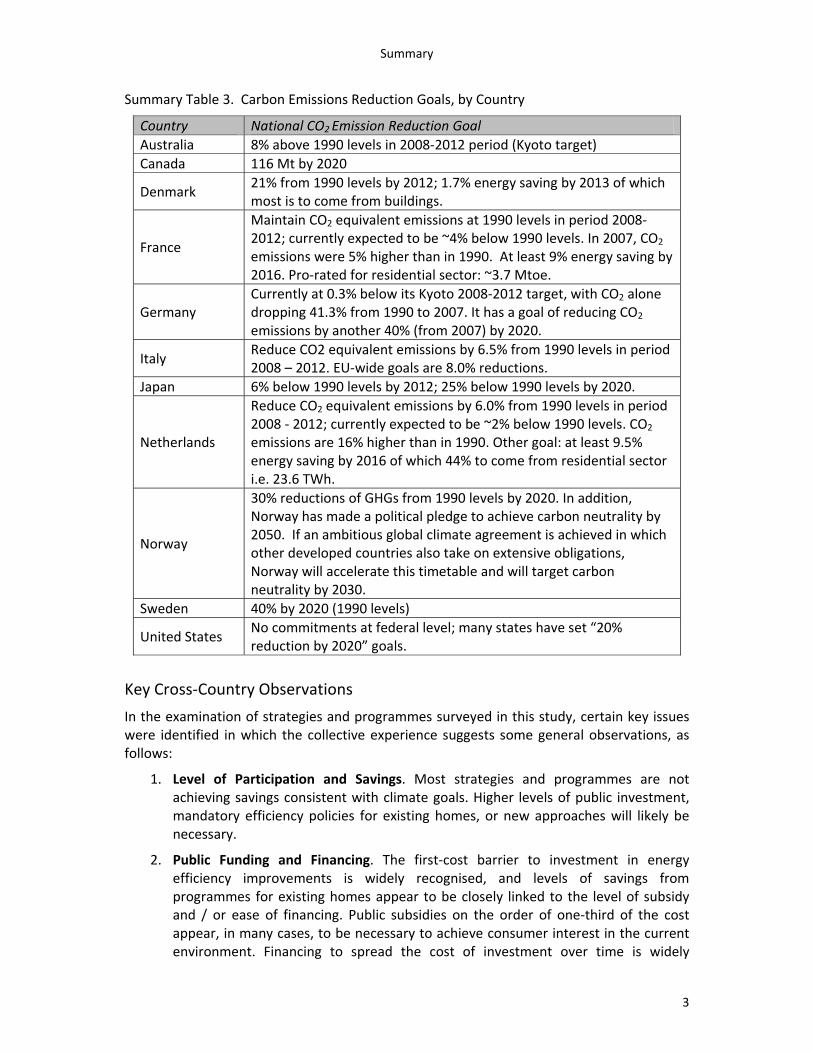
Summary Table 3. Carbon Emissions Reduction Goals, by Country
Country National CO2 Emission Reduction Goal Australia 8% above 1990 levels in 2008‐2012 period (Kyoto target) Canada 116 Mt by 2020
Denmark 21% from 1990 levels by 2012; 1.7% energy saving by 2013 of which most is to come from buildings.
France
Maintain CO2 equivalent emissions at 1990 levels in period 2008‐2012; currently expected to be ~4% below 1990 levels. In 2007, CO2 emissions were 5% higher than in 1990. At least 9% energy saving by 2016. Pro‐rated for residential sector: ~3.7 Mtoe.
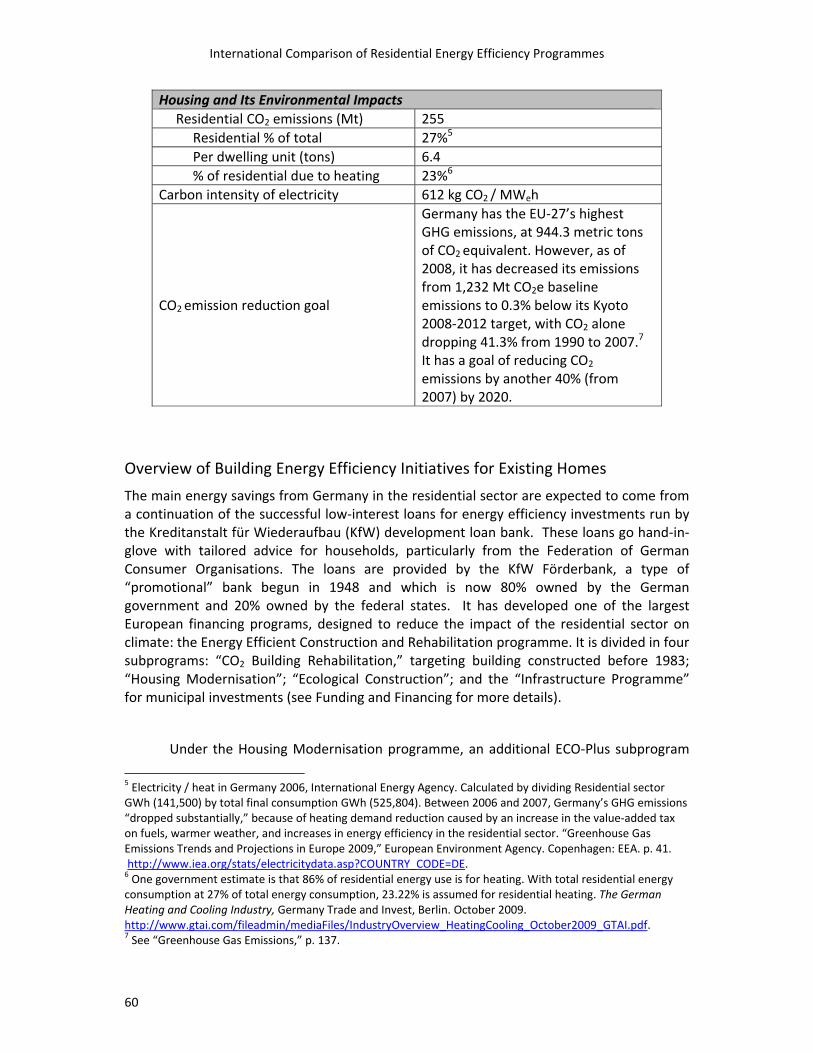
Germany Currently at 0.3% below its Kyoto 2008‐2012 target, with CO2 alone dropping 41.3% from 1990 to 2007. It has a goal of reducing CO2
emissions by another 40% (from 2007) by 2020.
Italy Reduce CO2 equivalent emissions by 6.5% from 1990 levels in period 2008 – 2012. EU‐wide goals are 8.0% reductions.
Japan 6% below 1990 levels by 2012; 25% below 1990 levels by 2020.
Netherlands
Reduce CO2 equivalent emissions by 6.0% from 1990 levels in period 2008 ‐ 2012; currently expected to be ~2% below 1990 levels. CO2 emissions are 16% higher than in 1990. Other goal: at least 9.5% energy saving by 2016 of which 44% to come from residential sector i.e. 23.6 TWh.
Norway
30% reductions of GHGs from 1990 levels by 2020. In addition, Norway has made a political pledge to achieve carbon neutrality by 2050. If an ambitious global climate agreement is achieved in which other developed countries also take on extensive obligations, Norway will accelerate this timetable and will target carbon neutrality by 2030.
Sweden 40% by 2020 (1990 levels)
United States No commitments at federal level; many states have set “20% reduction by 2020” goals.
Key Cross‐Country Observations
In the examination of strategies and programmes surveyed in this study, certain key issues were identified in which the collective experience suggests some general observations, as follows:
1. Level of Participation and Savings. Most strategies and programmes are not achieving savings consistent with climate goals. Higher levels of public investment, mandatory efficiency policies for existing homes, or new approaches will likely be necessary.
2. Public Funding and Financing. The first‐cost barrier to investment in energy efficiency improvements is widely recognised, and levels of savings from programmes for existing homes appear to be closely linked to the level of subsidy and / or ease of financing. Public subsidies on the order of one‐third of the cost appear, in many cases, to be necessary to achieve consumer interest in the current environment. Financing to spread the cost of investment over time is widely
A Comparison of Energy Efficiency Programmes for Existing Homes in Eleven Countries
4
recognised as an important programme element. While there are many energy improvement financing programmes, few have achieved broad participation. The majority of financing programmes also fail to offer financing for terms long enough to support deep energy savings retrofits (up to 20 years). In addition, most programmes address making loans available to the considerable portion of building owners who may have insufficient credit. Financing models that address these barriers should be pursued.
The level of public funding among different countries varies considerably, but in all cases it is unlikely to be sufficient to achieve savings consistent with carbon goals (deep reductions in very large numbers of homes). It appears that these levels of public subsidy will have to be enormously increased, unprecedented levels of financing will need to be put in place, and / or mandatory requirements for existing homes will need to be implemented.
3. Delivery Structures, Responsibility, and Accountability. A wide range of delivery models are being used. Responsibility for their administration ranges from national government to utilities to independent designated “efficiency utilities.” These appear to range widely in cost and effectiveness. Those with clear accountability and motivation to achieve results appear to be associated with achieving deep levels of savings.
A perception appears to exist that the funding mechanism (government taxes, utility levies, etc.) defines who would logically administer programmes. However, there are examples of very effective portfolio management and administration through entities quite separate from the funding source.
Selecting the most appropriate and effective level for programme administration is also a key question. There is experience with a full range of options, from exclusively national programmes to programmes delivered at the state or local government level, as well as those that operate on multiple levels. Although there is recognisable value to national consistency, the value of working with and leveraging the capabilities of trusted local entities appears to be considerable.
4. Single Measure vs. Comprehensive Treatment. There is a stark divide between strategies that recommend and provide incentives for designated individual measures and strategies that promote comprehensive, all‐fuels refurbishment of buildings. While single‐measure, prescriptive approaches appear to offer simplicity and lower delivery cost, advocates of comprehensive treatment have a very strong case for the technical and economic benefits of a comprehensive approach. If achieving climate goals will ultimately require deep, comprehensive refurbishment, single‐measure efforts to implement the “most cost‐effective” measures might well create substantial technical barriers and higher overall costs to achieve these goals.
5. Quality. Broad agreement exists on the need for high levels of quality in building energy refurbishment assessments, products, and installation. However, the focus on this consideration varies widely. Key issues include whether to require the use of trained and certified individuals and / or firms to assess, provide, and install measures, as well as the level of quality assurance inspections.
Summary
5
6. Measures. The range of measures covered by different programmes varies widely from country to country, as does their priority. Some of this variance reflects local conditions, but many differences appear to reflect influences of programme‐structure and / or different technical understandings. For example, programmes that assess or value measures based on first‐year or other limited‐term savings discourage cost‐effective measures with longer lives. Air sealing (or draught‐proofing) provides a good example of a technical difference. Whereas refurbishment programmes in the United States and Canada typically treat air sealing as the first and most cost‐effective measure, draught‐sealing in Europe is generally limited to being a new‐construction measure, despite apparent similar opportunity.
7. Efficiency Requirements for Existing Homes. Although many of the surveyed countries have very aggressive codes for new construction, there has been only limited development toward widespread, mandatory requirements for existing buildings. Some organizations have called for the introduction of time‐of‐sale minimum energy requirements for all buildings by 2020, although no government appears to have yet embraced such a strategy.
8. Fuel Poverty. Only a few countries have programmes specifically designed to address fuel poverty in low‐income households. While many countries suggest their conditions and policies do not raise this as a priority issue, for others it is a major consideration that requires targeted programmes.
Country‐by‐Country Data, Findings, and Observations
The country‐by‐country sections of this report contain data, findings and observations for each country, including:
• Overview of Building Energy Efficiency Initiatives for Existing Homes
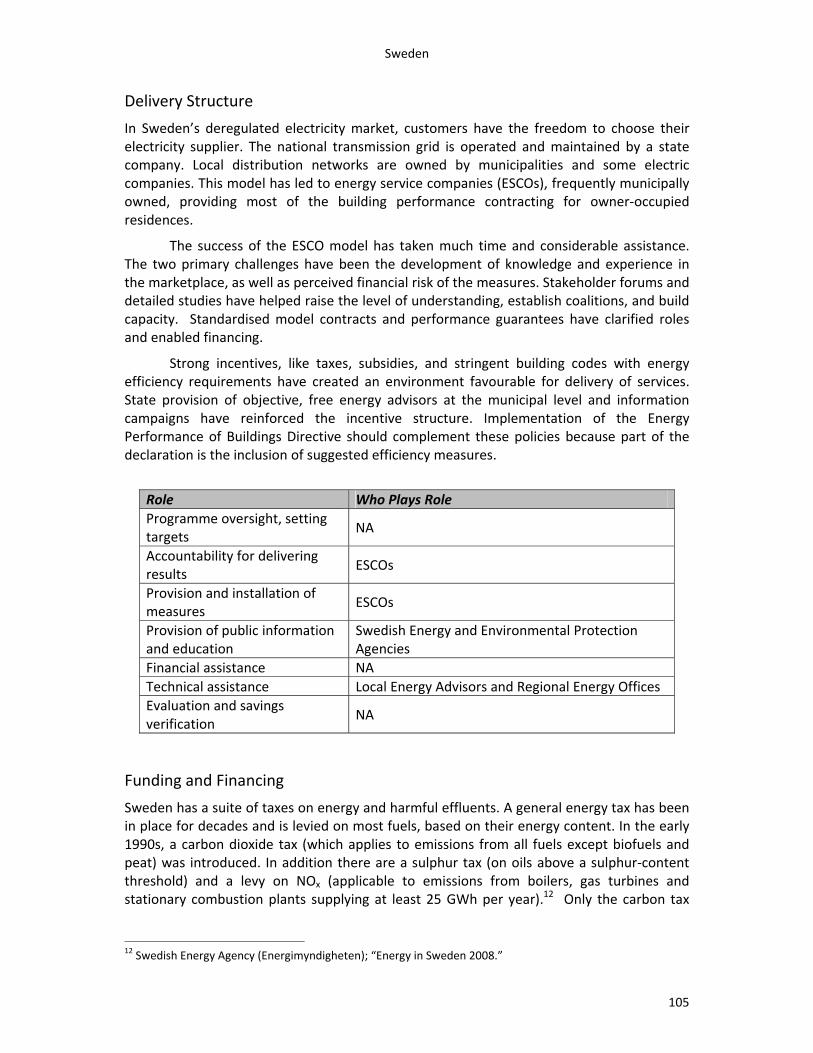
• Delivery Structure
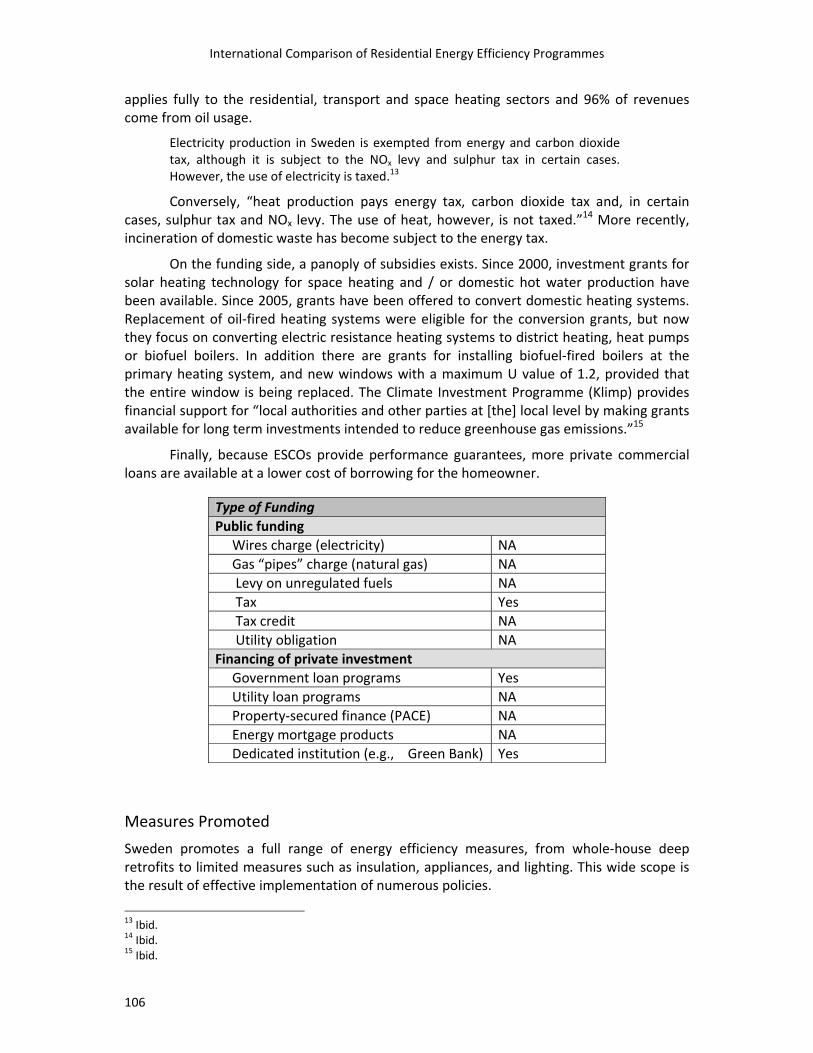
• Funding and Financing
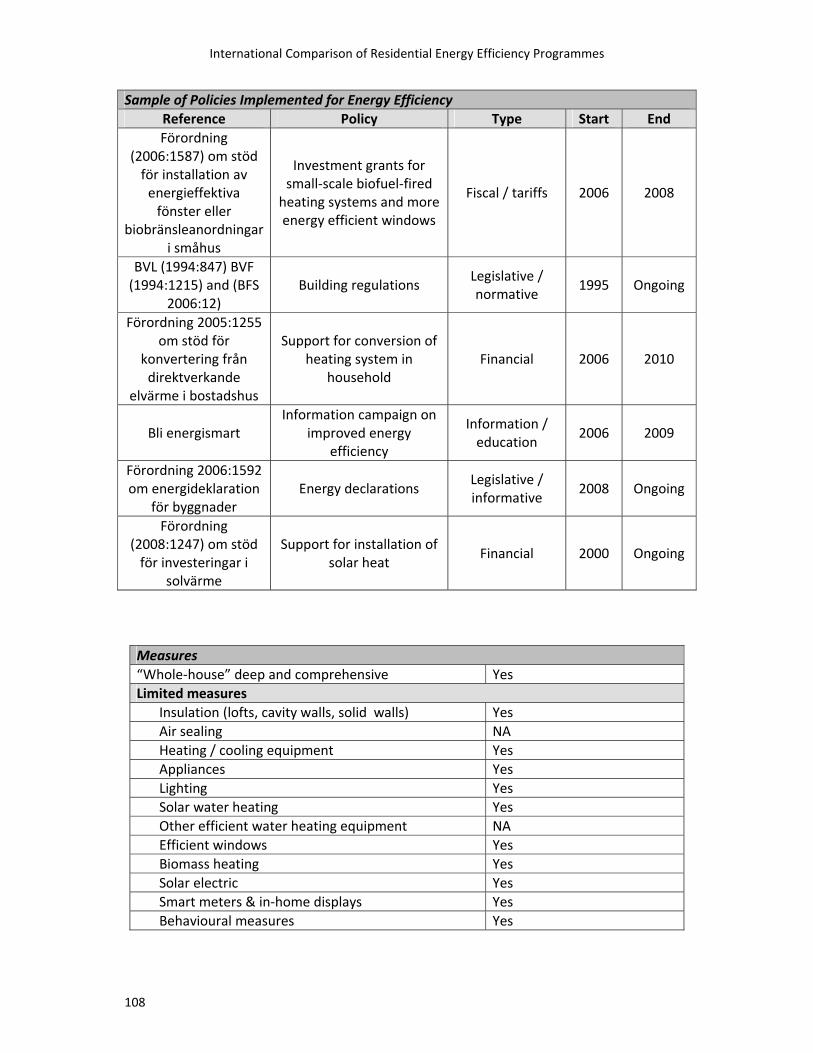
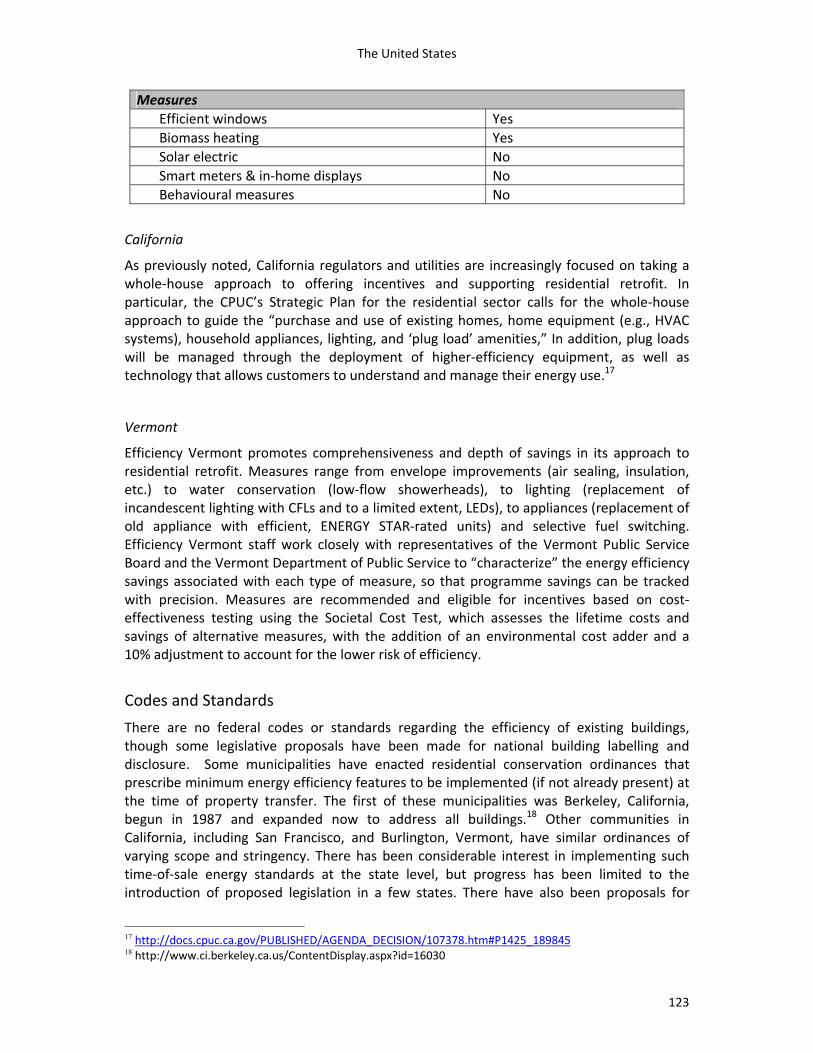
• Measures Promoted
• Codes and Standards
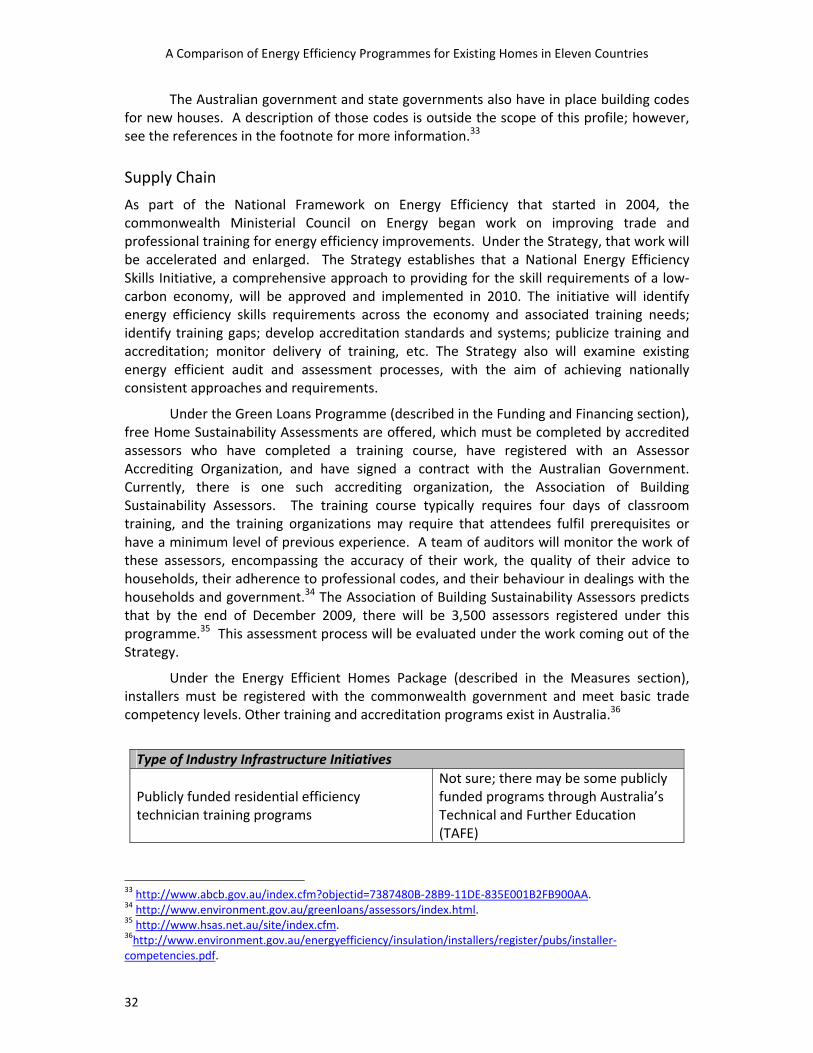
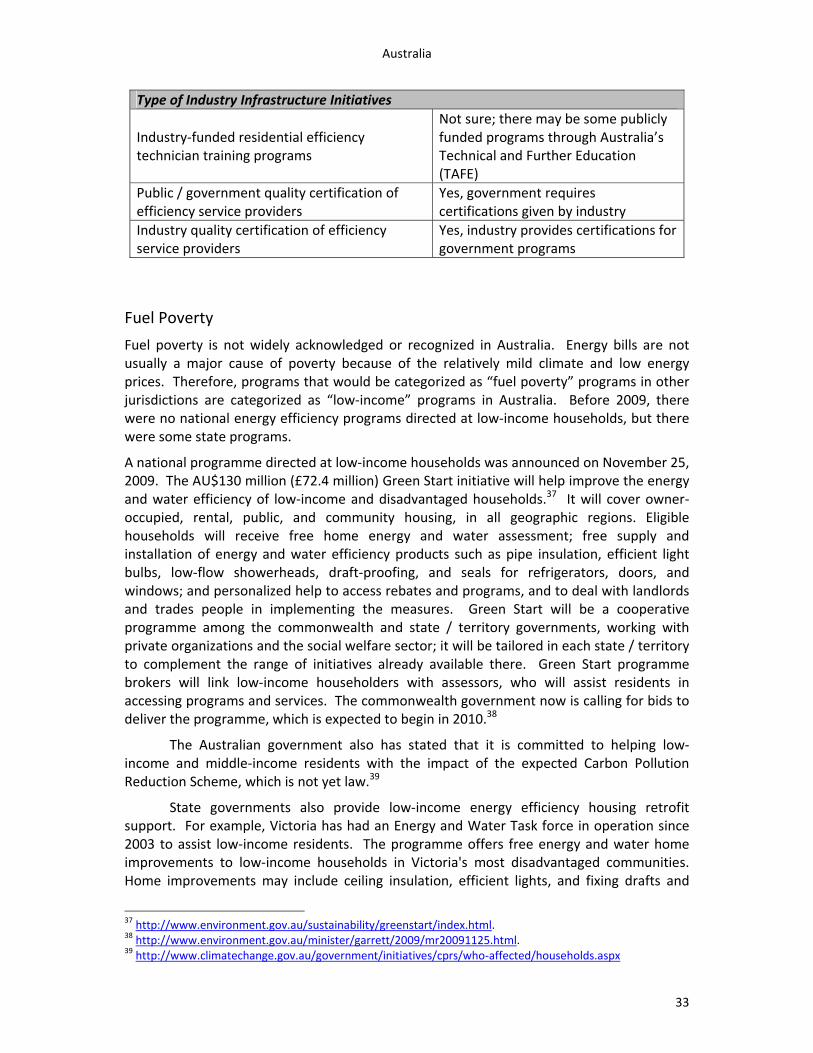
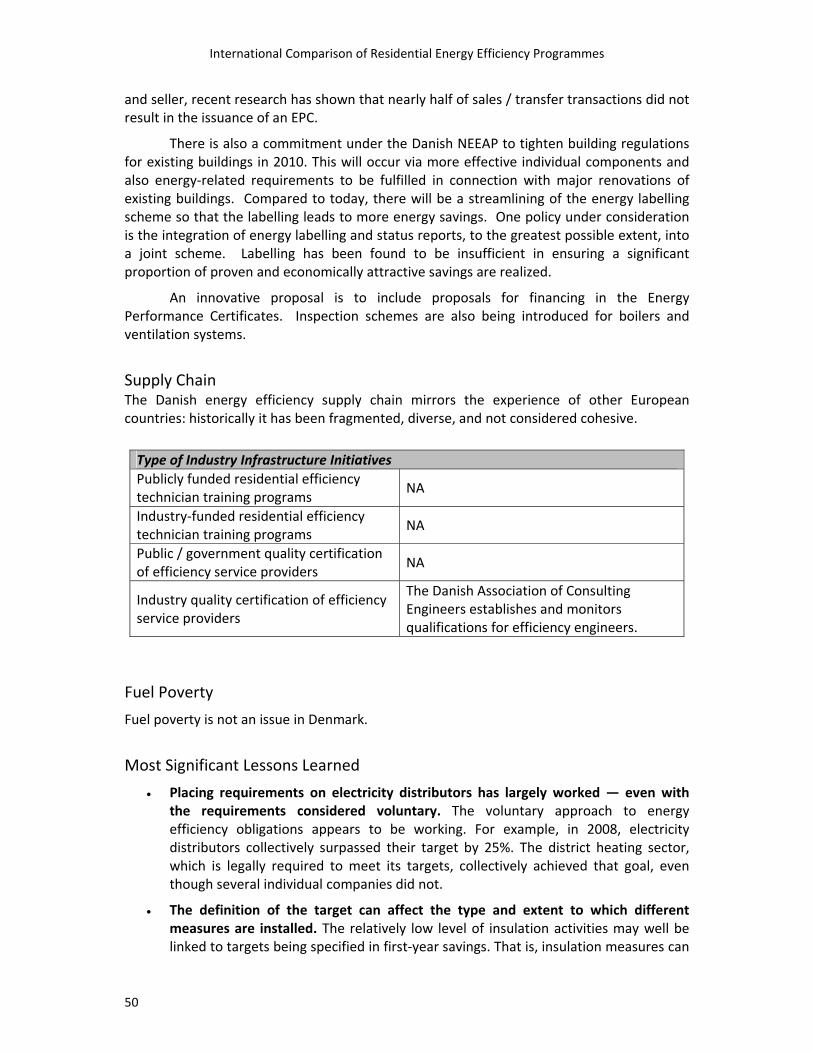
• Supply Chain
• Fuel Poverty
• Significant Lessons Learned
As part of this summary, we offer below a subjective selection of the most significant observations and lessons learned from each of the eleven surveyed countries. A full presentation for each country follows in the main body of the report.
AUSTRALIA
1. Historically, several state / territory and municipal governments have developed residential energy efficiency programmes or assistance, separate from and in addition
A Comparison of Energy Efficiency Programmes for Existing Homes in Eleven Countries
6
to limited federal programmes. Now, increasing national attention is being paid to energy efficiency, and a host of initiatives are slated to commence in 2009‐2010. A 10‐year National Strategy on Energy Efficiency is rolling out energy efficiency nationwide. This anticipates a cap‐and‐trade scheme, which has not yet been enacted.
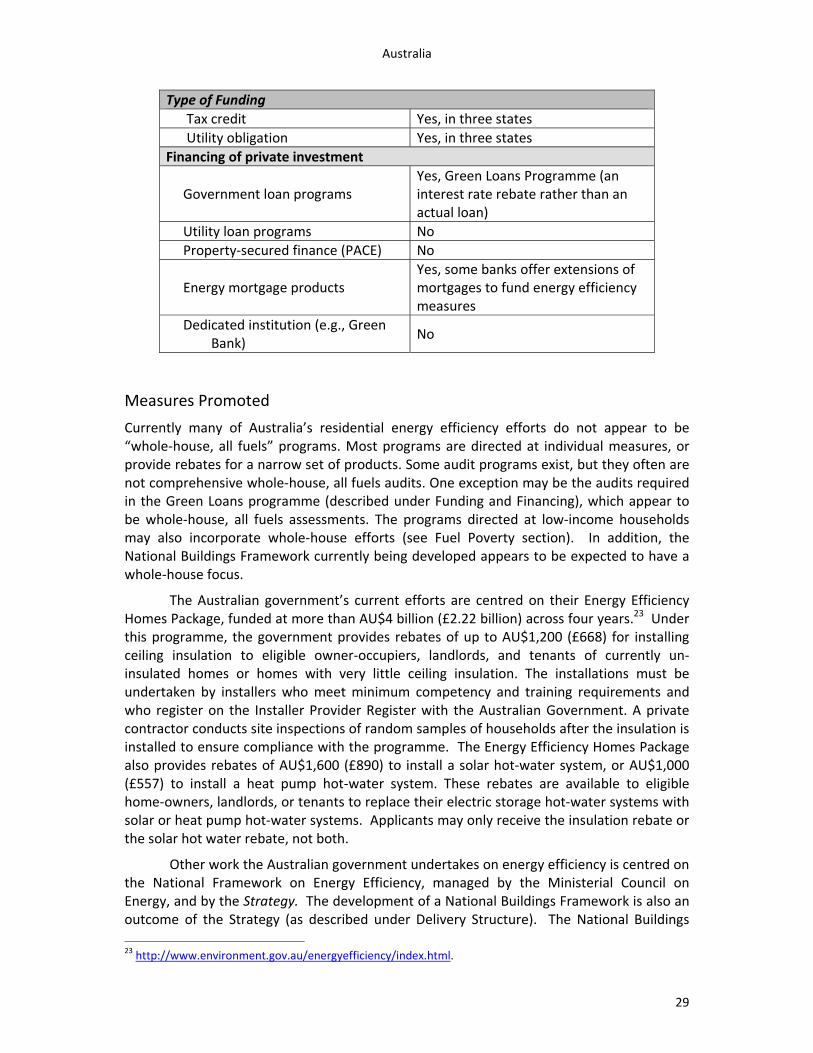
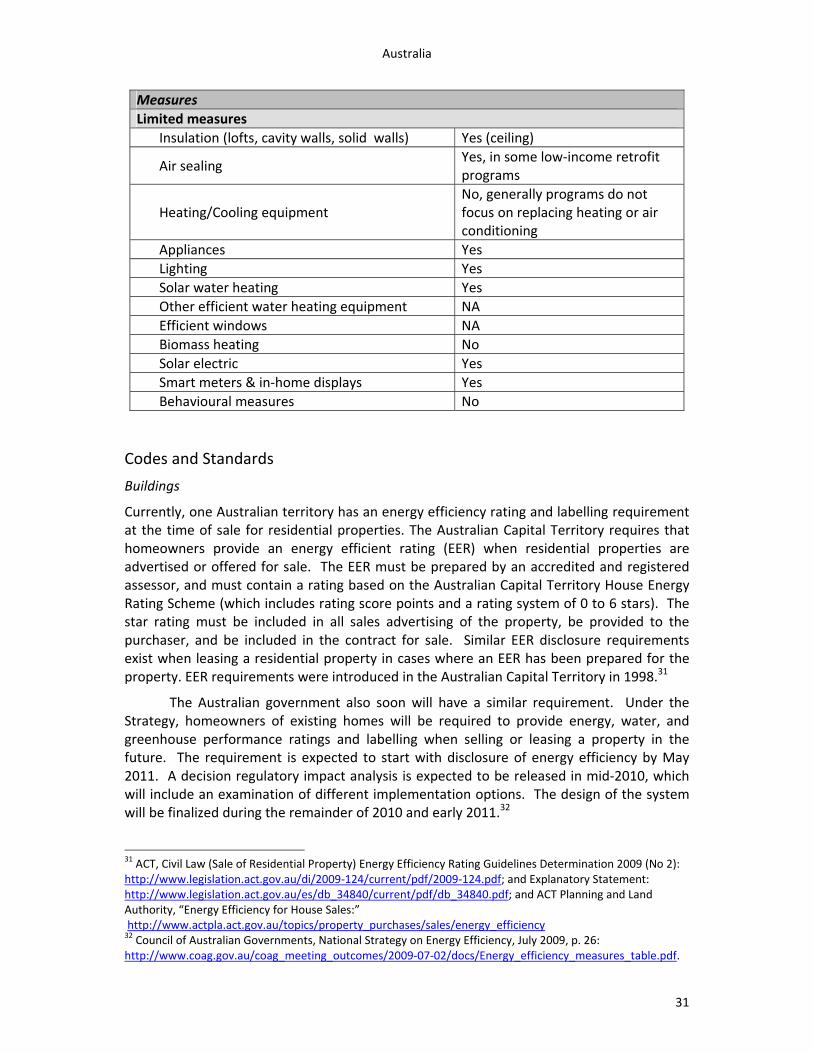
2. Specific to residences, Australia’s various programmes involve or will involve: (1) rebates for installing solar hot‐water panels, hot‐water heat pumps, or ceiling insulation; (2) an enhanced energy efficiency labelling system; (3) expansion of current minimum energy performance standards; (4) a new framework for the disclosure of energy performance information at the time of sale or lease; and (5) development of a smart‐grid energy network, including smart meters in homes.
3. Energy audits and loan subsidies are key features to the realization of these efforts.
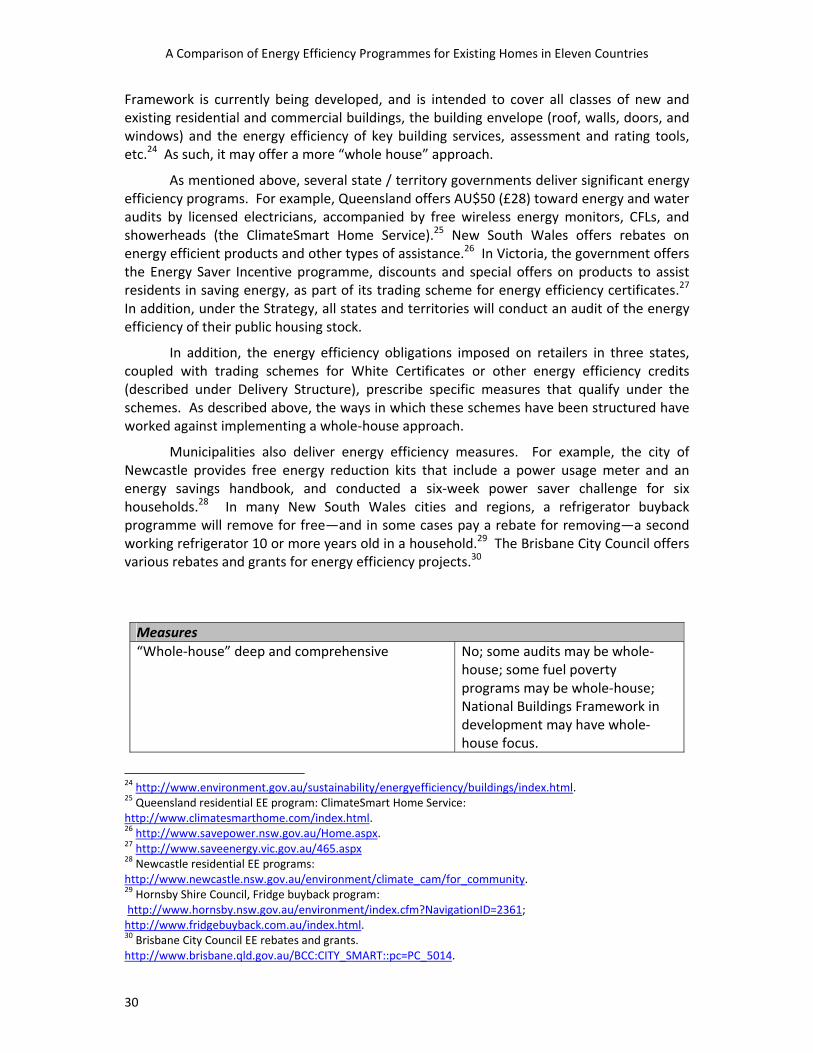
4. Most residential energy efficiency efforts to date do not appear to be “whole‐house, all fuels” programmes. Most are directed at individual measures, or provide rebates for a narrow set of products, with the exception of whole‐house, all‐fuels audits required in the Green Loans programme for low‐income households.
5. A National Buildings Framework is a recent outcome of the Strategy, and is expected to have a comprehensive, whole‐house focus, including building envelope.
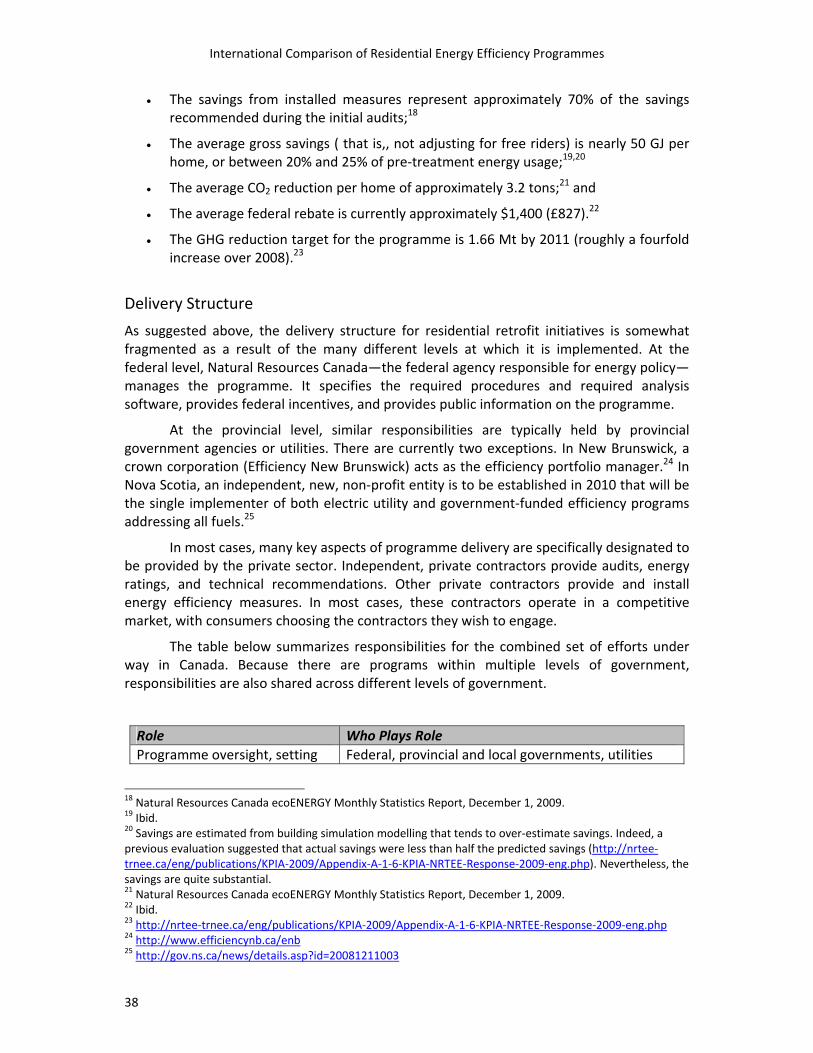
CANADA
1. Canada has a long‐standing voluntary national programme to promote residential efficiency retrofits, based on use of national, standard audit and incentives for recommended measures. Incentives focus on air sealing (draught‐proofing), insulation upgrades (walls, attics, floors, basements, etc.), efficient heating, central cooling, water heating, and ventilation equipment. This platform is built‐upon in a number of variations, by provincial government and utility programmes, typically by adding additional financial incentives. This multi‐tiered approach appears to have been very useful and provided a valuable base level of uniformity across the country.
2. The national framework requires whole house audit and energy rating, both before and after upgrades, by certified energy raters. This approach appears to be very useful and effective, but is relatively costly. The programme initially required audit services to be completely independent of installation services, which had the attribute of objectivity, but created a barrier in moving from analysis to implementation. The need to focus on results (completed upgrades), rather than audits, has led to programme evolution that recognizes the importance of moving from audits to action.
3. Total financial incentives are substantial (up to 50% of the incremental cost of many major measures)
4. More than 70% of homes receiving initial audits are following through with at least some of the recommended retrofit work within 18 months.
5. Many key aspects of programme delivery are provided by the private sector.
6. At the federal level, rebates for retrofit efficiency investments are funded entirely from tax revenues. At the provincial level, funding comes primarily from provincial taxes, municipal taxes, and volumetric charges on electric and / or gas utility bills.
Summary
7
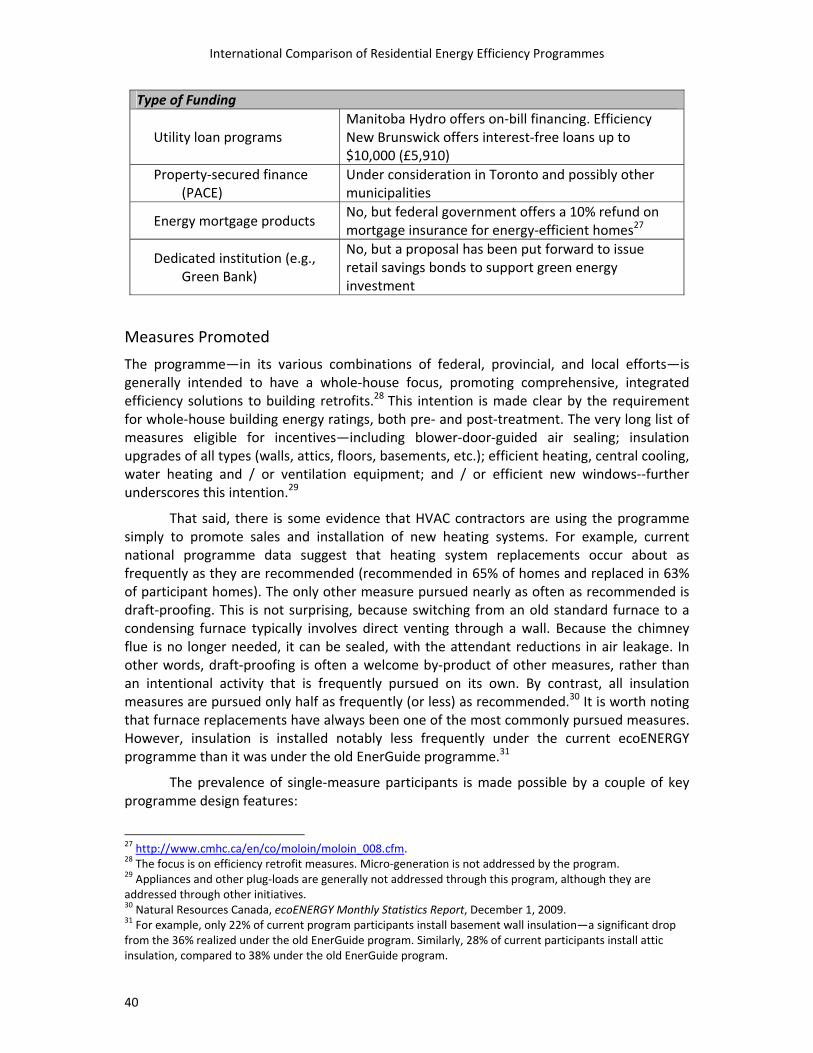
7. There is no federal government loan programme. However, some provinces are offering discounted financing and many portfolio managers are exploring new financing options.
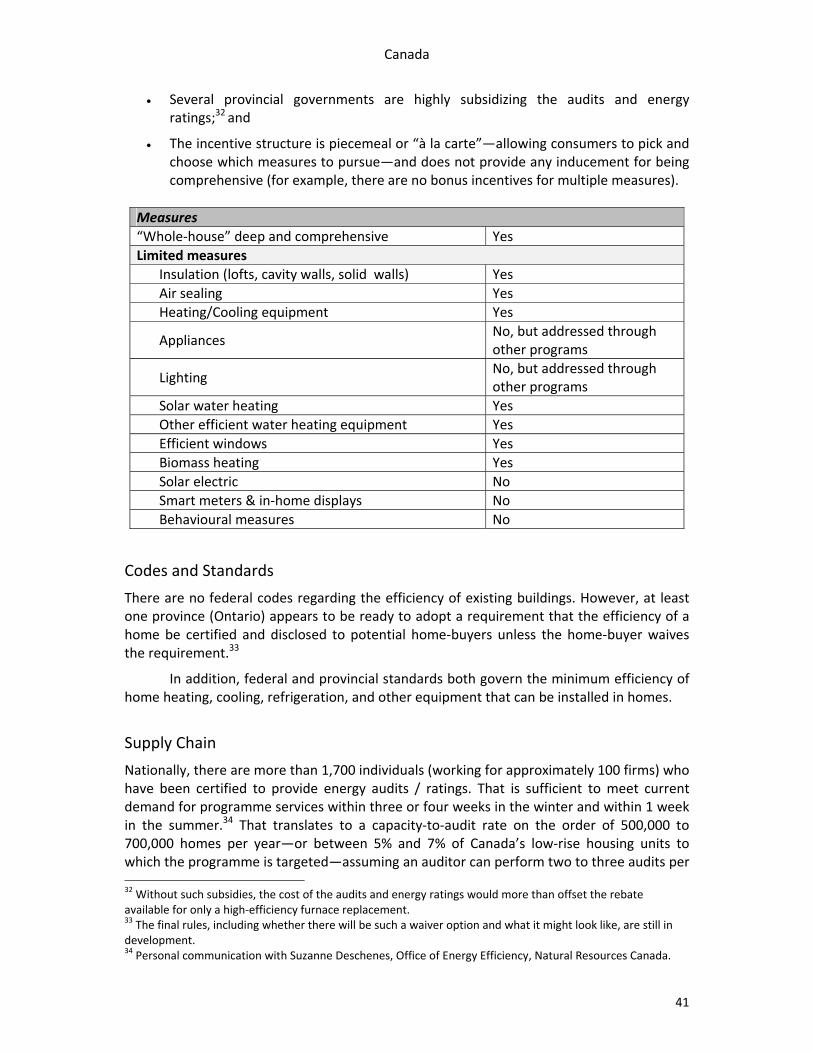
8. The programme—in its various combinations of federal, provincial, and local efforts—is generally intended to have a whole‐house focus, promoting comprehensive, integrated efficiency solutions to building retrofits.
9. There are no federal codes regarding the efficiency of existing buildings. Both federal and provincial standards govern the minimum efficiency of home heating, cooling, refrigeration, and other equipment that can be installed in homes.
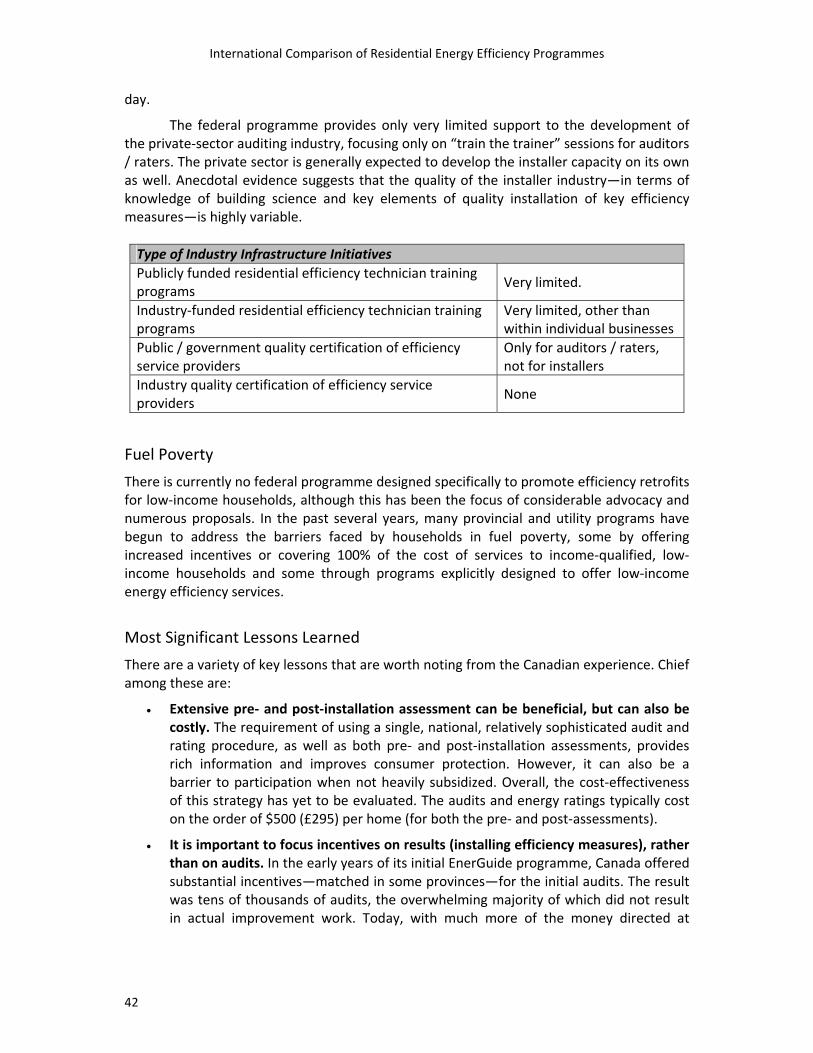
10. The private sector is generally expected to develop the installer capacity on its own. However, anecdotal evidence suggests that the quality of the installer industry—in terms of knowledge of building science and key elements of quality installation of key efficiency measures—is highly variable.
11. There is currently no federal programme designed specifically to promote efficiency retrofits for low‐income households, although this has been the focus of considerable advocacy and numerous proposals.
12. Experience suggests that financial incentives for individual measures can undermine objectives of comprehensive, multi‐measure upgrades.
DENMARK
1. Denmark, although a fairly small country within the EU‐27, has long been a pioneer within the field of energy efficiency. Its pioneering efforts in building regulatory requirements for new and existing buildings, and the introduction of energy performance certificates for buildings, have been exemplary.
2. Denmark envisions a society that is independent of fossil fuels. The two most important policies intended to achieve this vision are requirements: (1) on the electricity, gas, oil, and district heating companies to save approximately 40% of current energy use, and (2) to make improvements to the existing building stock, amounting to 25% savings from tighter regulations on renovations or replacement equipment, and greater promotion of building energy labels.
3. The responsibility for meeting energy efficiency targets in Denmark is primarily on the electricity and gas suppliers. Danish electricity, gas, and oil distributors, as well as heat distributors are subject to annual energy saving targets in the period 2006 ‐ 2013. In 2008 savings were 50% industry and commerce, 8% public sector, and 42% residential.
4. Placing requirements on electricity distributors appears to have been effective—even with the requirements considered voluntary. For example, in 2008, electricity distributors collectively surpassed their target by 25%.
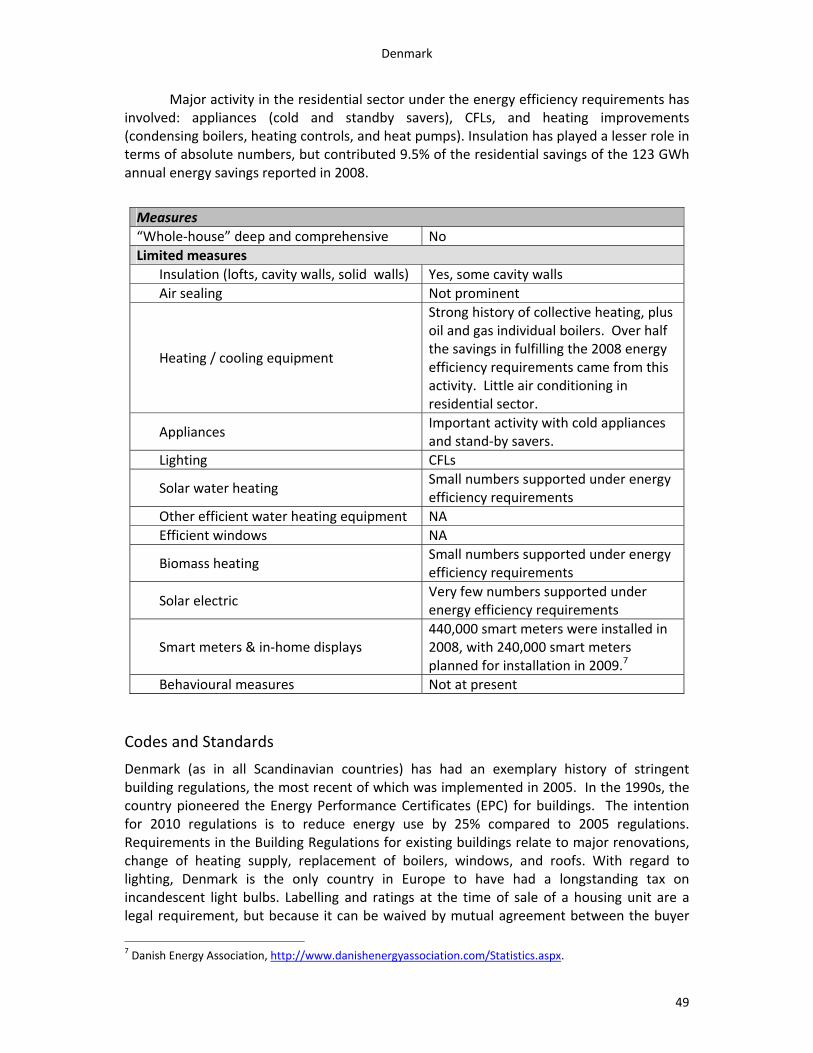
5. Major activity in the residential sector under the energy efficiency requirements has focused largely on individual measures, with no “whole house” retrofit strategy. Individual measures include appliances, lighting, and heating equipment. Insulation has played a lesser role in terms of absolute numbers, but contributed 9.5% of the residential savings in 2008.
A Comparison of Energy Efficiency Programmes for Existing Homes in Eleven Countries
8
6. It has been observed that the definition of the target can affect the type and extent to which different measures are installed. The relatively low level of insulation activities may well be linked to targets being specified in first‐year savings. That is, insulation measures can save energy and carbon dioxide for at least 30 to 40 years, but because the savings accruing to the target are registered only for the first year, there is little target‐related reason to install insulation relative to other less‐expensive measures.
7. Denmark’s experience with building rating and labelling (Energy Performance Certificates ‐ EPCs) is valuable, since it is the European country with the longest history of issuing EPCs. The certificate mechanism offers significant potential, but it has had limited effect to date in affecting the efficiency of existing homes. Indeed, the government has concluded that labelling the energy consumption of homes has been found to be insufficient to ensure that a significant proportion of the proven and economically attractive savings are realized. The fact that Denmark’s EPC mechanism is to be revised should be of considerable interest. Perhaps the key question is whether and when it may be necessary to adopt energy improvement requirements linked to the issuance of EPCs.
8. Denmark’s experience also suggests that monitoring how well energy efficiency policies and requirements are being met is very important.
FRANCE
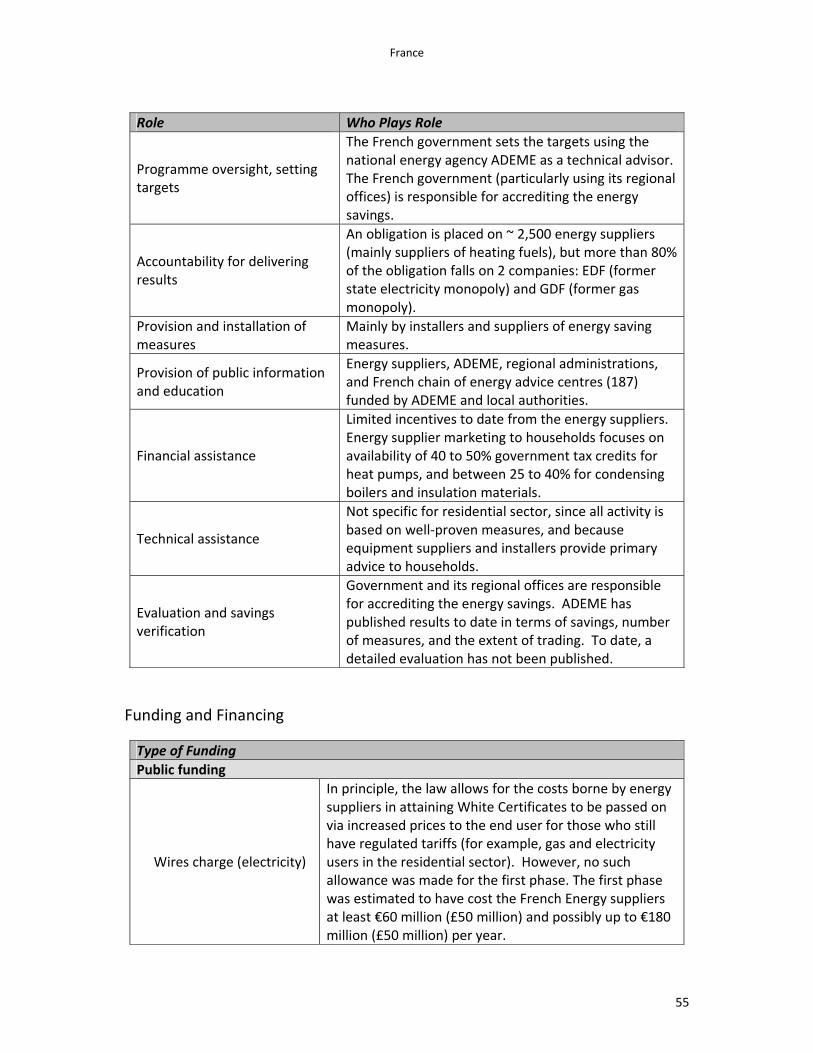
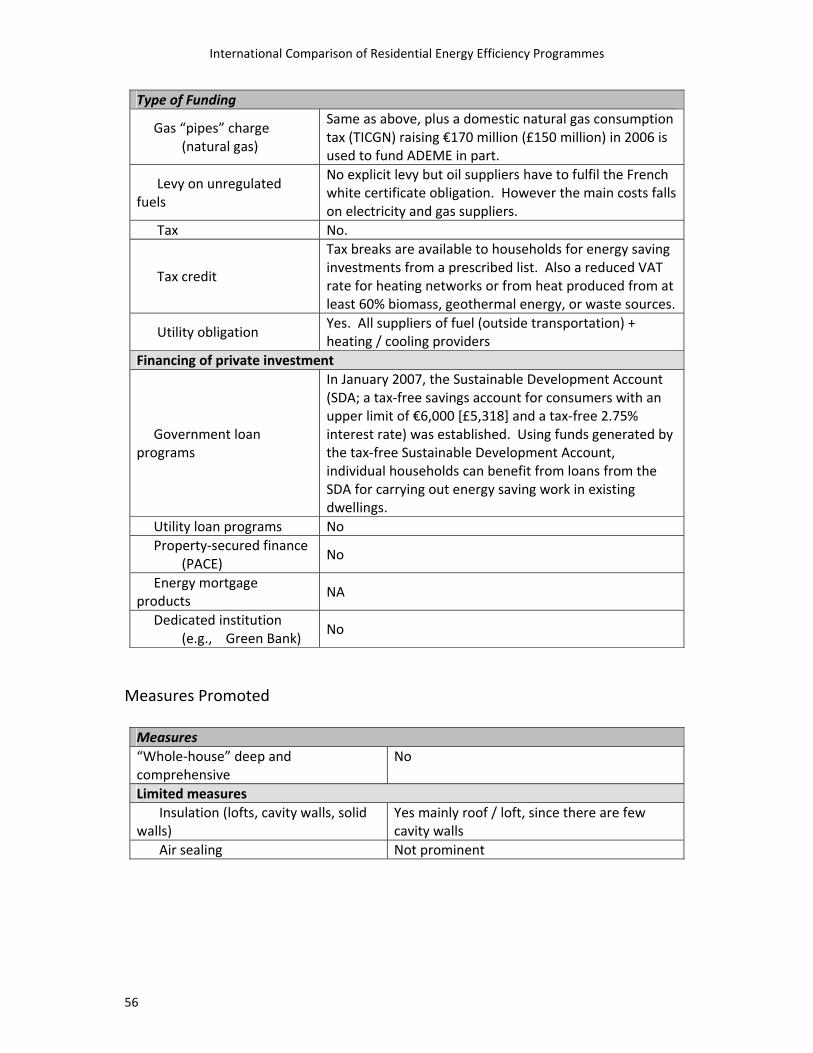
1. The main policy tools relating to energy efficiency in the residential sector are building regulations, tax breaks for expenditure on energy efficiency measures, and the French White Certificate scheme (French National Energy Efficiency Action Plan).
2. The French White Certificates have been in place since July 2006. It places an obligation on suppliers of electricity, gas, and other domestic fuels to save energy. White Certificates are a key part of the French policy to reduce energy intensity by 2% per year until 2015 and then by 2.5% until 2030. It particularly is designed to focus on the more diffuse potentials of energy savings in the residential and tertiary sectors, and was intended to provide a new means of financing energy efficiency projects in these sectors. The initial target was exceeded by 20% and although energy can be saved in any end use sector, over 91% was saved in the residential sector.
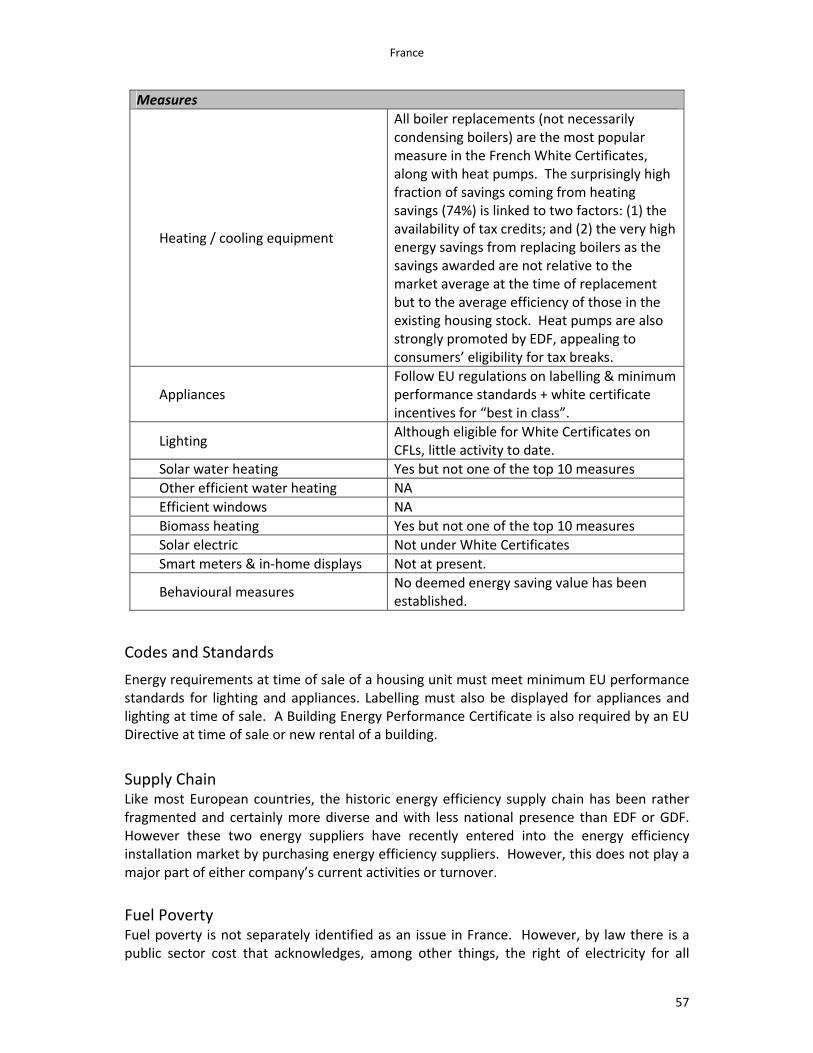
3. Boiler replacements are the most popular measure in the French White Certificates, along with heat pumps; a surprisingly high fraction of claimed savings comes from heating savings (74%). The dominance of heating measures is certainly in marked contrast to the experience in the other two European countries that rely largely on significant utility obligations (Italy and the United Kingdom). This appears to reflect both the high deemed energy saving value of the measure compared to other countries, and the fact that boiler purchases are handled differently from all other market purchases in the French White Certificates.
4. The French White Certificate strategy appears to have been successful—but only up to a point. The White Certificate scheme has been successful in that it has exceeded its targets and is believed to have done so at less cost than was originally assumed by the French government. However, there are certain weaknesses relating to the rules governing the way that White Certificates are restricted to third parties, and the
Summary
9
resulting bias toward energy efficient heating improvements. It also does not appear to promote air sealing or comprehensive treatment of homes.
5. It is possible to buy or sell certificates, but the volume traded has been very low (less than 4% of certificates). The average market price has been 0.32 euro cents / kWh cumac, which is well below the penalty price of 2 euro cents / kWh. The sellers have been mainly eligible parties such as local authorities and some companies. EDF has said that it will not use the market and such a statement from a large obligated party appears to have affected the French marketplace which has developed even more slowly than the Italian one.
6. Other financial strategies include: (1) Since January 2005 a tax credit is available for the costs associated with improving the energy efficiency of the main residence and using renewable energy sources and (2) the Sustainable Development Account, a tax free savings account for consumers with an upper limit of €6,000 (£5,320) and a 2.75% interest rate free of tax. Individual households can carry out energy saving work in existing dwellings using funds from their tax‐free Sustainable Development Account.
7. The existing policies and programmes do not address the normal retail outlet to households for energy efficient measures such as lighting and appliances are not being used to the maximum effect. As the first phase of the White Certificates explicitly forbade non‐obligated parties from increasing their sales through promotion of energy efficiency measures, these routes have not been used to the same extent as they are in the United Kingdom, for example.
GERMANY 1. Germany has a range of policies and programmes that operate on different levels. State
governments bear the responsibility for the implementation of the federal law, but they can also implement their own energy policies and programmes. Both state governments and municipalities offer a range of programmes, with a particular emphasis on financing and grants for a large range of measures to improve energy efficiency.
2. Germany’s building stock is seen as already relatively efficient, primarily because it is comparatively new and many buildings in the eastern part have been abandoned because of the migration of the population from the East to the West. With strong codes for new construction, most future energy saving is envisaged as coming from the existing housing stock.
3. The central strategy for achieving carbon reduction in existing buildings is through continuation of the successful low‐interest loan programmes for energy efficiency investments run by the Kreditanstalt für Wiederaufbau (KfW) development loan bank. These loans go hand‐in‐glove with tailored advice for households, particularly from the Federation of German Consumer Organizations. This has developed into the largest financing programme in Europe, known as the “Energy Efficient Construction and Rehabilitation” programme. It is divided into four sub‐programmes: “CO2 Building Rehabilitation,” which targets buildings constructed before 1983; “Housing Modernization”; “Ecological Construction”; and the “Infrastructure Programme.” Under the Housing Modernization programme, an additional ECO‐Plus sub‐programme allows replacement of heating systems and windows, thermal insulation of the exterior walls of
A Comparison of Energy Efficiency Programmes for Existing Homes in Eleven Countries
10
buildings. Homeowners can borrow up to the maximum loan amount available‐‐€50,000 (£44,300) per housing unit for qualifying measures.
4. In 2008, €5.6 billion (£4.9 billion) was committed by KfW in loans for residential energy efficiency construction and retrofits. Hundreds of thousands of households received assistance.
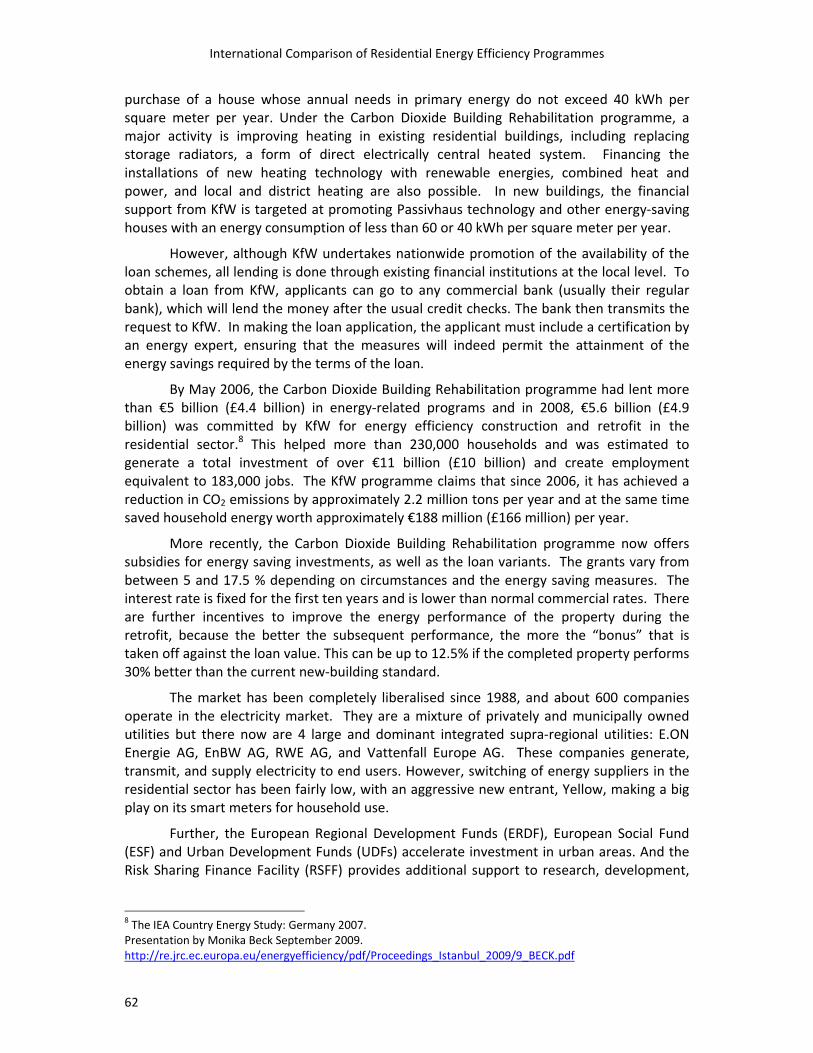
5. In 2007, Germany announced it would dedicate €3 billion (£2.66 billion) in energy efficiency technologies. Owners of dwellings receive a federal grant if they are given on‐site analysis and recommendations by professional experts on potential energy conservation measures. KfW has also recently introduced subsidies for energy‐saving investments; they range from 5 to 17.5%, depending on circumstances and the expected energy savings.
6. The national “Energy Efficiency Ordinance” sets standards for increasing efficiency performance of existing buildings by 30%. The types of energy‐efficient projects eligible for financing and grants vary from one programme to another, but requirements of the Federal Energy Conservation Ordinance must always be met.
7. Although KfW undertakes nationwide promotion of the availability of the loan schemes, all lending is done through existing financial institutions at the local level. To obtain a loan from KfW, applicants can go to any commercial bank (usually their regular bank), which will lend the money after the usual credit checks.
8. The CO2 Building Modernization Programme, launched in 2001, designed to reduce CO2 in existing buildings “more quickly and more thoroughly” appears to support deep, comprehensive retrofits as opposed to individual measures. German researchers have suggested that comprehensive retrofitting of existing buildings to Passiv Haus standards is possible and would result on average in a reduction of 65% of their energy use.
9. Although the KfW programme is rightly lauded as a success, there is some question about whether it will be an effective model to reach enough of the population quickly enough to meet climate goals. The 230,000 homes improved each year in Germany is still a modest number, compared to the more than 20 million households in Germany that KfW estimates needs to be tackled to reach climate goals.
ITALY
1. The primary policy tools to deliver most of the energy savings expected in the residential sector by 2016 are related to government subsidies, tax incentives and energy efficiency obligations (the Italian White Certificates).
2. The two most significant measures expected to produce savings in existing homes by 2016 are incentives to install efficient heating systems and insulation of pre‐1980 buildings.
3. Italian White Certificates have been in place in Italy since January 2005. They are an obligation on electricity and gas distributors to save energy in the properties and premises to which they distribute. The Italian government has set the size of the obligation, and in the Italian National Plan, it is expected that one‐third of the expected carbon dioxide savings by 2012 will come from the White Certificate activities.
Summary
11
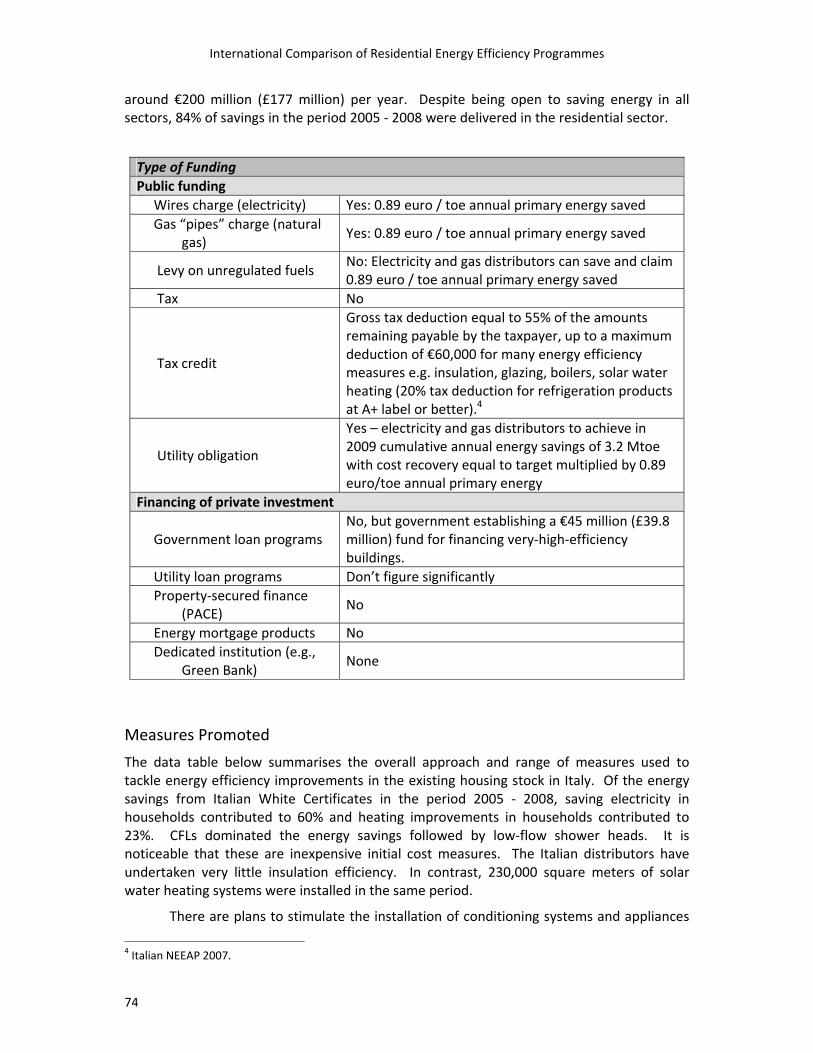
4. The income tax breaks are significant and are available for insulation, boilers, heating distributions systems, solar hot water, windows and even appliances. Depending on the measure, gross tax deductions up to 55% of the amounts remaining payable by the taxpayer, up to a maximum deduction of €60,000 (£53,220), are available for qualifying measures.
5. The National Network of Local Agencies and the Agency for Environment Protection and Technical Services are responsible for activities concerning the information, communication, and education campaign to support energy end‐use efficiency and renewable energy.
6. Annual expenditure on White Certificates in 2008 is estimated to be around €200 million (£177 million) per year. Despite being open to saving energy in all sectors, 84% of savings in the period 2005 ‐ 2008 were delivered in the residential sector. Of the energy savings in households 60% were electric savings and 23%% were from heating system improvements. CFLs dominated the energy savings followed by low‐flow shower heads, with relatively few building envelope improvements.
7. Obligated energy distributors can earn bonus of 5% of technical measure savings by promoting the diffusion of correct and complete information to final customers.
8. After a slow start, the Italian White Certificates have proven to be an effective mechanism for stimulating energy efficiency in the residential sector. Despite being open to saving energy from all end uses, 85% of the energy savings have come from the residential sector. Furthermore, 75% of the savings are from electricity. This reflects both the primary energy nature of the target and the very generous cost recovery from CFLs, which dropped dramatically in price over the initial five‐year period. In the first three years, CFLs contributed to more than half the accredited energy savings).
9. In 2008, the regulator (AEEG) forced disclosure of the energy‐saving measure prices for bilateral contracts between the obligated distributors and third parties; this increased the transparency of costs to the regulator. Furthermore, AEEG subsequently revised the deemed energy savings for some measures and the way that the cost recovery mechanism was calculated. The combined effect was that there was greater trading of White Certificates, and the price of them came more into line with the cost recovery price.
10. The trading market is functioning much better. In 2007, 304,932 certificates were traded on the spot market, and 556,742 certificates were traded bilaterally.
11. There remain issues regarding additionality, as White Certificates, financial incentives, and tax breaks are all contributing to the energy saving measures;
12. The current programme counts savings only for five to eight years, depending on the measure. This may create problems with long‐term measures—for example, insulation measures can save energy and carbon dioxide for at least 30 to 40 years, but they are not awarded their full benefits over this term.
JAPAN
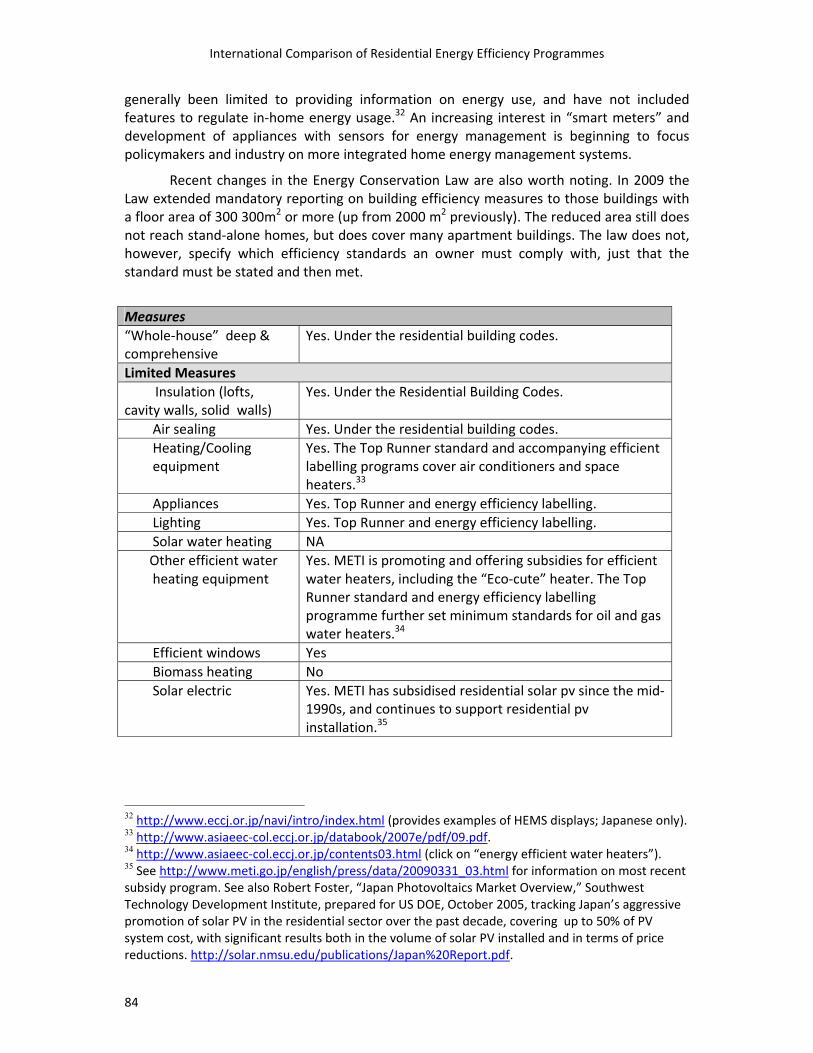
1. Japan’s efforts to improve the efficiency of existing homes rely on a network of laws and incentives promoting energy efficiency. The foundation for many of the residential
A Comparison of Energy Efficiency Programmes for Existing Homes in Eleven Countries
12
efficiency programmes in Japan is the Law Concerning the Rational Use of Energy (commonly referred to as Japan’s “Energy Conservation Law”). The Energy Conservation Law requires owners of residential buildings with a floor area exceeding 300 square meters to report to local authorities on the energy conservation measures they have undertaken. This is important for multi‐unit buildings, but does not address individual homes.
2. Local authorities have the power to issue “improvement orders,” publish the names of parties not in compliance with the Energy Conservation Law, and impose fines of up to JPY 1 million. Many local governments also incentivise compliance with building energy standards by offering subsidies, preferential interest rates, and even relaxed zoning regulations for buildings that comply with specified energy standards.
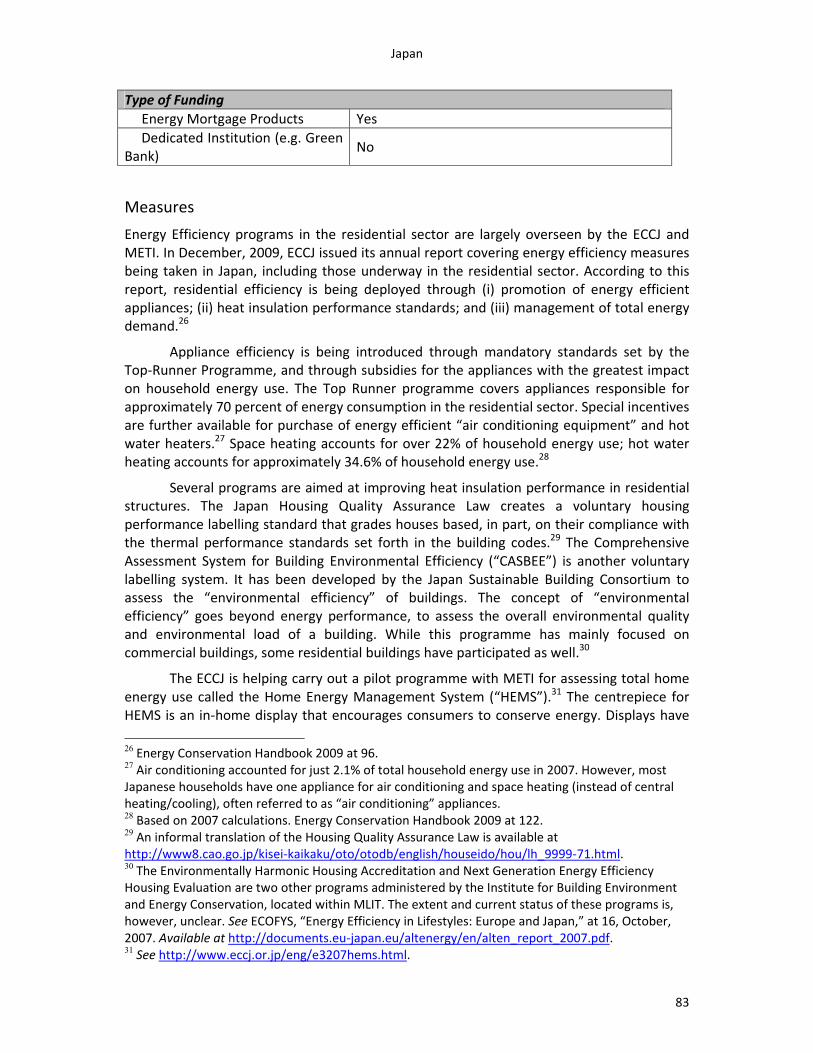
3. In Japan, government financial support for energy efficiency in existing homes is available through several programmes. These include support for retrofitting existing homes and subsidies for the purchases of some of the most energy‐intensive household appliances, including air conditioners, space heaters, and hot water heaters. The government’s “Flat 35” programme offers long‐term, low interest financing for purchasing homes that meet certain criteria, with preferential rates for homes that comply with the newest 1999 standards.
4. Japan has achieved significant improvements in energy efficiency in its residential housing sector over the past several decades, largely though a focus on developing and deploying more efficient equipment and appliances. Just since 1998, household cooling and heating air conditioners have become about 34% more efficient.
5. An unusual challenge to improving efficiency in existing homes arises from the short lifespan of the typical Japanese home. The average lifespan of a new Japanese home is about 30 years, and has been linked to a lack of attention to quality in construction. It also reduces any motivation for introducing retrofits, as there may not be enough time for a homeowner to recover the cost of introducing efficiency measures. The government’s Basic Programme for Housing is working to expand the typical life of new residential construction to 40 years by 2015. Yet this will only address part of the problem. While Japan’s residential codes remain voluntary, there is limited drive to implement whole‐house efficiency measures even with longer lasting homes.
6. The residential sector continues to play an important role in Japan’s national energy goals, as well as in the country’s domestic and international climate change mitigation goals. Under the Kyoto Protocol, Japan has committed to reducing its greenhouse gas emissions to 6% below 1990 levels by 2012. Yet from 1990 to 2008, energy use in the residential sector in Japan increased by 10.8%. The Japanese government recognizes the need to continue cutting energy consumption in its residential sector, and is continuing to develop policies to meet this challenge.
THE NETHERLANDS
1. In January 2008 the Dutch government, the social housing providers, the energy utilities, and the construction industry signed a covenant called Meer met Minder (More with Less), a mechanism for working together to achieve energy savings in buildings. The goal was 100 pJ in additional energy savings by 2020. Of this target, 76% is in the residential
Summary
13
sector, with 43% owner‐occupied housing units, 24% social rental units, and 9% privately rented.
2. More with Less set an ambitious goal of achieving 16 pJ by 2011, by insulating 500,000 residences and other buildings to either Label B standard of the Energy Performance Certificate, or with improvement of at least two label steps in the EPC. While the overall targets and milestones were agreed upon, there was less clarity about the responsibilities of the relevant government departments and the key players. Discussions are still ongoing among the various partners on financing and execution. Progress has been so slow that the government is now actively considering reorganizing the Programme Office for More with Less. Members of the Dutch Parliament are advocating either regulation or energy efficiency obligations to be introduced.
3. The slow progress most likely is an outcome of trying to administer a programme that offers less‐than‐generous incentives for some of the players. Housing corporations investing in energy efficiency are offered effectively an 11% tax discount; households, which typically can obtain loans at 10% for energy‐saving measures, are now offered loans at 9% interest. Beginning July 2009, a package of new initiatives was introduced, offering a subsidy of up to €200 (£177) for energy analyses and advice to households, a 20% subsidy of the total cost of superglazing windows, and a VAT reduction from 19% to 16% for insulation measures. All of these measures are funded by the government. In addition, a very complicated subsidy scheme now exists whereby if you achieve 20% savings or one EPC label improvement, you are eligible for €300 (£266). For a 30% savings or two steps in label improvement, you are eligible for €750 (£665). However, the lack of widespread building energy labels is another barrier to progress.
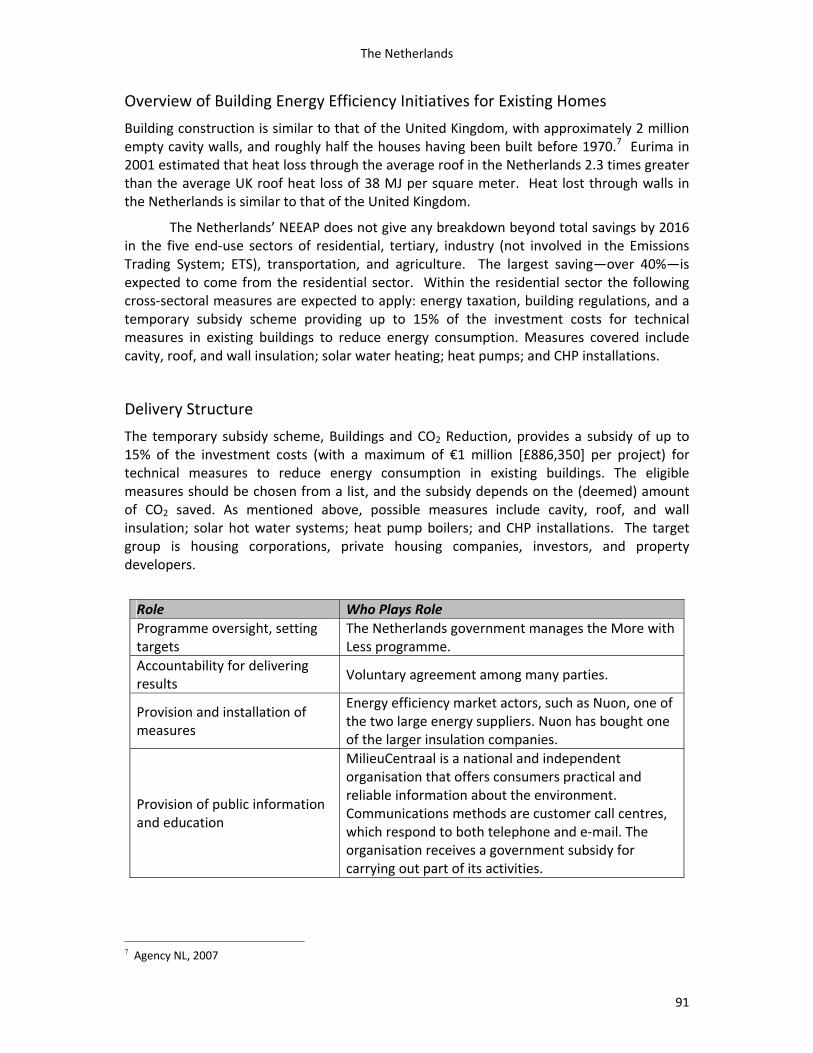
4. Plans for meeting energy savings goals in the Netherlands anticipate the largest saving—over 40%—will come from the residential sector. Within the residential sector the following cross‐sectoral measures are expected to apply: energy taxation, building regulations, and a temporary subsidy scheme providing up to 15% of the investment costs for technical measures in existing buildings to reduce energy consumption. Measures covered include cavity, roof, and wall insulation; solar water heating; heat pumps; and CHP installations.
5. The temporary subsidy scheme, Buildings and CO2 Reduction, provides a subsidy of up to 15% of the investment costs (with a maximum of €1 million [£886,350] per project) for technical measures to reduce energy consumption in existing buildings. The eligible measures should be chosen from a list, and the subsidy depends on the (deemed) amount of CO2 saved. As mentioned above, eligible measures include cavity, roof, and wall insulation; solar hot water systems; heat pump boilers; and CHP installations. The target group is housing corporations, private housing companies, investors, and property developers.
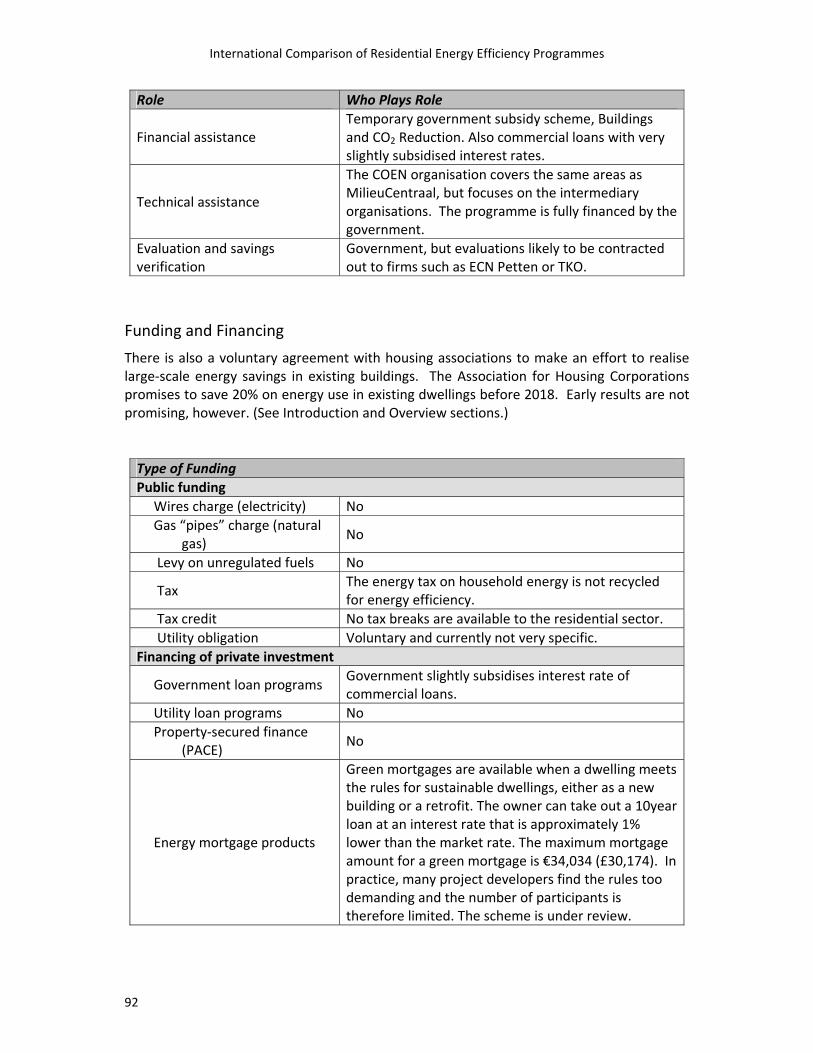
6. Green mortgages are available when a dwelling meets the rules for sustainable dwellings, either as a new building or a retrofit. The owner can take out a 10year loan at an interest rate that is approximately 1% lower than the market rate. The maximum mortgage amount for a green mortgage is €34,034 (£30,174). In practice, many project developers find the rules too demanding and the number of participants is therefore limited. The scheme is under review.
A Comparison of Energy Efficiency Programmes for Existing Homes in Eleven Countries
14
7. A Green Funds Scheme (GFS, established 1995) is a tax incentive scheme enabling individual investors to put money into green projects that benefit nature and the environment. Since the scheme was launched, 200,000 investors have put up €5 billion (£4.4 billion), funding 5,000 green projects. The government plans to make the GFS better suited to projects in the built environment.
8. The government’s low‐income scheme, TELI, is focused on overcoming the information and monetary barriers to energy saving measures in low‐income households. The scheme subsidizes energy audits and projects carried out by local authorities, energy companies, and housing corporations. The measures covered include water‐saving shower heads, CFLs, and insulation of pipes.
9. Voluntary collaboration among market actors has not been as effective as hoped. It was hoped that the voluntary collaboration among the Dutch government, the energy suppliers, the housing corporations, and the construction industry would deliver significant energy savings in the residential sector. This has not turned out to be the case and there is a good chance that after the evaluation in 2010, an energy efficiency obligation may be introduced on the energy suppliers.
10. Modest incentives do not appear to have attracted sufficient consumer attention. The very modest financial incentives that the Dutch government has offered to date appear to have had little impact and explain why the Dutch Parliament is keen to move to either regulation or energy efficiency obligations. This lack of energy efficiency uptake when the financial incentives are modest is not unique to the Netherlands, and there is widespread evidence that with current public perception, significant financial incentives are needed to bring about large‐scale activity in energy efficiency.
NORWAY
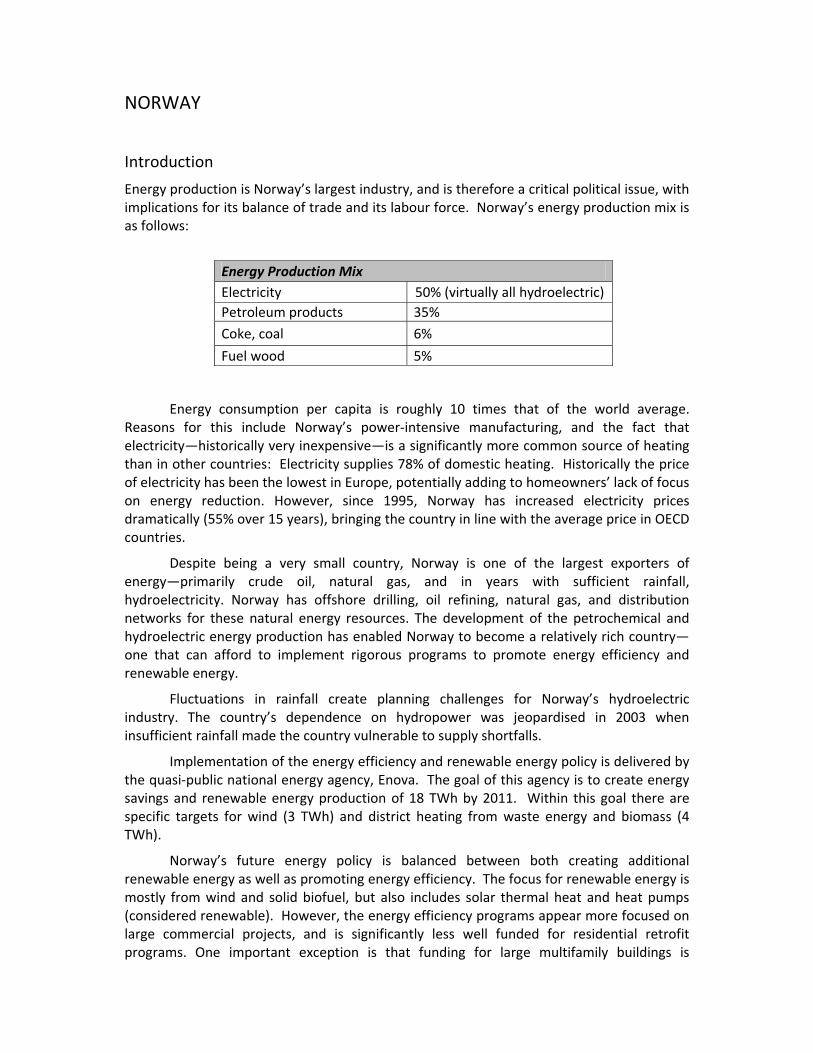
1. Establishing an ambitious goal (carbon neutrality), as Norway has done, elevates the international political discussion. Norway has become significantly more concerned with its CO2 emissions as its refining and petrochemical industry has grown. This industry holds great promise for economic and job growth, but it conflicts with Norway’s serious commitment to Kyoto Protocol goals. While an abundance of hydropower is a big boost, Norway has nonetheless provided leadership in establishing a goal of eventual carbon neutrality. To meet those goals, Norway has a significant national commitment to energy efficiency, despite historically low energy prices.
2. While Norway’s energy policy emphasises a balance of renewable energy and energy efficiency for all sectors, current energy efficiency programmes appear more focused on large commercial projects than on residential retrofit programmes. One important exception is that funding for programmes that address large multifamily buildings is considered a priority. The lower level of residential retrofit funding is explained in part by the fact that residential energy consumption is less than 20% of the country’s total energy use and an extremely small contributor to CO2 emissions. Although refurbishment programmes exist, residential energy efficiency efforts have been more focused on new‐construction codes.
3. Nearly 70% of Norway’s households have multiple sources of heat. If prices rise for any single heating method, another can be used.
Summary
15
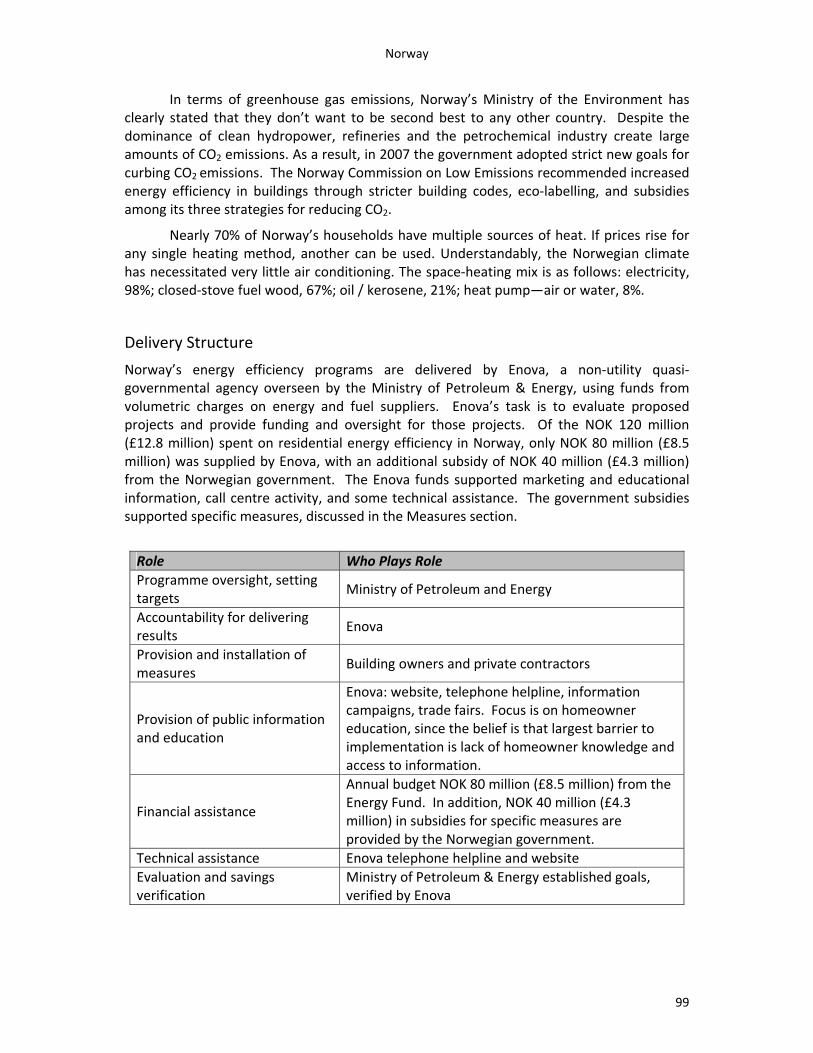
4. Norway’s energy efficiency programmes are delivered by a unique entity established to fulfil this role. This entity, known as Enova, is a non‐utility, quasi‐governmental agency. It is overseen by the Ministry of Petroleum & Energy, using funds from a volumetric levy on electricity and fuel supply as well as government (taxpayer) funds. Enova has long‐term (ten‐year) national energy savings goals and budgets. This demonstrates how the responsibility for efficiency programme implementation can be separated from the revenue source. The government has chosen to have the funds for energy efficiency that are raised from a volumetric levy on utilities and other energy suppliers implemented by a single non‐utility entity. Identified benefits include provision of a consistent, single national programme, administrative efficiency, and avoiding perceived conflicts associated with utility administration.
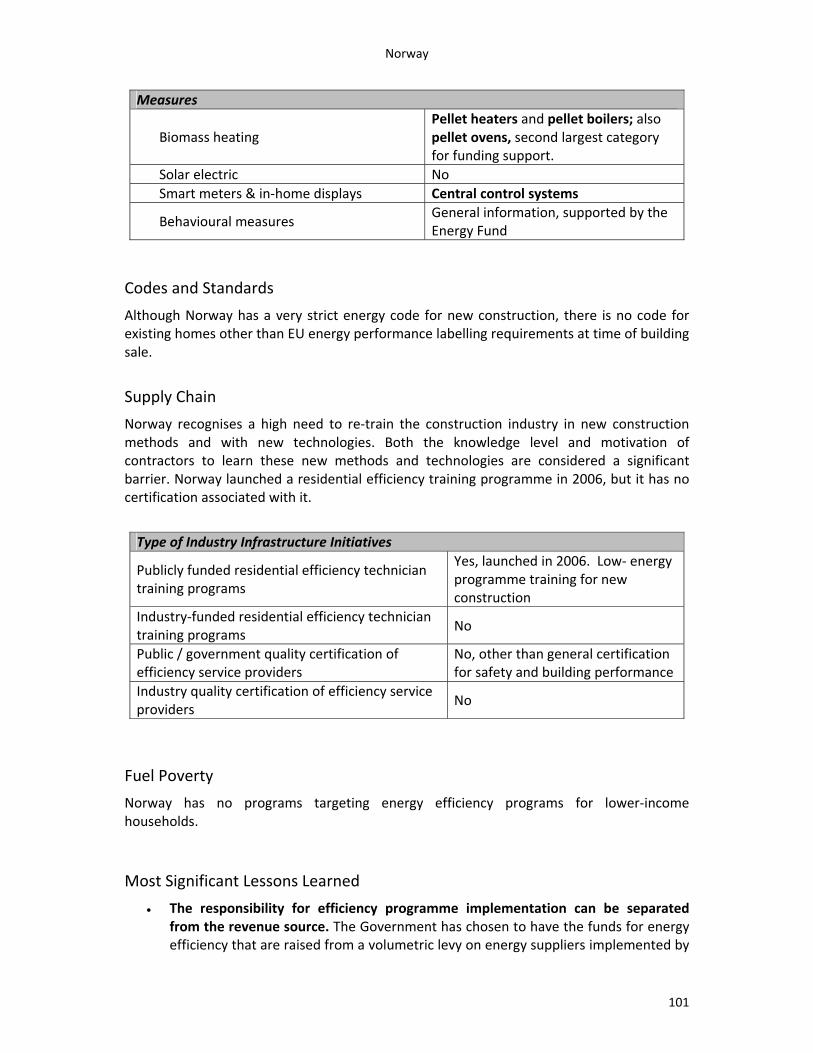
5. Six specific individual measures (pellet boilers, pellet heaters, pellet ovens, heat pumps, heating controls, and solar water heating) are supported by government subsidies. The subsidies range as high as 20% of measure costs, up to a fixed amount, depending on the specific measure.
6. In the mid‐1990s, the government began to increase the price of electricity, in part to motivate consumers to conserve energy. In the last decade Norway has embraced rigorous programmes to promote both energy efficiency and renewable energy. While a relatively small percent of the budget is spent on residential retrofit programmes, the national focus on efficiency and renewables has had a spillover effect on households. The increase in electricity prices is reported to have been especially effective in creating awareness and motivating change in the residential market because of the extremely high use (78%) of electric heat. Although the size of dwelling area has increased, residential energy consumption has declined over the past 10 years. In addition, the more efficient electrical equipment have been effective in adding to this decline in residential energy use.
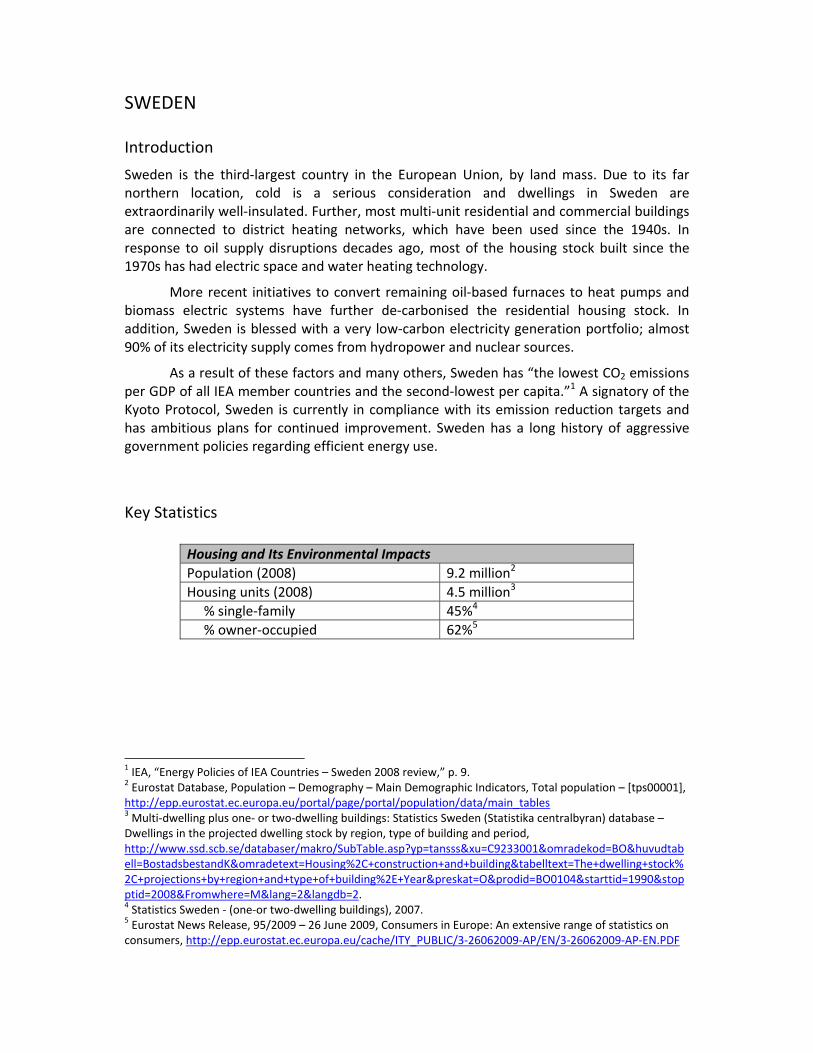
SWEDEN 1. Sweden has a long history of aggressive government policies regarding efficient energy
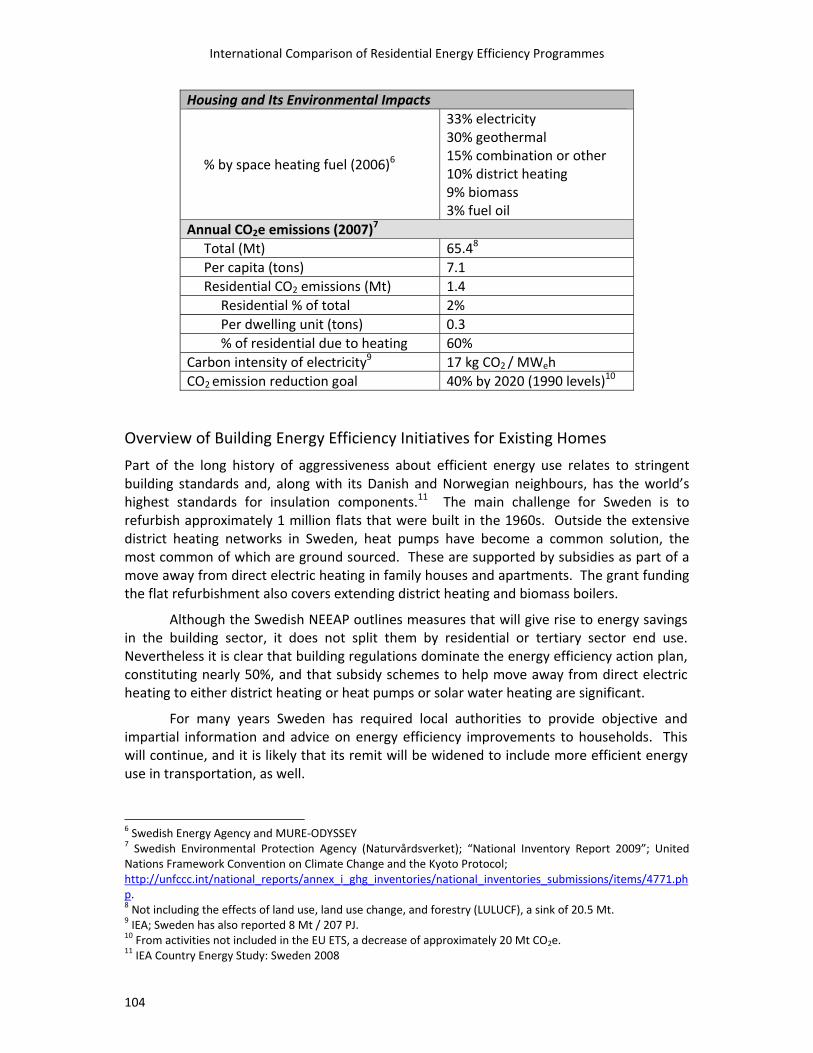
use. These policies, along with extensive use of district heating and an electric supply that is 90% hydropower, results in Sweden having the lowest CO2 emissions per GDP of all IEA member countries, and the second‐lowest emissions per capita.
2. With respect to existing homes, the main challenge for Sweden is to refurbish approximately 1 million flats that were built in the 1960s. Outside the extensive district heating networks in Sweden, heat pumps have become a common solution, the most common of which are ground sourced. These are supported by subsidies as part of a move away from direct electric heating in family houses and apartments. Grant funding for flat refurbishment also covers switching to biomass boilers and extending district heating.
3. The primary strategies to address energy efficiency in existing homes are: (1) extensive availability of information and technical assistance; and (2) subsidy schemes to help move away from direct electric heating to district heating, heat pumps, and / or solar water heating.
A Comparison of Energy Efficiency Programmes for Existing Homes in Eleven Countries
16
4. The national government has provided subsidies for local energy expertise, available to the public for free, for many years. Since 1998, the Swedish Energy Agency has supported a network of Local Energy Advisors (LEA) in all local governments across Sweden. They provide the general public, small companies, and organisations with advice and information on energy efficiency and renewable energy. They are supported by Regional Energy Offices that provide training and coordinate information activities. Along with other training initiatives and a demand for services, the result appears to be a robust energy product and service delivery infrastructure, with consumers having ready access to advice, contractors, and financing.
5. Energy service companies (ESCOs), frequently municipally owned, play an important role in building energy refurbishment in Sweden, including existing residences. The success of the ESCO model has taken much time and considerable assistance.
6. Efficiency is supported and funded through a general energy tax (on most fuels, based on their energy content) a carbon dioxide tax, a sulphur tax, and a levy on NOx. Government grants are provided for a wide range of measures, including solar heating, conversion of domestic heating systems, and window replacement, as well as for whole‐house deep retrofits. There is also a programme for local authorities to make grants available for long term investments intended to reduce greenhouse gas emissions.
7. Sweden’s integrated portfolio of policies and measures has yielded considerable success. Labelling requirements, regular compulsory heating and ventilation system inspections, and financial incentives for refurbishing home space and hot water heating systems have all contributed to this success. The suite of taxes and extraordinary level of subsidies make Sweden unique, but they have also fostered conditions favourable for undertaking energy efficiency measures in buildings.
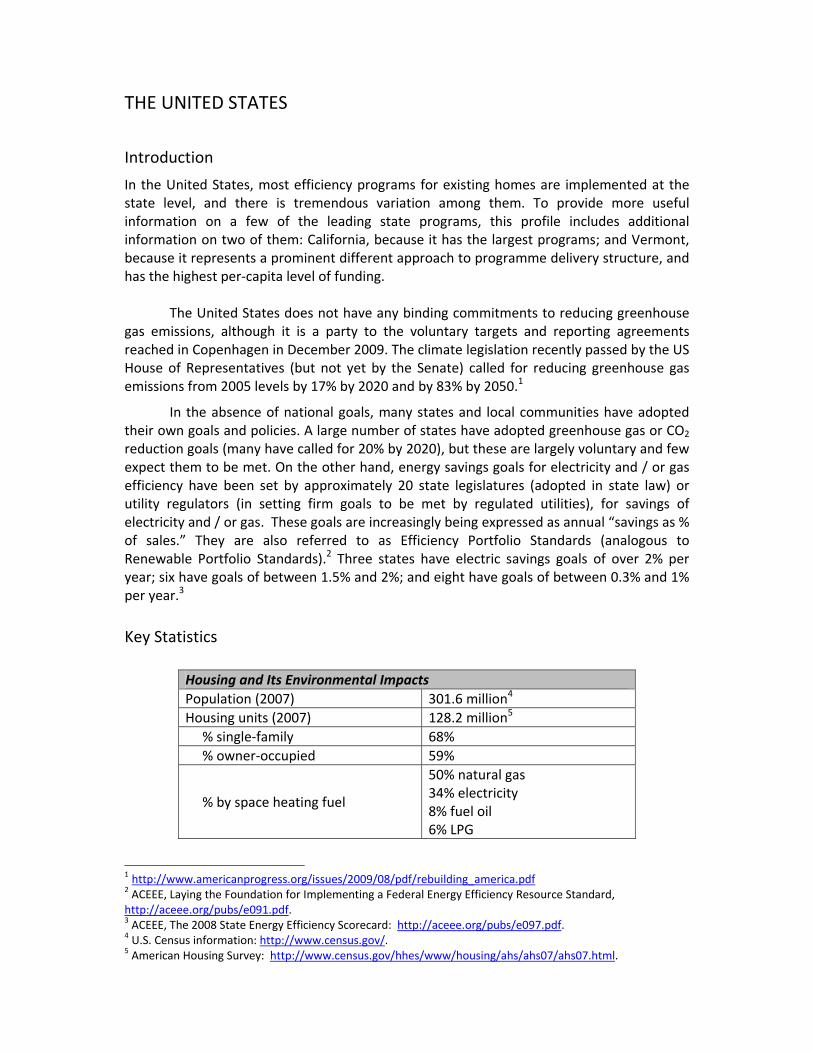
THE UNITED STATES 1. In the United States, most efficiency programmes for existing homes are implemented at
the state level, and there is tremendous variation among them. A significant number of states have adopted greenhouse gas or CO2 reduction goals (many have called for 20% by 2020), but these are largely voluntary and few expect them to be met. On the other hand, energy savings goals for electricity and / or gas efficiency have been set by approximately 20 state legislatures (adopted in state law) or utility regulators (in setting firm goals to be met by regulated utilities), for savings of electricity and / or gas. These goals are increasingly being expressed as annual “savings as % of sales.” They are also referred to as Efficiency Portfolio Standards (analogous to Renewable Portfolio Standards). Three states have electric savings goals of over 2% per year; six have goals of between 1.5% and 2%; and eight have goals of between 0.3% and 1% per year.
2. Along with being the world leader in energy consumption and carbon dioxide emissions, the United States is also a world leader in energy efficiency programmes, and specifically in programmes for existing homes. Currently, the vast majority of these are carried out at the state level, largely implemented by regulated electric and gas utilities under the supervision of utility regulators. National spending on efficiency programmes in 2008 is estimated to be approximately $3.74 billion, (£2.31 billion), of which 87% was for
Summary
17
electric utility programmes. Of this total, approximately 25% ($932 million; £576 million) was in residential sector programmes, mostly for existing homes.
3. At the national level, the United States currently has three strategies that address energy efficiency in existing homes:
• The national low‐income Weatherization Assistance Program, funded through federal appropriations that have averaged on the order of $100 million (£62 million) to $450 (£278 million) annually, although recently supplemented with $4.7 billion of one‐time economic American Recovery and Reinvesment Act funds early in 2009. The programme is administered through state agencies that, in turn, subcontract with hundreds of local, community‐based agencies for programme delivery. Income‐eligible households receive whole‐house, comprehensive energy efficiency improvements, at no cost. Measures primarily focus on space and water heating, with an average investment of $6,500 (£4,020) per household. Evaluations have concluded that average savings for gas average 23% of pre‐treatment gas consumption.
• The Home Performance with ENERGY STAR® programme. This is a programme developed and promoted by the federal government and currently implemented in 27 states. It establishes a common set of requirements and a unified brand for local programmes, typically operated by utilities or states. The programme is designed to be delivered by trained and certified private‐sector “Home Performance” contractors. It requires comprehensive, whole‐building analysis, instrumented testing, quality control, and reporting. There are no national financial incentives, but many state and utility programmes offer financial incentives for some or all measures recommended by approved Home Performance contractors.
• Federal tax credits. The government is providing tax credits for the two‐year period (2010‐2011) of up to $1,500 per household for qualifying energy efficiency and renewable energy improvements to existing single‐family homes. These credits are available for insulation, heating and cooling equipment, windows, roofs, solar and wind equipment, and other measures that meet qualifying specifications.
4. It should be noted that at the national level, there have been proposals for nationwide programmes with federal grants and / or loans for efficiency improvements to existing homes. The Obama administration has identified “Recover Through Retrofit” as a priority strategy and proposed a major nationwide programme that would start in 2010 as part of economic recovery efforts. Other such programmes are included in pending climate and energy legislation. A common element of these proposals is providing substantial grants to homeowners for comprehensive energy efficiency upgrades, ranging from 20% to 50% of the cost. All these proposals recognize the need for new financing mechanisms and support to assist homeowners in finding the funds to cover the initial cost of their share of the improvements.
5. At the state and local levels, approximately 30 of the 50 states and the District of Columbia have significant utility or state energy efficiency programmes. Most of these contain specific programmes that address existing homes. The most common are programmes that use the national Home Performance with ENERGY STAR model.
A Comparison of Energy Efficiency Programmes for Existing Homes in Eleven Countries
18
Electric and gas utility ratepayer‐funded programmes typically support training and certification of contractors, provide programme marketing and promotion, and offer financial incentives and / or loans to homeowners. A few states also provide funding (from tax revenues) for low‐income weatherization and / or fossil fuel efficiency programmes. A few also offer tax credits for specific measures.
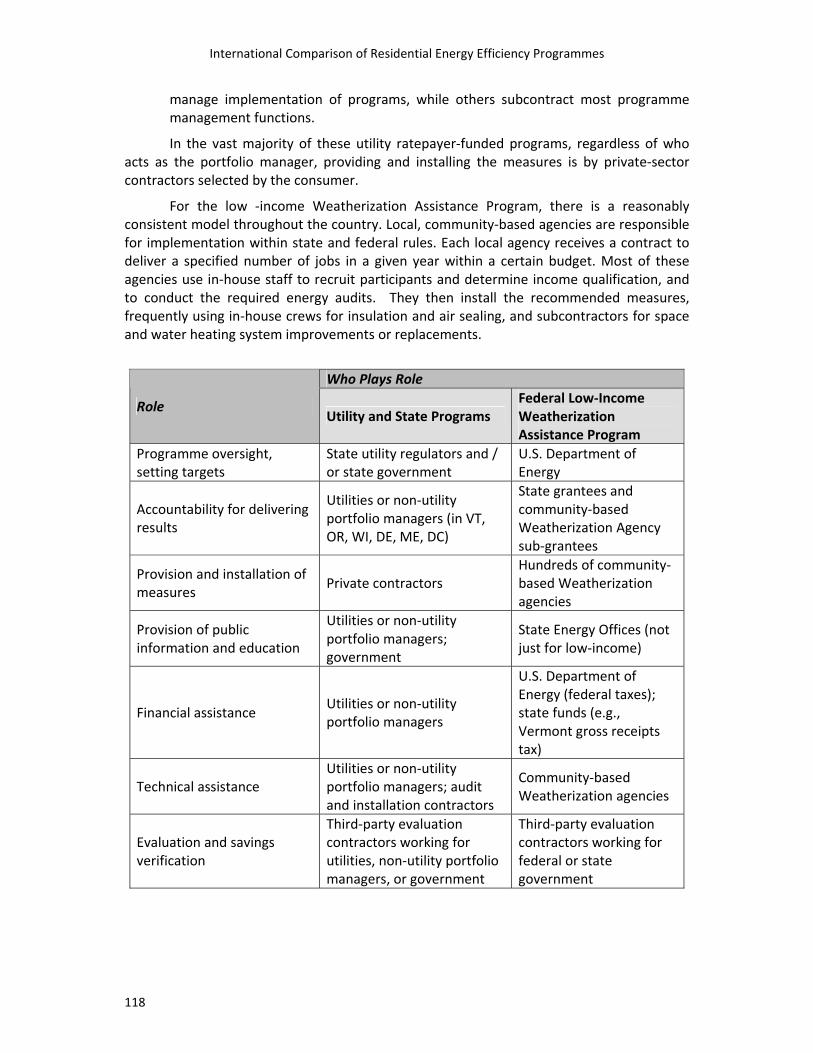
6. The delivery structure for energy efficiency initiatives varies considerably. There are two primary structural models for utility ratepayer‐funded programmes:
• In most states, electric and / or gas distribution companies fund and administer programmes for their customers. Although state legislatures might provide guidance on policies or goals, these efforts are largely under the supervision of state utility regulators. Implementation of these utility programmes is structured at the discretion of the utilities. Expenditures made for programmes are recovered by the utilities though rates, with some states providing incentives to utility shareholders for achievement of specified goals.
• In some states, statewide efficiency portfolio management for all sectors has been assigned to non‐utility entities. In some states, these entities have a scope of responsibility that extends to unregulated fuels, renewable energy and even transportation. In Vermont, New Jersey, Delaware, Wisconsin, and the District of Columbia, competitively selected private entities administer the programme portfolios. All of these provide some level of performance‐based mechanism, where compensation is linked to attainment of goals. In Oregon and Maine, sole‐purpose non‐profit entities have been established to administer efficiency portfolios. Among all these non‐utility portfolio managers, some rely largely on in‐house staffing to manage implementation of programs, while others subcontract most programme management functions.
7. The largest source of funding for efficiency programs in the United States is volumetric charges that are part of utility rates charged by electric and gas distribution utilities. A few states in the Northeast also support efficiency programs with carbon market revenues and revenues from providing capacity into regional electric markets. Vermont, uniquely, also has a Weatherization Trust Fund, which provides substantial funding for low‐income retrofits through a 0.5% gross receipts tax on sales of all heating energy fuels in the state.
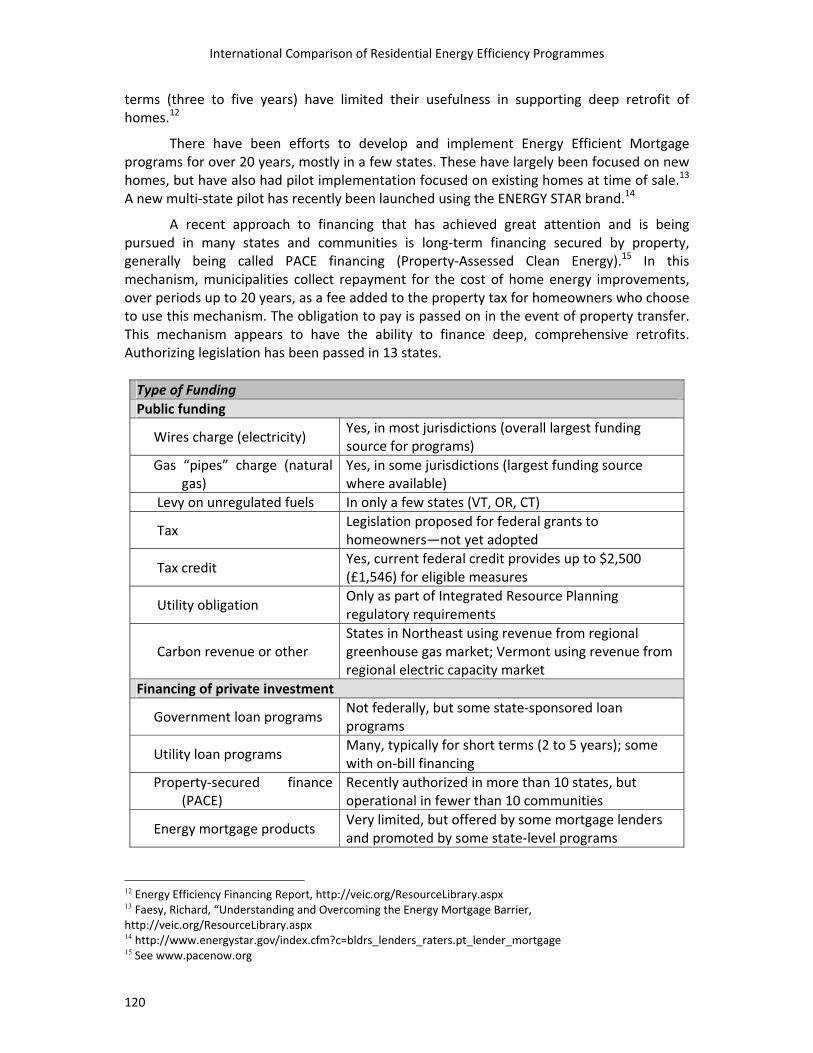
8. There are no national loan programs in the United States, although several legislative proposals are pending. Hundreds of energy loan programs exist at the state and local levels, including those with reduced interest rates and / or payment on the utility bill. However, participation in these programs has been extremely low and the short terms (three to five years) have limited their usefulness in supporting deep retrofit of homes. A recent financing approach to financing that has achieved great attention and is being pursued in many states and communities is long‐term financing secured by property, generally being called PACE financing (Property‐Assessed Clean Energy). In this mechanism, municipalities collect repayment for the cost of home energy improvements, across periods of up to 20 years, as a fee added to the property tax for homeowners who choose to use this mechanism. The obligation to pay is passed on in the event of property transfer. This mechanism appears to have the ability to finance deep, comprehensive retrofits. Authorizing legislation has been passed in 13 states.
Summary
19
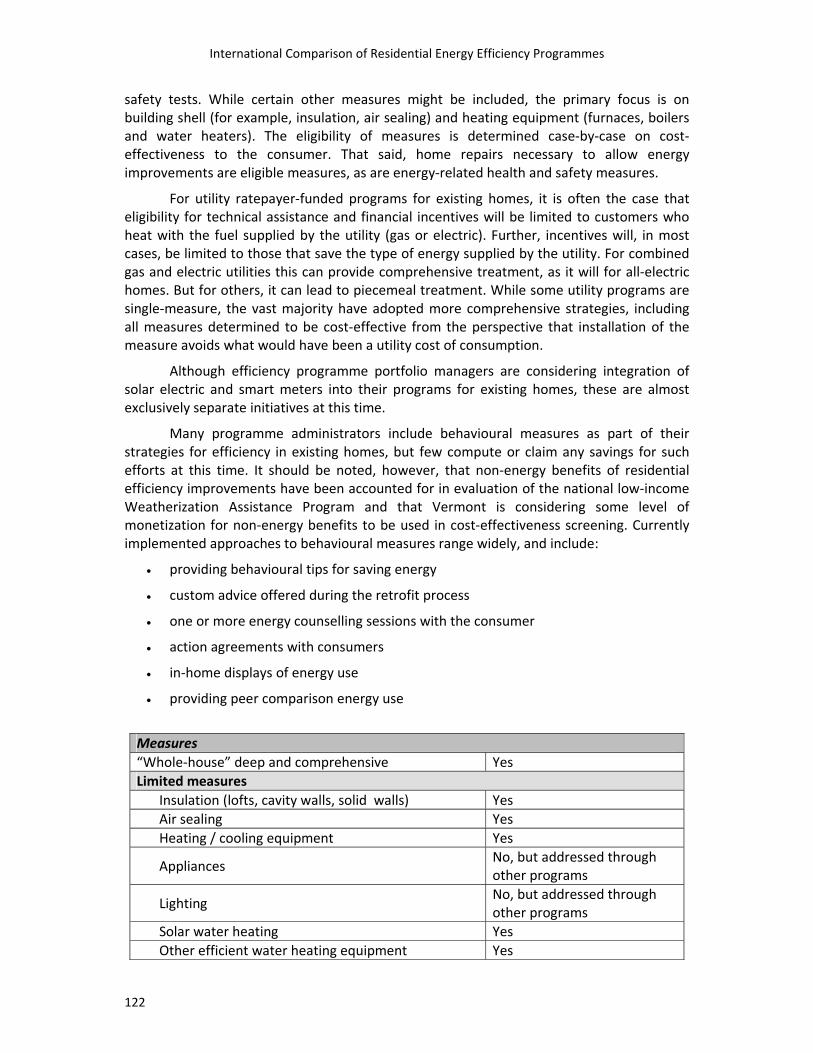
9. Both the national low‐income Weatherization Assistance Program and the Home Performance with Energy Star programme have a “whole‐house” focus, approaching the house as a complex “system” of building envelope and mechanical equipment where interrelated issues of energy, moisture, combustion safety, and indoor air quality must all be addressed. Blower doors are routinely used to test air leakage and guide air sealing work, and standard practice includes combustion efficiency and back‐draughting safety tests.
10. For utility ratepayer‐funded programs for existing homes, it is often the case that eligibility for technical assistance and financial incentives will be limited to customers who heat with the fuel supplied by the utility (gas or electric). Further, incentives will, in most cases, be limited to those that save the type of energy supplied by the utility. For combined gas and electric utilities this can provide comprehensive treatment, as it will for all‐electric homes. But for others, it can lead to piecemeal treatment. Some utility programs are single‐measure, but the vast majority have adopted more comprehensive strategies, including all measures determined to be cost‐effective from the perspective that installation of the measure avoids what would have been a utility cost of consumption.
11. Many programme administrators include behavioural measures as part of their strategies for efficiency in existing homes, but few compute or claim any savings for such efforts at this time. It should be noted, however, that non‐energy benefits of residential efficiency improvements have been accounted for in evaluation of the national low‐income Weatherization Assistance Program and that Vermont is considering some level of monetization for non‐energy benefits to be used in cost‐effectiveness screening.
12. There are no federal codes or standards regarding the efficiency of existing buildings, though some legislative proposals have been made. A small number of cities have enacted residential conservation ordinances that prescribe minimum energy efficiency features to be implemented (if not already present) at the time of property transfer.
13. Historically, the national low‐income Weatherization Assistance Program has served as perhaps the largest source of training and workforce development for home energy improvements. For more than three decades, it has trained thousands of energy auditors and technicians, many of whom have gone on to other jobs in the energy efficiency field. Regional weatherization training centres have been established, just for the purpose of providing high‐quality training for this programme. For more than ten years, the second major national locus of training has been in various states to meet national certification requirements of the Building Performance Institute. Contractors certified by the Building Performance Institute are eligible to provide services under the Home Performance with ENERGY STAR programme. Recently, the national level of interest in workforce development has dramatically increased, as evidenced in part by the allocation of $500 million (£309 million) for this purpose as part of economic stimulus spending in early 2009.
14. It has been widely concluded that residential energy improvements need to be approached on a whole‐house basis, recognizing the house as a complex system of inter‐related components. Air leakage, insulation, moisture, heating systems, combustion safety, moisture problems, air quality, etc., are all inter‐related and need to be considered comprehensively.
A Comparison of Energy Efficiency Programmes for Existing Homes in Eleven Countries
20
15. Increasingly, policies and programme designs are promoting deep savings, instead of single measures or partial treatment. There is a growing recognition that it is more efficient and avoids excessive transaction costs if residential improvements are all made at once, rather than one at a time across a long period. Moreover, many have also concluded that going for the most cost‐effective measures first can render further measures unlikely or impossible to achieve. This can happen both because of burdening the remaining, less cost‐effective measures with further transaction costs and because these measures will be less attractive (or unattractive) to homeowners.
16. Blower‐door guided draught sealing is typically the most cost‐effective measure and is applicable to virtually all existing homes. Draught sealing in lofts is deemed necessary before adding insulation. Blown‐in cellulose (recycled) has been found to be widely applicable, effective, and inexpensive for both loft and wall‐cavity insulation. Heating and cooling system efficiency is approached to address not just equipment efficiency, but also quality installation, controls, and distribution system efficiency.
17. It is widely recognized that programs asking consumers to invest in efficiency improvements need to provide consumers with confidence that quality services will be provided that will deliver promised savings. This requires a workforce with specific, specialized expertise. Contractor training and certification, with independent, oversight of quality and performance are key strategies for success.
Many experts agree that in the current market, publicly funded incentives typically need to be at least one‐third of the cost of refurbishment to achieve substantial interest and participation. But for much of the population, the first cost of major improvements remains a barrier without financing of the homeowner’s investment. Conventional consumer loan programs can help, but major improvements will require financing mechanisms with longer repayment terms (up to 20 years) and methods to address the significant portion of the population that do not have sufficient credit to be approved for loans. The PACE mechanism might adequately address these issues, but it has not yet built up a substantial history of experience.
A Comparison of Energy Efficiency Programs for Existing Homes in Eleven Countries
Full Report
Australia Canada Denmark France Germany Italy Japan
The Netherlands Norway Sweden
The United States
AUSTRALIA
Introduction
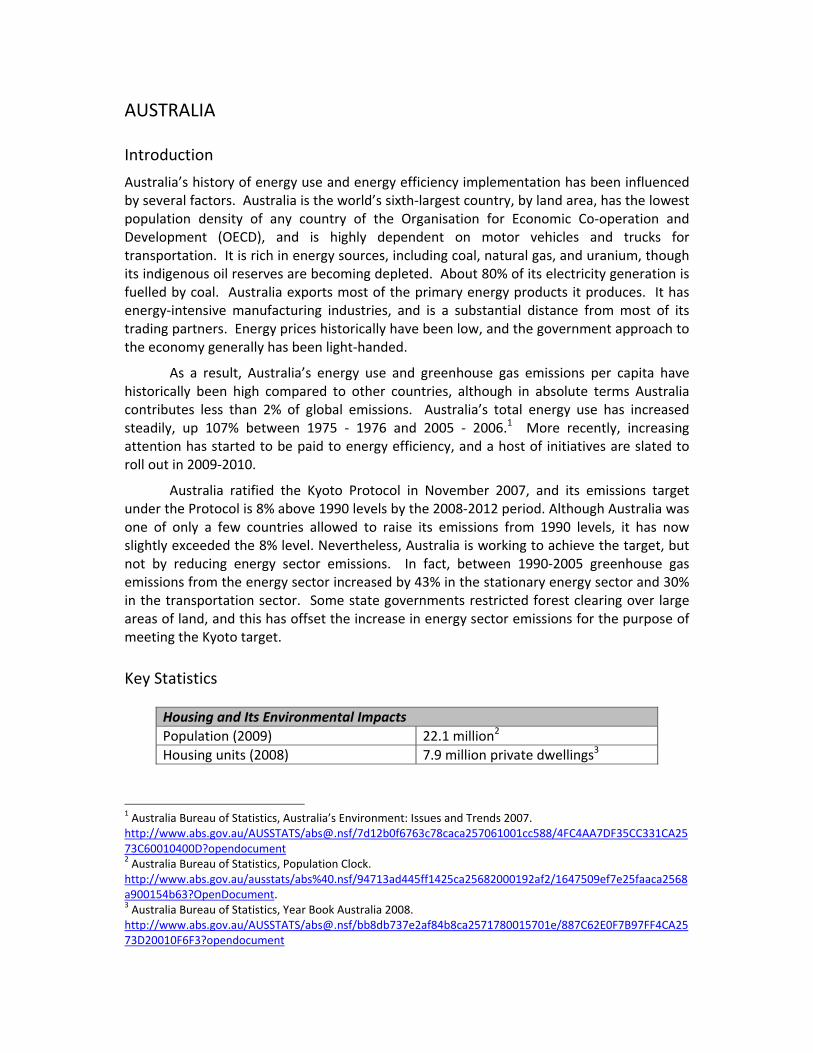
Australia’s history of energy use and energy efficiency implementation has been influenced by several factors. Australia is the world’s sixth‐largest country, by land area, has the lowest population density of any country of the Organisation for Economic Co‐operation and Development (OECD), and is highly dependent on motor vehicles and trucks for transportation. It is rich in energy sources, including coal, natural gas, and uranium, though its indigenous oil reserves are becoming depleted. About 80% of its electricity generation is fuelled by coal. Australia exports most of the primary energy products it produces. It has energy‐intensive manufacturing industries, and is a substantial distance from most of its trading partners. Energy prices historically have been low, and the government approach to the economy generally has been light‐handed.
As a result, Australia’s energy use and greenhouse gas emissions per capita have historically been high compared to other countries, although in absolute terms Australia contributes less than 2% of global emissions. Australia’s total energy use has increased steadily, up 107% between 1975 ‐ 1976 and 2005 ‐ 2006.1 More recently, increasing attention has started to be paid to energy efficiency, and a host of initiatives are slated to roll out in 2009‐2010.
Australia ratified the Kyoto Protocol in November 2007, and its emissions target under the Protocol is 8% above 1990 levels by the 2008‐2012 period. Although Australia was one of only a few countries allowed to raise its emissions from 1990 levels, it has now slightly exceeded the 8% level. Nevertheless, Australia is working to achieve the target, but not by reducing energy sector emissions. In fact, between 1990‐2005 greenhouse gas emissions from the energy sector increased by 43% in the stationary energy sector and 30% in the transportation sector. Some state governments restricted forest clearing over large areas of land, and this has offset the increase in energy sector emissions for the purpose of meeting the Kyoto target. Key Statistics
Housing and Its Environmental Impacts Population (2009) 22.1 million2 Housing units (2008) 7.9 million private dwellings3
1 Australia Bureau of Statistics, Australia’s Environment: Issues and Trends 2007. http://www.abs.gov.au/AUSSTATS/[email protected]/7d12b0f6763c78caca257061001cc588/4FC4AA7DF35CC331CA2573C60010400D?opendocument 2 Australia Bureau of Statistics, Population Clock. http://www.abs.gov.au/ausstats/abs%40.nsf/94713ad445ff1425ca25682000192af2/1647509ef7e25faaca2568a900154b63?OpenDocument. 3 Australia Bureau of Statistics, Year Book Australia 2008. http://www.abs.gov.au/AUSSTATS/[email protected]/bb8db737e2af84b8ca2571780015701e/887C62E0F7B97FF4CA2573D20010F6F3?opendocument
A Comparison of Energy Efficiency Programmes for Existing Homes in Eleven Countries
24
Housing and Its Environmental Impacts
% single‐family
79% separate houses4 11% flats, units, or apartments 9% semi‐detached, row or terrace houses, or townhouses
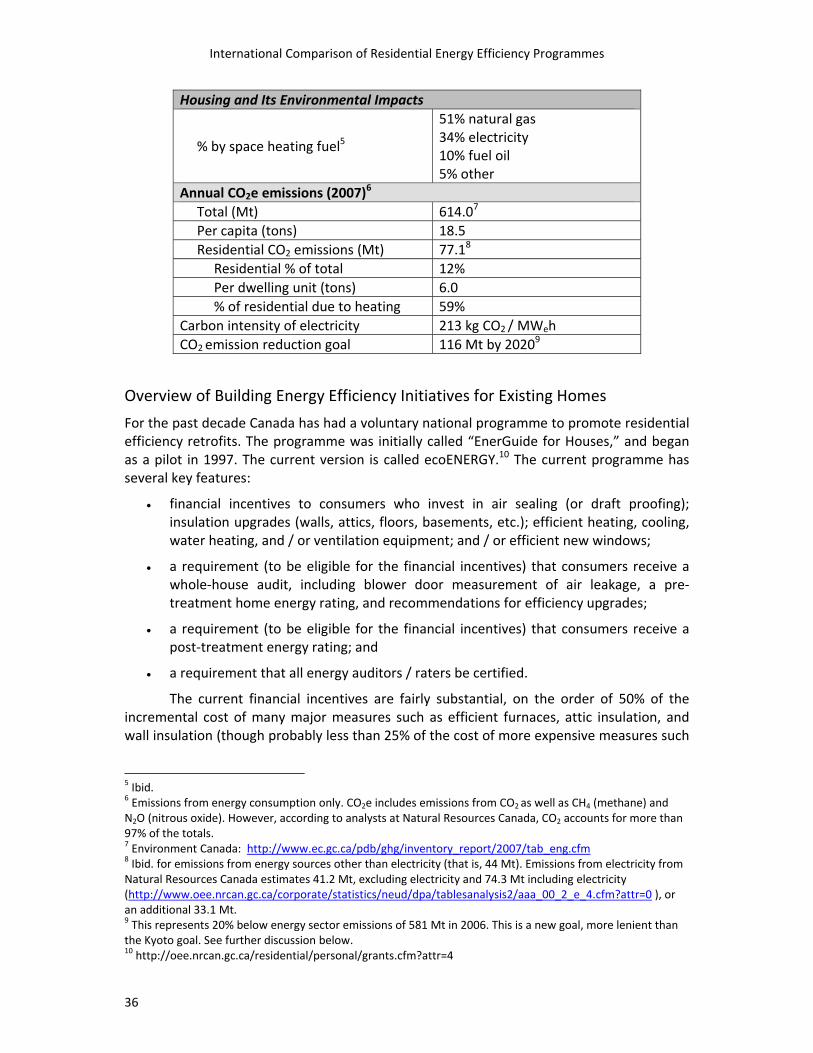
Annual CO2e emissions (2007) Total (Mt) 597.2 CO2e Per capita (tons) 28.6 CO2e Residential CO2 emissions (Mt) 10.07 Residential % of total 1.7%8 Per dwelling unit (tons) 1.3 tons9 % of residential due to heating NA Carbon intensity of electricity 891 kg CO2 / MWeh
CO2 emission reduction goal 8% above 1990 levels in 2008‐2012 period (Kyoto target)10
Overview of Building Energy Efficiency Initiatives for Existing Homes
Residential energy use, including household motor vehicle use, comprises 11% of Australia’s total energy use (while transportation comprises 35%, manufacturing 32%, mining 10%, commercial 6%, and agriculture 2%).11
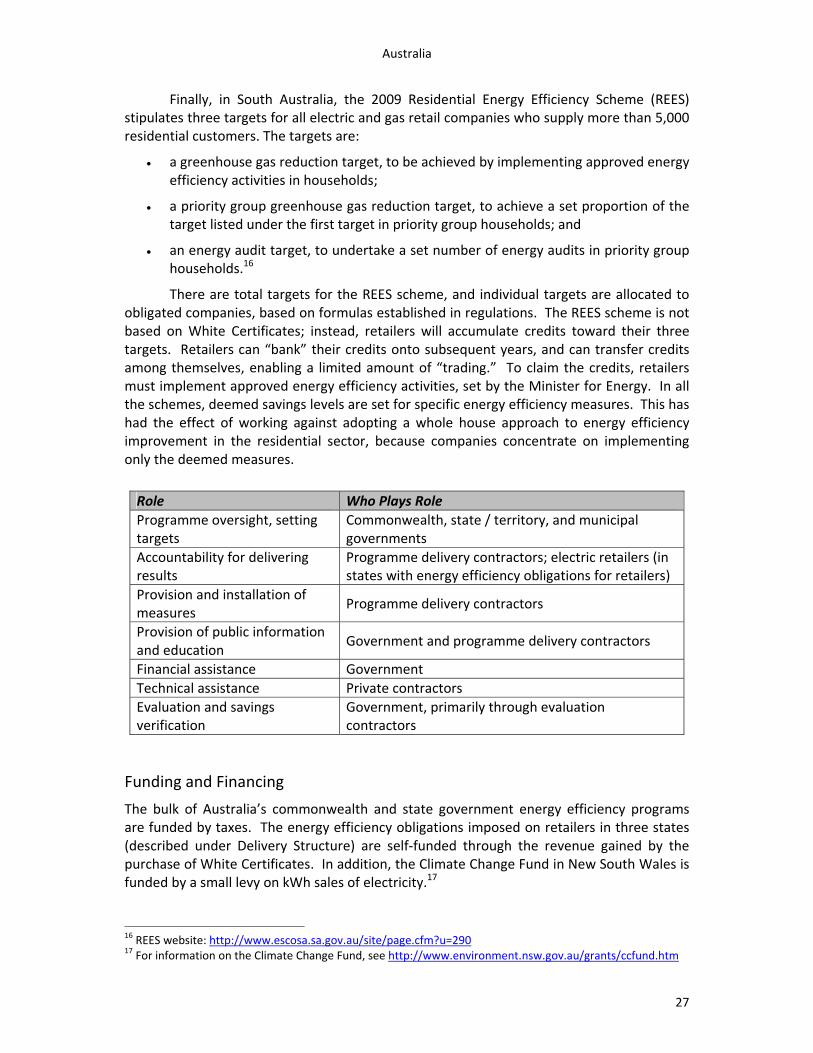
Delivery Structure
Australia is a federation comprising six state and two territory governments, plus the Commonwealth (federal) government. The Australian Constitution defines the powers and responsibilities of the Commonwealth, and since energy is not mentioned in the Constitution, the primary responsibility for energy‐related matters rests with the states. However, in recent years the Commonwealth has been increasingly active in this area.
4 Ibid. 5 4.9 million; Australia Bureau of Statistics, Year Book Australia 2008. http://www.abs.gov.au/AUSSTATS/[email protected]/bb8db737e2af84b8ca2571780015701e/37171EAC4F4F016ECA2573D20010F849?opendocument 6 Australia Bureau of Statistics, Year Book Australia 2008. http://www.abs.gov.au/AUSSTATS/[email protected]/bb8db737e2af84b8ca2571780015701e/850C57021C2D381ECA2573D20010621A?opendocument 7 Residential non‐transport; 44.3 million tons if transportation is included. 8 If transportation were included, 9.1% 9 Calculated by dividing 10 million tonnes residential non‐transport CO2e emissions in 2007 by 7.9 million private dwelling units in 2005‐06. 10 International Energy Agency, CO2 Emissions from Fuel Combustion: Highlights, 2009 11 Australia Bureau of Statistics, Year Book Australia 2008. http://www.abs.gov.au/AUSSTATS/[email protected]/bb8db737e2af84b8ca2571780015701e/C16CC121EEBA9AE4CA2573D20010D095?opendocument
Australia
25
In Australia, all levels of government undertake the bulk of activity around residential energy efficiency. Electric utilities undertake virtually no residential energy efficiency, because they have been unbundled into separate generation, transmission, distribution, and retail companies, and none of these companies has commercial or regulatory incentives to offer residential energy efficiency programs. Some state governments have imposed energy efficiency obligations on electric retail companies for residential energy efficiency, but to fulfil these obligations, typically the utilities simply purchase tradable energy efficiency certificates or other energy efficiency credits.
In addition to Australia’s governments, there are some private‐sector organizations and non‐governmental organizations (NGOs) that are active in specific residential energy efficiency areas, such as building energy efficiency ratings. These organizations are often supported by the governments. National delivery structure
The commonwealth government’s Department of the Environment, Water, Heritage, and the Arts was established in 2007, and implements the Energy Efficient Homes Package and the Green Loans programme (see description under Measures, and Funding and Financing).
The Ministerial Council on Energy (comprising the relevant Ministers from the commonwealth, state, and territory governments) was established in 2001, and oversees the National Framework for Energy Efficiency. Individual programs under the Framework are implemented by the state and territory governments. The Council oversees the energy efficiency programs for appliances and equipment, energy efficiency standards for buildings, and energy efficiency measures in commercial, government, and industrial sectors.
The National Strategy on Energy Efficiency (the Strategy) was agreed to by the Council of Australian Governments (which includes all levels of government) in July 2009. It comprises a set of 10‐year policy measures to accelerate energy efficiency efforts, streamline roles and responsibilities across levels of government, and help residents and businesses prepare for the introduction of the Carbon Pollution Reduction Scheme (CPRS). The CPRS is a design for an emissions trading scheme, using the cap‐and‐trade mechanism, developed by the commonwealth government. The CPRS is not yet in place; the enabling legislation was defeated twice by the Australian Senate, most recently on December 2, 2009).12 The Strategy incorporates and builds on measures already under way at all government levels, including the National Framework on Energy Efficiency that started in 2004. It designates responsibilities for undertaking the measures among various commonwealth agencies, state / territory, and local governments.
One goal of the Strategy is to provide a more collaborative and coordinated delivery of energy efficiency at all levels of government. The National Partnership Agreement on Energy Efficiency, the intergovernmental agreement enabling the Strategy, states that each level of government has an important role to play in the delivery of energy efficiency. In determining which level of government should act on various energy efficiency measures, the Partnership Agreement advises considering which government has the appropriate power to act, which can deliver objectives at the lowest cost, and which is best placed to coordinate delivery. Further, it establishes the principles declaring that the lowest level of
A Comparison of Energy Efficiency Programmes for Existing Homes in Eleven Countries
26
government with the ability to address the problem should do so; and that local and state / territory governments should be used when their understanding of local issues and capacity to implement measures would lead to better outcomes. The commonwealth and state / territory governments are intended to collaborate with local governments, with state / territory governments acting as brokers where relevant to coordinate measures that cut across local councils, leverage investment, and provide support to local councils and groups.
The development of a National Buildings Framework is also an outcome of the Strategy. A working group of Commonwealth and state / territory governments has been established to lead the development of the framework, consult with stakeholders, and develop a discussion paper on the framework for public comment. The final framework is targeted to be agreed to by governments by the end of 2010.13 State / territory and municipal delivery structures
Several state/territory and municipal governments have developed residential energy efficiency programs or assistance (see examples under Measures).
In addition, three state governments (New South Wales, Victoria, and South Australia) have imposed energy efficiency obligations on electricity retailers (and in some cases gas retailers), coupled with trading schemes for white certificates or other energy efficiency credits.
These schemes are innovative, and their implementation is significantly different from what has been implemented elsewhere. New South Wales implements the Energy Savings Scheme (ESS), which requires electricity retailers to reduce their electricity sales over time through energy efficiency activities. The ESS follows its predecessor, the Greenhouse Gas Reduction Scheme, which started in 2003.14 Retailers may undertake energy efficiency activities themselves, or purchase and surrender certificates from companies carrying out energy efficiency activities accredited under the ESS. The overall effective scheme target is 0.4% of annual New South Wales electricity sales in 2009, ramping up to 4% in 2014 through 2020.
The Victorian Energy Efficiency Target scheme (VEET) began in 2009 and establishes an annual target of avoided greenhouse gas emissions to be achieved by major electric and gas retail companies through improvements to energy efficiency in Victoria’s households.15 Energy and gas retailers are allocated annual targets based on their share of the combined electricity and gas market. The overall target for the first three‐year period is 2.7 megatons of greenhouse gases avoided. As part of this scheme, tradable certificates (Victorian Energy Efficiency Certificates; VEECs) may be created by implementing any of a list of eligible energy efficiency activities prescribed by the regulations. The regulations also lay out the number of VEECs that may be created for each activity. Eligible measures for VEECs include water heating, space heating, space conditioning, lighting, low‐flow showers, and refrigerator/freezers. Certificate creators offer residents energy efficiency products selected from the list of eligible measures.
Finally, in South Australia, the 2009 Residential Energy Efficiency Scheme (REES) stipulates three targets for all electric and gas retail companies who supply more than 5,000 residential customers. The targets are:
• a greenhouse gas reduction target, to be achieved by implementing approved energy efficiency activities in households;
• a priority group greenhouse gas reduction target, to achieve a set proportion of the target listed under the first target in priority group households; and
• an energy audit target, to undertake a set number of energy audits in priority group households.16
There are total targets for the REES scheme, and individual targets are allocated to obligated companies, based on formulas established in regulations. The REES scheme is not based on White Certificates; instead, retailers will accumulate credits toward their three targets. Retailers can “bank” their credits onto subsequent years, and can transfer credits among themselves, enabling a limited amount of “trading.” To claim the credits, retailers must implement approved energy efficiency activities, set by the Minister for Energy. In all the schemes, deemed savings levels are set for specific energy efficiency measures. This has had the effect of working against adopting a whole house approach to energy efficiency improvement in the residential sector, because companies concentrate on implementing only the deemed measures.
Role Who Plays Role Programme oversight, setting targets
Commonwealth, state / territory, and municipal governments
Accountability for delivering results
Programme delivery contractors; electric retailers (in states with energy efficiency obligations for retailers)
Provision and installation of measures
Programme delivery contractors
Provision of public information and education
Government and programme delivery contractors
Financial assistance Government Technical assistance Private contractors Evaluation and savings verification
Government, primarily through evaluation contractors
Funding and Financing
The bulk of Australia’s commonwealth and state government energy efficiency programs are funded by taxes. The energy efficiency obligations imposed on retailers in three states (described under Delivery Structure) are self‐funded through the revenue gained by the purchase of White Certificates. In addition, the Climate Change Fund in New South Wales is funded by a small levy on kWh sales of electricity.17
16 REES website: http://www.escosa.sa.gov.au/site/page.cfm?u=290 17 For information on the Climate Change Fund, see http://www.environment.nsw.gov.au/grants/ccfund.htm
A Comparison of Energy Efficiency Programmes for Existing Homes in Eleven Countries
28
The commonwealth government’s Energy Efficient Homes Package will provide more than AU$4 billion (£2.22 billion) over four years, under the national economic stimulus plan. Rebates for installing solar panels have been funded with about AU$340 million (£190 million) between 2008 and 2010. The government will provide AU$18.3 million (£10.25 million) across four years for an enhanced energy efficiency labelling system, and AU$16.6 million (£9.25 million) across four years to expand the current minimum energy performance standards. Both of these are goals of the Strategy. The government also will provide AU$7.8 million (£4.34 million) across four years to develop and phase in a new framework for the disclosure of energy performance information for homes at the time of sale or lease, another component of the Strategy. A National Energy Efficiency Initiative will develop a smart‐grid energy network, including smart meters in homes, an AU$100 million (£55.75 million) initiative. 18
The Australian Government offers the Green Loans Programme that assists residents in installing energy efficient, solar, and water saving products in existing homes.19 The programme consists of two parts:
• Free Home Sustainability Assessments, conducted by certified assessors; these comprehensive assessments examine a home’s energy and water systems relating to thermal comfort, water heating, lighting, refrigeration, cooking, entertainment, water efficiency and outdoor energy consumption, and waste management; and
• A loan subsidy that covers all the interest on borrowing up to AU$10,000 (£5,575) for four years from participating financial institutions. The loan must be used for actions recommended in the Home Sustainability Assessment. Currently, approximately 15 financial institutions are participating in the programme.20 This programme was announced with the Government’s 2008 / 2009 budget. Current plans are for the Green Loans to be available until March 31, 2013, or until available funding is exhausted (whichever comes first).21 The programme has committed funding for 360,000 assessments for Green Loans, and as of November 12, 2009, more than 120,000 assessments had been booked.22
Type of Funding Public funding
Wires charge (electricity) Yes, a mechanism similar to a wires charge is used in New South Wales to fund the Climate Change Fund
Gas “pipes” charge (natural gas) No Levy on unregulated fuels No
Tax Yes, the main funding mechanism at national and state levels
18 Australian Government, Department of Environment, Water, Heritage, and the Arts, Environment Budget Overview 2009 ‐ 2010, http://www.budget.gov.au/2008‐09/content/ministerial_statements/html/climate_change‐02.htm. 19 http://www.environment.gov.au/greenloans/index.html 20 http://www.environment.gov.au/greenloans/about/subsidy.html. 21Australian Government, Green Loans Program Guidelines: http://www.environment.gov.au/greenloans/guidelines/pubs/greenloans‐guidelines.pdf. 22 http://www.hsas.net.au/site/index.cfm.
Australia
29
Type of Funding Tax credit Yes, in three states Utility obligation Yes, in three states Financing of private investment
Government loan programs Yes, Green Loans Programme (an interest rate rebate rather than an actual loan)
Utility loan programs No Property‐secured finance (PACE) No
Energy mortgage products Yes, some banks offer extensions of mortgages to fund energy efficiency measures
Dedicated institution (e.g., Green Bank)
No
Measures Promoted
Currently many of Australia’s residential energy efficiency efforts do not appear to be “whole‐house, all fuels” programs. Most programs are directed at individual measures, or provide rebates for a narrow set of products. Some audit programs exist, but they often are not comprehensive whole‐house, all fuels audits. One exception may be the audits required in the Green Loans programme (described under Funding and Financing), which appear to be whole‐house, all fuels assessments. The programs directed at low‐income households may also incorporate whole‐house efforts (see Fuel Poverty section). In addition, the National Buildings Framework currently being developed appears to be expected to have a whole‐house focus.
The Australian government’s current efforts are centred on their Energy Efficiency Homes Package, funded at more than AU$4 billion (£2.22 billion) across four years.23 Under this programme, the government provides rebates of up to AU$1,200 (£668) for installing ceiling insulation to eligible owner‐occupiers, landlords, and tenants of currently un‐insulated homes or homes with very little ceiling insulation. The installations must be undertaken by installers who meet minimum competency and training requirements and who register on the Installer Provider Register with the Australian Government. A private contractor conducts site inspections of random samples of households after the insulation is installed to ensure compliance with the programme. The Energy Efficiency Homes Package also provides rebates of AU$1,600 (£890) to install a solar hot‐water system, or AU$1,000 (£557) to install a heat pump hot‐water system. These rebates are available to eligible home‐owners, landlords, or tenants to replace their electric storage hot‐water systems with solar or heat pump hot‐water systems. Applicants may only receive the insulation rebate or the solar hot water rebate, not both.
Other work the Australian government undertakes on energy efficiency is centred on the National Framework on Energy Efficiency, managed by the Ministerial Council on Energy, and by the Strategy. The development of a National Buildings Framework is also an outcome of the Strategy (as described under Delivery Structure). The National Buildings 23 http://www.environment.gov.au/energyefficiency/index.html.
A Comparison of Energy Efficiency Programmes for Existing Homes in Eleven Countries
30
Framework is currently being developed, and is intended to cover all classes of new and existing residential and commercial buildings, the building envelope (roof, walls, doors, and windows) and the energy efficiency of key building services, assessment and rating tools, etc.24 As such, it may offer a more “whole house” approach.
As mentioned above, several state / territory governments deliver significant energy efficiency programs. For example, Queensland offers AU$50 (£28) toward energy and water audits by licensed electricians, accompanied by free wireless energy monitors, CFLs, and showerheads (the ClimateSmart Home Service).25 New South Wales offers rebates on energy efficient products and other types of assistance.26 In Victoria, the government offers the Energy Saver Incentive programme, discounts and special offers on products to assist residents in saving energy, as part of its trading scheme for energy efficiency certificates.27 In addition, under the Strategy, all states and territories will conduct an audit of the energy efficiency of their public housing stock.
In addition, the energy efficiency obligations imposed on retailers in three states, coupled with trading schemes for White Certificates or other energy efficiency credits (described under Delivery Structure), prescribe specific measures that qualify under the schemes. As described above, the ways in which these schemes have been structured have worked against implementing a whole‐house approach.
Municipalities also deliver energy efficiency measures. For example, the city of Newcastle provides free energy reduction kits that include a power usage meter and an energy savings handbook, and conducted a six‐week power saver challenge for six households.28 In many New South Wales cities and regions, a refrigerator buyback programme will remove for free—and in some cases pay a rebate for removing—a second working refrigerator 10 or more years old in a household.29 The Brisbane City Council offers various rebates and grants for energy efficiency projects.30
Measures “Whole‐house” deep and comprehensive No; some audits may be whole‐
house; some fuel poverty programs may be whole‐house; National Buildings Framework in development may have whole‐house focus.
24 http://www.environment.gov.au/sustainability/energyefficiency/buildings/index.html. 25 Queensland residential EE program: ClimateSmart Home Service: http://www.climatesmarthome.com/index.html. 26 http://www.savepower.nsw.gov.au/Home.aspx. 27 http://www.saveenergy.vic.gov.au/465.aspx 28 Newcastle residential EE programs: http://www.newcastle.nsw.gov.au/environment/climate_cam/for_community. 29 Hornsby Shire Council, Fridge buyback program: http://www.hornsby.nsw.gov.au/environment/index.cfm?NavigationID=2361; http://www.fridgebuyback.com.au/index.html. 30 Brisbane City Council EE rebates and grants. http://www.brisbane.qld.gov.au/BCC:CITY_SMART::pc=PC_5014.
Air sealing Yes, in some low‐income retrofit programs
Heating/Cooling equipment No, generally programs do not focus on replacing heating or air conditioning
Appliances Yes Lighting Yes Solar water heating Yes Other efficient water heating equipment NA Efficient windows NA Biomass heating No Solar electric Yes Smart meters & in‐home displays Yes Behavioural measures No
Codes and Standards
Buildings
Currently, one Australian territory has an energy efficiency rating and labelling requirement at the time of sale for residential properties. The Australian Capital Territory requires that homeowners provide an energy efficient rating (EER) when residential properties are advertised or offered for sale. The EER must be prepared by an accredited and registered assessor, and must contain a rating based on the Australian Capital Territory House Energy Rating Scheme (which includes rating score points and a rating system of 0 to 6 stars). The star rating must be included in all sales advertising of the property, be provided to the purchaser, and be included in the contract for sale. Similar EER disclosure requirements exist when leasing a residential property in cases where an EER has been prepared for the property. EER requirements were introduced in the Australian Capital Territory in 1998.31
The Australian government also soon will have a similar requirement. Under the Strategy, homeowners of existing homes will be required to provide energy, water, and greenhouse performance ratings and labelling when selling or leasing a property in the future. The requirement is expected to start with disclosure of energy efficiency by May 2011. A decision regulatory impact analysis is expected to be released in mid‐2010, which will include an examination of different implementation options. The design of the system will be finalized during the remainder of 2010 and early 2011.32
31 ACT, Civil Law (Sale of Residential Property) Energy Efficiency Rating Guidelines Determination 2009 (No 2): http://www.legislation.act.gov.au/di/2009‐124/current/pdf/2009‐124.pdf; and Explanatory Statement: http://www.legislation.act.gov.au/es/db_34840/current/pdf/db_34840.pdf; and ACT Planning and Land Authority, “Energy Efficiency for House Sales:” http://www.actpla.act.gov.au/topics/property_purchases/sales/energy_efficiency 32 Council of Australian Governments, National Strategy on Energy Efficiency, July 2009, p. 26: http://www.coag.gov.au/coag_meeting_outcomes/2009‐07‐02/docs/Energy_efficiency_measures_table.pdf.
A Comparison of Energy Efficiency Programmes for Existing Homes in Eleven Countries
32
The Australian government and state governments also have in place building codes for new houses. A description of those codes is outside the scope of this profile; however, see the references in the footnote for more information.33 Supply Chain
As part of the National Framework on Energy Efficiency that started in 2004, the commonwealth Ministerial Council on Energy began work on improving trade and professional training for energy efficiency improvements. Under the Strategy, that work will be accelerated and enlarged. The Strategy establishes that a National Energy Efficiency Skills Initiative, a comprehensive approach to providing for the skill requirements of a low‐carbon economy, will be approved and implemented in 2010. The initiative will identify energy efficiency skills requirements across the economy and associated training needs; identify training gaps; develop accreditation standards and systems; publicize training and accreditation; monitor delivery of training, etc. The Strategy also will examine existing energy efficient audit and assessment processes, with the aim of achieving nationally consistent approaches and requirements.
Under the Green Loans Programme (described in the Funding and Financing section), free Home Sustainability Assessments are offered, which must be completed by accredited assessors who have completed a training course, have registered with an Assessor Accrediting Organization, and have signed a contract with the Australian Government. Currently, there is one such accrediting organization, the Association of Building Sustainability Assessors. The training course typically requires four days of classroom training, and the training organizations may require that attendees fulfil prerequisites or have a minimum level of previous experience. A team of auditors will monitor the work of these assessors, encompassing the accuracy of their work, the quality of their advice to households, their adherence to professional codes, and their behaviour in dealings with the households and government.34 The Association of Building Sustainability Assessors predicts that by the end of December 2009, there will be 3,500 assessors registered under this programme.35 This assessment process will be evaluated under the work coming out of the Strategy.
Under the Energy Efficient Homes Package (described in the Measures section), installers must be registered with the commonwealth government and meet basic trade competency levels. Other training and accreditation programs exist in Australia.36
Type of Industry Infrastructure Initiatives
Publicly funded residential efficiency technician training programs
Not sure; there may be some publicly funded programs through Australia’s Technical and Further Education (TAFE)
Industry‐funded residential efficiency technician training programs
Not sure; there may be some publicly funded programs through Australia’s Technical and Further Education (TAFE)
Public / government quality certification of efficiency service providers
Yes, government requires certifications given by industry
Industry quality certification of efficiency service providers
Yes, industry provides certifications for government programs
Fuel Poverty
Fuel poverty is not widely acknowledged or recognized in Australia. Energy bills are not usually a major cause of poverty because of the relatively mild climate and low energy prices. Therefore, programs that would be categorized as “fuel poverty” programs in other jurisdictions are categorized as “low‐income” programs in Australia. Before 2009, there were no national energy efficiency programs directed at low‐income households, but there were some state programs.
A national programme directed at low‐income households was announced on November 25, 2009. The AU$130 million (£72.4 million) Green Start initiative will help improve the energy and water efficiency of low‐income and disadvantaged households.37 It will cover owner‐occupied, rental, public, and community housing, in all geographic regions. Eligible households will receive free home energy and water assessment; free supply and installation of energy and water efficiency products such as pipe insulation, efficient light bulbs, low‐flow showerheads, draft‐proofing, and seals for refrigerators, doors, and windows; and personalized help to access rebates and programs, and to deal with landlords and trades people in implementing the measures. Green Start will be a cooperative programme among the commonwealth and state / territory governments, working with private organizations and the social welfare sector; it will be tailored in each state / territory to complement the range of initiatives already available there. Green Start programme brokers will link low‐income householders with assessors, who will assist residents in accessing programs and services. The commonwealth government now is calling for bids to deliver the programme, which is expected to begin in 2010.38
The Australian government also has stated that it is committed to helping low‐income and middle‐income residents with the impact of the expected Carbon Pollution Reduction Scheme, which is not yet law.39
State governments also provide low‐income energy efficiency housing retrofit support. For example, Victoria has had an Energy and Water Task force in operation since 2003 to assist low‐income residents. The programme offers free energy and water home improvements to low‐income households in Victoria's most disadvantaged communities. Home improvements may include ceiling insulation, efficient lights, and fixing drafts and
A Comparison of Energy Efficiency Programmes for Existing Homes in Eleven Countries
34
other sources of air leakage.40 New South Wales has a Low‐Income Household Refit programme; the pilot began in May 2009, with the full programme to be rolled out later. The pilot offers free energy assessments and power saver kits that include some measures, though the free measures available to do not appear to include larger home efforts such as insulation. The REES scheme mandated in South Australia (described under Delivery Structure) imposes requirements on retail companies for meeting specific targets for energy efficiency in low‐income households.41 Most Significant Lessons Learned
As noted above, Australia historically has not placed a great deal of attention on energy efficiency retrofit opportunities in homes. However, that is beginning to change, with new efforts just getting under way. Significantly:
• Better coordination among all levels of government is warranted. Recent government efforts indicate a recognition that coordination among all levels of government is key to the success of energy efficiency implementation.
• Better national planning is expected to pay off. The 2009 National Strategy on Energy Efficiency is in the process of unifying its current practices and is producing an overall plan, many new initiatives of which are scheduled for roll‐out in 2009 and 2010.
• High involvement in lower levels of government is valuable. States / territories and some municipalities recognize the value of actively engaging their jurisdictions in energy efficiency efforts. They have strong involvement in providing energy efficiency opportunities for households.
• Residential energy efficiency through utility company obligations. Three Australian states have imposed residential energy efficiency obligations on their electric (and in some cases gas) retail companies, coupled with trading schemes for White Certificates or other energy efficiency credits. These schemes are stimulating residential energy efficiency activity.
• Strong standards. The national appliance standards and phase‐out of incandescent bulbs are expected to deliver significant savings nationwide.
• Mandatory disclosures. Mandatory disclosure of a house’s energy consumption, at time of sale, will start in 2011.
Canada ranks as one of the world’s top ten countries in the production of carbon dioxide emissions, with the exact ranking varying (typically 7th or 8th) depending on the source. It also ranks quite high in CO2 emissions per capita, trailing only the United States, a number of countries in the Middle East, several small island nations and Australia. Two contributing factors to its high emissions are its generally very cold climate (requiring substantial energy for space heating of buildings) and its low population density (requiring significant transportation services per capita). On the other hand, the country has a wealth of hydro‐electric power, enabling its electricity generation to be less carbon intensive than that of its neighbour to the south, the United States.
Canada is a signatory to the Kyoto Protocol, which commits the country to reducing greenhouse gas emissions to 6% below 1990 levels by 2012. However, the country is highly unlikely to meet that goal, as emissions in 2006 were actually 19% above 1990 levels. The current federal government has proposed establishing more lenient, but still mandatory, emission targets. The targets are 20% below 2006 emission levels, which equates to about 3% below Kyoto’s 1990 benchmark. In contrast with the federal government, several provincial governments have established even more aggressive goals than those established under Kyoto. For example, the Quebec government recently announced a goal to reduce CO2 emissions by 20% below 1990 levels by 2020.
Because of its size and political structure, any assessment of both climate change policies and energy efficiency policies needs to recognize that important initiatives and progress can occur at multiple levels—national, provincial, and even the local level. This summary focuses principally on initiatives at the national level to promote efficiency retrofits of existing residential buildings. However, examples of how national efforts are complemented and leveraged by provincial and local efforts are also noted, to provide a flavour for how the combination of efforts works and matters. Key Statistics
Housing and Its Environmental Impacts Population (2006) 32.9 million1 Housing units (2007) 12.8 million2 % single‐family 67%3 % owner‐occupied 67%4
International Comparison of Residential Energy Efficiency Programmes
36
Housing and Its Environmental Impacts
% by space heating fuel5
51% natural gas 34% electricity 10% fuel oil 5% other
Annual CO2e emissions (2007)6 Total (Mt) 614.07 Per capita (tons) 18.5 Residential CO2 emissions (Mt) 77.18 Residential % of total 12% Per dwelling unit (tons) 6.0 % of residential due to heating 59% Carbon intensity of electricity 213 kg CO2 / MWeh CO2 emission reduction goal 116 Mt by 20209
Overview of Building Energy Efficiency Initiatives for Existing Homes
For the past decade Canada has had a voluntary national programme to promote residential efficiency retrofits. The programme was initially called “EnerGuide for Houses,” and began as a pilot in 1997. The current version is called ecoENERGY.10 The current programme has several key features:
• financial incentives to consumers who invest in air sealing (or draft proofing); insulation upgrades (walls, attics, floors, basements, etc.); efficient heating, cooling, water heating, and / or ventilation equipment; and / or efficient new windows;
• a requirement (to be eligible for the financial incentives) that consumers receive a whole‐house audit, including blower door measurement of air leakage, a pre‐treatment home energy rating, and recommendations for efficiency upgrades;
• a requirement (to be eligible for the financial incentives) that consumers receive a post‐treatment energy rating; and
• a requirement that all energy auditors / raters be certified.
The current financial incentives are fairly substantial, on the order of 50% of the incremental cost of many major measures such as efficient furnaces, attic insulation, and wall insulation (though probably less than 25% of the cost of more expensive measures such
5 Ibid. 6 Emissions from energy consumption only. CO2e includes emissions from CO2 as well as CH4 (methane) and N2O (nitrous oxide). However, according to analysts at Natural Resources Canada, CO2 accounts for more than 97% of the totals. 7 Environment Canada: http://www.ec.gc.ca/pdb/ghg/inventory_report/2007/tab_eng.cfm 8 Ibid. for emissions from energy sources other than electricity (that is, 44 Mt). Emissions from electricity from Natural Resources Canada estimates 41.2 Mt, excluding electricity and 74.3 Mt including electricity (http://www.oee.nrcan.gc.ca/corporate/statistics/neud/dpa/tablesanalysis2/aaa_00_2_e_4.cfm?attr=0 ), or an additional 33.1 Mt. 9 This represents 20% below energy sector emissions of 581 Mt in 2006. This is a new goal, more lenient than the Kyoto goal. See further discussion below. 10 http://oee.nrcan.gc.ca/residential/personal/grants.cfm?attr=4
Canada
37
as ground source heat pumps and solar water heaters).11 The current programme is funded through 2011. The government expects to launch a new generation of the programme at that point in time. The design of the new programme will be under discussion during 2010 and possibly into 2011.
This federal programme is complemented, in different ways and in varying degrees, by provincial programs. For example, the government of Ontario—Canada’s largest province—offers to pay half of the cost of the audit and then matches the federal financial incentives for measures installed, effectively doubling the financial incentives that the consumers receive. The provincial government of Quebec also pays half of the initial audit cost and provides supplemental incentives, similar to the federal incentives, for efficiency measures installed in oil‐ and propane‐heated homes (again, effectively doubling the customer incentives); similar measure incentives for homes heated by electricity and natural gas are provided by the provincial utilities. The province of New Brunswick also subsidizes the cost of the audits and offers consumers a choice of either 20% of the cost of the improvements made, or a zero‐interest loan.12 The province of British Columbia was offering substantial additional incentives, more than the federal incentives for some measures and less for others. However, it used its entire budget for the programme and is no longer offering supplemental incentives for home‐owners who received audits after August 15, 2009.13 Other provinces and utilities offer a similar range of complementary services and incentives built around this national structure. In some cases, the federal and provincial programs are also supplemented by local initiatives. For example, the cities of Toronto (in the province of Ontario), Edmonton, and Medicine Hat (both in the province of Alberta), and several others have supplemental supporting initiatives.14
The national programme has been growing quickly in recent years. In the 2007 ‐ 2008 fiscal year, approximately 18,000 jobs were completed.15 In the 2008 ‐ 2009 fiscal year, there were approximately 77,000 completions—an increase of more than fourfold.16 The programme is on pace to double that number in the 2009 – 2010 fiscal year. Other key statistics regarding programme participation are as follows:
More than 70% of homes receiving initial audits are following through with at least some of the recommended retrofit work within 18 months—a significant increase of about 40% in the “close rate” under the old programme, likely due at least in part to a change that allows energy auditors / raters to sell and install efficiency measures;17
11 The furnace incentives are enough to cover on the order of half of the incremental cost of upgrading from a new standard efficiency furnace to a new high efficiency furnace – that is, in situations where the consumer is already planning to buy a new furnace. They cover a much smaller fraction of the cost of an “early retirement” of an existing furnace – that is, situations where the consumer was not otherwise going to buy a new furnace. 12 http://www.efficiencynb.ca/enb/1610/Existing‐Homes‐Energy‐Efficiency‐Upgrades‐Program 13 See http://oee.nrcan.gc.ca/corporate/incentives.cfm?attr=0 for more detail on provincial and local offerings. 14 Personal communication with Suzanne Deschenes, 12/15/09. 15 The fiscal year runs from April 1 through March 31. 16 It is important to note that there is typically a time lag between the initial audit and the completion of the job, so many of the audits conducted in one year are not completed until the following year. 17 Presentation by Susanne Deschenes, Natural Resources Canada at the first Canadian Affordable Comfort Conference, Toronto, Ontario, October 28‐29, 2009 (see: http://www.energyretrofitsforhouses.com/pdf/PROG%202%20EnerGuide%20%20ecoENERGY%20Deschenes.pdf ). Note that the province of Quebec has maintained its own requirement that auditors/raters remain “independent” and not sell efficiency services.
International Comparison of Residential Energy Efficiency Programmes
38
• The savings from installed measures represent approximately 70% of the savings recommended during the initial audits;18
• The average gross savings ( that is,, not adjusting for free riders) is nearly 50 GJ per home, or between 20% and 25% of pre‐treatment energy usage;19,20
• The average CO2 reduction per home of approximately 3.2 tons;21 and
• The average federal rebate is currently approximately $1,400 (£827).22
• The GHG reduction target for the programme is 1.66 Mt by 2011 (roughly a fourfold increase over 2008).23
Delivery Structure
As suggested above, the delivery structure for residential retrofit initiatives is somewhat fragmented as a result of the many different levels at which it is implemented. At the federal level, Natural Resources Canada—the federal agency responsible for energy policy—manages the programme. It specifies the required procedures and required analysis software, provides federal incentives, and provides public information on the programme.
At the provincial level, similar responsibilities are typically held by provincial government agencies or utilities. There are currently two exceptions. In New Brunswick, a crown corporation (Efficiency New Brunswick) acts as the efficiency portfolio manager.24 In Nova Scotia, an independent, new, non‐profit entity is to be established in 2010 that will be the single implementer of both electric utility and government‐funded efficiency programs addressing all fuels.25
In most cases, many key aspects of programme delivery are specifically designated to be provided by the private sector. Independent, private contractors provide audits, energy ratings, and technical recommendations. Other private contractors provide and install energy efficiency measures. In most cases, these contractors operate in a competitive market, with consumers choosing the contractors they wish to engage.
The table below summarizes responsibilities for the combined set of efforts under way in Canada. Because there are programs within multiple levels of government, responsibilities are also shared across different levels of government.
Role Who Plays Role Programme oversight, setting Federal, provincial and local governments, utilities
18 Natural Resources Canada ecoENERGY Monthly Statistics Report, December 1, 2009. 19 Ibid. 20 Savings are estimated from building simulation modelling that tends to over‐estimate savings. Indeed, a previous evaluation suggested that actual savings were less than half the predicted savings (http://nrtee‐trnee.ca/eng/publications/KPIA‐2009/Appendix‐A‐1‐6‐KPIA‐NRTEE‐Response‐2009‐eng.php). Nevertheless, the savings are quite substantial. 21 Natural Resources Canada ecoENERGY Monthly Statistics Report, December 1, 2009. 22 Ibid. 23 http://nrtee‐trnee.ca/eng/publications/KPIA‐2009/Appendix‐A‐1‐6‐KPIA‐NRTEE‐Response‐2009‐eng.php 24 http://www.efficiencynb.ca/enb 25 http://gov.ns.ca/news/details.asp?id=20081211003
Canada
39
targets and third‐party portfolio managers Accountability for delivering results
Mostly utilities or programme delivery contractors, or designated 3rd party portfolio managers (NB and NS)
Provision and installation of measures
Private contractors
Provision of public information and education
Delivery contractors; utilities and other portfolio managers; government
Financial assistance Partial grants from Federal government, provincial and local governments; utilities and 3rd party portfolio managers
Technical assistance Primarily audit and installation contractors, with some support from portfolio managers.
Evaluation and savings Verification
Government or utilities, typically through evaluation contractors
Funding and Financing
Funding of the residential retrofit efficiency initiative in Canada comes from several sources. At the federal level, rebates for retrofit efficiency investments are funded entirely from tax revenues. In 2009 only, the Home Renovation Tax Credit provided an additional 15% credit for all spending above $1,000 (£591) and less than $10,000 (£5,910).26 At the provincial level, funding comes primarily from provincial taxes, municipal taxes, and volumetric charges on electric and / or gas utility bills.
There is no federal government loan programme. However, some provinces are offering discounted financing and many portfolio managers are exploring new financing options.
Type of Funding Public funding
Wires charge (electricity) Yes, in most jurisdictions, but not always funding existing homes programs
Gas “pipes” charge (natural gas)
Yes, in most jurisdictions, but not always funding existing homes programs
Levy on unregulated fuels Only in the province of Quebec
Tax Yes, the only source of funding at federal level and in many provinces.
Tax credit Yes, but only for 2009 as part of the federal economic stimulus policy.
Utility obligation Only as part of Integrated Resource Planning regulatory requirements
Financing of private investment
Government loan programs Not federally, but at least one province is offering discounted loans
26 This tax credit is not focused exclusively on efficiency retrofits. It covers any “home renovations”, including such things as new septic systems, home security systems, kitchen remodelling, and swimming pools.
International Comparison of Residential Energy Efficiency Programmes
40
Type of Funding
Utility loan programs Manitoba Hydro offers on‐bill financing. Efficiency New Brunswick offers interest‐free loans up to $10,000 (£5,910)
Property‐secured finance (PACE)
Under consideration in Toronto and possibly other municipalities
Energy mortgage products No, but federal government offers a 10% refund on mortgage insurance for energy‐efficient homes27
Dedicated institution (e.g., Green Bank)
No, but a proposal has been put forward to issue retail savings bonds to support green energy investment
Measures Promoted
The programme—in its various combinations of federal, provincial, and local efforts—is generally intended to have a whole‐house focus, promoting comprehensive, integrated efficiency solutions to building retrofits.28 This intention is made clear by the requirement for whole‐house building energy ratings, both pre‐ and post‐treatment. The very long list of measures eligible for incentives—including blower‐door‐guided air sealing; insulation upgrades of all types (walls, attics, floors, basements, etc.); efficient heating, central cooling, water heating and / or ventilation equipment; and / or efficient new windows‐‐further underscores this intention.29
That said, there is some evidence that HVAC contractors are using the programme simply to promote sales and installation of new heating systems. For example, current national programme data suggest that heating system replacements occur about as frequently as they are recommended (recommended in 65% of homes and replaced in 63% of participant homes). The only other measure pursued nearly as often as recommended is draft‐proofing. This is not surprising, because switching from an old standard furnace to a condensing furnace typically involves direct venting through a wall. Because the chimney flue is no longer needed, it can be sealed, with the attendant reductions in air leakage. In other words, draft‐proofing is often a welcome by‐product of other measures, rather than an intentional activity that is frequently pursued on its own. By contrast, all insulation measures are pursued only half as frequently (or less) as recommended.30 It is worth noting that furnace replacements have always been one of the most commonly pursued measures. However, insulation is installed notably less frequently under the current ecoENERGY programme than it was under the old EnerGuide programme.31
The prevalence of single‐measure participants is made possible by a couple of key programme design features:
27 http://www.cmhc.ca/en/co/moloin/moloin_008.cfm. 28 The focus is on efficiency retrofit measures. Micro‐generation is not addressed by the program. 29 Appliances and other plug‐loads are generally not addressed through this program, although they are addressed through other initiatives. 30 Natural Resources Canada, ecoENERGY Monthly Statistics Report, December 1, 2009. 31 For example, only 22% of current program participants install basement wall insulation—a significant drop from the 36% realized under the old EnerGuide program. Similarly, 28% of current participants install attic insulation, compared to 38% under the old EnerGuide program.
Canada
41
• Several provincial governments are highly subsidizing the audits and energy ratings;32 and
• The incentive structure is piecemeal or “à la carte”—allowing consumers to pick and choose which measures to pursue—and does not provide any inducement for being comprehensive (for example, there are no bonus incentives for multiple measures).
Measures “Whole‐house” deep and comprehensive Yes Limited measures
Appliances No, but addressed through other programs
Lighting No, but addressed through other programs
Solar water heating Yes Other efficient water heating equipment Yes Efficient windows Yes Biomass heating Yes Solar electric No Smart meters & in‐home displays No Behavioural measures No
Codes and Standards
There are no federal codes regarding the efficiency of existing buildings. However, at least one province (Ontario) appears to be ready to adopt a requirement that the efficiency of a home be certified and disclosed to potential home‐buyers unless the home‐buyer waives the requirement.33
In addition, federal and provincial standards both govern the minimum efficiency of home heating, cooling, refrigeration, and other equipment that can be installed in homes.
Supply Chain
Nationally, there are more than 1,700 individuals (working for approximately 100 firms) who have been certified to provide energy audits / ratings. That is sufficient to meet current demand for programme services within three or four weeks in the winter and within 1 week in the summer.34 That translates to a capacity‐to‐audit rate on the order of 500,000 to 700,000 homes per year—or between 5% and 7% of Canada’s low‐rise housing units to which the programme is targeted—assuming an auditor can perform two to three audits per 32 Without such subsidies, the cost of the audits and energy ratings would more than offset the rebate available for only a high‐efficiency furnace replacement. 33 The final rules, including whether there will be such a waiver option and what it might look like, are still in development. 34 Personal communication with Suzanne Deschenes, Office of Energy Efficiency, Natural Resources Canada.
International Comparison of Residential Energy Efficiency Programmes
42
day.
The federal programme provides only very limited support to the development of the private‐sector auditing industry, focusing only on “train the trainer” sessions for auditors / raters. The private sector is generally expected to develop the installer capacity on its own as well. Anecdotal evidence suggests that the quality of the installer industry—in terms of knowledge of building science and key elements of quality installation of key efficiency measures—is highly variable. Type of Industry Infrastructure Initiatives Publicly funded residential efficiency technician training programs
Very limited.
Industry‐funded residential efficiency technician training programs
Very limited, other than within individual businesses
Public / government quality certification of efficiency service providers
Only for auditors / raters, not for installers
Industry quality certification of efficiency service providers
None
Fuel Poverty
There is currently no federal programme designed specifically to promote efficiency retrofits for low‐income households, although this has been the focus of considerable advocacy and numerous proposals. In the past several years, many provincial and utility programs have begun to address the barriers faced by households in fuel poverty, some by offering increased incentives or covering 100% of the cost of services to income‐qualified, low‐income households and some through programs explicitly designed to offer low‐income energy efficiency services.
Most Significant Lessons Learned
There are a variety of key lessons that are worth noting from the Canadian experience. Chief among these are:
• Extensive pre‐ and post‐installation assessment can be beneficial, but can also be costly. The requirement of using a single, national, relatively sophisticated audit and rating procedure, as well as both pre‐ and post‐installation assessments, provides rich information and improves consumer protection. However, it can also be a barrier to participation when not heavily subsidized. Overall, the cost‐effectiveness of this strategy has yet to be evaluated. The audits and energy ratings typically cost on the order of $500 (£295) per home (for both the pre‐ and post‐assessments).
• It is important to focus incentives on results (installing efficiency measures), rather than on audits. In the early years of its initial EnerGuide programme, Canada offered substantial incentives—matched in some provinces—for the initial audits. The result was tens of thousands of audits, the overwhelming majority of which did not result in actual improvement work. Today, with much more of the money directed at
Canada
43
retrofit work, it appears as if more than two‐thirds of the customers receiving initial audits report at least some work completed.
• Financial incentives for individual measures can lead to less than comprehensive work. There is evidence that a significant portion of programme participants are pursuing just heating system replacements, leaving unaddressed other cost‐effective thermal envelope measures. . This could also lead to increases in the percentage of program participants who are free riders (that is, they receive incentives for activities they would have pursued anyway). Incentive structures that specifically encourage installation of multiple measures might be worth considering.
• Too much separation of audits from measure installation might be problematic. To maintain objectivity in assessments, the Canadian programme historically prohibited auditors / raters from selling installation services or even referring customers to installers. This might have been a major contributing factor to low implementation rates after audits in the early years of the programme. Since removal of that restriction, follow‐up rates have increased significantly.
• A Federal programme platform can be usefully leveraged locally. Virtually every residential retrofit initiative in Canada piggybacks on the federal programme, because it is comprehensive and offers large enough incentives. This practice allows for some experimentation with different “twists” on the federal programme; it might provide interesting lessons as it evolves.
DENMARK
Introduction
Denmark, although a fairly small country within the EU‐27, has long been a pioneer within the field of energy efficiency. It is now the only country within the original the EU‐15 that is actually an energy exporter. Despite this, excluding the transportation sector, it has not increased energy consumption in the other sectors since the late 1970s. In particular, its pioneering efforts in building regulatory requirements for new and existing buildings, and the introduction of energy performance certificates for buildings, have been exemplary. It is also a European leader in terms of the percentage contribution to renewable electricity generation made by wind; it is now approaching 25% of the annual generation.
Denmark envisions a society that is independent of fossil fuels. The two most important policies intended to achieve this vision are requirements: (1) on the electricity, gas, oil, and district heating companies to save approximately 40% of current energy use, and (2) to make improvements to the existing building stock, amounting to 25% savings from tighter regulations on renovations or replacement equipment, and greater promotion of building energy labels. Denmark has dedicated significant resources to research and development and design in energy development and technology, with specific branches of government‐funded activity dedicated to renewable energy and energy efficiency.1
Even so, Denmark currently expects to be approximately 9% above 1990 CO2
emissions levels in the 2008 – 2012 EU target period, in part because of increased coal‐fired generation.2 CO2 emissions are currently 0.2% higher than in 1990.3 Because space heating is the major end use of energy (excluding transportation), nearly half of the energy savings are expected to come from this end use. Denmark has a wide mix of sources for its two‐tiered electrical system (low voltage for “consumers,” and higher voltage for industrial use and longer transmission distances).
Some of the vision for Denmark is expected to be achieved by increasing funding for renewable energy. In terms of overall goals, compared to 2007 levels, the proportion of renewable energy must be doubled by 2025. In order to achieve these objectives the government has increased public budgets for energy research and development and design (RD&D). From 2005‐2006 to 2010 public funds for energy RD&D has been doubled to 1 billion DKK (£119,388 million) yearly.4
1 Danish Funding Programmes, Danish Energy Agency. http://ens.dk/en‐US/policy/Energy_technology/Danish_Funding_Programmes/Sider/Forside.aspx. 2 European Environment Agency, 2007. 3 IEA 2007. 4 Danish Energy Agency. http://ens.dk/en‐US/policy/Energy_technology/Sider/Forside.aspx.
International Comparison of Residential Energy Efficiency Programmes
46
Key Statistics
Housing and Its Environmental Impacts Population (2008) 5.5 million Housing units (est. 2010) 2.6 million % single‐family 63% + 26% flats5 % owner‐occupied (2007) 58%
% by space heating fuel
32% district heating 21% electricity 21% renewable energy 14% natural gas 11% fuel oil (oil + LPG)
Annual CO2e emissions (2007) Total (Mt) 51 Per capita (tons) 9.27 Residential CO2 emissions (Mt) 11.22 Residential % of total 22% Per dwelling unit (tons) 4.3 % of residential due to heating NA Carbon intensity of electricity 0.55 kg CO2 / kWh
CO2 emission reduction goal
21% from 1990 levels by 2012; 1.7% energy saving by 2013 of which most is to come from buildings.6
Overview of Building Energy Efficiency Initiatives for Existing Homes
The responsibility for meeting energy efficiency targets in Denmark is primarily on the electricity and gas suppliers. The targets are established cooperatively between government and several groups representing the energy industry nationwide. District heating providers do not operate under this set of targets and have separate, individual targets to meet. Funding energy efficiency in the residential sector has increased from pre‐2006 levels, when education and awareness campaigns were the norm.
Denmark pioneered the use of building labelling in the EU, with its Energy Performance Certificate mechanism, and levies a special tax on the sale of incandescent light bulbs.
Delivery Structure
Danish electricity, gas and oil distributors as well as heat distributors are subject to annual energy saving targets in the period 2006 ‐ 2013. The targets are expressed in final energy,
5 Eurostat 2007. Statistics Denmark 2008 shows 1.09 million detached, 0.38 million linked / terraced, and 1.05 million multifamily flats. 6 Danish NEEAP 2007.
Denmark
47
and only first‐year savings from projects are taken into consideration. The annual requirement is currently 2.95 pJ or 0.82 TWh (as of 2010, the target will be increased by 85% to 5.4 PJ per year). The targets are set as a voluntary sector agreement between the Minister of Energy & Climate Change and the Danish Energy Association, the Danish Petroleum Industry Association, Dong Energy, Naturgas Midt Nord / HNG, and Naturgas Fyn. In the case of district heating, there is no voluntary agreement and every single district heating provider follows an executive order and has an individual target to meet.
Targets are based on the average market share of electricity or gas distribution in the three preceding years. Savings in all end‐use sectors apart from transport are allowed; no supply side and network‐related measures are allowed at present, and fuel switching is eligible only if it reduces consumption. Historically, in 2005 the Danish electricity utilities used €6.7 / MWh (£5.9 / MWh) sold for energy efficiency activities (in total, €22 million, or £19.5 million). The majority of these costs were use for individual consultancy—for example, for energy audits in trade and industry. In 2005 the gas companies used 0.4€ / MWh (£0.35 / MWh) sold for energy efficiency activities (in total, €2.1 million, or £1.86 million). The gas utilities used 30% of the costs in the residential sector, but not for direct support of energy efficiency measures. From a very low level of activity, the energy savings from the residential sector have grown to 42% of the total savings in 2008.
There are 240 companies covered by the energy efficiency obligation. Even for electricity distributors, who account for nearly half of the annual target, there are 70 companies involved. Only the first year’s savings are considered and so this is likely to affect the measures chosen by the distributors to meet their targets as no differentiation is made between building measures (cavity wall insulation with more than 20 years’ technical lifetime) and behavioural measures (maybe with a 1‐year lifetime). Also, no difference is made between energy types: 1 kWh of district heating is considered equal to 1 kWh oil, natural gas, or electricity.
Prior to 2006, the obligations were mainly linked to the electricity distributors and were restricted to their own customers. In terms of how the €22 million (£19.5 million) was spent in 2005, most went to energy audits and subsidies for non‐residential customers. Activities in the residential sector were largely confined to information and awareness campaigns.
In 2008 savings were 50% industry and commerce, 8% public sector and 42% residential.
Role Who Plays Role Programme oversight, setting targets
Government sets target. Danish Energy Agency checks and issues certificates.
Accountability for delivering results
240 distribution companies (electricity, gas, oil, and heat).
Provision and installation of measures
Since 2006, the trading of obligations between distributors is permitted, as is purchasing savings from other market actors.
International Comparison of Residential Energy Efficiency Programmes
48
Role Who Plays Role
Provision of public information and education
Danish Energy Authority, Danish Electricity Saving Trust. Approximately €3 million (£2.6 million) is allocated per year in government funding for promoting energy savings in buildings. The 2000 Energy Conservation Act set up local energy conservation committees to coordinate local energy conservation drives, including initiatives that are carried out locally by the electricity, natural gas, and district heating companies.
Financial assistance Subsidies from the obligated distributors; they also have to provide advice on sources of finance.
Technical assistance Not specific for residential sector, since activity is based on well‐proven measures, and equipment suppliers and installers fulfil the advice to households.
Evaluation and savings verification
Danish Energy Authority receives aggregated information, but can check the documentation behind it.
Funding and Financing
Type of Funding Public funding Wires charge (electricity) Yes, to fund distributors’ activities Gas “pipes” charge (natural gas) Yes, to fund distributors’ activities Levy on unregulated fuels Yes, on oil and district heating
Tax High energy taxes (highest in EU), but not recycled
Tax credit NA Utility obligation Yes, but voluntary for electricity, gas, and oilFinancing of private investment Government loan programs NA Utility loan programs Yes Property‐secured finance (PACE) No Energy mortgage products NA Dedicated institution (e.g., Green
Bank) No
Measures Promoted
Compared to the UK, the distributors have focused more on the non‐residential sector: In 2008, savings were 50% in industry and commerce; 8% in the public sector; and 42% in the residential sector. This undoubtedly reflects the historic focus of energy efficiency and distributor activity to their own customers and the better links with larger companies.
Denmark
49
Major activity in the residential sector under the energy efficiency requirements has involved: appliances (cold and standby savers), CFLs, and heating improvements (condensing boilers, heating controls, and heat pumps). Insulation has played a lesser role in terms of absolute numbers, but contributed 9.5% of the residential savings of the 123 GWh annual energy savings reported in 2008.
Measures “Whole‐house” deep and comprehensive No Limited measures
Insulation (lofts, cavity walls, solid walls) Yes, some cavity walls Air sealing Not prominent
Heating / cooling equipment
Strong history of collective heating, plus oil and gas individual boilers. Over half the savings in fulfilling the 2008 energy efficiency requirements came from this activity. Little air conditioning in residential sector.
Appliances Important activity with cold appliances and stand‐by savers.
Lighting CFLs
Solar water heating Small numbers supported under energy efficiency requirements
Other efficient water heating equipment NA Efficient windows NA
Biomass heating Small numbers supported under energy efficiency requirements
Solar electric Very few numbers supported under energy efficiency requirements
Smart meters & in‐home displays 440,000 smart meters were installed in 2008, with 240,000 smart meters planned for installation in 2009.7
Behavioural measures Not at present
Codes and Standards
Denmark (as in all Scandinavian countries) has had an exemplary history of stringent building regulations, the most recent of which was implemented in 2005. In the 1990s, the country pioneered the Energy Performance Certificates (EPC) for buildings. The intention for 2010 regulations is to reduce energy use by 25% compared to 2005 regulations. Requirements in the Building Regulations for existing buildings relate to major renovations, change of heating supply, replacement of boilers, windows, and roofs. With regard to lighting, Denmark is the only country in Europe to have had a longstanding tax on incandescent light bulbs. Labelling and ratings at the time of sale of a housing unit are a legal requirement, but because it can be waived by mutual agreement between the buyer
7 Danish Energy Association, http://www.danishenergyassociation.com/Statistics.aspx.
International Comparison of Residential Energy Efficiency Programmes
50
and seller, recent research has shown that nearly half of sales / transfer transactions did not result in the issuance of an EPC.
There is also a commitment under the Danish NEEAP to tighten building regulations for existing buildings in 2010. This will occur via more effective individual components and also energy‐related requirements to be fulfilled in connection with major renovations of existing buildings. Compared to today, there will be a streamlining of the energy labelling scheme so that the labelling leads to more energy savings. One policy under consideration is the integration of energy labelling and status reports, to the greatest possible extent, into a joint scheme. Labelling has been found to be insufficient in ensuring a significant proportion of proven and economically attractive savings are realized.
An innovative proposal is to include proposals for financing in the Energy Performance Certificates. Inspection schemes are also being introduced for boilers and ventilation systems.
Supply Chain The Danish energy efficiency supply chain mirrors the experience of other European countries: historically it has been fragmented, diverse, and not considered cohesive.
Type of Industry Infrastructure Initiatives Publicly funded residential efficiency technician training programs
NA
Industry‐funded residential efficiency technician training programs
NA
Public / government quality certification of efficiency service providers
NA
Industry quality certification of efficiency service providers
The Danish Association of Consulting Engineers establishes and monitors qualifications for efficiency engineers.
Fuel Poverty
Fuel poverty is not an issue in Denmark.
Most Significant Lessons Learned
• Placing requirements on electricity distributors has largely worked — even with the requirements considered voluntary. The voluntary approach to energy efficiency obligations appears to be working. For example, in 2008, electricity distributors collectively surpassed their target by 25%. The district heating sector, which is legally required to meet its targets, collectively achieved that goal, even though several individual companies did not.
• The definition of the target can affect the type and extent to which different measures are installed. The relatively low level of insulation activities may well be linked to targets being specified in first‐year savings. That is, insulation measures can
Denmark
51
save energy and carbon dioxide for at least 30 to 40 years, but because the savings accruing to the target are registered only for the first year, there is little target‐related reason to install insulation relative to other less expensive measures.
• The certificate mechanism can be effective—but it needs periodic review and refinement. The fact that Denmark’s EPC mechanism is to be revised is of considerable interest, since it is the European country with the longest history of issuing EPCs. Equally important is the government’s conclusion that labelling the energy consumption of homes has been found to be insufficient to ensure that a significant proportion of the proven and economically attractive savings are realized.
• Monitoring how well requirements are being met is also important. Monitoring the political progress of a requirement should include specifications for major retrofits that include implementation of energy improvements listed in the EPC.
FRANCE
Introduction
France is one of the main countries within the EU‐27. Because of its relatively low reserves of indigenous fossil fuels, it has long seen Energy Security as a key energy policy driver. Consequently, in terms of nuclear power production, it is the “power house” of Europe and its carbon content in electricity production is extremely low, since the French have significant hydropower reserves as well.
The main policy tools relating to energy efficiency in the residential sector are building regulations, tax breaks for expenditure on energy efficiency measures, and the French White Certificate scheme (French National Energy Efficiency Action Plan).1
The French White Certificates have been in place since July 2006 and arose from the new French energy policy law passed in July 2005. It places an obligation on suppliers of electricity, gas, domestic fuel (but not currently for transportation), LPG, cooling, and heat to save energy in the residential and commercial markets.
White Certificates are a key part of the French policy to reduce energy intensity by 2% per year until 2015 and then by 2.5% until 2030. It particularly is designed to focus on the more diffuse potentials of energy savings in the residential and tertiary sectors and was intended to provide a new means of financing energy efficiency projects in these sectors.
The target is both set and administered by the French government. Over the period July 2006 to June 2009, the national target was 54 TWh lifetime savings of final energy with the energy savings discounted at 4% (known as TWh cumac). The target was shared out between the obliged energy suppliers based on their market shares by energy volume in the residential and tertiary markets and the prices of the energies. The target was exceeded by 20% and although energy can be saved in any end use sector, over 91% was saved in the residential sector.
Since January 2005 a tax credit is available for the costs associated with improving the energy efficiency of the main residence and using renewable energy sources. Tax credits of between 40% to 50% are available for heat pumps and between 25% to 40% for condensing boilers and insulation materials. There is also a reduced VAT rate for heating networks or from heat produced from at least 60% biomass, geothermal energy, or waste sources.
Another new financial incentive has been in operation since January 2007. Known as the Sustainable Development Account, it is a tax free savings account for consumers with an upper limit of €6,000 (£5,320) and a 2.75% interest rate free of tax. Individual households can benefit from the loans for carrying out energy saving work in existing dwellings using funds generated by the tax‐free Sustainable Development Account.
1 See http://ec.europa.eu/energy/demand/legislation/doc/neeap/fr_neeap_fr.pdf.
International Comparison of Residential Energy Efficiency Programmes
54
Key Statistics
Housing and Its Environmental Impacts Population (2008) 64.0 million2 Housing units (estimated for 2010) 26.7 million % single‐family 59% + 41% flats3 % owner‐occupied 58%4
% by space heating fuel
31% natural gas 30% electricity 20% fuel oil (oil + LPG) 18% other (renewables)
Annual CO2e emissions (2007) Total (Mt) 369 Per capita (tons) 5.7 Residential CO2 emissions (Mt) 88.5 Residential % of total 24%5 Per dwelling unit (tons) 3.31 % of residential due to heating NA Carbon intensity of electricity 88 kg CO2 / MWeh
CO2 emission reduction goal
Maintain CO2 equivalent emissions at 1990 levels in period 2008‐2012; currently expected to be ~4% below 1990 levels.6 In 2007, CO2 emissions were 5% higher than in 1990.7 At least 9% energy saving by 2016.8 Pro‐rated for residential sector: ~3.7 Mtoe.
Overview of Building Energy Efficiency Initiatives for Existing Homes
The main policy tools in the residential sector are related to building regulations, tax breaks for expenditure on energy efficiency measures, and the French White Certificate scheme.
Delivery Structure
The following table describes the essentials of the French delivery structure.
2 Eurostat, 2008. 3 Eurostat 2007. 4 Eurostat 2007. 5 International Energy Agency (IEA) 2007 and the national energy agency, ADEME. 6 European Environment Agency, 2007. 7 IEA, 2007 8 French NEEAP, 2007.
France
55
Role Who Plays Role
Programme oversight, setting targets
The French government sets the targets using the national energy agency ADEME as a technical advisor. The French government (particularly using its regional offices) is responsible for accrediting the energy savings.
Accountability for delivering results
An obligation is placed on ~ 2,500 energy suppliers (mainly suppliers of heating fuels), but more than 80% of the obligation falls on 2 companies: EDF (former state electricity monopoly) and GDF (former gas monopoly).
Provision and installation of measures
Mainly by installers and suppliers of energy saving measures.
Provision of public information and education
Energy suppliers, ADEME, regional administrations, and French chain of energy advice centres (187) funded by ADEME and local authorities.
Financial assistance
Limited incentives to date from the energy suppliers. Energy supplier marketing to households focuses on availability of 40 to 50% government tax credits for heat pumps, and between 25 to 40% for condensing boilers and insulation materials.
Technical assistance
Not specific for residential sector, since all activity is based on well‐proven measures, and because equipment suppliers and installers provide primary advice to households.
Evaluation and savings verification
Government and its regional offices are responsible for accrediting the energy savings. ADEME has published results to date in terms of savings, number of measures, and the extent of trading. To date, a detailed evaluation has not been published.
Funding and Financing
Type of Funding Public funding
Wires charge (electricity)
In principle, the law allows for the costs borne by energy suppliers in attaining White Certificates to be passed on via increased prices to the end user for those who still have regulated tariffs (for example, gas and electricity users in the residential sector). However, no such allowance was made for the first phase. The first phase was estimated to have cost the French Energy suppliers at least €60 million (£50 million) and possibly up to €180 million (£50 million) per year.
International Comparison of Residential Energy Efficiency Programmes
56
Type of Funding
Gas “pipes” charge (natural gas)
Same as above, plus a domestic natural gas consumption tax (TICGN) raising €170 million (£150 million) in 2006 is used to fund ADEME in part.
Levy on unregulated fuels
No explicit levy but oil suppliers have to fulfil the French white certificate obligation. However the main costs falls on electricity and gas suppliers.
Tax No.
Tax credit
Tax breaks are available to households for energy saving investments from a prescribed list. Also a reduced VAT rate for heating networks or from heat produced from at least 60% biomass, geothermal energy, or waste sources.
Utility obligation Yes. All suppliers of fuel (outside transportation) + heating / cooling providers
Financing of private investment
Government loan programs
In January 2007, the Sustainable Development Account (SDA; a tax‐free savings account for consumers with an upper limit of €6,000 [£5,318] and a tax‐free 2.75% interest rate) was established. Using funds generated by the tax‐free Sustainable Development Account, individual households can benefit from loans from the SDA for carrying out energy saving work in existing dwellings.
Utility loan programs No Property‐secured finance
(PACE) No
Energy mortgage products
NA
Dedicated institution (e.g., Green Bank)
No
Measures Promoted Measures “Whole‐house” deep and comprehensive
walls) Yes mainly roof / loft, since there are few cavity walls
Air sealing Not prominent
France
57
Measures
Heating / cooling equipment
All boiler replacements (not necessarily condensing boilers) are the most popular measure in the French White Certificates, along with heat pumps. The surprisingly high fraction of savings coming from heating savings (74%) is linked to two factors: (1) the availability of tax credits; and (2) the very high energy savings from replacing boilers as the savings awarded are not relative to the market average at the time of replacement but to the average efficiency of those in the existing housing stock. Heat pumps are also strongly promoted by EDF, appealing to consumers’ eligibility for tax breaks.
Appliances Follow EU regulations on labelling & minimum performance standards + white certificate incentives for “best in class”.
Lighting Although eligible for White Certificates on CFLs, little activity to date.
Solar water heating Yes but not one of the top 10 measures Other efficient water heating NA Efficient windows NA Biomass heating Yes but not one of the top 10 measures Solar electric Not under White Certificates Smart meters & in‐home displays Not at present.
Behavioural measures No deemed energy saving value has been established.
Codes and Standards
Energy requirements at time of sale of a housing unit must meet minimum EU performance standards for lighting and appliances. Labelling must also be displayed for appliances and lighting at time of sale. A Building Energy Performance Certificate is also required by an EU Directive at time of sale or new rental of a building.
Supply Chain Like most European countries, the historic energy efficiency supply chain has been rather fragmented and certainly more diverse and with less national presence than EDF or GDF. However these two energy suppliers have recently entered into the energy efficiency installation market by purchasing energy efficiency suppliers. However, this does not play a major part of either company’s current activities or turnover.
Fuel Poverty Fuel poverty is not separately identified as an issue in France. However, by law there is a public sector cost that acknowledges, among other things, the right of electricity for all
International Comparison of Residential Energy Efficiency Programmes
58
citizens as a “product of the first necessity.” This charge is used to lower the fuel bills of those classified as vulnerable.
Most Significant Lessons Learned
• White Certificates have worked—but only up to a point. The French White Certificate scheme has been successful in that it has exceeded its targets and is believed to have done so at less cost than was originally assumed by the French government. However, there are certain weaknesses relating to the rules governing the way that white certificates are restricted to third parties and the way that an unfair bias has been given to energy efficient heating improvements.
• Market transformation has not yet occurred. The existing rules mean that the normal retail outlet to households for energy efficient measures such as lighting and appliances are not being used to the maximum effect. To achieve the desired market transformation in these products, then the normal retail outlets for these need to be involved in the delivery of the energy efficient goods. As the first phase of the White Certificates explicitly forbade non‐obligated parties from increasing their sales through promotion of energy efficiency measures, these routes have not been used to the same extent as they are in the UK, for example.
• Surprisingly, heating measures dominate in a country with utility obligations. The dominance of heating measures is certainly in marked contrast to the experience in the other two European countries with significant utility obligations (Italy and UK). This reflects both the high deemed energy saving value of the measure compared to other countries and also the fact that boiler purchases are handled differently from all other market purchases in the French White Certificates.
• Energy suppliers will continue programs, even though no targets have been set. Despite the fact that the next phase will run from July 2010 (that is, a year with no formal target), the energy suppliers are continuing with their energy‐saving programs and as of early December, savings of 25 kWh cumac had been recorded, additional to the savings recorded at the end of June 2009.
• Some flexibility exists for energy suppliers and others to seek energy savings. The energy‐saving actions in France can be performed by either the obliged or non‐obliged companies provided they satisfy the additionality criteria. The main actors are the energy suppliers, local authorities, and large companies saving their own energy. The White Certificates are issued by the French Ministry of Economy, Finance and Industry after the completion of the energy efficiency action. For the first phase to July 2009, 77% of the 65 TWh cumac awarded were to obliged parties and the remaining 23% to non‐obliged parties.
• Setting parameters for trading certificates. It is possible to buy or sell certificates, but the volume traded has been very low (less than 4% of certificates). The average market price has been 0.32 euro cents / kWh cumac which is well below the penalty price of 2 euro cents / kWh. The sellers have been mainly eligible parties such as local authorities and some companies. EDF has said that it will not use the market and such a statement from a large obligated party appears to have affected the French marketplace which has developed even more slowly than the Italian one.
GERMANY
Introduction
Germany is a federation whose state governments bear the responsibility for the implementation of the federal law, but they can also implement their own types of energy policy. The federal state governments and municipalities finance a large range of measures to improve energy efficiency, in particular through loans and grants to industries and commerce.
Federal states have no obligation to report their activities to the federal government. Germany sees energy efficiency philosophically as a key method for slowing or correcting climate change. Pragmatically, it combines research, technology innovation, and aggressive policy implementation to meet its carbon targets.
Germany’s building stock is already relatively efficient, primarily because it is comparatively new and many buildings in the eastern part have been abandoned because of the migration of the population from the East to the West. The existing building codes are strong and so most of the energy saving is envisaged as coming from the existing housing stock.
Key Statistics
Housing and Its Environmental Impacts Population (2008) 82.2 million Housing units (2007) 39.9 million % single‐family1 62% % owner‐occupied 46%
% by space heating fuel2
47% natural gas 20% electricity 18% fuel oil (oil + LPG) 9% renewables 5% district heating 1% coal
Annual CO2e emissions (2007) Total (Mt) 944.3 Mtoe3 Per capita (tons) 9.714
1 Consumers in Europe: An extensive range of statistics on consumers. Eurostat (Statistical Office of the European Communities), and the General Directorate Health & Consumers of the European Commission. 2009. p. 24. http://epp.eurostat.ec.europa.eu/cache/ITY_OFFPUB/KS‐DY‐09‐001/EN/KS‐DY‐09‐001‐EN.PDF. 2 See News release for “Consumers in Europe,” p. 3. At http://epp.eurostat.ec.europa.eu/cache/ITY_PUBLIC/3‐26062009‐AP/EN/3‐26062009‐AP‐EN.PDF. 3 Eurostat 2007. 4 CO2 Emissions from Fuel Combustion—Highlights 2009 Edition. Paris: Organisation for Economic Cooperation and Development / International Energy Agency. 2009. See also : http://knowledge.allianz.com/en/globalissues/climate_profiles/climate_germany/climate_profile_germany_facts.html.
International Comparison of Residential Energy Efficiency Programmes
60
Housing and Its Environmental Impacts Residential CO2 emissions (Mt) 255 Residential % of total 27%5 Per dwelling unit (tons) 6.4 % of residential due to heating 23%6 Carbon intensity of electricity 612 kg CO2 / MWeh
CO2 emission reduction goal
Germany has the EU‐27’s highest GHG emissions, at 944.3 metric tons of CO2 equivalent. However, as of 2008, it has decreased its emissions from 1,232 Mt CO2e baseline emissions to 0.3% below its Kyoto 2008‐2012 target, with CO2 alone dropping 41.3% from 1990 to 2007.7 It has a goal of reducing CO2
emissions by another 40% (from 2007) by 2020.
Overview of Building Energy Efficiency Initiatives for Existing Homes
The main energy savings from Germany in the residential sector are expected to come from a continuation of the successful low‐interest loans for energy efficiency investments run by the Kreditanstalt für Wiederaufbau (KfW) development loan bank. These loans go hand‐in‐glove with tailored advice for households, particularly from the Federation of German Consumer Organisations. The loans are provided by the KfW Förderbank, a type of “promotional” bank begun in 1948 and which is now 80% owned by the German government and 20% owned by the federal states. It has developed one of the largest European financing programs, designed to reduce the impact of the residential sector on climate: the Energy Efficient Construction and Rehabilitation programme. It is divided in four subprograms: “CO2 Building Rehabilitation,” targeting building constructed before 1983; “Housing Modernisation”; “Ecological Construction”; and the “Infrastructure Programme” for municipal investments (see Funding and Financing for more details).
Under the Housing Modernisation programme, an additional ECO‐Plus subprogram
5 Electricity / heat in Germany 2006, International Energy Agency. Calculated by dividing Residential sector GWh (141,500) by total final consumption GWh (525,804). Between 2006 and 2007, Germany’s GHG emissions “dropped substantially,” because of heating demand reduction caused by an increase in the value‐added tax on fuels, warmer weather, and increases in energy efficiency in the residential sector. “Greenhouse Gas Emissions Trends and Projections in Europe 2009,” European Environment Agency. Copenhagen: EEA. p. 41. http://www.iea.org/stats/electricitydata.asp?COUNTRY_CODE=DE. 6 One government estimate is that 86% of residential energy use is for heating. With total residential energy consumption at 27% of total energy consumption, 23.22% is assumed for residential heating. The German Heating and Cooling Industry, Germany Trade and Invest, Berlin. October 2009. http://www.gtai.com/fileadmin/mediaFiles/IndustryOverview_HeatingCooling_October2009_GTAI.pdf. 7 See “Greenhouse Gas Emissions,” p. 137.
Germany
61
allows replacement of heating systems and windows, thermal insulation of the exterior walls of buildings. Homeowners can borrow up to the maximum loan amount available‐‐€50,000 (£44,300) per housing unit for qualifying measures.
Delivery Structure
Role Who Plays Role Programme oversight, setting targets
Federal government
Accountability for delivering results
Contractors performing services; they can lose their certification if complaints are logged against them.
Provision and installation of measures
Certified contractors
Provision of public information and education
Federal government. The federal government's "On Location Consultation Service" assistance programme targets homeowners, providing them with competent information about suitable and cost‐effective energy conservation measures. The federal government covers part of the consultation costs.
Financial assistance Kreditanstalt für Wiederaufbau (KfW) Technical assistance Designated / certified contractors Evaluation and savings verification
NA
Funding and Financing
There are mechanisms at the EU level to finance efficient use of energy. These include:
• The Intelligent Energy Europe programme (IEE), which supports non‐technological actions to encourage sustainable energy; it has a budget of €730 million (£647 million) for 2007‐2013; and
• The Seventh Framework Programme (FP7), which helps develop new efficiency and renewable energy technologies and get them to market
However, it is the KfW financing source that dominates the German residential efficiency market. Nearly all of the KfW loan interest funding is directed at redeveloping and improving existing residential buildings. Loans are available to all individuals, as well as to public or private organisations investing in owner‐occupied or rented residential buildings. The terms and conditions of the loans are very attractive: low‐ and fixed‐interest rates, long‐term loans, the possibility of prepayment of outstanding loan amounts at any time and at no extra charge, high ceiling of the loan (up to 100% of the investment), no commitment fee, and seemingly unlimited possibilities to combine the loan with other public funds.
The types of energy‐efficient projects eligible vary from one programme to another, but requirements of the Energy Conservation Ordinance must always be met. For example, the Ecological Construction programme provides loans for construction, set‐up, and first
International Comparison of Residential Energy Efficiency Programmes
62
purchase of a house whose annual needs in primary energy do not exceed 40 kWh per square meter per year. Under the Carbon Dioxide Building Rehabilitation programme, a major activity is improving heating in existing residential buildings, including replacing storage radiators, a form of direct electrically central heated system. Financing the installations of new heating technology with renewable energies, combined heat and power, and local and district heating are also possible. In new buildings, the financial support from KfW is targeted at promoting Passivhaus technology and other energy‐saving houses with an energy consumption of less than 60 or 40 kWh per square meter per year.
However, although KfW undertakes nationwide promotion of the availability of the loan schemes, all lending is done through existing financial institutions at the local level. To obtain a loan from KfW, applicants can go to any commercial bank (usually their regular bank), which will lend the money after the usual credit checks. The bank then transmits the request to KfW. In making the loan application, the applicant must include a certification by an energy expert, ensuring that the measures will indeed permit the attainment of the energy savings required by the terms of the loan.
By May 2006, the Carbon Dioxide Building Rehabilitation programme had lent more than €5 billion (£4.4 billion) in energy‐related programs and in 2008, €5.6 billion (£4.9 billion) was committed by KfW for energy efficiency construction and retrofit in the residential sector.8 This helped more than 230,000 households and was estimated to generate a total investment of over €11 billion (£10 billion) and create employment equivalent to 183,000 jobs. The KfW programme claims that since 2006, it has achieved a reduction in CO2 emissions by approximately 2.2 million tons per year and at the same time saved household energy worth approximately €188 million (£166 million) per year.
More recently, the Carbon Dioxide Building Rehabilitation programme now offers subsidies for energy saving investments, as well as the loan variants. The grants vary from between 5 and 17.5 % depending on circumstances and the energy saving measures. The interest rate is fixed for the first ten years and is lower than normal commercial rates. There are further incentives to improve the energy performance of the property during the retrofit, because the better the subsequent performance, the more the “bonus” that is taken off against the loan value. This can be up to 12.5% if the completed property performs 30% better than the current new‐building standard.
The market has been completely liberalised since 1988, and about 600 companies operate in the electricity market. They are a mixture of privately and municipally owned utilities but there now are 4 large and dominant integrated supra‐regional utilities: E.ON Energie AG, EnBW AG, RWE AG, and Vattenfall Europe AG. These companies generate, transmit, and supply electricity to end users. However, switching of energy suppliers in the residential sector has been fairly low, with an aggressive new entrant, Yellow, making a big play on its smart meters for household use.
Further, the European Regional Development Funds (ERDF), European Social Fund (ESF) and Urban Development Funds (UDFs) accelerate investment in urban areas. And the Risk Sharing Finance Facility (RSFF) provides additional support to research, development,
8 The IEA Country Energy Study: Germany 2007. Presentation by Monika Beck September 2009. http://re.jrc.ec.europa.eu/energyefficiency/pdf/Proceedings_Istanbul_2009/9_BECK.pdf
Germany
63
and innovation projects in Europe. The first RSFF financing operations focus on renewable energy technologies, a priority for the EIB in 2007.9
Type of Funding Public funding
Wires charge (electricity) The EU finances gas and electricity infrastructure projects, via competitive bid.
Gas “pipes” charge (natural gas)
See above.
Levy on unregulated fuels NA
Tax
In 2007, Germany announced it would dedicate €3 billion (£2.66 billion) in energy efficiency technologies. Owners of dwellings receive a federal grant if they are given on‐site advice by professional experts on potential energy conservation measures.
Tax credit
Germany remunerates citizens and companies that install renewable energy measures, saving 56 million tons of CO2 in 2008 through the Renewable Energy Sources Act (EEG). Even in times of financial crisis, investments will continue to be made in this area, because of solid legal arrangements such as the EEG, which in 2009 continue to provide a basis for granting loans.
Utility obligation No federal obligation; some municipality‐owned local utilities run voluntary energy efficiency programs.
Financing of private investment
Government loan programs
The federally owned Kreditanstalt für Wiederaufbau (Development Loan Bank) also offers homeowners low‐interest loans for qualifying energy efficiency improvements. Further assistance options are available through the market incentive programme to foster the use of renewable sources of energy.10
Utility loan programs NA
9 “Funding for Sustainable Energy,” ManagEnergy, European Commission Directorate‐General for Energy and Transport. 10 “Energy Efficiency Policy for Households in Germany,” Sustainable Energy Policy Concepts (SEPCO), Section 2.2. http://www.ises.org/sepconew/Pages/EE_Policy_in_Germany/2.html.
International Comparison of Residential Energy Efficiency Programmes
64
Type of Funding
Property‐secured finance (PACE)
Although not a PACE programme, energy‐saving contracting is a contractual service between a contractor (or energy‐saving partner) and a building owner. The contractor makes investments and performs energy‐saving measures in the building. The contractor is then paid for these efficiency measures relative to the cost savings for the building's energy consumption. The building owner does not have to make investments, does not run any risks, and nevertheless contributes to the success of the efficiency measures. Efficiency contracting includes measures that start behind the meter—that is, everything that lowers consumption of heat or electricity. The yields usually consist of saved electricity, heating and water costs. That is, electricity prices are not the only influence on economic results. Contracting projects are used wherever building owners lack the means of financing or the know‐how needed to increase efficiency.11
Energy mortgage products NA
Dedicated institution (e.g., Green Bank)
Kreditanstalt für Wiederaufbau (KfW), specialising in funding renovations to existing buildings, primarily residences, and small‐ to medium‐sised businesses. Its parent company, KfW Gruppe, stimulates investment in economic, social, and “ecological” development worldwide. See http://www.kfw.de/EN_Home/KfW_Bankengruppe/index.jsp.
Measures Promoted
Germany is aggressive in its efforts to reduce carbon emissions, and combines substantial public investment in research and development with quality‐controlled installation practices of efficiency measures. These efforts have paid off, since Germany has exceeded in 2009 its Kyoto Protocol targets for 2010, and is continuing to identify ways to reduce its EU carbon emissions targets even further. Its approach is across all sectors, including the residential sector.
Germany's renewable industry owes much of its success to the Renewable Energy Sources Act initially passed in 2000. The Act established incentives for long‐term investment, efficiency standards, fixed pricing per kilowatt‐hour produced from renewable energy sources for 20 years, and feed‐in tariffs that help level the playing field among energy sources and guarantee grid access for renewable sources.12
11 “Energy Efficiency Policy in Germany,” Section 2.4. 12 “Green jobs: A foundation for the new American economy?” Environmental and Energy Institute, Washington, DC. January 2009. http://www.eesi.org/012809_green_jobs.
Germany
65
Measures “Whole‐house” deep and comprehensive
CO2 Building Modernisation Programme launched in 2001 saves energy and makes use of “potentials” for reducing CO2 in existing buildings “more quickly and more thoroughly.” The Federal government provided €1.4 billion (£1.24 billion) per year from 2006 to 2009 in subsidised interest rates and partial debt relief to encourage participation.13 In addition, there are incentives for installing certain technologies, such as €500 (£443) for pellet stoves, and various incentives for boiler exchanges with solar thermal installations.14
Limited measures
Insulation (lofts, cavity walls, solid walls)
Under the CO2 Building Modernisation Programme, funds are available to houses and flats for insulation.
Air sealing
Researchers believe that retrofitting existing buildings to Passiv Haus standards is possible and would result on average in a reduction of 65% of their energy use. Research and policy development are under way.15
Heating / cooling equipment See above.
Appliances Efficiency ratings of all electrical appliances are standard.
Lighting EU mandatory phase‐out of all incandescent bulbs began in 2009, beginning with 100‐watt bulbs; all products to be replaced by September 2010.16
Solar water heating Yes Other efficient water heating
equipment Yes
Efficient windows Yes
Biomass heating Yes, limited application of this measure. More is planned.
Solar electric Excess electricity generated by home solar panels can be sold back to the grid.
13 “Integrated Climate and Energy Policy,” German Federal Government information website. http://www.bundesregierung.de/nn_6516/Content/EN/StatischeSeiten/Schwerpunkte/Energie‐der‐Zukunft/integrierte‐klima‐und‐energiepolitik.html. 14 German Heating and Cooling Industry, pp. 7‐8. 15 “Saving the Climate and Saving Money,” Germany Federal Government information website. January 2008. http://www.bundesregierung.de/nn_6516/Content/EN/Artikel/2008/12/2008‐12‐01‐hightech‐serie‐energie‐sparen‐fuers‐klima‐und‐den‐geldbeutel__en.html. 16 Jung, Alexander, “Getting around the EU Ban: Germans Hoarding Traditional Light Bulbs.” Honolulu: Bastiat Institute. http://www.bastiatinstitute.org/?p=220.
International Comparison of Residential Energy Efficiency Programmes
66
Measures
Smart meters & in‐home displays
Starting in 2010, smart meters will be installed in new buildings. By 2015 one‐fourth of the nation’s old meters are slated to be replaced. Starting in 2011, German utility companies will have to provide load‐based or time‐of‐day‐based power saving incentives. All major German energy suppliers are now testing smart meters, but only 0.01 % of all meters are smart. The reason for the hesitancy is that, according to a study by Accenture, replacing one‐fourth of the electric meters in Germany would cost about €1 billion and take 5,000 person‐years.17 (Siemens information.)
Behavioural measures
Germany implemented in 2008 the EU directive on energy efficiency that informs electrical consumers more frequently than once a year about their electrical consumption habits.
The Fraunhofer Institute for Solar Energy (ISE) Systems in Freiburg, Germany, examined how consumer behaviour can help stabilise power grids. In a research project in Karlsruhe‐Stutensee, approximately 100 private households were equipped with communication‐capable electric meters that were connected to a computer at a transformer substation.
Codes and Standards
Buildings currently account for 40% of Germany’s energy use, and thus reducing building energy consumption through stronger standards and codes is a priority. Germany instituted its Energieeinsparungverordnung (Energy Efficiency Ordinance) in 2007, and then revised it with stronger standards in 2009, with a view to linking building energy efficiency standards to controlling climate change.
The new law contains the following key elements:
• Increasing the efficiency performance for new buildings and existing buildings, across all sectors, by 30%.
• Insulating uninsulated spaces between floors—now through 2011.
• The step‐by‐step elimination of electric hot‐water tanks from designated buildings, beginning in 2020, depending on the size of the building, the number of housing units, and how well it is insulated.
17 “Pictures of the future – fall 2008,” Stabilizing the Grid. Siemens AG website: http://a1.siemens.com/innovation/en/publikationen/publications_pof/pof_fall_2008/gebaeude/zaehler.htm.
Germany
67
• Incentives for installing renewable energy measures. Excess energy produced by these measures, beyond the building’s energy requirements, can be sold back to the grid. Similarly, excess energy from primary‐energy liquid and gas biomass measures installed near the building can be used to power other nearby buildings.18
• Issuance of the Energy Passport, a 4‐page energy performance certificate, for every home when it is sold or made available for lease.
Supply Chain
Type of Industry Infrastructure Initiatives Publicly funded residential efficiency technician training programs
Contractor training through technical training institutes
Industry‐funded residential efficiency technician training programs
NA
Public / government quality certification of efficiency service providers
Yes, for contractors
Industry quality certification of efficiency service providers
NA
Fuel Poverty
Fuel poverty is not addressed programmatically in Germany.
Most Significant Lessons Learned
Ever since Germany instituted its Energy Saving Ordinance in 2001, and with its various iterations (culminating most recently with a new version in 2009), it has become a serious model for other countries to follow. Together with its Thermal Insulation Ordinances, Germany has achieved CO2 reductions that are meaningful and replicable.
Germany’s approach is comprehensive, reaching into all aspects of everyday total energy consumption.19 Among them:
• Advisory services. Services and agencies provide “onsite advice” in many residential buildings.
• Good, available information. Federal government energy information is plentiful, well‐written, and easily accessible.
18 “Energieeinsparung,” Bundesministerium für Wirtschaft und Technologie [Energy conservation. Federal Ministry for Administration and Technology]. http://www.bmwi.de/BMWi/Navigation/Energie/energieeinsparung,did=190680.html?view=renderPrint. 19 The remainder of this section is drawn from “Energy Efficiency Policy in Germany,” Sustainable Energy Concepts. Freiburg, Germany: International Solar Energy Society. http://www.ises.org/sepconew/Pages/EE_Policy_in_Germany/2.html.
International Comparison of Residential Energy Efficiency Programmes
68
• Politicising comprehensive energy efficiency works. Seeing the link between energy efficiency and climate protection became an approach that could be politicised. The Federal Ministry of Economics and Technology (BMWi) founded the German Energy Agency (Deutsche Energie‐Agentur) and the KfW to provide information on energy efficiency and the use of renewable energy, along with measures to improve energy efficiency in buildings and of electrical appliances.
• Building effective collaboratives at the regional level. The government works with consumer associations, consulting organisations, engineers, and regional energy agencies to achieve collaborative outcomes that benefit German citizen homeowners‐renters.
• Serious pursuit of renewable energy. Renewable energy is now a serious adjunct to the nation’s energy portfolio, accounting for more than 9% of the total energy supply.
• Making energy efficiency investments affordable to homeowners, and relatively easy to obtain. The KfW makes low‐interest loans available for making residential buildings more energy efficient and / or for installing renewable energy measures.
• Least‐cost / integrated resource planning is a priority. Germany has a robust least‐cost planning or integrated resource planning approach among the country’s 85‐plus utility companies.
However, the greatest obstacle that energy‐saving programs face is the fact that every kWh of electricity saved on the meter is a kWh of lost earnings for the utility company. This effect was already undesirable back when utilities had absolute monopolies in the areas they served. During the age of monopolies, utility companies were, however, able to compensate for the more narrow profit margins brought about by LCP saving programs by raising rates. The supervisory State Economic Ministries (Länderministerien für Wirtschaft) generally approve such rate hikes to finance energy‐saving programs.
• Easy, favourable loan programs are not being used enough. Although the KfW programme is rightly lauded as a success, does it effectively reduce CO2? In 2008, €5.6 billion (£4.9 billion) was committed by KfW for residential energy efficiency construction and retrofits. As reported above, hundreds of thousands of households received assistance, and nearly 200,000 jobs were created. Furthermore, as well as offering loans on advantageous terms, KfW has recently introduced subsidies for energy‐saving investments; they range from 5 to 17.5%, depending on circumstances and the expected energy savings. The interest rate is fixed for the first 10 years and is below commercial market rates. But in a country of nearly 40 million households, in two years, only 1% have availed themselves of the programme. The question remains: How to stimulate widespread consumer interest?20
• Better buildings, maybe, but they still need energy efficiency retrofits. The 230,000 homes improved each year in Germany is still a modest number, compared to the more than 20 million households in Germany that KfW estimates needs to be
20 Source German National Energy Efficiency Plan (2007) http://ec.europa.eu/energy/demand/legislation/doc/neeap/germany_en.pdf.
Germany
69
tackled.21 And this, despite the fact that the quality of the building stock is considered to be much higher in Germany than in the United Kingdom.
21 Presentation by Monika Beck September 2009 http://re.jrc.ec.europa.eu/energyefficiency/pdf/Proceedings_Istanbul_2009/9_BECK.pdf
ITALY
Introduction
Italy is a major EU‐27 country. It has a high structural dependency on energy from foreign sources, currently just under 86%, with an upward trend. The country’s sole indigenous resources are renewables and energy efficiency gains. Its high energy dependency also impacts on the country’s energy procurement cost. It has several climatic zones, ranging from the mountainous and cold North to the South. Because of the historically high taxes on electricity and limitations on maximum electricity demand, the residential energy use per household is significantly lower than the EU‐15 average.
Key Statistics
Housing and Its Environmental Impacts Population (2008) 59.6 million Housing units (Eurostat estimate for 2010) 22.9 million % single‐family (2007) 41% + 53% flats % owner‐occupied (2007)1 72%
Annual CO2e emissions (2007) Total (Mt) 438 Per capita (tons) 7.35 Residential CO2 emissions (Mt) 65.7 Residential % of total 15% Per dwelling unit (tons) 2.9 % of residential due to heating NA Carbon intensity of electricity 429 kg CO2 / MWeh CO2 emission reduction goal NA
Overview of Building Energy Efficiency Initiatives for Existing Homes
Italy has recognised a need for improving its deteriorating housing stock. An increase in residential air conditioning has contributed to the shift in peak demand from winter to summer, and so energy efficiency is taking on greater importance as a policy priority.
The main policy tools to deliver most of the energy savings expected in the residential sector by 2016 are related to Government subsidies, tax breaks and energy efficiency obligations (the Italian White Certificates).2 The two major measures expected in 1 Demographic information obtained from Eurostat statistics. 2 Italian National Energy Efficiency Plan 2007, http://ec.europa.eu/energy/demand/legislation/doc/neeap/italy_en.pdf
International Comparison of Residential Energy Efficiency Programmes
72
the Italian NEEAP to contribute to savings in the residential sector by 2016 are incentives (tax breaks and White Certificates) to install efficient heating systems and insulation of pre‐1980 buildings.3
Italian White Certificates have been in place in Italy since January 2005. They are an obligation on electricity and gas distributors to save energy in the properties and premises to which they distribute. The obligation now covers 14 electricity distributors and 61 gas distributors in Italy. Enel (former state electricity monopoly) now has ~87% of the electricity obligation and 3 gas distributors have ~45% of the gas obligation.
The Italian Government was responsible for setting the size of the obligation, and in the Italian National Plan, it is expected that one‐third of the expected carbon dioxide savings by 2012 will come from the White Certificate activities. The White Certificates have always been driven by the Italian Kyoto commitments and were designed to cohere with the framework that Italy would be expected to meet under the EU Directive of Energy End Use Efficiency and Energy Services. Another important objective was to encourage the development of an energy services market.
The White Certificates cover all energy end users. Although in principle any fuel can be saved, in practice, electricity to October 2009 accounted for 74.7%, gas for 21.9% and other fuels for only 3.4% of White Certificates issued by the Italian electricity and gas authority, AEEG.
The income tax breaks are significant and cover insulation, windows, and even appliances. Gross tax deduction equal to 55% of the amounts remaining payable by the taxpayer, up to a maximum deduction of €60,000 (£53,220), subject to meeting the thermal conductivity (U) requirements expressed in watts per square meter K of Table A appended to the Finance Act. The upper limit of eligibility of €60,000 per property would appear to encourage significant refurbishment. Eligible measures on existing buildings or parts of them include vertical and horizontal opaque structures (roofing and flooring) and windows (including frames), installing solar panels to produce hot water for domestic purposes. For installations provided with condensing boilers and simultaneous updating of the heat distribution system, the upper limit is €30,000 (£26,610).
Replacement of refrigerators, freezers and combinations thereof by similar appliances of energy class not inferior to A+ is eligible for gross tax deduction equal to 20% of the amounts remaining payable by the taxpayer, up to a maximum deduction of €200 (£177) per appliance, in a single instalment.
3 For more details on this and other action in the residential sector, see Energy Policies of IEA Countries – Italy 2009 Review, Paris: OECD, pp. 41 – 49. Available via Google Books at http://books.google.com/books?id=spcaPlVOyZYC&pg=PA44&lpg=PA44&dq=NEEAP+Italy&source=bl&ots=mzNg00Przx&sig=yRtkr75tSepBqFR1sjX__SKjw5Y&hl=en&ei=iGWAS7PeKNff8AbSj9mUBg&sa=X&oi=book_result&ct=result&resnum=10&ved=0CCkQ6AEwCQ#v=onepage&q=NEEAP%20Italy&f=false.
Italy
73
Delivery Structure
The table below shows the various roles in setting the targets for saving energy efficiency in the residential sector, particularly for the white certificates mechanism. Because of the structure of the Italian electricity and gas distribution systems, ENEL (former state electricity monopoly) now has ~87% of the electricity obligation and 3 gas distributors have ~45% of the gas obligation. There are exemptions for small distributors which distribute to fewer than 50,000 customers.
Role Who Plays Role Programme oversight, setting targets
Energy‐saving targets set by government; oversight and reporting by energy regulator AEEG
Accountability for delivering results
Electricity and gas distribution companies with more than 50,000 customers
Provision and installation of measures
More than 80% of the energy savings (White Certificates) were issued for energy efficiency projects implemented by non‐energy obligated parties such as installers of energy efficiency measures and a small contribution from “genuine ESCOs.” The non‐obligated companies can sell the White Certificates on the trading market administered by the Electricity Market Operator, or they can enter into bilateral (over the counter) agreements with the obligated distributors.
Provision of public information and education
The National Network of Local Agencies and APAT (the Agency for Environment Protection and for Technical Services) are responsible for activities concerning the information, communication, and education campaign in support of renewable energy sources and energy end‐use efficiency.
Financial assistance Incentives from Italian White Certificates, plus tax breaks and further financial incentives on certain measures.
Technical assistance Not specific for residential sector, since all activity is based on well‐proven measures, and equipment suppliers and installers advise households.
Evaluation and savings verification
The Italian Regulator (AEEG) is responsible for the development and definition of technical rules, administration, monitoring, and enforcement of the whole mechanism.
Funding and Financing
The table below shows the various funding sources for saving energy efficiency in the residential sector. Annual expenditure on White Certificates in 2008 is estimated to be
International Comparison of Residential Energy Efficiency Programmes
74
around €200 million (£177 million) per year. Despite being open to saving energy in all sectors, 84% of savings in the period 2005 ‐ 2008 were delivered in the residential sector.
Type of Funding Public funding Wires charge (electricity) Yes: 0.89 euro / toe annual primary energy saved Gas “pipes” charge (natural
gas) Yes: 0.89 euro / toe annual primary energy saved
Levy on unregulated fuels No: Electricity and gas distributors can save and claim 0.89 euro / toe annual primary energy saved
Tax No
Tax credit
Gross tax deduction equal to 55% of the amounts remaining payable by the taxpayer, up to a maximum deduction of €60,000 for many energy efficiency measures e.g. insulation, glazing, boilers, solar water heating (20% tax deduction for refrigeration products at A+ label or better).4
Utility obligation
Yes – electricity and gas distributors to achieve in 2009 cumulative annual energy savings of 3.2 Mtoe with cost recovery equal to target multiplied by 0.89 euro/toe annual primary energy
Financing of private investment
Government loan programs No, but government establishing a €45 million (£39.8 million) fund for financing very‐high‐efficiency buildings.
Energy mortgage products No Dedicated institution (e.g.,
Green Bank) None
Measures Promoted
The data table below summarises the overall approach and range of measures used to tackle energy efficiency improvements in the existing housing stock in Italy. Of the energy savings from Italian White Certificates in the period 2005 ‐ 2008, saving electricity in households contributed to 60% and heating improvements in households contributed to 23%. CFLs dominated the energy savings followed by low‐flow shower heads. It is noticeable that these are inexpensive initial cost measures. The Italian distributors have undertaken very little insulation efficiency. In contrast, 230,000 square meters of solar water heating systems were installed in the same period.
There are plans to stimulate the installation of conditioning systems and appliances
4 Italian NEEAP 2007.
Italy
75
with seasonal energy efficiency ratio of at least: Autonomous installation: 3.3, and centralised installation: 4.1. At present, the planned drivers for this are information, EU minimum performance standards, and promoting ESCOs for centralised installations. No financial incentives appear to be planned at present. Measures “Whole‐house” deep and comprehensive
Not explicitly, but the size of the available tax credit should encourage
Limited measures Insulation (lofts, cavity walls,
solid walls) Yes, but few cavity walls exist. Current installation rates do not match Italian NEEAP.
Air sealing Not prominent
Heating / cooling equipment
Important, because condensing boiler penetration is ~10% of market. There is also a growing demand for household air‐conditioners, and peak demand for electricity is now in the summer. Italy has a plan for 44% of buildings to have high‐efficiency boilers by 2016, and 0.25 million heat pumps installed between 2008 and 2016.
Appliances Follow EU regulations on labelling and minimum performance standards. Also: tax incentives and White Certificate incentives for “best in class.”
Lighting Current major focus in White Certificates on CFLs will end as EU phasing‐out of incandescent light bulbs comes into force.
Solar water heating Plan to have 1 million installations between 2008 and 2016.
Other efficient water heating equipment
NA
Efficient windows NA
Biomass heating 0.78 million properties heated by wood burning – plan by 2016 to improve efficiency of them via A‐rated stoves.
Solar electric 3,000 MW by 2016 through feed‐in tariffs—currently ~0.4 euro / kWh (not integrated with roof) and ~0.49 euro / kWh if integrated.
Smart meters & in‐home displays
Every home has a “smart meter,” but few have displays and / or 2‐way communication.
Behavioural measures
Obligated energy distributors can earn bonus of 5% of technical measure savings by promoting the diffusion of correct and complete information to final customers.
International Comparison of Residential Energy Efficiency Programmes
76
Codes and Standards
Codes and standards for whole‐building performance exist, but they vary by region / municipality. There are six climatic zones in Italy, and energy policy is partially delegated by the Constitution to the 20 regions.
With regard to existing homes, energy requirements at the time of sale must meet EU minimum performance standards for appliances and lighting. In keeping with other EU directives, energy performance labelling of appliances and lighting must be displayed. Building Energy Performance Certificate, as required by EU Directive at time of sale or new rental of a building, is a practice that was operational in only three regions by August 2008.
Supply Chain
Like most European countries, the historic energy efficiency supply chain has been rather fragmented and certainly more diverse and with less national presence than ENEL. However, presence of fully tradable white certificates has encouraged the development of ESCOs. Fuel Poverty
Fuel poverty is not addressed programmatically in Italy.
Most Significant Lessons Learned
After a slow start, the Italian White Certificates have proven to be an effective mechanism for stimulating energy efficiency in the residential sector. Despite being open to saving energy from all end uses, 85% of the energy savings have come from the residential sector. Furthermore, 75% of the savings are from electricity. This reflects both the primary energy nature of the target and the very generous cost recovery from CFLs, which dropped dramatically in price over the initial five‐year period. In the first three years, CFLs contributed to more than half the accredited energy savings).
• In 2008, the regulator AEEG forced disclosure of the energy‐saving measure prices for bilateral contracts between the obligated distributors and third parties; this increased the transparency of costs to the regulator. Furthermore, AEEG subsequently revised the deemed energy savings for some measures and the way that the cost recovery mechanism was calculated. The combined effect was that there was greater trading of White Certificates, and the price of them came more into line with the cost recovery price. For example, in 2007 White Certificate prices were on average around €40 (£35) for electricity, whereas the cost recovery was €100 (£87); since 2009, the average market price for White Certificates is around €80 – 85 (£71), with a revised cost recovery allowance of €89 (£79).
• The trading market is functioning much better. In 2007, 304,932 certificates were traded on the spot market, and 556,742 certificates were traded bilaterally.
• The remaining problems to be addressed are:
• The policy on additionality issues, because White Certificates, financial incentives, and tax breaks are contributing to the energy saving measures;
Italy
77
• How the lifetime issues of the individual projects are addressed—for example, insulation measures can save energy and carbon dioxide for at least 30‐40 years, but they are not awarded their full benefits under a scheme that counts savings only for five to eight years, depending on the measure; and
• Perhaps five years is too long a period to set such distributor obligations, since the price changes for some measures in such a period can dramatically alter estimates of the cost recovery allowance in the distribution price control.
JAPAN
Introduction
Japan is an island state whose population density and quality of life place it among the top consuming nations in the world. Japan is ranked sixth in the world for volume of greenhouse gas emissions. Over 75% of Japan’s energy consumption comes from fossil fuel sources, mostly imported. Japan is a signatory to the Kyoto Protocol, under which it must reduce its GHG emissions to at least 6% below 1990 levels by 2012. Japan has put in place a number of national climate action plans to help meet this target by steering towards development of cleaner energy; efficiency and conservation play a central role in meeting this goal. Yet while Japan has actively promoted its climate policy, it continues to struggle to stay on track to meet its target. The Japanese Ministry for Environment estimates that overall emissions decreased 6.2% from 2007 to 2008; however, this still represents a level 1.9% above the 1990 Kyoto base year.1
Energy efficiency has played a central role in Japan’s economic and energy policy since the 1973 world oil crisis. Since then, Japan has reduced its dependence on foreign oil to about 50% of primary energy supplied in Japan; however, the country remains dependent on foreign sources of fuel for 95% of its energy needs. Decades of efficiency initiatives have reduced energy consumption in some sectors; however, overall consumption in the building and transport sectors has increased despite improvements in efficiency. Today, the commercial and residential sectors account for 32.3% of total energy consumption, up from 18.1% in 1973. Residential consumption has doubled. This rise in domestic energy use is largely due to a shift to more energy‐intensive lifestyles, growth in appliance size, and an increase in the number of households.2
Key Statistics
Housing and Its Environmental Impacts Population (2008) 127.692 million3 Housing Units (2008) 49.61 million4
% Single‐family NA % Owner Occupied 49%5
Household consumption by energy source (2007)
42.3% electricity 22.4% city gas 13.1 % LPG 22.1 % kerosene6
1 http://www.env.go.jp/en/headline/headline.php?serial=1177 2 See http://www.enecho.meti.go.jp/topics/energy‐in‐japan/english2008.pdf. 3 Japan Statistics Bureau, http://www.stat.go.jp/english/info/news/1893.htm. 4 Japan Statistics Bureau, 2008 Housing and Land Survey, Interim Report, Table No. 4, July 28, 2009. http://www.e‐stat.go.jp/SG1/estat/ListE.do?bid=000001021806&cycode=0. 5 Id., table No. 28, (based on number for “ordinary households owning present dwelling”).
International Comparison of Residential Energy Efficiency Programmes
80
Annual CO2e emissions (2007) Total (Mt) 1,304 Mt CO27 Per capita (tons) 10.2 tons per capita8 Residential CO2 emissions (Mt) 62.7Mt9
Residential % of total 13.8% Per dwelling unit (tons) 1.3 % of residential energy usage due to heating
22.4%10
% of residential energy usage due to water heating
34.6%11
Carbon intensity of electricity 365 kg CO2 / MWeh
CO2 emission reduction goal 6% below 1990 levels by 2012; 25% below 1990 levels by 2020.12
Delivery Structure
Japan has in place a network of laws and incentives promoting energy efficiency in the residential sector.13 The foundation for many of the residential efficiency programs in Japan is the Law Concerning the Rational Use of Energy (commonly referred to as Japan’s “Energy Conservation Law”). The Ministry of Economy, Trade and Infrastructure (“METI”) is charged with overseeing implementation of the Energy Conservation Law.14 The Agency for Natural Resources and Energy within METI carries much of this responsibility, with significant support from the Environmental Conservation Centre Japan (“ECCJ”) in development and implementation of programs, as well as public education.15
Prefectural authorities play an important role in overseeing implementation of energy efficiency measures, through both penalties and incentives.16 The Energy Conservation Law requires builders and owners of residential buildings with a floor area exceeding 300 square meters to report to local authorities on the energy conservation
6 MEITI, “Japan Energy Conservation Handbook 2009,” at 121, December 2009. (Hereinafter “Energy Conservation Handbook 2009”). Available at http://www.asiaeec‐col.eccj.or.jp/databook/2009e/index.html. 7 Figure is for CO2 emissions, excluding LULUCF. Japan National GHG Inventory, April 2009, at 2‐1. http://www‐gio.nies.go.jp/aboutghg/nir/2009/NIR_JPN_2009_v3.0E.pdf. 8 Id. at 2.1.2. 9 Id. at 2‐2. 10 Percent total household energy usage in 2007, Energy Conservation Handbook 2009, at 122. 11 Id. 12 The latter goal was officially announced by Japan’s new prime minister in fall, 2009. See http://www.guardian.co.uk/environment/2009/sep/07/japan‐greenhouse‐gas‐cuts. 13 For a comprehensive overview of energy efficiency laws and policies affecting residential building retrofits in Japan (and energy efficiency programs in the residential sector generally) see International Energy Agency, “Promoting Energy Efficiency Investments, Case Studies in the Residential Sector,” (2008), Chapter 3, http://www.iea.org/w/bookshop/add.aspx?id=326 (hereinafter “IEA 2008”). 14 METI homepage: http://www.meti.go.jp/english/. 15 ECCJ homepage: http://www.asiaeec‐col.eccj.or.jp/. 16 Japan is divided into 47 prefectures.
Japan
81
measures they have undertaken. Local authorities have the power to issue “improvement orders,” publish the names of noncompliant parties publicly, and impose fines of up to JPY 1 million. Many local governments also incentivise compliance with building energy standards by offering subsidies, preferential interest rates, and even relaxed zoning regulations for buildings that comply with specified energy standards.
Several other agencies play substantial roles in deploying energy efficiency in the residential sector. The Ministry of Land, Infrastructure and Transport (“MLIT”) sets voluntary labelling standards that incorporate thermal assessment of buildings under the Japan Housing Quality Assurance Law.17 The Japan Housing Finance Agency (“JHF”) and Development Bank of Japan (“DBJ”) provide financial incentives for voluntary compliance with efficiency standards.18
Role Who Plays Role
Programme Oversight, Setting Targets
METI Prefectural Authorities MLIT
Accountability for Delivering Results Builders Owners Product manufacturers and importers19
Provision and Installation of Measures
Private companies, certified by MLIT, conduct assessments under the housing performance labelling system, under the Housing Quality Assurance Law.20
Provision of Public Information and Education
ECCJ IBEC METI
Financial Assistance JHF MLIT DBJ
Technical Assistance ECCJ IBEC
Evaluation and Savings Verification Builders/owners, through reports submitted to prefectural governments
17 MLIT homepage: http://www.mlit.go.jp/index_e.html. 18 Japan Housing Finance Agency homepage: http://www.jhf.go.jp/english/. Development Bank of Japan homepage http://www.dbj.jp/en/. The Institute for Building Environment and Energy Conservation (“IBEC”) also supports building efficiency through a number of programs; however, it focuses primarily on commercial buildings. IBEC homepage: www.ibec.or.jp (Japanese only). 19 A discussion of residential retrofit programs would be incomplete without touching on Japan’s product labelling standards, which have been the main driver of residential efficiency in the country. Labelling standards are discussed briefly in section 4. 20 M. Evans et al., “Country Report on Building Energy Codes in Japan,” Pacific Northwest National Laboratory, April 2009, at 16.
International Comparison of Residential Energy Efficiency Programmes
82
Funding and Financing
In Japan, financial support for energy efficiency in the housing sector is available through a number of programs. Incentives are offered by several entities, including NEDO, utilities, and local governments. Programs provide support for the purchase of new energy efficient homes as well as for retrofitting existing homes. The Japanese government also subsidises purchases of some of the most energy‐intensive household appliances, including air conditioners, space heaters, and hot water heaters.21 Still, most financing opportunities support energy efficiency in new construction or very large residential buildings, and only marginally address existing residential buildings.22
The government’s “Flat 35” programme offers long‐term, low interest financing for purchasing homes that meet certain criteria. One of these criteria is that a home must meet, at minimum, the thermal standards set forth in the 1980 building codes. Preferential rates are available for homes that comply with the newest 1999 standards. The programme is offered through the Japan Housing Finance Agency. While the bulk of these loans have gone out to purchase of newly constructed homes, a subset has supported purchase and renovation of existing properties.23
Type of Funding Public Funding Wires charge (electricity) No Gas “pipes” charge (natural gas) No Levy on unregulated fuels No Tax Yes Tax credit NA Utility Obligation No Financing of Private Investment Government Loan Programs Yes. Extra financing and low‐interest loans are
available through the JHF. Utility Loan Programs Unclear.24 Also, some utilities, including the Tokyo
Electric Power Company (“TEPCO”) Kansai Electric Power Company (“KEPCO”) incentivise efficiency by offering variable rate structures that reward customers who have installed efficient water heaters.25
Property‐Secured Finance (PACE)
No
21 See Energy Conservation Handbook 2009 at 55. 22 IEA 2008 at 69‐72. 23 See IEA, “Progress With Implementing Energy Efficiency Policies in the G8” at 19, 2009. Available at http://www.iea.org/G8/docs/Efficiency_progress_g8july09.pdf. See also JHF, “Business Description” at http://www.jhf.go.jp/english/about/pdf/main_2.pdf. 24 There is some evidence of utility‐administered programs offering low‐interest loans for residential retrofits. IEA 2008 at 69. However, more detailed information on these programs in English is scarce. 25 TEPCO, Rate Calculation. http://www.tepco.co.jp/en/customer/guide/ratecalc‐e.html. KEPCO http://www.kepco.co.jp/english/guide/pdf/8.pdf.
Japan
83
Type of Funding Energy Mortgage Products Yes Dedicated Institution (e.g. Green Bank)
No
Measures
Energy Efficiency programs in the residential sector are largely overseen by the ECCJ and METI. In December, 2009, ECCJ issued its annual report covering energy efficiency measures being taken in Japan, including those underway in the residential sector. According to this report, residential efficiency is being deployed through (i) promotion of energy efficient appliances; (ii) heat insulation performance standards; and (iii) management of total energy demand.26
Appliance efficiency is being introduced through mandatory standards set by the Top‐Runner Programme, and through subsidies for the appliances with the greatest impact on household energy use. The Top Runner programme covers appliances responsible for approximately 70 percent of energy consumption in the residential sector. Special incentives are further available for purchase of energy efficient “air conditioning equipment” and hot water heaters.27 Space heating accounts for over 22% of household energy use; hot water heating accounts for approximately 34.6% of household energy use.28
Several programs are aimed at improving heat insulation performance in residential structures. The Japan Housing Quality Assurance Law creates a voluntary housing performance labelling standard that grades houses based, in part, on their compliance with the thermal performance standards set forth in the building codes.29 The Comprehensive Assessment System for Building Environmental Efficiency (“CASBEE”) is another voluntary labelling system. It has been developed by the Japan Sustainable Building Consortium to assess the “environmental efficiency” of buildings. The concept of “environmental efficiency” goes beyond energy performance, to assess the overall environmental quality and environmental load of a building. While this programme has mainly focused on commercial buildings, some residential buildings have participated as well.30
The ECCJ is helping carry out a pilot programme with METI for assessing total home energy use called the Home Energy Management System (“HEMS”).31 The centrepiece for HEMS is an in‐home display that encourages consumers to conserve energy. Displays have
26 Energy Conservation Handbook 2009 at 96. 27 Air conditioning accounted for just 2.1% of total household energy use in 2007. However, most Japanese households have one appliance for air conditioning and space heating (instead of central heating/cooling), often referred to as “air conditioning” appliances. 28 Based on 2007 calculations. Energy Conservation Handbook 2009 at 122. 29 An informal translation of the Housing Quality Assurance Law is available at http://www8.cao.go.jp/kisei‐kaikaku/oto/otodb/english/houseido/hou/lh_9999‐71.html. 30 The Environmentally Harmonic Housing Accreditation and Next Generation Energy Efficiency Housing Evaluation are two other programs administered by the Institute for Building Environment and Energy Conservation, located within MLIT. The extent and current status of these programs is, however, unclear. See ECOFYS, “Energy Efficiency in Lifestyles: Europe and Japan,” at 16, October, 2007. Available at http://documents.eu‐japan.eu/altenergy/en/alten_report_2007.pdf. 31 See http://www.eccj.or.jp/eng/e3207hems.html.
International Comparison of Residential Energy Efficiency Programmes
84
generally been limited to providing information on energy use, and have not included features to regulate in‐home energy usage.32 An increasing interest in “smart meters” and development of appliances with sensors for energy management is beginning to focus policymakers and industry on more integrated home energy management systems.
Recent changes in the Energy Conservation Law are also worth noting. In 2009 the Law extended mandatory reporting on building efficiency measures to those buildings with a floor area of 300 300m2 or more (up from 2000 m2 previously). The reduced area still does not reach stand‐alone homes, but does cover many apartment buildings. The law does not, however, specify which efficiency standards an owner must comply with, just that the standard must be stated and then met.
Air sealing Yes. Under the residential building codes. Heating/Cooling equipment
Yes. The Top Runner standard and accompanying efficient labelling programs cover air conditioners and space heaters.33
Appliances Yes. Top Runner and energy efficiency labelling. Lighting Yes. Top Runner and energy efficiency labelling. Solar water heating NA
Other efficient water heating equipment
Yes. METI is promoting and offering subsidies for efficient water heaters, including the “Eco‐cute” heater. The Top Runner standard and energy efficiency labelling programme further set minimum standards for oil and gas water heaters.34
Efficient windows Yes Biomass heating No Solar electric Yes. METI has subsidised residential solar pv since the mid‐
1990s, and continues to support residential pv installation.35
32 http://www.eccj.or.jp/navi/intro/index.html (provides examples of HEMS displays; Japanese only). 33 http://www.asiaeec‐col.eccj.or.jp/databook/2007e/pdf/09.pdf. 34 http://www.asiaeec‐col.eccj.or.jp/contents03.html (click on “energy efficient water heaters”). 35 See http://www.meti.go.jp/english/press/data/20090331_03.html for information on most recent subsidy program. See also Robert Foster, “Japan Photovoltaics Market Overview,” Southwest Technology Development Institute, prepared for US DOE, October 2005, tracking Japan’s aggressive promotion of solar PV in the residential sector over the past decade, covering up to 50% of PV system cost, with significant results both in the volume of solar PV installed and in terms of price reductions. http://solar.nmsu.edu/publications/Japan%20Report.pdf.
Japan
85
Measures Smart meters & in‐home displays
Yes. Through the development of Home Energy Management Systems (HEMS) by companies like Toyota, and their deployment by METI, first on a pilot level and then expanding.36
Behavioural measures Yes.
Codes and Standards
Japan has two residential building codes, set forth in the Energy Conservation Law: The Design and Construction Guidelines on the Rationalisation of Energy Use for Houses (“Guidelines”), and Criteria for Clients on the Rationalisation of Energy Use for Houses (“Criteria”). The codes were originally issued by the Ministry of Construction (now merged into METI) in 1980, and were updated in 1992 and 1999. Compliance with the codes is voluntary.
The Guidelines focus on the building envelope, including thermal performance of windows and doors. The thermal performance standards are broken down into several climate zones to account for differences in weather. They also include plans for ventilation, air flow, heating, cooling, and hot water. The guidelines include a section called “how to live” which is essentially an instruction manual on how to properly “use” a house to optimise the efficiency features included.
The Criteria for set both performance and prescriptive standards, with a primary focus on heating, ventilation, and air cooling. The performance standards set maximum allowable annual heating and cooling loads by climate zone, and provide maximum budgets for designers to work in to meet the targets for each climate zone.
Existing Housing Energy Codes and Standards Energy Requirements at Time of Sale Voluntary only. For participants in
the voluntary housing labelling standards under the Japan Housing Quality Assurance law. Compliance with the codes is measured at time of purchase/sale of property.
Energy Requirements (not Time of Sale) See above. Rating and Labelling at Time of Sale Voluntary only. Under the voluntary
housing labelling standards under the Japan Housing Quality Assurance Law.37
Rating and Labelling (not Time of Sale) No. Quality control on code admin – any regional/independent/national mechanisms?
Unclear.
36 See http://www.eccj.or.jp/eng/e3207hems.html (ECCJ’s page on HEMS). See also http://www.japanfs.org/en/pages/029108.html (for story on Toyota’s launch of its HEMS). 37 Also, Japanese Industrial Standards (JIS) C9901, energy conservation labelling system, is now being applied to residential buildings. See Energy Conservation Handbook 2009, at 97.
International Comparison of Residential Energy Efficiency Programmes
86
Supply Chain
Type of Industry Infrastructure Initiatives
Publicly funded residential efficiency technician training programs
Unclear. There is a state examination for energy managers for the industrial sector, required by Chapter 1, Article 8 of the Energy Conservation Law. No specific accreditation programme seems to be in place for technicians in the residential sector.38 Also worth mentioning is the Lo‐House programme established by MLIT, METI, and MoE. Lo‐House provides building‐sector professionals with information on options for promoting sustainable housing.39
Industry‐funded residential efficiency technician training programs
No.
Public/government quality certification of efficiency service providers
Unclear.
Industry quality certification of efficiency service providers
No.
Fuel Poverty Japan does not seem to have any energy efficiency retrofit programs targeted specifically at low‐income households.
Most Significant Lessons
Japan has achieved significant improvements in energy efficiency in its residential housing sector over the past several decades. Since it began implementing energy efficiency in 1973, the country has become a world leader in affordable, energy efficient technology, much of it related to energy use in the home. Just since 1998, household cooling and heating air conditioners have become about 34% more efficient.
Yet Japan continues to face significant challenges in meeting its carbon reduction targets, and in decreasing overall energy usage. While dependence on oil has decreased dramatically, largely through efficiency improvements in the industrial sector, residential energy use has continued to rise. This has been largely attributed to increased appliance size and heavier usage. The rebound effect must be addressed to ensure that improvements in efficiency are not offset by a corresponding expansion in energy usage.
38 An English Translation of the Energy Conservation Law is available at http://www.asiaeec‐col.eccj.or.jp/law/revised/rue_2.pdf (May 2008 revised version). 39 The program further provides residents with information on ways to promote sustainable housing. http://www.iea.org/textbase/pm/?mode=pm&id=4146&action=detail. Program overview (English) and link to MLIT Lo‐House website (Japanese only).
Japan
87
A large part of the challenge of improving efficiency in existing homes arises from the short lifespan of the typical Japanese home. The average lifespan of a new Japanese home is about 30 years, and has been linked to a lack of attention to quality in construction. The short‐lived, relatively inexpensive nature of Japan’s housing stock reduces motivation for introducing retrofits, as there may not be enough time for a homeowner to recover the cost of introducing efficiency measures.40 The government’s Basic Programme for Housing is working to expand the typical life of new residential construction to 40 years by 2015. Yet this will only address part of the problem. While Japan’s residential codes remain voluntary, there is limited drive to implement whole‐house efficiency measures even with longer lasting homes.
The residential sector continues to play an important role in Japan’s national energy goals, as well as in the country’s domestic and international climate change mitigation goals. Under the Kyoto Protocol, Japan has committed to reducing its GHG emissions to 6% below 1990 levels by 2012. Yet from 1990 to 2008, energy use in the residential sector in Japan increased by 10.8%.41 The Japanese government recognises the need to continue cutting energy consumption in its residential sector, and is continuing to develop policies to meet this challenge.42
40 For an analysis of the ratio of new construction to retrofits in Japan from 1960‐2005, see IEA 2008 at 52. 41 Japan National GHG Inventory, April 2009, at 2‐4. 42 See Energy Conservation Handbook 2009. See also Japan Housing Finance Agency, METI, “Energy In Japan,” 2008, http://www.enecho.meti.go.jp/english/toprunnner/index.html; and ”Kyoto Protocol Target Achievement Plan,” March 28, 2008, http://www.env.go.jp/en/earth/cc/kptap.pdf (provisional English translation), http://www.env.go.jp/earth/ondanka/kptap/plan080328/full.pdf (Japanese version).
THE NETHERLANDS
Introduction
The Netherlands is a medium‐sized country in the EU‐27. It has a much higher dependence on natural gas than the average EU Member State, due to its offshore natural gas fields in the North Sea. The other distinguishing feature is the high level of cogeneration that exists; this covers not just industrial applications but also district heating schemes.
In January 2008 the Dutch government, the social housing providers, the energy utilities, and the construction industry signed a covenant called Meer met Minder (More with Less), a mechanism for working together to achieve energy savings in buildings. The goal was 100 pJ in additional energy savings by 2020. Of this target, 76% is in the residential sector, with 43% owner‐occupied housing units, 24% social rental units, and 9% privately rented. The remaining 24% balance is in the industrial and commercial and public sectors.
There was an ambitious goal of achieving 16 pJ by 2011, by insulating 500,000 residences and other buildings to either Label B standard of the Energy Performance Certificate, or with improvement of at least two label steps in the EPC. While the overall targets and milestones were agreed upon, there was less clarity about the responsibilities of the relevant government departments and the key players. Discussions are still ongoing among the various partners on financing and execution. Progress has been so slow that the government is now actively considering reorganising the Programme Office for More with Less. Members of the Dutch Parliament are advocating either regulation or energy efficiency obligations to be introduced.
The slow progress most likely is an outcome of trying to administer a programme that offers less‐than‐generous incentives for some of the players. Housing corporations investing in energy efficiency are offered effectively an 11% tax discount; households, which typically can obtain loans at 10% for energy‐saving measures, are now offered loans at 9% interest. Beginning July 2009, a package of new initiatives was introduced, offering a subsidy of up to €200 (£177) for energy analyses and advice to households, a 20% subsidy of the total cost of superglazing windows, and a VAT reduction from 19% to 16% for insulation measures. All of these measures are government‐funded. In addition, a very complicated subsidy scheme now exists whereby if you achieve 20% savings or one EPC label improvement, you are eligible for €300 (£266). For a 30% savings or two steps in label improvement, you are eligible for €750 (£665). However, the lack of widespread building energy labels is another barrier to progress.
Interestingly, for solar PV, heap pumps, and renewable energy measures, households are eligible for a reduction of between 2% and 3% on interest rates for loans. The government is also considering changing the rules for renting, so that after a social housing corporation invests in energy efficiency, rents could rise to recover the cost of the energy efficiency improvements. The Netherlands currently controls rents, so raising rents is not normally possible.
The Dutch Parliament has urged the Minister to consider the obligation mechanism, either by requiring building owners to meet energy efficiency standards for buildings, and / or require energy suppliers to achieve energy savings with their customers via White
International Comparison of Residential Energy Efficiency Programmes
90
Certificates. The Minister has indicated an interest in reviewing these alternative approaches, in the context of a formal evaluation of More with Less in 2010.
In the Netherlands the markets for electricity and gas have been open since July 2004. There are three major energy retailers in the residential sector: Essent, NUON, and ENECO. Key Statistics
Housing and Its Environmental Impacts Population (2008)1 16.5 million Housing units (estimate for 2010) 7.2 million % single‐family (2007) 69% + 26% flats2 % owner‐occupied 56%3
% by space heating fuel
72% natural gas 23% electricity 3% renewable 2% district heating 1% fuel oil (oil + LPG)
Annual CO2e emissions (2007) Total (Mt) 154 Per capita (tons) 9.3 Residential CO2 emissions (Mt) 26.2 Residential % of total 17% Per dwelling unit (tons) 3.6 % of residential due to heating 18% Carbon intensity of electricity 548 kg CO2 / MWeh
CO2 emission reduction goal
Reduce CO2 equivalent emissions by 6.0% from 1990 levels in period 2008 ‐ 2012; currently expected to be ~2% below 1990 levels.4 CO2 emissions are 16% higher than in 1990.5 Other goal: at least 9.5% energy saving by 2016 of which 44% to come from residential sector—i.e., 23.6 TWh.6
1 Eurostat 2008 data. 2 Eurostat 2007. 3 Eurostat 2007. 4 European Environment Agency, 2007. 5 International Energy Agency (IEA), 2007. 6 Netherlands NEEAP, 2007.
The Netherlands
91
Overview of Building Energy Efficiency Initiatives for Existing Homes
Building construction is similar to that of the United Kingdom, with approximately 2 million empty cavity walls, and roughly half the houses having been built before 1970.7 Eurima in 2001 estimated that heat loss through the average roof in the Netherlands 2.3 times greater than the average UK roof heat loss of 38 MJ per square meter. Heat lost through walls in the Netherlands is similar to that of the United Kingdom.
The Netherlands’ NEEAP does not give any breakdown beyond total savings by 2016 in the five end‐use sectors of residential, tertiary, industry (not involved in the Emissions Trading System; ETS), transportation, and agriculture. The largest saving—over 40%—is expected to come from the residential sector. Within the residential sector the following cross‐sectoral measures are expected to apply: energy taxation, building regulations, and a temporary subsidy scheme providing up to 15% of the investment costs for technical measures in existing buildings to reduce energy consumption. Measures covered include cavity, roof, and wall insulation; solar water heating; heat pumps; and CHP installations.
Delivery Structure
The temporary subsidy scheme, Buildings and CO2 Reduction, provides a subsidy of up to 15% of the investment costs (with a maximum of €1 million [£886,350] per project) for technical measures to reduce energy consumption in existing buildings. The eligible measures should be chosen from a list, and the subsidy depends on the (deemed) amount of CO2 saved. As mentioned above, possible measures include cavity, roof, and wall insulation; solar hot water systems; heat pump boilers; and CHP installations. The target group is housing corporations, private housing companies, investors, and property developers.
Role Who Plays Role Programme oversight, setting targets
The Netherlands government manages the More with Less programme.
Accountability for delivering results
Voluntary agreement among many parties.
Provision and installation of measures
Energy efficiency market actors, such as Nuon, one of the two large energy suppliers. Nuon has bought one of the larger insulation companies.
Provision of public information and education
MilieuCentraal is a national and independent organisation that offers consumers practical and reliable information about the environment. Communications methods are customer call centres, which respond to both telephone and e‐mail. The organisation receives a government subsidy for carrying out part of its activities.
7 Agency NL, 2007
International Comparison of Residential Energy Efficiency Programmes
92
Role Who Plays Role
Financial assistance Temporary government subsidy scheme, Buildings and CO2 Reduction. Also commercial loans with very slightly subsidised interest rates.
Technical assistance
The COEN organisation covers the same areas as MilieuCentraal, but focuses on the intermediary organisations. The programme is fully financed by the government.
Evaluation and savings verification
Government, but evaluations likely to be contracted out to firms such as ECN Petten or TKO.
Funding and Financing
There is also a voluntary agreement with housing associations to make an effort to realise large‐scale energy savings in existing buildings. The Association for Housing Corporations promises to save 20% on energy use in existing dwellings before 2018. Early results are not promising, however. (See Introduction and Overview sections.) Type of Funding Public funding Wires charge (electricity) No Gas “pipes” charge (natural
gas) No
Levy on unregulated fuels No
Tax The energy tax on household energy is not recycled for energy efficiency.
Tax credit No tax breaks are available to the residential sector. Utility obligation Voluntary and currently not very specific. Financing of private investment
Government loan programs Government slightly subsidises interest rate of commercial loans.
Utility loan programs No Property‐secured finance
(PACE) No
Energy mortgage products
Green mortgages are available when a dwelling meets the rules for sustainable dwellings, either as a new building or a retrofit. The owner can take out a 10year loan at an interest rate that is approximately 1% lower than the market rate. The maximum mortgage amount for a green mortgage is €34,034 (£30,174). In practice, many project developers find the rules too demanding and the number of participants is therefore limited. The scheme is under review.
The Netherlands
93
Type of Funding
Dedicated institution (e.g., Green Bank)
The Green Funds Scheme (established 1995) is a tax incentive scheme enabling individual investors to put money into green projects that benefit nature and the environment. Since the scheme was launched, 200,000 investors have put up €5 billion (£4.4 billion), funding 5,000 green projects. The government plans to make the GFS better suited to projects in the built environment.
Measures Promoted
Measures “Whole‐house” deep and comprehensive More with Less programme tries to
encourage more measures in a house, but falls well short of a whole‐house approach.
Limited measures Insulation (lofts, cavity walls, solid walls) Yes, via More with Less Air sealing NA
Heating / cooling equipment More with Less, plus support for heat pumps is planned within More with Less.
Appliances Not beyond EU standards and labelling
Lighting Under the low‐income programme, TELI.
Solar water heating Planned, under More with Less. Other efficient water heating equipment NA Efficient windows NA Biomass heating NA Solar electric Planned, under More with Less.
Smart meters & in‐home displays
Roll‐out has started. Savings of approximately 2% are expected in household energy consumption, through behaviour change.
Behavioural measures NA Codes and Standards
Energy requirements for appliances and lighting at time of sale of a housing unit must be disclosed, under the EU minimum performance standards. With regard to rating and labelling, energy requirements must be displayed for appliances and lighting at time of sale, along with the Building Energy Performance Certificate, as required by EU.
International Comparison of Residential Energy Efficiency Programmes
94
Supply Chain
Like most European countries, the Netherlands’ historic energy efficiency supply chain has been rather fragmented and certainly more diverse and with less national presence than that of the three major utilities. One of these energy suppliers (NUON) entered into the insulation installation market a few years ago by purchasing one of the larger market actors, when an energy efficiency obligation on energy efficiency suppliers was first mooted. However, this does not play a major part of its current activities or turnover.
Type of Industry Infrastructure Initiatives Publicly funded residential efficiency technician training programs
NA
Industry‐funded residential efficiency technician training programs
NA
Public / government quality certification of efficiency service providers
NA
Industry quality certification of efficiency service providers
NA
Fuel Poverty
The government low‐income scheme, TELI, is focused on overcoming the information and monetary barriers to energy saving measures in low‐income households. The scheme subsidises energy audits and projects carried out by local authorities, energy companies, and housing corporations. The measures covered include water‐saving shower heads, CFLs, and insulation of pipes.
In 2007, the Dutch government initiated a demonstration approach to upgrade city districts that suffer from a disproportionate amount of unemployment and crime. The Ministry of Housing, Communities, and Integration identified 40 districts that will be upgraded. National and local governments will cooperate with local residents and social housing corporations to upgrade neighbourhoods. A physical upgrade or replacement of existing dwellings is one of the items in this plan. Energy saving will be an important benefit to these districts, since they often contain many poor‐quality and badly insulated dwellings. Because of low incomes and limited access to loans, these homeowners cannot invest in energy‐saving measures. Local authorities and housing corporations will invest in energy‐saving measures in these districts.
The cut‐off point for assistance to low‐income households is a yearly income of less than €14,000 (£12,410).
Most Significant Lessons Learned
• Voluntary collaboration among market actors has not been as effective as hoped. It was hoped that the voluntary collaboration among the Dutch government, the
The Netherlands
95
energy suppliers, the housing corporations, and the construction industry would deliver significant energy savings in the residential sector. This has not turned out to be the case and there is a good chance that after the evaluation in 2010, an energy efficiency obligation may be introduced on the energy suppliers.
• Modest incentives do not attract sufficient consumer attention. The very modest financial incentives that the Dutch government has offered to date appear to have had little impact and explain why the Dutch Parliament is keen to move to either regulation or energy efficiency obligations. This lack of energy efficiency uptake when the financial incentives are modest is not unique to the Netherlands, and there is widespread evidence that with current public perception, significant financial incentives are needed to bring about large‐scale activity in energy efficiency.
NORWAY
Introduction
Energy production is Norway’s largest industry, and is therefore a critical political issue, with implications for its balance of trade and its labour force. Norway’s energy production mix is as follows:
Energy Production Mix Electricity 50% (virtually all hydroelectric) Petroleum products 35%
Coke, coal 6%
Fuel wood 5%
Energy consumption per capita is roughly 10 times that of the world average. Reasons for this include Norway’s power‐intensive manufacturing, and the fact that electricity—historically very inexpensive—is a significantly more common source of heating than in other countries: Electricity supplies 78% of domestic heating. Historically the price of electricity has been the lowest in Europe, potentially adding to homeowners’ lack of focus on energy reduction. However, since 1995, Norway has increased electricity prices dramatically (55% over 15 years), bringing the country in line with the average price in OECD countries.
Despite being a very small country, Norway is one of the largest exporters of energy—primarily crude oil, natural gas, and in years with sufficient rainfall, hydroelectricity. Norway has offshore drilling, oil refining, natural gas, and distribution networks for these natural energy resources. The development of the petrochemical and hydroelectric energy production has enabled Norway to become a relatively rich country—one that can afford to implement rigorous programs to promote energy efficiency and renewable energy.
Fluctuations in rainfall create planning challenges for Norway’s hydroelectric industry. The country’s dependence on hydropower was jeopardised in 2003 when insufficient rainfall made the country vulnerable to supply shortfalls.
Implementation of the energy efficiency and renewable energy policy is delivered by the quasi‐public national energy agency, Enova. The goal of this agency is to create energy savings and renewable energy production of 18 TWh by 2011. Within this goal there are specific targets for wind (3 TWh) and district heating from waste energy and biomass (4 TWh).
Norway’s future energy policy is balanced between both creating additional renewable energy as well as promoting energy efficiency. The focus for renewable energy is mostly from wind and solid biofuel, but also includes solar thermal heat and heat pumps (considered renewable). However, the energy efficiency programs appear more focused on large commercial projects, and is significantly less well funded for residential retrofit programs. One important exception is that funding for large multifamily buildings is
International Comparison of Residential Energy Efficiency Programmes
98
considered one of several priorities within the large‐building category. The lower level of residential retrofit funding is explained in part by the fact that residential energy consumption is less than 20% of the country’s total energy use and an extremely small contributor to CO2 emissions. Residential retrofit funding totals only NOK 120 million (£12.8 million), in comparison to Enova’s overall Energy Fund 2009 budget of NOK 1.5 billion (£160 million). While retrofit programs exist, residential energy efficiency efforts have been more focused on new‐construction codes. Key Statistics
Housing and Its Environmental Impacts Population (2005) 4.8 million1 Housing units (2008) 2.1 million2 % single‐family 64% % owner‐occupied 77%
Annual CO2e emissions (2003) Total (Mt) 43 Per capita (tons) 8.9 Residential CO2 emissions (Mt) 1.4 Residential % of total 3% Per dwelling unit (tons) .67 % of residential due to heating NA Carbon intensity of electricity 5 kg CO2 / MWeh
CO2 emission reduction goal
30% reductions of GHGs from 1990 levels by 2020. In addition, Norway has made a political pledge to achieve carbon neutrality by 2050. If an ambitious global climate agreement is achieved in which other developed countries also take on extensive obligations, Norway will accelerate this timetable and will target carbon neutrality by 2030.
Overview of Building Energy Efficiency Initiatives for Existing Homes
Enova’s funding priorities are reflected in their 2009 budget, with emphasis in energy efficiency for buildings (21%; primarily commercial & industrial, but also large multifamily residences); industrial (28%); and individual households (1%); although this is supplemented by a direct state subsidy, as described below).
1 IEA, Energy Policies of IEA Countries; NORWAY 2005 Review 2 Statistics Norway: www.ssb.no/boboling_en
Norway
99
In terms of greenhouse gas emissions, Norway’s Ministry of the Environment has clearly stated that they don’t want to be second best to any other country. Despite the dominance of clean hydropower, refineries and the petrochemical industry create large amounts of CO2 emissions. As a result, in 2007 the government adopted strict new goals for curbing CO2 emissions. The Norway Commission on Low Emissions recommended increased energy efficiency in buildings through stricter building codes, eco‐labelling, and subsidies among its three strategies for reducing CO2.
Nearly 70% of Norway’s households have multiple sources of heat. If prices rise for any single heating method, another can be used. Understandably, the Norwegian climate has necessitated very little air conditioning. The space‐heating mix is as follows: electricity, 98%; closed‐stove fuel wood, 67%; oil / kerosene, 21%; heat pump—air or water, 8%.
Delivery Structure
Norway’s energy efficiency programs are delivered by Enova, a non‐utility quasi‐governmental agency overseen by the Ministry of Petroleum & Energy, using funds from volumetric charges on energy and fuel suppliers. Enova’s task is to evaluate proposed projects and provide funding and oversight for those projects. Of the NOK 120 million (£12.8 million) spent on residential energy efficiency in Norway, only NOK 80 million (£8.5 million) was supplied by Enova, with an additional subsidy of NOK 40 million (£4.3 million) from the Norwegian government. The Enova funds supported marketing and educational information, call centre activity, and some technical assistance. The government subsidies supported specific measures, discussed in the Measures section.
Role Who Plays Role Programme oversight, setting targets
Ministry of Petroleum and Energy
Accountability for delivering results
Enova
Provision and installation of measures
Building owners and private contractors
Provision of public information and education
Enova: website, telephone helpline, information campaigns, trade fairs. Focus is on homeowner education, since the belief is that largest barrier to implementation is lack of homeowner knowledge and access to information.
Financial assistance
Annual budget NOK 80 million (£8.5 million) from the Energy Fund. In addition, NOK 40 million (£4.3 million) in subsidies for specific measures are provided by the Norwegian government.
Technical assistance Enova telephone helpline and website Evaluation and savings verification
Ministry of Petroleum & Energy established goals, verified by Enova
International Comparison of Residential Energy Efficiency Programmes
100
Funding and Financing
Type of Funding Public funding
Wires charge (electricity) 1 ore / kWh (a tenth of a penny) to the Energy Fund and 10.82 ore / kWh (1 penny) as a general charge for the state budget
Gas “pipes” charge (natural gas)
No
Levy on unregulated fuels Oil / kerosene: 144 ore / litre (15 pence) Natural gas: 5 ore / standard cubic meter (half a penny) will be initiated in 2010
Tax None Tax credit NA Utility obligation None Financing of private investment Government loan programs None Utility loan programs None Property‐secured finance
(PACE) None
Energy mortgage products None Dedicated institution (e.g.,
Green Bank) None
Measures Promoted
Six specific measures (highlighted in bold) are supported by government subsidies. The subsidies range as high as 20% of measure costs, up to a fixed amount, depending on the specific measure. The maximum subsidies are NOK 10,000 (£1,068) for hydronic heat pumps, solar heating, and pellet heaters; and NOK 4,000 (£427) for pellet stoves and central control systems.
Measures “Whole‐house” deep and comprehensive No Limited measures
Insulation (lofts, cavity walls, solid walls) No Air sealing No
Heating / cooling equipment Heat pump (for hydronic systems) subsidies. These comprise the bulk of the programme’s expenditures.
Appliances No, but Enova now has a new “Enova Recommends” label
Lighting No Solar water heating Yes Other efficient water heating equipment NA Efficient windows NA
Norway
101
Measures
Biomass heating Pellet heaters and pellet boilers; also pellet ovens, second largest category for funding support.
Solar electric No Smart meters & in‐home displays Central control systems
Behavioural measures General information, supported by the Energy Fund
Codes and Standards
Although Norway has a very strict energy code for new construction, there is no code for existing homes other than EU energy performance labelling requirements at time of building sale.
Supply Chain
Norway recognises a high need to re‐train the construction industry in new construction methods and with new technologies. Both the knowledge level and motivation of contractors to learn these new methods and technologies are considered a significant barrier. Norway launched a residential efficiency training programme in 2006, but it has no certification associated with it.
Type of Industry Infrastructure Initiatives
Publicly funded residential efficiency technician training programs
Yes, launched in 2006. Low‐ energy programme training for new construction
Industry‐funded residential efficiency technician training programs
No
Public / government quality certification of efficiency service providers
No, other than general certification for safety and building performance
Industry quality certification of efficiency service providers
No
Fuel Poverty
Norway has no programs targeting energy efficiency programs for lower‐income households. Most Significant Lessons Learned
• The responsibility for efficiency programme implementation can be separated from the revenue source. The Government has chosen to have the funds for energy efficiency that are raised from a volumetric levy on energy suppliers implemented by
International Comparison of Residential Energy Efficiency Programmes
102
a single non‐utility entity. Benefits include provision of a consistent, single national programme, administrative efficiency, and avoiding perceived conflicts associated with utility administration.
• Despite a lack of funding and programs for energy efficiency, spillover effects occur. Norway is different from other European countries because of a typically ready supply of hydro‐generated electricity. In the mid‐1990s, the government began to increase the price of electricity to motivate people to conserve energy. In the last decade Norway has embraced rigorous programs to promote both energy efficiency and renewable energy. While a relatively small percent of the budget is spent on residential retrofit programs, the national focus on efficiency and renewables has had a spillover effect on households.
• Higher energy prices motivate behaviour change in households. The increase in electricity prices has been especially effective in creating awareness and motivating change in the residential market because of the extremely high use (78%) of electric heat. Although the size of dwelling area has increased, residential energy consumption has declined over the past 10 years.3 In addition, the more stringent building codes for new construction and more efficient electrical equipment have been effective in adding to this decline in residential energy use.
• Dependence on a single energy source, even if it’s inexpensive, has its risks. Norway also learned a sharp lesson with the drought of 2002 – 2003, when demand outstripped the supply of hydroelectric power. Ever since, the country has been motivated to decrease its dependence on hydropower.
• Establishing an ambitious goal (carbon neutrality) elevates the international political discussion. Norway has become significantly more concerned with its CO2
emissions as its refining and petrochemical industry has grown. This industry holds great promise for economic and job growth, but it conflicts with Norway’s serious commitment to Kyoto Protocol goals. While an abundance of hydropower is a big boost, Norway has nonetheless provided leadership by establishing a goal of eventual carbon neutrality. It is likely to be one of the front‐runners in meeting any new targets.
• A net energy exporter has to look at efficiency at home. Norway will continue to be motivated to develop more renewable energy and increase energy efficiency as it further develops its capacity to export more energy to the Central European market.
3 The Odyssee‐MURE project: http://www.odyssee‐indicators.org/publications/PDF/norway_nr.pdf.
SWEDEN
Introduction
Sweden is the third‐largest country in the European Union, by land mass. Due to its far northern location, cold is a serious consideration and dwellings in Sweden are extraordinarily well‐insulated. Further, most multi‐unit residential and commercial buildings are connected to district heating networks, which have been used since the 1940s. In response to oil supply disruptions decades ago, most of the housing stock built since the 1970s has had electric space and water heating technology.
More recent initiatives to convert remaining oil‐based furnaces to heat pumps and biomass electric systems have further de‐carbonised the residential housing stock. In addition, Sweden is blessed with a very low‐carbon electricity generation portfolio; almost 90% of its electricity supply comes from hydropower and nuclear sources.
As a result of these factors and many others, Sweden has “the lowest CO2 emissions per GDP of all IEA member countries and the second‐lowest per capita.”1 A signatory of the Kyoto Protocol, Sweden is currently in compliance with its emission reduction targets and has ambitious plans for continued improvement. Sweden has a long history of aggressive government policies regarding efficient energy use.
Key Statistics
Housing and Its Environmental Impacts Population (2008) 9.2 million2 Housing units (2008) 4.5 million3 % single‐family 45%4 % owner‐occupied 62%5
1 IEA, “Energy Policies of IEA Countries – Sweden 2008 review,” p. 9. 2 Eurostat Database, Population – Demography – Main Demographic Indicators, Total population – [tps00001], http://epp.eurostat.ec.europa.eu/portal/page/portal/population/data/main_tables 3 Multi‐dwelling plus one‐ or two‐dwelling buildings: Statistics Sweden (Statistika centralbyran) database – Dwellings in the projected dwelling stock by region, type of building and period, http://www.ssd.scb.se/databaser/makro/SubTable.asp?yp=tansss&xu=C9233001&omradekod=BO&huvudtabell=BostadsbestandK&omradetext=Housing%2C+construction+and+building&tabelltext=The+dwelling+stock%2C+projections+by+region+and+type+of+building%2E+Year&preskat=O&prodid=BO0104&starttid=1990&stopptid=2008&Fromwhere=M&lang=2&langdb=2. 4 Statistics Sweden ‐ (one‐or two‐dwelling buildings), 2007. 5 Eurostat News Release, 95/2009 – 26 June 2009, Consumers in Europe: An extensive range of statistics on consumers, http://epp.eurostat.ec.europa.eu/cache/ITY_PUBLIC/3‐26062009‐AP/EN/3‐26062009‐AP‐EN.PDF
International Comparison of Residential Energy Efficiency Programmes
104
Housing and Its Environmental Impacts
% by space heating fuel (2006)6
33% electricity 30% geothermal 15% combination or other 10% district heating 9% biomass 3% fuel oil
Annual CO2e emissions (2007)7 Total (Mt) 65.48 Per capita (tons) 7.1 Residential CO2 emissions (Mt) 1.4 Residential % of total 2% Per dwelling unit (tons) 0.3 % of residential due to heating 60% Carbon intensity of electricity9 17 kg CO2 / MWeh CO2 emission reduction goal 40% by 2020 (1990 levels)10
Overview of Building Energy Efficiency Initiatives for Existing Homes
Part of the long history of aggressiveness about efficient energy use relates to stringent building standards and, along with its Danish and Norwegian neighbours, has the world’s highest standards for insulation components.11 The main challenge for Sweden is to refurbish approximately 1 million flats that were built in the 1960s. Outside the extensive district heating networks in Sweden, heat pumps have become a common solution, the most common of which are ground sourced. These are supported by subsidies as part of a move away from direct electric heating in family houses and apartments. The grant funding the flat refurbishment also covers extending district heating and biomass boilers.
Although the Swedish NEEAP outlines measures that will give rise to energy savings in the building sector, it does not split them by residential or tertiary sector end use. Nevertheless it is clear that building regulations dominate the energy efficiency action plan, constituting nearly 50%, and that subsidy schemes to help move away from direct electric heating to either district heating or heat pumps or solar water heating are significant.
For many years Sweden has required local authorities to provide objective and impartial information and advice on energy efficiency improvements to households. This will continue, and it is likely that its remit will be widened to include more efficient energy use in transportation, as well.
6 Swedish Energy Agency and MURE‐ODYSSEY 7 Swedish Environmental Protection Agency (Naturvårdsverket); “National Inventory Report 2009”; United Nations Framework Convention on Climate Change and the Kyoto Protocol; http://unfccc.int/national_reports/annex_i_ghg_inventories/national_inventories_submissions/items/4771.php. 8 Not including the effects of land use, land use change, and forestry (LULUCF), a sink of 20.5 Mt. 9 IEA; Sweden has also reported 8 Mt / 207 PJ. 10 From activities not included in the EU ETS, a decrease of approximately 20 Mt CO2e. 11 IEA Country Energy Study: Sweden 2008
Sweden
105
Delivery Structure
In Sweden’s deregulated electricity market, customers have the freedom to choose their electricity supplier. The national transmission grid is operated and maintained by a state company. Local distribution networks are owned by municipalities and some electric companies. This model has led to energy service companies (ESCOs), frequently municipally owned, providing most of the building performance contracting for owner‐occupied residences.
The success of the ESCO model has taken much time and considerable assistance. The two primary challenges have been the development of knowledge and experience in the marketplace, as well as perceived financial risk of the measures. Stakeholder forums and detailed studies have helped raise the level of understanding, establish coalitions, and build capacity. Standardised model contracts and performance guarantees have clarified roles and enabled financing.
Strong incentives, like taxes, subsidies, and stringent building codes with energy efficiency requirements have created an environment favourable for delivery of services. State provision of objective, free energy advisors at the municipal level and information campaigns have reinforced the incentive structure. Implementation of the Energy Performance of Buildings Directive should complement these policies because part of the declaration is the inclusion of suggested efficiency measures.
Role Who Plays Role Programme oversight, setting targets
NA
Accountability for delivering results
ESCOs
Provision and installation of measures
ESCOs
Provision of public information and education
Swedish Energy and Environmental Protection Agencies
Financial assistance NA Technical assistance Local Energy Advisors and Regional Energy Offices Evaluation and savings verification
NA
Funding and Financing
Sweden has a suite of taxes on energy and harmful effluents. A general energy tax has been in place for decades and is levied on most fuels, based on their energy content. In the early 1990s, a carbon dioxide tax (which applies to emissions from all fuels except biofuels and peat) was introduced. In addition there are a sulphur tax (on oils above a sulphur‐content threshold) and a levy on NOx (applicable to emissions from boilers, gas turbines and stationary combustion plants supplying at least 25 GWh per year).12 Only the carbon tax
12 Swedish Energy Agency (Energimyndigheten); “Energy in Sweden 2008.”
International Comparison of Residential Energy Efficiency Programmes
106
applies fully to the residential, transport and space heating sectors and 96% of revenues come from oil usage.
Electricity production in Sweden is exempted from energy and carbon dioxide tax, although it is subject to the NOx levy and sulphur tax in certain cases. However, the use of electricity is taxed.13
Conversely, “heat production pays energy tax, carbon dioxide tax and, in certain cases, sulphur tax and NOx levy. The use of heat, however, is not taxed.”
14 More recently, incineration of domestic waste has become subject to the energy tax.
On the funding side, a panoply of subsidies exists. Since 2000, investment grants for solar heating technology for space heating and / or domestic hot water production have been available. Since 2005, grants have been offered to convert domestic heating systems. Replacement of oil‐fired heating systems were eligible for the conversion grants, but now they focus on converting electric resistance heating systems to district heating, heat pumps or biofuel boilers. In addition there are grants for installing biofuel‐fired boilers at the primary heating system, and new windows with a maximum U value of 1.2, provided that the entire window is being replaced. The Climate Investment Programme (Klimp) provides financial support for “local authorities and other parties at [the] local level by making grants available for long term investments intended to reduce greenhouse gas emissions.”15
Finally, because ESCOs provide performance guarantees, more private commercial loans are available at a lower cost of borrowing for the homeowner.
Type of Funding Public funding Wires charge (electricity) NA Gas “pipes” charge (natural gas) NA Levy on unregulated fuels NA Tax Yes Tax credit NA Utility obligation NA Financing of private investment Government loan programs Yes Utility loan programs NA Property‐secured finance (PACE) NA Energy mortgage products NA Dedicated institution (e.g., Green Bank) Yes
Measures Promoted
Sweden promotes a full range of energy efficiency measures, from whole‐house deep retrofits to limited measures such as insulation, appliances, and lighting. This wide scope is the result of effective implementation of numerous policies.
13 Ibid. 14 Ibid. 15 Ibid.
Sweden
107
The most recent policy to be implemented is the Energy Performance in Buildings Directive in 2006. According to Swedish law, whenever buildings are constructed, sold, rented, or have a significant renovation, an inspection must be done and the energy performance of the building must be certified in an energy declaration. The declaration includes energy usage information, baseline statistics for reference, and a proposal of energy efficiency measures. The declaration may be prepared only by companies that have been accredited by the Swedish government. This is intended to complement the existing inspection regime for HVAC ventilation systems. Uniquely in the EU, Sweden plans to monitor the energy performance of new buildings with an area greater than 100 square meters, for 2 years after occupancy, to validate the design expectations. The performance target is expressed in total energy consumption.
Ongoing information and education initiatives have been undertaken by the Swedish Energy and Environmental Protection agencies, and the Board of Housing, Building and Planning. Funding for the Local Energy Advisors programme emanates from the Swedish Energy Agencies and enables municipalities to hire technical consultants to provide free, objective advice and information to the public. Regional Energy Offices provide training for energy performance contractors. The Sustainable Municipality programme allows the Swedish Energy Agency to provide knowledge, information, and network support to a significant portion of Sweden’s municipalities.
The table below, adapted from information found in the MURE II Household database, shows a selection of policies undertaken in Sweden:
Sample of Policies Implemented for Energy Efficiency Reference Policy Type Start End Förordning
(1994:1774) om märkning av
hushållsapparater
Tests and trials on domestic appliances
Information / education
1995 Ongoing
Lag om skatt på energi (1994:1176)
Energy and carbon dioxide tax in the household
sector
Cross‐cutting with sector specific
characteristics
1991 Ongoing
Förordning (2000:287) om statligt bidrag till
investeringar i solvärme
Investment grants for solar heating
Financial 2000 2008
Förordning (1994:1774) om märkning av
hushållsapparater
Labelling of domestic appliances and windows
Legislative / informative
1995 Ongoing
International Comparison of Residential Energy Efficiency Programmes
108
Sample of Policies Implemented for Energy Efficiency Reference Policy Type Start End Förordning
(2006:1587) om stöd för installation av energieffektiva fönster eller
biobränsleanordningar i småhus
Investment grants for small‐scale biofuel‐fired heating systems and more energy efficient windows
Fiscal / tariffs 2006 2008
BVL (1994:847) BVF (1994:1215) and (BFS
2006:12) Building regulations
Legislative / normative
1995 Ongoing
Förordning 2005:1255 om stöd för
konvertering från direktverkande
elvärme i bostadshus
Support for conversion of heating system in
household Financial 2006 2010
Bli energismart Information campaign on
improved energy efficiency
Information / education
2006 2009
Förordning 2006:1592 om energideklaration
för byggnader Energy declarations
Legislative / informative
2008 Ongoing
Förordning (2008:1247) om stöd för investeringar i
solvärme
Support for installation of solar heat
Financial 2000 Ongoing
Measures “Whole‐house” deep and comprehensive Yes Limited measures
Insulation (lofts, cavity walls, solid walls) Yes Air sealing NA Heating / cooling equipment Yes Appliances Yes Lighting Yes Solar water heating Yes Other efficient water heating equipment NA Efficient windows Yes Biomass heating Yes Solar electric Yes Smart meters & in‐home displays Yes Behavioural measures Yes
Sweden
109
Codes and Standards
National building regulations were introduced in Sweden in 1956 and the first energy efficiency requirements were added 1975. The initial energy efficiency requirements prescribed the use of certain materials, and in 1988 this approach was changed to measuring building performance. Technical requirements related to thermal insulation, ventilation, and heat recovery have been integrated into the regulations for decades.16
Swedish building regulation “requirements are based on specific delivered energy to the building, including energy for space heating, DHW, electricity for building operation (not domestic use) and cooling.”17 The maximum allowed energy use for dwellings is expressed in kWh/m2y and varies by geographic region. Also, a requirement on the average U‐value… exist[s], to ensure the thermal properties of the building envelope and to put a limit to the window area proportion.18 The stringency of the requirements also depends upon the type of heating source. Supply Chain
Since 1998, the Swedish Energy Agency has supported a network of Local Energy Advisors (LEA) in all local governments across Sweden. They provide the general public, small companies and organisations with advice and information on energy efficiency and renewable energy. They are supported by Regional Energy Offices that provide training and coordinate information activities.19
The basic component of the [Local Energy Advice] programme is subsidies to municipalities to enable them to employ a LEA… This advice is supposed to complement advice from market actors and the aim is that it should contribute to an increased awareness about energy efficiency and renewable energy. This is then supposed to translate into actual investments by households, companies, and organisations.20
Energy declarations for the Energy Performance of Buildings Directive must be prepared by accredited experts.21 The Swedish Board for Accreditation and Conformity Assessment (SWEDAC) annually audits each expert to “evaluate its correct use of methodologies and tools.”
16 McCormick, Kes; Neij, Lena; “Experience of Policy Instruments for Energy Efficiency in Buildings in the Nordic Countries”; International Institute for Industrial Environmental Economics (IIIEE), Lund University; Lund, Sweden; October 2009. Also Neij & Ofverholm, 2002; BBR 2006; and BBR 2008. 17 Levin, Per, “Energy Standards in Sweden” 2007. http://www.sbsa.gov.uk/pdfs/BNOR_Sweden_Final_Report.pdf 18 Levin. 19 McCormic and Neij. 20 Khan, Jamil, “Evaluation of the Local Energy Advice Programme in Sweden”, AID‐EE Project, http://www.aid‐ee.org/documents/005LocalEnergyadvice‐Sweden.PDF 21 Hjorth, Hans‐OK, “Implementation of the EPBD in Sweden: Status and Planning – June 2008,” Boverket. http://www.buildup.eu/system/files/P82Sweden‐June2008_p3214.pdf
International Comparison of Residential Energy Efficiency Programmes
110
Type of Industry Infrastructure Initiatives Publicly funded residential efficiency technician training programs
Yes – Operational
Industry‐funded residential efficiency technician training programs
NA
Public / government quality certification of efficiency service providers
Yes – Operational
Industry quality certification of efficiency service providers
NA
Fuel Poverty
Sweden’s redistributive socio‐economic policies are well known. Among the OECD countries, Sweden has the second‐lowest poverty rate22 and its poor are eligible for housing allowances and significant subsidies. “Swedish municipalities are responsible for housing their residents. Sweden has no specific ‘social housing’ sector, the problems solved in other countries by social housing are in Sweden addressed by the municipal housing sector.”23 The majority of public housing is serviced by district heating. Accordingly, Sweden has a unique challenge in supporting the space heating needs of its economically vulnerable citizens.
The robust economic growth enjoyed by Sweden over the past many decades has declined in recent years, placing stress upon the welfare state. Furthermore, housing policies in Sweden may need to change to comply with European Union competition rules.24 Nevertheless, the way Sweden addresses issues of fuel poverty is unusual and does not lend itself to comparison well.
Most Significant Lessons Learned
• The combination of aggressive fiscal policies and significant municipal ownership has enabled Sweden’s exemplary performance in energy and environmental matters. The suite of taxes and extraordinary level of subsidies make Sweden unique, but they have also fostered conditions favourable for undertaking energy efficiency measures in buildings. The socialist qualities of Sweden’s economy have provided the incentives and the resources for government‐owned entities to take the lead in reducing dependence on imported fossil fuels, providing a high‐quality living environment for its citizens, and making strides toward achieving environmental goals.
• An integrated portfolio of policies and measures has yielded success. A long history of progressive building codes and standards, followed by a dramatic national
campaign of prefabricated housing construction, extensive use of district heating, and an endowment with a very low‐carbon electricity generation portfolio have all contributed to Sweden’s ability to comply with it Kyoto Protocol obligations. Window labelling requirements, regular compulsory heating and ventilation system inspections, and financial incentives for retrofitting home space and hot water heating systems have all provided incremental energy efficiency benefits to the residential housing stock.
• Linking energy efficiency with diversity of energy supply. Sweden has long recognised the economic and environmental benefits to energy efficiency, as can be seen in its early inclusion of energy efficiency requirements in its building codes and its response to the oil shocks of the 1970s. The national government has provided subsidies for local energy expertise, available to the public for free, for many years. Through informational campaigns and coordination activities, the sophistication of the energy efficiency delivery infrastructure has been improved and residents have increased access to advice, contractors, and financing. The declaration requirements inherent to the EPBD implementation are poised to reinforce Sweden’s policies for residential energy efficiency.
THE UNITED STATES
Introduction
In the United States, most efficiency programs for existing homes are implemented at the state level, and there is tremendous variation among them. To provide more useful information on a few of the leading state programs, this profile includes additional information on two of them: California, because it has the largest programs; and Vermont, because it represents a prominent different approach to programme delivery structure, and has the highest per‐capita level of funding.
The United States does not have any binding commitments to reducing greenhouse gas emissions, although it is a party to the voluntary targets and reporting agreements reached in Copenhagen in December 2009. The climate legislation recently passed by the US House of Representatives (but not yet by the Senate) called for reducing greenhouse gas emissions from 2005 levels by 17% by 2020 and by 83% by 2050.1
In the absence of national goals, many states and local communities have adopted their own goals and policies. A large number of states have adopted greenhouse gas or CO2 reduction goals (many have called for 20% by 2020), but these are largely voluntary and few expect them to be met. On the other hand, energy savings goals for electricity and / or gas efficiency have been set by approximately 20 state legislatures (adopted in state law) or utility regulators (in setting firm goals to be met by regulated utilities), for savings of electricity and / or gas. These goals are increasingly being expressed as annual “savings as % of sales.” They are also referred to as Efficiency Portfolio Standards (analogous to Renewable Portfolio Standards).2 Three states have electric savings goals of over 2% per year; six have goals of between 1.5% and 2%; and eight have goals of between 0.3% and 1% per year.3 Key Statistics
Housing and Its Environmental Impacts Population (2007) 301.6 million4 Housing units (2007) 128.2 million5 % single‐family 68% % owner‐occupied 59%
% by space heating fuel
50% natural gas 34% electricity 8% fuel oil 6% LPG
1 http://www.americanprogress.org/issues/2009/08/pdf/rebuilding_america.pdf 2 ACEEE, Laying the Foundation for Implementing a Federal Energy Efficiency Resource Standard, http://aceee.org/pubs/e091.pdf. 3 ACEEE, The 2008 State Energy Efficiency Scorecard: http://aceee.org/pubs/e097.pdf. 4 U.S. Census information: http://www.census.gov/. 5 American Housing Survey: http://www.census.gov/hhes/www/housing/ahs/ahs07/ahs07.html.
International Comparison of Residential Energy Efficiency Programmes
114
Housing and Its Environmental Impacts 2% renewables, solid fuels, and other
Annual CO2e emissions (2007)6 Total (Mt) 5,967 Per capita (tons) 19.8 Residential CO2 emissions (Mt) 1,234 Residential % of total 21% Per dwelling unit (tons) 9.6 % of residential due to heating 68% (subject to revision) Carbon intensity of electricity (tons / TJ of electricity generated)
611 kg CO2 / MWeh
CO2 emission reduction goal No commitments at federal level; many states have set “20% reduction by 2020” goals.
Overview of Building Energy Efficiency Initiatives for Existing Homes
Although the United States is a world leader in energy consumption and carbon dioxide emissions, it is also a world leader in energy efficiency programs, and specifically in programs for existing homes. Currently, the vast majority of these are carried out at the state level, largely implemented by regulated electric and gas utilities under the supervision of utility regulators. National spending on efficiency programs in 2008 is estimated to be approximately $3.74 billion, (£2.31 billion), of which 87% was for electric utility programs. Of this total, approximately 25% ($932 million; £576 million) ) was in residential sector programs, mostly for existing homes.7
U.S. Investment in Energy Efficiency Programs
Type of Funding Total U.S. California Vermont
Total efficiency programme funding
$3,740 million $1,256 million $36 million
Total efficiency funding per capita$12.40
(£7.67)
$34.16
(£21.12)
$58.11
(£35.94)
Residential programme funding $931 million $199 million $9.9 million
Residential programme funding per household
$7.27
(£4.50)
$16.30
(£10.08)
$40.40
(£24.98)
At the national level, other than general public information and product standards, the most significant programs have been:
6 U.S. Energy Information Agency: http://www.eia.doe.gov/oiaf/1605/flash/pdf/flash.pdf. 7 CEE, 2008 Industry Report, http://www.cee1.org/ee‐pe/2008/
The United States
115
• The national low‐income Weatherization Assistance Program, funded through federal appropriations that have averaged on the order of $100 million (£62 million) to $450 (£278 million) annually, although recently supplemented with $4.7 billion of one‐time economic Recovery Act funds early in 2009. The programme is administered through state agencies that, in turn, subcontract with hundreds of local, community‐based agencies for programme delivery. Income‐eligible households receive whole‐house, comprehensive energy efficiency improvements, at no cost. Measures primarily focus on space and water heating, with an average investment of $6,500 (£4,020) per household. Evaluations have concluded that average savings for gas average 23% of pre‐treatment gas consumption.8
• The Home Performance with ENERGY STAR® programme. This is a programme developed and promoted by the federal government and currently implemented in 27 states.9 It establishes a common set of requirements and a unified brand for local programs, typically operated by utilities or states. The programme is designed to be delivered by trained and certified private‐sector “Home Performance” contractors. It requires comprehensive, whole‐building analysis, instrumented testing, quality control, and reporting. There are no national financial incentives, but many state and utility programs offer financial incentives for some or all measures recommended by approved Home Performance contractors.
• Federal tax credits. The government is providing tax credits for the two‐year period (2010‐2011) of up to $1,500 per household for qualifying energy efficiency and renewable energy improvements to existing single‐family homes. These credits are available for insulation, heating and cooling equipment, windows, roofs, solar and wind equipment, and other measures that meet qualifying specifications.
It should be noted that at the national level, there have been proposals for nationwide programs with federal grants and / or loans for efficiency improvements to existing homes. The Obama administration has identified “Recover Through Retrofit” as a priority strategy and proposed a major nationwide programme that would start in 2010 as part of economic recovery efforts.10 Other such programs are included in pending climate and energy legislation. A common element of these proposals is providing substantial grants to homeowners for comprehensive energy efficiency upgrades, ranging from 20% to 50% of the cost. All these proposals recognize the need for new financing mechanisms and support to assist homeowners in finding the funds to cover the initial cost of their share of the improvements.
At the state and local levels, approximately 30 of the 50 states have significant utility or state energy efficiency programs. Most of these contain specific programs that address existing homes. The most common are programs that use the national Home Performance with ENERGY STAR model. Electric and gas utility ratepayer‐funded programs typically support training and certification of contractors, provide programme marketing and promotion, and offer financial incentives and / or loans to homeowners. A few states also 8 Federal Weatherization program information: http://weatherization.ornl.gov/pdf/CON‐493FINAL10‐10‐05.pdf. 9 Environmental Protection Agency of the U.S. Department of Energy: http://www.energystar.gov/index.cfm?c=home_improvement.hm_improvement_hpwes. 10 Recovery Through Retrofit policy documents: http://www.whitehouse.gov/assets/documents/Recovery_Through_Retrofit_Final_Report.pdf.
International Comparison of Residential Energy Efficiency Programmes
116
provide funding (from tax revenues) for low‐income weatherization and / or fossil‐fuel efficiency programs. A few also offer tax credits for specific measures.
California
California delivers residential retrofit energy efficiency services through its individual distribution utilities. Beginning in 2010, however, many residential retrofit services (as well as residential lighting services) will be coordinated and made consistent among the state’s four investor‐owned utilities through the California Statewide Program for Residential Energy Efficiency (SPREE).11 SPREE targets 20% savings for up to 130,000 homes per year over the 2010‐2012 period. The three non‐lighting components of SPREE are:
• Home Energy Efficiency Survey (HEES), a survey initiative to help customers better understand their energy use, and make recommendations for installation of cost‐effective measures on a whole‐house basis.
• Home Energy Efficiency Rebate (HEEP), providing financial resources to help customers invest in energy efficiency measures such as household appliances and equipment.
• Appliance Recycling Program (ARP), an ongoing initiative to decommission and responsibly recycle old and inefficient household appliances.
Individual utilities will also each initiate a Whole House Performance Program (WHPP), to provide incentives, marketing, contractor support, and other measures to build the market for comprehensive residential retrofit work. Regulators have specifically directed utilities to coordinate WHPPs closely with emerging municipal financing options such as Property Assessed Clean Energy (PACE) programs. Those mechanisms enable homeowners to make substantial energy efficiency improvements and pay for them as a line item on their property taxes.
Vermont
Vermont delivers residential retrofit services through its “Energy Efficiency Utility,” Efficiency Vermont (structure described further below), coordinated with low‐income retrofit services that are provided through the state’s Weatherization programme. Efficiency Vermont’s initiatives for existing homes include:
• Home Performance with ENERGY STAR: Vermont is one of the states that participates in this national programme. Efficiency Vermont markets this service and maintains a list of certified contractors throughout the state, and provides incentives to the homeowner of 30% of project costs, of up to $2,500 (£1,546). Multiple funding sources enable retrofit needs to be addressed on a whole‐house, all‐fuels basis.
• Multi‐family: Efficiency Vermont works case‐by‐case with multi‐family property owners and managers, offering resources that include technical assistance, financial incentives, no‐cost or low‐cost direct installation of efficient lighting and water conservation measures, and appliance replacement. Starting in 2010, Efficiency
11 California Public Utilities Commission documents: http://docs.cpuc.ca.gov/PUBLISHED/AGENDA_DECISION/107378.htm#P1425_189845.
The United States
117
Vermont will also be offering a version of Home Performance with ENERGY STAR in the multi‐family market.
• Low‐income single‐family households: Efficiency Vermont’s 2009 ‐ 2011 contract includes a minimum performance requirement that at least $6.3 million (£3.9 million) be invested in services for low‐income Vermont families. In the area of residential retrofit, this is accomplished through a partnership with Vermont’s separate low‐income Weatherization programme. That state programme provides low‐cost or no‐cost direct installation of thermal efficiency measures; Efficiency Vermont provides electrical efficiency and water conservation measures, appliance replacement when cost‐effective, and fuel switching from electric space heat and water heating to fossil fuel systems.
• Information resources: Efficiency Vermont maintains an extensive website (www.efficiencyvermont.com), a toll‐free hotline for Vermont residents staffed by highly trained customer service call centre personnel, and other informational resources for residential customers. Efficiency Vermont has a computerized database with access to each electric account in the state, and can use that information to assist customers in analyzing their electric use. Other analysis tools such as energy consumption meters are offered at no charge.
Delivery Structure
The delivery structure for energy efficiency initiatives varies considerably.
There are two primary structural models for utility ratepayer‐funded programs:
• In most states, electric and / or gas distribution companies administer programs for their customers. Although state legislatures might provide guidance on policies or goals, these efforts are largely under the supervision of state utility regulators. Implementation of these utility programs is structured at the discretion of the utilities. The level of in‐house staffing varies considerably, but most utilities subcontract much of the delivery functions to competitively procured programme implementation contractors. Expenditures made for programs are recovered by the utilities though rates, with some states providing incentives to utility shareholders for achievement of specified goals.
• In some states, statewide efficiency portfolio management for all sectors has been assigned to non‐utility entities. In some states, these entities have a scope of responsibility that extends to unregulated fuels (Vermont, Maine, Delaware), renewable energy (Oregon, Wisconsin, Delaware) and transportation (Delaware). In Vermont, New Jersey, Delaware, Wisconsin, and the District of Columbia, competitively selected private entities administer the programme portfolios. This has been generally structured as a contract with these third‐party administrators (but Vermont is currently transitioning to a franchise‐like appointment model). All of these provide some level of performance‐based mechanism, where contractor compensation is linked to attainment of goals. In Oregon and Maine, sole‐purpose non‐profit entities have been established to administer efficiency portfolios. Among all these non‐utility portfolio managers, some rely largely on in‐house staffing to
International Comparison of Residential Energy Efficiency Programmes
118
manage implementation of programs, while others subcontract most programme management functions.
In the vast majority of these utility ratepayer‐funded programs, regardless of who acts as the portfolio manager, providing and installing the measures is by private‐sector contractors selected by the consumer.
For the low ‐income Weatherization Assistance Program, there is a reasonably consistent model throughout the country. Local, community‐based agencies are responsible for implementation within state and federal rules. Each local agency receives a contract to deliver a specified number of jobs in a given year within a certain budget. Most of these agencies use in‐house staff to recruit participants and determine income qualification, and to conduct the required energy audits. They then install the recommended measures, frequently using in‐house crews for insulation and air sealing, and subcontractors for space and water heating system improvements or replacements.
Who Plays Role
Role Utility and State Programs
Federal Low‐Income Weatherization Assistance Program
Programme oversight, setting targets
State utility regulators and / or state government
U.S. Department of Energy
Accountability for delivering results
Utilities or non‐utility portfolio managers (in VT, OR, WI, DE, ME, DC)
State grantees and community‐based Weatherization Agency sub‐grantees
Provision and installation of measures
Private contractors Hundreds of community‐based Weatherization agencies
Provision of public information and education
Utilities or non‐utility portfolio managers; government
State Energy Offices (not just for low‐income)
Financial assistance Utilities or non‐utility portfolio managers
U.S. Department of Energy (federal taxes); state funds (e.g., Vermont gross receipts tax)
Technical assistance Utilities or non‐utility portfolio managers; audit and installation contractors
Community‐based Weatherization agencies
Evaluation and savings verification
Third‐party evaluation contractors working for utilities, non‐utility portfolio managers, or government
Third‐party evaluation contractors working for federal or state government
The United States
119
California
Individual California distribution utilities deliver efficiency programs to their customers, under the regulatory umbrella of the California Public Utilities Commission (CPUC). CPUC approves the efficiency investment budgets and programs for each utility, following an established policy that all cost‐effective energy efficiency should be procured prior to the approval of new generation sources. As noted earlier, many residential programs are being coordinated under a single umbrella starting in 2010 to improve programme consistency and marketing; individual utilities also have the option of offering local programs above and beyond the major statewide initiatives (subject to CPUC approval). Vermont
Electric efficiency services are provided in nearly all of Vermont by Efficiency Vermont. Efficiency Vermont is currently operated by a private non‐profit organization under a three‐year performance‐based contract with the state’s utility regulators. Its scope includes electric efficiency and thermal efficiency, but not renewable energy. Efficiency Vermont is responsible for achieving energy‐savings results in all sectors, with a significant portion of compensation held back and paid only for verified achievement of savings goals. Efficiency Vermont develops and implements programs, including provision of marketing, training, technical assistance and incentives for energy efficiency investments, with actual installation of measures (including residential retrofit) carried out by the private sector at market rates. The Vermont Public Service Board recently issued an Order that will change the current contractual structure to a twelve‐year, franchise‐like “order of appointment.”
Funding and Financing
There are several sources of funding of the residential retrofit efficiency initiative in the United States. The largest source of funding is volumetric charges that are part of utility rates charged by electric and gas distribution utilities. Whether these changes exist, and the level of the charge, are established by legislation and state utility regulators. Many utilities and states also offer loan programs. There is currently no federal‐level funding of efficiency measures for existing homes, although proposals for significant grants are currently under consideration. A federal tax rebate programme providing tax credits for a two‐year period (2010 ‐ 2011) of up to $1,500 (£928) per household can be used for qualifying energy efficiency improvements to existing single‐family homes. A few states also provide limited funding through tax revenues or tax credits, but this is so small that it has little impact on residential retrofit of existing homes. The one exception may be Vermont’s Weatherization Trust Fund, which provides substantial funding for low‐income retrofits through a 0.5% gross receipts tax on sales of all heating energy fuels in the state.
As for financing, there are no national loan or loan guarantee programs, although several legislative proposals are pending. Hundreds of energy loan programs exist at the state and local levels, including those with reduced interest rates and / or payment on the utility bill. However, participation in these programs has been extremely low and the short
International Comparison of Residential Energy Efficiency Programmes
120
terms (three to five years) have limited their usefulness in supporting deep retrofit of homes.12
There have been efforts to develop and implement Energy Efficient Mortgage programs for over 20 years, mostly in a few states. These have largely been focused on new homes, but have also had pilot implementation focused on existing homes at time of sale.13 A new multi‐state pilot has recently been launched using the ENERGY STAR brand.14
A recent approach to financing that has achieved great attention and is being pursued in many states and communities is long‐term financing secured by property, generally being called PACE financing (Property‐Assessed Clean Energy).15 In this mechanism, municipalities collect repayment for the cost of home energy improvements, over periods up to 20 years, as a fee added to the property tax for homeowners who choose to use this mechanism. The obligation to pay is passed on in the event of property transfer. This mechanism appears to have the ability to finance deep, comprehensive retrofits. Authorizing legislation has been passed in 13 states. Type of Funding Public funding
Wires charge (electricity) Yes, in most jurisdictions (overall largest funding source for programs)
Gas “pipes” charge (natural gas)
Yes, in some jurisdictions (largest funding source where available)
Levy on unregulated fuels In only a few states (VT, OR, CT)
Tax Legislation proposed for federal grants to homeowners—not yet adopted
Tax credit Yes, current federal credit provides up to $2,500 (£1,546) for eligible measures
Utility obligation Only as part of Integrated Resource Planning regulatory requirements
Carbon revenue or other States in Northeast using revenue from regional greenhouse gas market; Vermont using revenue from regional electric capacity market
Financing of private investment
Government loan programs Not federally, but some state‐sponsored loan programs
Utility loan programs Many, typically for short terms (2 to 5 years); some with on‐bill financing
Property‐secured finance (PACE)
Recently authorized in more than 10 states, but operational in fewer than 10 communities
Energy mortgage products Very limited, but offered by some mortgage lenders and promoted by some state‐level programs
12 Energy Efficiency Financing Report, http://veic.org/ResourceLibrary.aspx 13 Faesy, Richard, “Understanding and Overcoming the Energy Mortgage Barrier, http://veic.org/ResourceLibrary.aspx 14 http://www.energystar.gov/index.cfm?c=bldrs_lenders_raters.pt_lender_mortgage 15 See www.pacenow.org
The United States
121
Type of Funding Dedicated institution (e.g.,
Green Bank) No, but proposals have been made at the federal level
California
The 2010 ‐ 2012 programme budgets and goals for California’s four investor‐owned utilities were recently approved by the CPUC, totalling $3.1 billion (£1.9 billion) and targeting savings of 15,910 GWh (cumulative), 3,459 MW (cumulative), and a reduction of 3.07 million metric tons of CO2 emissions. This budget represents a 42% increase compared to the prior three‐year period.16 These costs are all recovered by the utilities through electric and gas rates.
In addition, several communities in California have been leaders in implementing PACE financing, as described previously.
Vermont
Vermont’s efficiency efforts are funded primarily by volumetric charges on all retail electricity and gas sales in the state. The electric charge typically represents just under 5% of customer’s monthly bills. Vermont invests more dollars per capita in energy efficiency than any other state. Efficiency Vermont also receives funding from other sources. In particular, it receives revenues from the state’s participation in regional grid capacity auctions (Efficiency Vermont bids efficiency into these auctions as an electrical capacity, demand‐side resource) and from the state’s participation in the regional carbon cap‐and‐trade market (the Regional Greenhouse Gas Initiative). Total revenues from both sources have been increasing, and are expected to reach approximately $5 million per year by 2011. They are used by Efficiency Vermont for unregulated fuels efficiency measures (for example, measures that results in reductions in the use of heating fossil fuels).
In customer financing, Vermont enacted enabling legislation in 2009 authorizing towns and cities to implement PACE financing programs. PACE makes it possible for homeowners to make investments in energy efficiency and renewable energy, financed through their local municipality, secured by a lien on their property, and repay it on part of the property tax bill. The enabling legislation requires that Efficiency Vermont develop the list of PACE‐eligible efficiency measures and verify all project energy savings analyses.
Measures Promoted
The national low‐income Weatherization Assistance Program has a “whole‐house” focus, approaching the house as a complex “system” of building envelope and mechanical equipment where interrelated issues of energy, moisture, combustion safety, and indoor air quality must all be addressed. Indeed, it did much over the past fifteen years to advance this concept, the associated techniques for addressing the problems, and the concept’s practical implementation. For example, blower doors are routinely used to test air leakage and guide air sealing work, and standard practice includes combustion efficiency and back‐drafting
International Comparison of Residential Energy Efficiency Programmes
122
safety tests. While certain other measures might be included, the primary focus is on building shell (for example, insulation, air sealing) and heating equipment (furnaces, boilers and water heaters). The eligibility of measures is determined case‐by‐case on cost‐effectiveness to the consumer. That said, home repairs necessary to allow energy improvements are eligible measures, as are energy‐related health and safety measures.
For utility ratepayer‐funded programs for existing homes, it is often the case that eligibility for technical assistance and financial incentives will be limited to customers who heat with the fuel supplied by the utility (gas or electric). Further, incentives will, in most cases, be limited to those that save the type of energy supplied by the utility. For combined gas and electric utilities this can provide comprehensive treatment, as it will for all‐electric homes. But for others, it can lead to piecemeal treatment. While some utility programs are single‐measure, the vast majority have adopted more comprehensive strategies, including all measures determined to be cost‐effective from the perspective that installation of the measure avoids what would have been a utility cost of consumption.
Although efficiency programme portfolio managers are considering integration of solar electric and smart meters into their programs for existing homes, these are almost exclusively separate initiatives at this time.
Many programme administrators include behavioural measures as part of their strategies for efficiency in existing homes, but few compute or claim any savings for such efforts at this time. It should be noted, however, that non‐energy benefits of residential efficiency improvements have been accounted for in evaluation of the national low‐income Weatherization Assistance Program and that Vermont is considering some level of monetization for non‐energy benefits to be used in cost‐effectiveness screening. Currently implemented approaches to behavioural measures range widely, and include:
• providing behavioural tips for saving energy
• custom advice offered during the retrofit process
• one or more energy counselling sessions with the consumer
• action agreements with consumers
• in‐home displays of energy use
• providing peer comparison energy use
Measures “Whole‐house” deep and comprehensive Yes Limited measures
Appliances No, but addressed through other programs
Lighting No, but addressed through other programs
Solar water heating Yes Other efficient water heating equipment Yes
The United States
123
Measures Efficient windows Yes Biomass heating Yes Solar electric No Smart meters & in‐home displays No Behavioural measures No
California
As previously noted, California regulators and utilities are increasingly focused on taking a whole‐house approach to offering incentives and supporting residential retrofit. In particular, the CPUC’s Strategic Plan for the residential sector calls for the whole‐house approach to guide the “purchase and use of existing homes, home equipment (e.g., HVAC systems), household appliances, lighting, and ‘plug load’ amenities,” In addition, plug loads will be managed through the deployment of higher‐efficiency equipment, as well as technology that allows customers to understand and manage their energy use.17
Vermont
Efficiency Vermont promotes comprehensiveness and depth of savings in its approach to residential retrofit. Measures range from envelope improvements (air sealing, insulation, etc.) to water conservation (low‐flow showerheads), to lighting (replacement of incandescent lighting with CFLs and to a limited extent, LEDs), to appliances (replacement of old appliance with efficient, ENERGY STAR‐rated units) and selective fuel switching. Efficiency Vermont staff work closely with representatives of the Vermont Public Service Board and the Vermont Department of Public Service to “characterize” the energy efficiency savings associated with each type of measure, so that programme savings can be tracked with precision. Measures are recommended and eligible for incentives based on cost‐effectiveness testing using the Societal Cost Test, which assesses the lifetime costs and savings of alternative measures, with the addition of an environmental cost adder and a 10% adjustment to account for the lower risk of efficiency.
Codes and Standards
There are no federal codes or standards regarding the efficiency of existing buildings, though some legislative proposals have been made for national building labelling and disclosure. Some municipalities have enacted residential conservation ordinances that prescribe minimum energy efficiency features to be implemented (if not already present) at the time of property transfer. The first of these municipalities was Berkeley, California, begun in 1987 and expanded now to address all buildings.18 Other communities in California, including San Francisco, and Burlington, Vermont, have similar ordinances of varying scope and stringency. There has been considerable interest in implementing such time‐of‐sale energy standards at the state level, but progress has been limited to the introduction of proposed legislation in a few states. There have also been proposals for
International Comparison of Residential Energy Efficiency Programmes
124
time‐of‐sale energy rating and labelling, at both the state and federal levels, but little progress has been made toward adoption. Only in the District of Columbia and New York City has the concept of such rating and labelling been adopted—and there, only for larger buildings (although it can be expected to apply to multi‐family residential buildings).
California
Several California communities, including Berkeley and San Francisco, require that minimum efficiency standards must be met by all buildings at the time of property transfer. Similar statewide requirements have been considered, but not enacted.
Vermont
The City of Burlington has had a municipal ordinance in place for over twenty years that requires minimum energy efficiency levels at time of property transfer for rental housing. A proposed statute to institute state‐wide rating and labelling at time of sale for all buildings was introduced in the Vermont legislature in 2009, but failed to secure support.
Supply Chain
Historically, the national low‐income Weatherization Assistance Program, has served as perhaps the largest source of training and workforce development for home energy improvements. For over three decades, it has trained thousands of energy auditors and technicians, many of whom have gone on to other jobs in the energy efficiency field. Regional weatherization training centres have been established, just for the purpose of providing high‐quality training for this programme. For more than ten years, the second major national locus of training has been in various states to meet national certification requirements of the Building Performance Institute. Contractors certified by the Building Performance Institute are eligible to provide services under the Home Performance with ENERGY STAR programme.
Recently, the national level of interest in workforce development has dramatically increased, as evidenced in part by the allocation of $500 million (£309 million) for this purpose as part of economic stimulus spending in early 2009.
Many states, educational institutions and labour organizations are also analyzing and planning for how to meet the expected labour requirements for stepped‐up building retrofit initiatives.19 Yet there are few data on the size of the current workforce at a national level, or quantitative assessment of future needs. There is general agreement that the best approach to meeting new training needs is to build on existing educational and training programs, including those offered by vocational / technical high schools, community‐based organizations, colleges and universities, labour unions, and trade associations.
For energy efficiency improvements to existing homes, there is one certification initiative that has been widely adopted. The Building Performance Institute certifies
auditors, energy efficiency installation personnel, and other professionals in the residential and multifamily building performance contracting industry.
BPI contractors have completed rigorous training, administered by a network of affiliates, in home performance evaluation focused on the house‐as‐a‐system concept. These systems include heating, ventilation, and air conditioning equipment and the building envelope or outer shell—the foundations, walls, roof, and all their component parts like windows and doors”20
High‐quality installation for heating and air conditioning equipment is the subject of another widely accepted industry training and certification programme, offered by North American Technician Excellence.21
Type of Industry Infrastructure Initiatives Publicly funded residential efficiency technician training programs
Yes
Industry‐funded residential efficiency technician training programs
Yes
Public / government quality certification of efficiency service providers
Yes, by requiring industry certification for programs
Industry quality certification of efficiency service providers
Yes
California
California’s Workforce Education & Training (WE&T) programs have a mission to develop “the human capital necessary to achieve California's energy efficiency and demand‐side management potential.”22 These programs are organized into two primary categories: Centergies, which offer seminars, workshops, and other training opportunities related to energy efficiency; and Connections, an educational programme that develops and offers curriculum to inspire interest at all grade levels in the energy field, working in collaboration with labour groups, schools, and other institutions. For 2010 to 2012, California’s four investor‐owned utilities are authorized to spend over $125 million (£77.3 million) on these activities. The initiative also includes funding for planning activities—in particular, the undertaking of a statewide workforce development needs assessment to inventory the many existing programs and develop strategies for integrating those programs with utility‐sponsored efforts.
Vermont
Efficiency Vermont’s Home Performance with ENERGY STAR network currently has approximately 40 contractors, who have been BPI trained and certified. Efficiency Vermont provides training, marketing support, and other assistance to this contractor network, which is expected to grow over the coming years. Vermont Technical College has recently
International Comparison of Residential Energy Efficiency Programmes
126
developed a set of training modules to train for a variety of roles in the building energy improvement industry.
Fuel Poverty
As noted earlier, the United States has had a national low‐income Weatherization Assistance Program for over three decades. The programme was initiated primarily as an anti‐poverty programme, and secondarily as an energy efficiency and job‐training programme. More detail is provided in prior sections and illustrated further in the following examples of Vermont and California.
California
California’s Department of Community Services and Development (CSD) administers the state’s Weatherization Assistance Program,23 which seeks to reduce both heating and cooling costs for low‐income families, with a particular focus on households with elderly residents, children, and individuals with disabilities. Eligible customers receive free weatherization services such as attic insulation and caulking. Like other states, California received a significant one‐time infusion of federal funding for its programme through the ARRA, totalling $185 million.24
Vermont
Efficiency Vermont is contractually obligated to invest a certain share of its budget each year in services that will benefit low‐income families, and in the residential retrofit market delivers those services in cooperation with the state’s separately‐funded low‐income Weatherization programme. Vermont’s Weatherization programme is funded through a combination of state and federal resources, and provides no‐cost or low‐cost retrofit services to Vermont households at or below 60% of median income (for 2009, approximately $44,000 per year for a family of four (£27,200). It is administered by the state’s Office of Economic Opportunity and delivered in the field by five regional non‐profit organizations. The agencies conduct outreach, intake and income screening to secure eligible participants. They then conduct audits to determine which measures will be cost‐effective on a case‐by‐case basis and install these measures at no cost to the consumer. The most typical measures are blower‐door guided air sealing, blown‐in cellulose insulation and heating system upgrades, but any cost‐effective measures can be installed.
Most Significant Lessons Learned
• Whole‐house treatment. It has been widely concluded that residential energy improvements need to be approached on a whole‐house basis, recognizing the house as a complex system of inter‐related components. Air leakage, insulation, moisture, heating systems, combustion safety, moisture problems, air quality, etc., are all inter‐related and need to be considered comprehensively.
• Going for deep savings. Increasingly, advice and programme designs are promoting deep savings, instead of single measures or partial treatment. There is a growing recognition that it is more efficient and avoids excessive transaction costs if residential improvements are all made at one time, rather than one‐at‐a‐time over time. Moreover, many have also concluded that going for the most cost‐effective measures first can render further measures unlikely or impossible to achieve. This can happen both because of burdening the remaining, less cost‐effective measures with further transaction costs and because these measures will be less attractive (or unattractive) to homeowners.
• Measures. Blower‐door guided air sealing is typically the most cost‐effective measure and is applicable to virtually all existing homes. Air sealing in lofts should be conducted before adding insulation. Blown‐in cellulose (recycled) has been found to be widely applicable, effective and inexpensive for both loft and wall‐cavity insulation. Heating and cooling system efficiency needs to address not just equipment efficiency, but also quality installation, controls and distribution system efficiency. In many situations, other building improvements may be required to install energy measures, for example roof or chimney repairs, updating of knob‐and‐tube wiring, and addressing moisture sources. These can be considered energy‐related improvements that can be included in an upgrade package if the total costs can be supported by the benefits.
• Quality assurance. It is important that programs asking consumers to invest in efficiency improvements need to provide consumers with confidence that quality services will be provided that will deliver promised savings. This requires a workforce with specific, specialized expertise. Contractor training and certification, with independent, oversight of quality and performance are key strategies for success.
• Funding and financing. In the current market, public incentives typically need to be at least one‐third of the cost to achieve substantial interest and participation. But for much of the population, the first cost of major improvements remains a barrier without financing of the homeowner’s investment. Conventional consumer loan programs can help, but major improvements will require financing mechanisms with longer repayment terms (up to 20 years) and methods to address the significant portion of the population that do not have sufficient credit to be approved for loans. The Property Assessed Clean Energy (PACE) mechanism is a promising mechanism to address these issues, but it has not yet built up a substantial history of experience.