681 A Comparison of Air Leakage Prediction Techniques for Auxiliary Ventilation Ducting Systems A.D.S. Gillies and H.W.Wu University of Queensland, Brisbane ZLD 4072, Australia ABSTRACT This paper briefly reviews prediction techniques for detennination of leakage and friction along auxiliary ventilation ducting systems. In order to compare various prediction techniques that have been developed over the past, a macroscopic investigation of air leakage and friction resistance of auxiliary ventilation ducting systems has been undertaken. Measurements were conducted on 450 and 915 mm diameter fabric ducting over 100 m duct length to determine frictional resistances and the extent of leakage. Due to the high degree of accuracy required and the large volume of data that needed to be collected, electronic pressure transducers were used with computer for data recording. Conceptual models that describe the leakage characteristics of auxiliary ventilation ducting systems were developed based on this infonnation. It was found that these models provided good correlation with most of the existing prediction techniques. The experimental methodology relying on computer data acquisition has allowed the accuracy of measured values to be treated with a high degree of confidence. The reliability of the developed models allows prediction of leakage, frictional impedance and airflow with enhanced confidence. KEYWORDS Auxiliary Ventilation, Duct Leakage, Leakage Coefficient, and Leakage Prediction Techniques. INTRODUCTION Mine intake and return airways are used to ensure the continual circulation of fresh air. Auxiliary ventilation is required for dead end workings such as development headings, draw points and some stopes. The most common form of auxiliary ventilation is a fan and ducting system that is relocatable as the mine develops. The most dynamic fonn of ducting is some fonn of fabric or canvas due to its lightweight and ease of installation. However the porous nature of these ducting materials results in leakage. Leakage of air from ducting is affected by the following factors: • Ducting material characteristics • Quality of installation •Number of joints •Total length of ducting • Pressure differences between the inside and outside of the ducting • Diameter of the ducting A brief review of prediction techniques for determination of losses due to leakage and friction has been undertaken. The two specific objectives of this paper are to evaluate the efficiency and effectiveness of auxiliary ventilation ducting and secondly to derive an approximate method. for the prediction of leakage from auxiliary ventilation. THEORY OF LEAKY DUCT Early investigations of auxiliary ventilation ducting leakage performance assumed that the problem was purely practical and could be eliminated through proper installation and maintenance. Greater emphasis was placed on theoretical studies as it became apparent that some degree of leakage is inevitable even under the best conditions. These studies primarily focused on mathematical analysis of ducts with uniformly distributed leakage resulting in complex integrals that required numerical solutions. More recent work assumes the existence of discrete leakage paths and analyses the leaky duct as a ventilation network. Magnitude of Leakage Many mining operations classify the quality of auxiliary ventilation ducting in terms of the percentage or volumetric
Transcript
681
A Comparison of Air Leakage Prediction Techniques for Auxiliary Ventilation Ducting Systems
A.D.S. Gillies and H.W.Wu University of Queensland, Brisbane ZLD 4072, Australia
ABSTRACT
This paper briefly reviews prediction techniques for detennination of leakage and friction along auxiliary ventilation ducting systems. In order to compare various prediction techniques that have been developed over the past, a macroscopic investigation of air leakage and friction resistance of auxiliary ventilation ducting systems has been undertaken. Measurements were conducted on 450 and 915 mm diameter fabric ducting over 100 m duct length to determine frictional resistances and the extent of leakage. Due to the high degree of accuracy required and the large volume of data that needed to be collected, electronic pressure transducers were used with computer for data recording. Conceptual models that describe the leakage characteristics of auxiliary ventilation ducting systems were developed based on this infonnation. It was found that these models provided good correlation with most of the existing prediction techniques. The experimental methodology relying on computer data acquisition has allowed the accuracy of measured values to be treated with a high degree of confidence. The reliability of the developed models allows prediction of leakage, frictional impedance and airflow with enhanced confidence.
KEYWORDS
Auxiliary Ventilation, Duct Leakage, Leakage Coefficient, and Leakage Prediction Techniques.
INTRODUCTION
Mine intake and return airways are used to ensure the continual circulation of fresh air. Auxiliary ventilation is required for dead end workings such as development headings, draw points and some stopes. The most common form of auxiliary ventilation is a fan and ducting system that is relocatable as the mine develops. The most dynamic fonn of ducting is some fonn of fabric or canvas due to its lightweight and ease of installation. However the porous nature of these ducting materials results in leakage.
Leakage of air from ducting is affected by the following factors:
• Ducting material characteristics • Quality of installation •Number of joints •Total length of ducting • Pressure differences between the inside and outside of
the ducting • Diameter of the ducting
A brief review of prediction techniques for determination of losses due to leakage and friction has been undertaken. The
two specific objectives of this paper are to evaluate the efficiency and effectiveness of auxiliary ventilation ducting and secondly to derive an approximate method. for the prediction of leakage from auxiliary ventilation.
THEORY OF LEAKY DUCT
Early investigations of auxiliary ventilation ducting leakage performance assumed that the problem was purely practical and could be eliminated through proper installation and maintenance. Greater emphasis was placed on theoretical studies as it became apparent that some degree of leakage is inevitable even under the best conditions. These studies primarily focused on mathematical analysis of ducts with uniformly distributed leakage resulting in complex integrals that required numerical solutions. More recent work assumes the existence of discrete leakage paths and analyses the leaky duct as a ventilation network.
Magnitude of Leakage
Many mining operations classify the quality of auxiliary ventilation ducting in terms of the percentage or volumetric
682 PROCEEDINGS OF THE 8TH US MINE VENTILATION SYMPOSIUM
leakage that occurs over a 100m interval. This principle is scientifically unsound as variations in the air pressure along the length of the duct are not considered. A scientific method for expressing the magnitude of leakage from a ventilation column is through the leakage coefficient, a concept developed by the British National Coal Board. The leakage coefficient Lc is defined as the volume of air in m3 Is that would leak from a 1000 m duct subjected to a uniform pressure of 100 Pa.
Calculation of the leakage coefficient of a duct from first principles is a highly complicated mathematical exercise as in practice ducts are never under uniform pressure. The National Coal Board leakage nomogram was developed to determine the leakage coefficient as referenced in metric units by Le Roux (1979). Robertson and Wharton (1980) developed a good approximation for the leakage coefficient.
(1)
The pressure is always greatest adjacent to the fan and so a duct section near the fan will leak significantly more than a duct section further away. When the duct is extended the fan duty pressure will increase and leakage will increase from all sections of the duct. If two different size columns are constructed and installed to equal standards it would be expected that the larger diameter duct would have a greater Lc on account of the increased area of the material seams. and joints.
Other parameters commonly used to evaluate the performance of auxiliary ventilation columns are the volume and pressure increase ratios. The volume increase ratio is the volume rate handled by the fan over the actual volume reaching the working face. The pressure increase ratio is defined as the pressure required to deliver a specified quantity through the duct under leaky conditions over the pressure required to deliver the same volume under leakless conditions. Roberts (1960) stated that the volume ratio and the pressure increase ratio are both approximately equal and given by:
(2)
Mathematical Solutions
Mathematical solutions have been proposed for duct leakage which take into consideration the pressure gradient along the duct. Using the assumption that leakage is uniformly distributed along the length of a duct
Holdsworth, Prichard & Walton (1951) proposed that the variation in Q can be represented by the following differential equation:
(3)
and the relationship between the pressure gradient and flow rate in a leakless duct given by:
(4)
Using the two differential equations 3, 4 and a number of assumptions, a pressure increase and volume increase ratio can be obtained:
• leakage index varies between 1 and 0.5, • velocity pressure does not affect the leakage of the
duct; shock losses are not taken into consideration.
Holdsworth, Pritchard & Walton (1951) demonstrated the close correlation between experimentally derived leakage constants and theoretically predicted values for both forcing and exhausting ventilation. Similarly Metcalf (1958) obtained a volume and pressure increase ratio by dividing the length of duct into short intervals (N), each having an individual leakage resistance CRr) and the total length of duct having a combined leakage resistance CR1). A relationship between Po and P was established by considering the leakage quantities through the joints between the duct lengths. The quantity of air can be determined by integrating the equation for leakage. A change in quantity due to leakage results in an immediate change in pressure. The pressure after N duct intervals can be determined by integrating this expression. This change in pressure will result in a change in the quantity of leakage so a more accurate approximation for leakage is obtained. A number of iterations of the above procedure will result in the following equations.
A COMPARISON OF AIR LEAKAGE PREDICTION TECHNIQUES FOR AUXILIARY VENTILATION DUCTING SYSTEMS
683
duct is possible by assuming a number of discrete leakage (7) paths and treating the leaky duct as a ventilation network.
(8)
These series converge rapidly because the dimensionless factor (Nu<RrfR.l)0
·5) varies from a small factor to close to
unity. In theory it is possible for a duct to be so long or so leaky that the series does not converge. For practical purposes the volume and pressure increase ratios can be expressed in a simplified form (Metcalf, 1958).
In Figure I, air enters the duct and leaves either through leaky joints or via the exit of the ducting.
Figure 1. Vutukuri 's network analysis for leaky duct.
(9) A number of assumptions have been made in the
Summation of Discrete Leakage Paths
Dzidziguri and Cholikidze ( 1977) proposed a method for the summation of discrete leakage paths for calculating the total air losses in long air ducts. Assuming that air leakage in the first I meters of a duct is ~Q m3 /s, and the initial quantity of air beyond the fan is Q0 m3/s, then a leakage coefficient can be described as 8 = (llQ/Qo) x 100, (%). Summing the air leakages over the entire duct and simplifying, an equation for the total air losses over the entire duct length is given by:
1 §(n-1) + £5 2 (n-l)(n-2)
100.2! 100 2.3!
L llQn = n£5 Qo £53
(n -l)(n- 2)(n- 3) + 100 1003.4!
§ 4 (n -1)(n- 2)(n- 3)(n- 4) .+. (10)
Sufficient accuracy can be obtain by considering only the first five to six terms, and for low values of 8 (0.4 -1.0%) three terms are sufficient, the error incurred being less than 2.0% (Dzidziguri and Cholikidze, 1977).
Ventilation Network Analysis
Vutukuri (1983) proposed that analysing flow in a leaky
following ventilation network analysis equations proposed by Vutukuri.
• Leakage paths have some resistance and the resistance coefficient of leakage paths (Rp) is the same (all joints and other leaks are made and maintained in the same fashion).
• The resistance coefficients of all duct sections are the same CR!).
• The pressure outside the duct is assumed to be the same along the airway.
With a fan is installed at (A), the intersection of the fan opera~g curve and the duct resistance curve gives the operating data for the fan (0Aa) and
and because these are in parallel
RsF QsF2
=Rsc Qsc2
(11)
(12)
Using Equations 11 and 12 the leakage from B to F can be found.
(13)
This can be repeated in a similar fashion to find discrete values for all leakage paths. Using a computer program to
684 PROCEEDINGS OF THE 8TH US MINE VENTILATION SYMPOSIUM
calculate the leakage Vutukuri found that the results were within 2.0% of those obtained by the method developed by Holdsworth, Pritchard and Walton (1951).
MEASUREMENT OF DUCf LEAKAGE
The basic philosophy underlying the experimental testing is simulation of actual field conditions and development of relationships, which can be utilised to more accurately predict the behaviour of auxiliary ventilation systems. Secondary ventilation using flexible fabric ducting is primarily associated with the metalliferous mining industry in Australia although some application is found in coal in stone development and with use of dust scrubbers in development headings. A forcing auxiliary ventilation system employing circular fabric ducting was used throughout the study.
In order to compare various prediction teclmiques that have been developed over the past, a macroscopic investigation of air leakage and friction resistance of auxiliary ventilation ducting systems has been undertaken. Measurements were conducted on 450 and 915 mm diameter fabric ducting over 100m duct length to detennine frictional resistances and the extent of leakage.
The experimental methodology adopted was somewhat more rigorous than that generally used in industry for checking ducting flow. Due to high degree of accuracy and large amount of data required electronic precision pressure transducers were used with portable computers for data recording. Pitot -static tube traverses were conducted at strategic intenrals along the length of the ventilation duct in order to measure the total and static pressures. From this information the velocity pressure and volmnetric airflow rate through the duct at a specific location could be determined.
Two commercially available auxiliary ventilation duct types of standard industry specifications, Types LH and S, were tested. Twenty meter lengths of LH type were tested in duct diameter sizes of 450 and 915 mm and S type tested in one diameter size of 915 mm. The LH ducting is a lightweight product sewn from two pieces of materials stitched along top and bottom seams. The S type ducting is made of a heavier and more durable material from a single length of material joined by stitching at the top attachment flange. Hose clips were used to hang the ducting from catenary wire. The catenary wire was supported by a system of metal pillars set 8-10 m apart. Figure 2 gives a graphical representation of the location of the joins and metal pillars along the entire 100m test length. A 50 kW forward curve bladed centrifugal fan forced air along the ducting.
Figure 2. Location of joints and metal support pillars along the dueling 100 m traverses.
A Pi tot -static tube connected to the pressure transducers was used to measure total and static pressures while a laptop computer recorded data. This apparatus is shown in use in Figure 3. Two digital pressure transducers were used. his package has the· ability to provide direct pressure results in any engineering units. The degree of accuracy, which the sampling resolution of the transducer produced increases with higher velocities. The predicted error for velocities below 8 m/s is greater than 0.25% and therefore these velocities were avoided in tests.
Experimental Procedures
An equal area traverses was used to measure the quantity of airflow at a given point. Circular ducts were divided into a number of concentric areas and readings taken at the center of each area along horizontal and vertical diameter arms. Five concentric areas were used for each cross section traverses. The center point of the duct was taken as a twenty first measurement point.
Figure 3. Measuring apparatus, suspension and join of LH dueling.
A COMPARISON OF AIR LEAKAGE PREDICTION TECHNIQUES FOR AUXILIARY VENTILATION DUCTING SYSTEMS
685
It was decided to take the traverses both on the upstream and downstream sides of the joints. It must be noted that a traverses point was not placed close to a joint or obstruction to avoid disturbance of airflow and consequently were located five meters upstream and downstream of joints. No measurements were possible at the second joint as this section of the ducting was strung across a gully. The points along the 100 m length of ducting where traverses were undertaken are illustrated in Figure 2.
The precise location of the position of the measurement points was found by inflating the ducting and hanging a piece of string with weights attached to both ends across the ducting. Holes were made in the sides of the ducting for the horizontal traverses where the string left the bag. The location of the holes for the vertical traverses was found by halving the distance between the string.
The quantity flowing through auxiliary ducting will depend upon both fan operating curve and the resistance of the system. The fan operating curve is fixed as the blade angle and speed of the fan were fixed, hence the quantity flowing through the ducting could only be changed by varying the resistance of the system. As the frictional impedance factor of a particular test ducting length was assumed not to vary throughout, airflow was controlled by a mechanical damper located on the outlet end of the fan acting as a throttling device.
Measurement Procedures
Once the auxiliary ducting had been hung points for incisions were located. An incision was made large enough for the positioning of the Pi tot-static tube but small enough to limit leakage. A smaller incision was made on the opposite side of the ducting to allow for the insertion of a support bracket to guide the Pitot-static tube. The measurement procedure then proceeded as follows :
1. Transparent tubing used to connect the transducers to the total and static Pitot-static tube ports were checked for cuts, dirt and water.
2. Dry and wet bulb temperatures were taken at the inlet of the fan using a whirling hygrometer.
3. Atmospheric pressure was taken at the inlet of the fan using a pressure transducer.
4. The fan was turned on and t11e damper adjusted until the required velocity could be observing as a center reading at the first ducting traverses point.
5. The support shaft for the Pitot-static tube was inserte4 and sealed at the first traverses measurement point.
6. The two transducers were connected by cable to the computer and the interface program activated.
7. The Pitot-static tube was inserted along the support
bracket. 8. The head of the Pitot-static tube was positioned in the
ducting by aligning the edge of the ducting with the corresponding mark on the Pi tot -static tube stem. Once aligned the computer was prompted to take readings via an operator switch.
9. A total of 22 measurements were taken in both the horizontal and vertical traverses. This exercise occurred three times to ensure repeatability of results.
10. After completing the measurements the ducting was sealed using cloth tape.
Steps 5-10 were repeated at all measurement points along the ducting.
RESULTS AND TREATMENT OF DATA
Tests were performed on two types of ducting supplied by an Australian ducting manufacturer. These products were new and had no wear, tears or holes resulting from typical mining activities. Two independent sets of measurements at a number of velocities were perfonned on each ducting product to determine friction factor impedance and leakage characteristics.
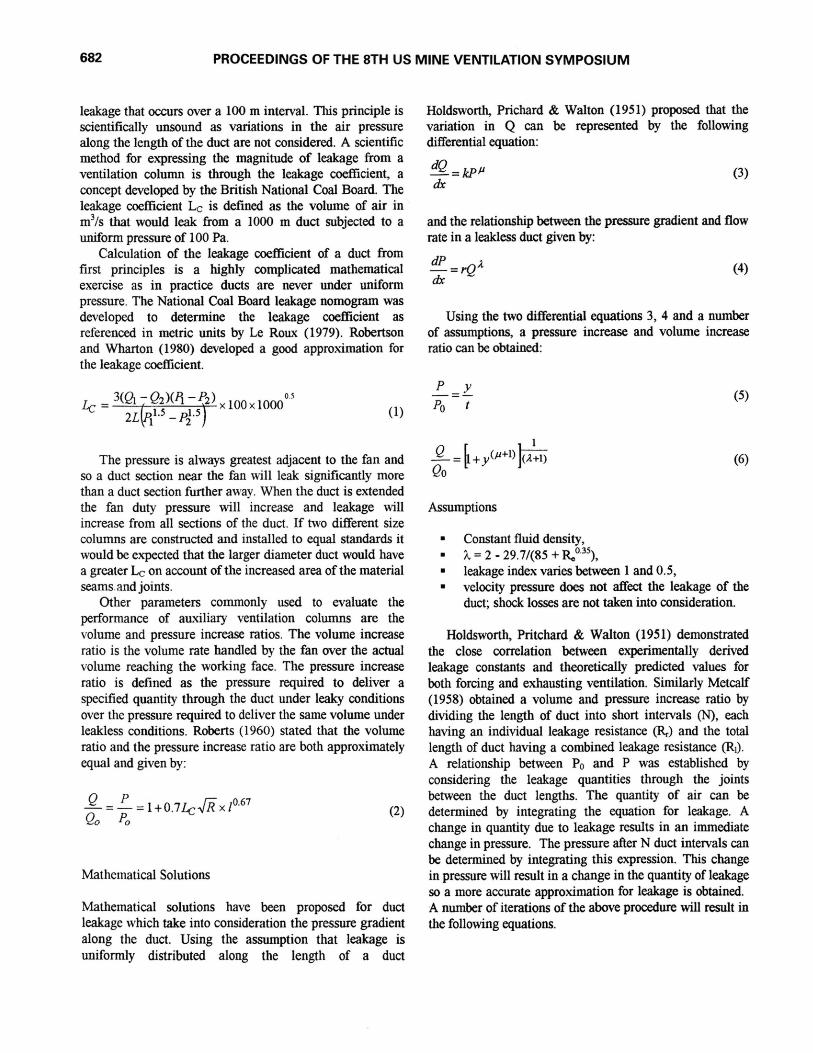
The quantity of air at each measuring station was calculated using spreadsheet program that directly accepted the transducer pressure measurements. Figure 4 shows the summarised results for quantity verses distance at four different air velocities for LH type ducting. These measurements indicate an increase in quantity between 15 and 25 m from the fan for all velocity tests performed on the larger diameter ducting. This could be due to the high upstream static pressures stretching the ducting fabric beyond its nominal diameter resulting in a lower measurement for velocity pressure and hence a lower quantity calculation. In Figure 5, the measurements at 15 m from the fan have been omitted from information shown Figure 4, and this is believed to show a more representative quantity verses distance relationship. With these changes it can be seen that the R 2 values have improved.
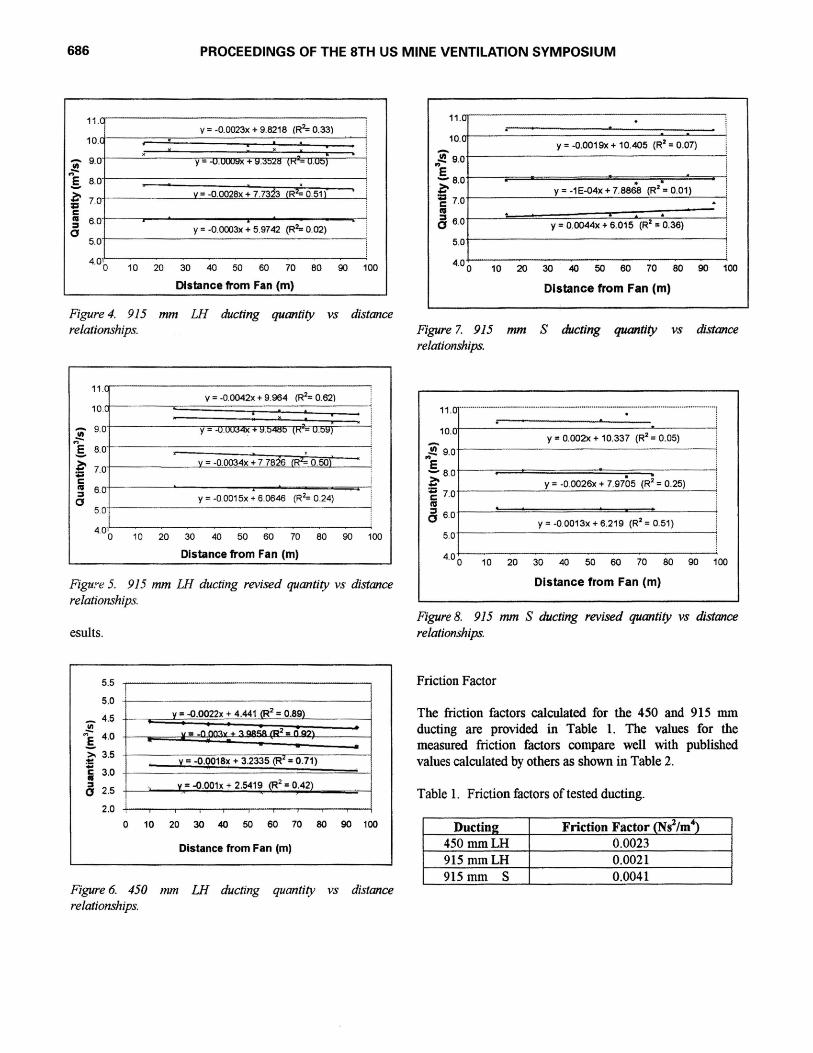
Figure 6 and 7 show the summarised results of quantity verses distance relationships for 450 mm LH type and 950 mm S type ducting. In Figure 7, it can be seen that there is an increase in quantity from the 7 5 m measurement point to the 9 5 m measurement point. The static pressure within the ducting was unable to create a perfectly circular cross section resulting in a decrease in cross sectional area from 75 to 95 m and hence an increase in the velocity pressure measurements was experienced. As the cross section between 75 and 85 m could not be measured accurately, these measurement points have been disregarded. Figure 8 shows a more representative quantity versus distance from Fan relationships for the Type S ducting neglecting the 85 and 95 m results.
686 PROCEEDINGS OF THE 8TH US MINE VENTILATION SYMPOSIUM
E - s.ot----r=;::;:t::;;;:=======~=:;----"'4 ~ y = -0.0026x + 7.9705 (R2 = 0.25) ~ 7.0 I'll a so
y = -0.0013x + 6.219 (R2 = 0.51) 5.0
4·0 0 10 20 30 40 50 60 70 80 90 100
Distance from Fan (m)
Figure 8. 915 mm S ducting revised quantity vs distance relationships.
Friction Factor
The friction factors calculated for the 450 and 915 mm ducting are provided in · Table 1. The values for the measured friction factors compare well with published values calculated by others as shown in Table 2.
Table 1. Friction factors of tested ducting.
Ductin2 Friction Factor (N ~ /m 4)
450 mmLH 0.0023 915 mmLH 0.0021 915mm s 0.0041
A COMPARISON OF AIR LEAKAGE PREDICTION TECHNIQUES FOR AUXILIARY VENTILATION DUCTING SYSTEMS
687
Tabl~ 2: Quot~ friction factors for non-ridged auxiliary For LH type ducting venttlation ductmg of varying construction.
The leakage coefficient Lc was calculated using Equation I . Figure 9 shows a direct correlation between fan pressure and the leakage coefficient for the LH and S type ducting. With zero fan pressure there should be no leakage from the ducting and the trend line must pass through the origin. As a result, the most accurate equation to describe the trend line is a polynomial. The relationship also shows that the S ducting has lower leakage than the LH ducting.
Figure 9. Correlation between fan pressure and leakage.
The leakage coefficient cannot simply be averaged over the various testing velocities to obtain a single Lc constant for the ducting type as there is significant correlation between the fan pressure and the leakage coefficient. The leakage coefficient for each ducting type can be stated in the form of an equation that best represents the change between fan pressure and leakage. The equations that best describe the leakage coefficient for the S and LH ducting products are provided in Equations 14 and 15.
Lc = -0.369SP12 +1.7085Pt (14)
For S type ducting
Lc = 0.9814P12 +0.2291Pt (15)
LEAKAGE PREDICTION EQUATION
Since all other parameters that affect leakage have been isolated the fan pressure and leakage coefficients can be p~otted for both the LH 915 mm and LH 450 mm ducting. Ftgure 10 shows that leakage increases as the difference in pressure increases between the inside and outside of the ducting. Additionally the larger diameter ducting has greater leakage. Le Roux (1990) proposed that this is to be expected on account of the greater surface area of the seams and joints.
1.6
1.4 1: Gl 1.2 u E 1 8 (,) 0.8
& 0.6 Cl 'i 0.4 ...J 0.2
0
-. LH 915 mm ..
/r.. //y = -0 342 x2 1.6 54x + 0. )13E ,., r,; v ... , lo
.-..
/ ,.J :,--..... LH 450mm
I v ~\ = -( .156 1 x2 I+ O.E 544 ~-0 006
.& ,/ ~· u.:.1 ,.,:.
0 0.2 0.4 0.6 0.8 1 1.2 1.4 1.6 1.8 2 2.2
Fan Pressure (kPa)
Figure 10. Leakage due to different duct diameters.
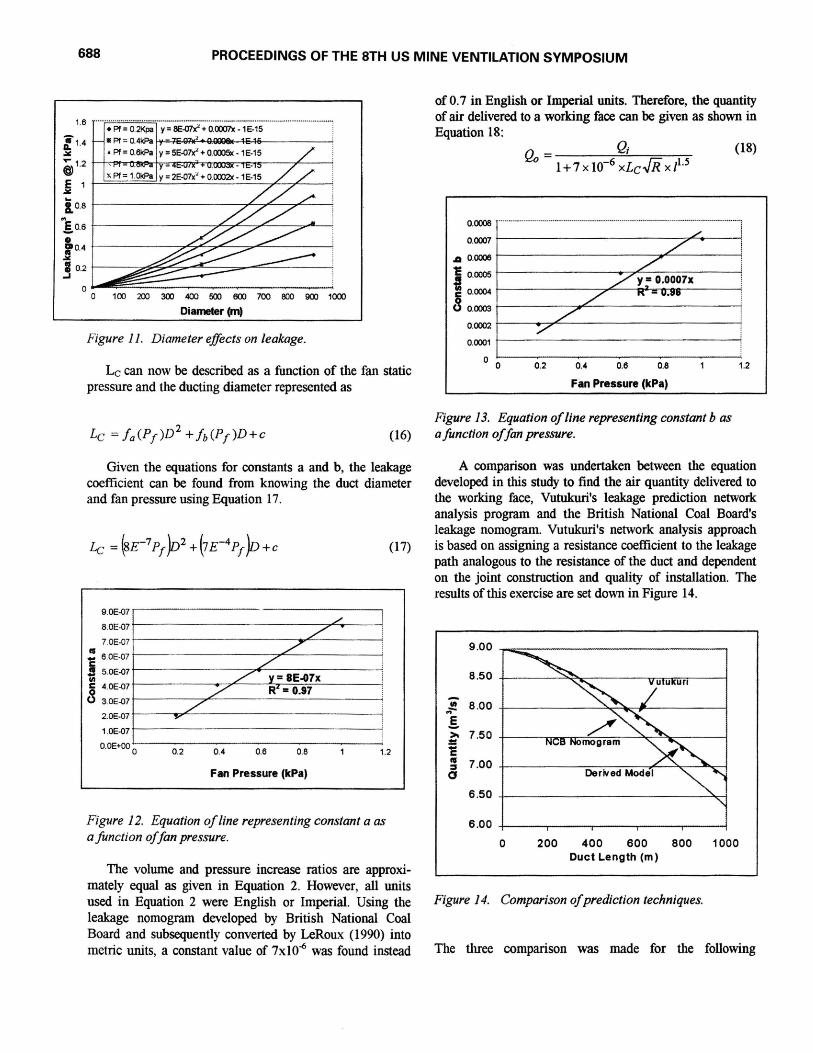
Using the equations to describe the correlation between the l~ge coefficient and fan pressure -for the two ducting dtameters set down in Figure 10, graphs of leakage coefficient versus ducting diameter have been constructed for different fan pressures and are provided in Figure 11.
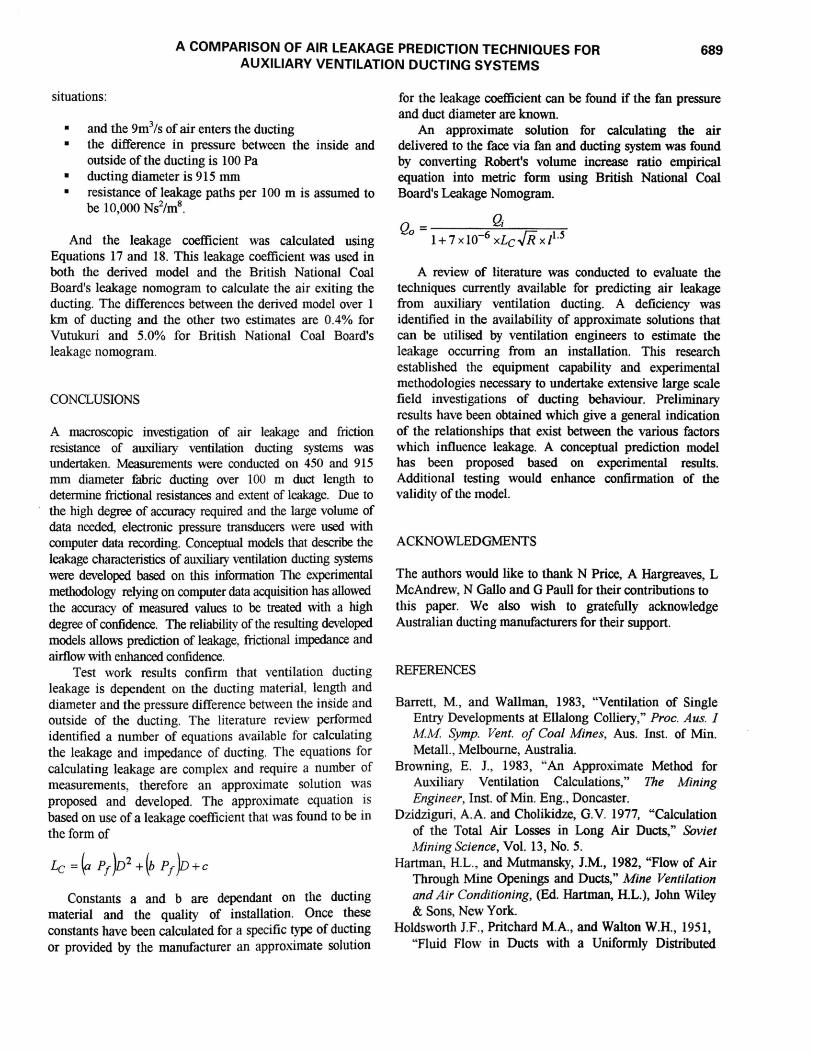
Allowing a and b to represent the coefficients of the equations describing leakage as a function of duct diameter at a given fan pressure (where a represents the coefficient for 0 2 and b the coefficient for D), an equation which represents the constants can be found by plotting the constant value for each fan pressure. These equations are provided in Figures 12 and 13.
688 PROCEEDINGS OF THE 8TH US MINE VENTILATION SYMPOSIUM
:1.4 .:11:
@1.2
E 1 ~======~~~~==~~~~L-~ .:11:
i. 0.8 t------------TL-,.,e:;---..,..L-___;
! 0.6 t------------.,~.,£--7""~---=--""----.:
• ro.4 t------~~""-:;;.,c..._---;;~------: .:11: I o.2 t----~;..;;.,..~.,.......: