A comparison of corporate versus government bond funds George Comer & Javier Rodriguez # Springer Science+Business Media, LLC 2011 Abstract We examine four separate classifications (high quality corporate, general corporate, government Treasury, and general government) of investment grade bond funds over the 1994–2009 period. We verify that distinct differences exist in investment styles across the classifications. We also document significant differences in performance as corporate funds outperform government funds by a risk adjusted average of 8 to 53 basis points on an annual basis depending on the model used. The performance differences are not strictly a function of expenses and are robust to alternative evaluation metrics. An examination of cash flows to the funds indicates that investment dollars are driven by the differences in risk adjusted performance. Keywords Fixed Income Funds . Portfolio Evaluation . Cash Flows JEL Classification G20 . G23 1 Introduction Relative to equity funds, a much smaller number of academic studies have devoted attention to the performance and behavior of bond mutual fund managers despite the growing importance of these funds within investor portfolios. According to data J Econ Finan DOI 10.1007/s12197-011-9193-8 We appreciate the comments of Martin Gruber and Phyllis Keys. In addition, we are grateful for conversations with Cliff Green, Lorenzo Newsome, and Pamela Turner who provided helpful suggestions. We also thank Herminio Romero and Keyla Pagan for excellent research assistance. Rodriguez acknowledges the support provided by the University of Puerto Rico Graduate School of Business Administration and the Office of the Dean of Graduate Studies and Research. G. Comer (*) Georgetown University, 585 Hariri Building, Washington, DC 20057, USA e-mail: [email protected]J. Rodriguez University of Puerto Rico, San Juan, Puerto Rico e-mail: [email protected]
Transcript
A comparison of corporate versus government bondfunds
George Comer & Javier Rodriguez
# Springer Science+Business Media, LLC 2011
Abstract We examine four separate classifications (high quality corporate, generalcorporate, government Treasury, and general government) of investment grade bondfunds over the 1994–2009 period. We verify that distinct differences exist ininvestment styles across the classifications. We also document significant differencesin performance as corporate funds outperform government funds by a risk adjustedaverage of 8 to 53 basis points on an annual basis depending on the model used. Theperformance differences are not strictly a function of expenses and are robust toalternative evaluation metrics. An examination of cash flows to the funds indicatesthat investment dollars are driven by the differences in risk adjusted performance.
Keywords Fixed Income Funds . Portfolio Evaluation . Cash Flows
JEL Classification G20 . G23
1 Introduction
Relative to equity funds, a much smaller number of academic studies have devotedattention to the performance and behavior of bond mutual fund managers despite thegrowing importance of these funds within investor portfolios. According to data
J Econ FinanDOI 10.1007/s12197-011-9193-8
We appreciate the comments of Martin Gruber and Phyllis Keys. In addition, we are grateful forconversations with Cliff Green, Lorenzo Newsome, and Pamela Turner who provided helpful suggestions.We also thank Herminio Romero and Keyla Pagan for excellent research assistance. Rodriguezacknowledges the support provided by the University of Puerto Rico Graduate School of BusinessAdministration and the Office of the Dean of Graduate Studies and Research.
G. Comer (*)Georgetown University, 585 Hariri Building, Washington, DC 20057, USAe-mail: [email protected]
J. RodriguezUniversity of Puerto Rico, San Juan, Puerto Ricoe-mail: [email protected]
from the December 31, 2009 Morningstar Principia Pro CD, nonmunicipal bondfund assets totaled $1.35trillionas of the end of 2009.1 Over 75% of those assetswere invested in investment grade corporate and government bond funds whichserve as the focus of this study. These funds have seen substantial growth in assetsover the last decade. Assets in corporate bond funds have increased seven fold,growing from $89.7 billion in 1994 to $695.9 billion in 2009. Government bondfunds have also seen growth in assets over the same period, albeit at a slower rate,from $140.9 billion to $328.9 billion.
Our goal in this study is to better understand the nature of the product being deliveredby bond fund managers. Our study is motivated by work done by Chan et al. (2002).Their study analyzes the various investment styles employed by equity fund managers.Their main results are that 1) funds on average are consistent in following theirinvestment styles and 2) after adjusting for style, there is evidence that equity growthfund managers outperform value fund managers. Previous work in the bond fundliterature does not analyze the issues addressed in Chan et al. (2002) as the work iseither focused on a specific classification of bond funds (e.g., Brown and Marshall2001; Ferson et al. 2006; Boney et al. 2009; Chen et al. 2006; Cici and Gibson 2011)or has the goal of developing appropriate index and factor models to measure bondfund performance (e. g. Blake et al. 1993; Elton et al. 1996).
Analyzing bond fund styles and performance is of particular interest as theclassification system employed for bond funds is very broad and thus there is greatpotential for overlap in investment styles across different categories of funds. If onefocuses exclusively on investment grade corporate and government bond funds, afund can be placed in one of the following four Morningstar categories: corporatebond high quality, corporate bond general, government bond general, andgovernment bond Treasury.
Morningstar provides a description for each of the categories. High qualitycorporate bond funds are defined as funds seeking income by investing at least 65%in corporate debt securities rated A or higher. The remaining 35% can be invested inany type of fixed income security. General corporate funds are defined as fundsseeking income by investing in fixed income securities. Funds within this objectivemay hold a variety of issues including government bond funds, high qualitycorporate securities, mortgages, asset backed securities, bank loans, and junk bonds,but the overall quality of the portfolio is investment grade. The government fundsare defined in a similar manner. General government bond funds are funds thatpursue income by investing in a combination of mortgages, treasuries, and agencysecurities, but no minimum percentage is required within any category. GovernmentTreasury funds’ objective is to seek income by generally investing 80% in USTreasury securities.
According to Morningstar, a fund’s classification is based on the fund’sinvestment goals. Thus, funds are classified based on the wording in the fund’sprospectus sent to Morningstar by the mutual fund distributor. Based on the
1 Morningstar, rather than the Investment Company Institute, is used as the source for total asset databecause Morningstar explicitly classifies all bond mutual funds as corporate, government, or world funds.One of the ICI categories (strategic income funds) does not explicitly separate government and corporatefunds.
J Econ Finan
definitions, the potential for overlap in investment styles across the categories ishigh. General corporate funds can mimic the investment styles and strategies of highquality funds and a similar relationship could exist between the general governmentand general Treasury funds. In addition, general corporate and general governmentfunds could also pursue similar styles of investing.2
Thus, the first issue we examine is whether there are truly distinct differences ininvestment styles across each of the four categories. We employ the style analysistechnique pioneered by Sharpe (1992) and used by Boney et al. (2009) to examinethe investment styles of funds in each of the aforementioned Morningstar categoriesover the 1994–2009 period. We are able to document significant variation across thecategories. Specifically, we find that the government funds have significantly lessexposure to high yield securities, while they tend to hold securities with a muchshorter average maturity.
Given these style differences, we examine whether there are any differences inrisk adjusted performance across the categories. Using linear index models similar tothose employed by Blake et al. (1993); Boney et al. (2009), and Comer et al. (2009),we document significant differences in performance as corporate funds are morelikely to generate positive alphas than both categories of government funds. Inaddition, corporate funds generate better alphas than the general government bondfunds. These results are consistent across the three index models used to measureperformance.
Finally, given these performance differences, we examine cash flows to the fundsto see if investors are aware of these differences and have invested accordingly. Wefind that during a given year funds that receive the highest cash flows are the fundswith the highest past risk adjusted alphas. Total return and income yield do not havea strong relationship with cash flows. These results hold across all fourclassifications of funds. Of particular interest is that the top quintile of generalcorporate funds generates positive alphas on average, and the high subsequent cashflows to these funds indicate that investors are chasing past performance.
Our study is organized as follows: Section 1 provides a description of the fundsample and examines fund characteristics and investment styles. Sections 2 and 3provide empirical results on risk adjusted performance with robustness tests usingalternative measures. Section 4 examines the relationship between cash flows andvarious performance measures. Section 5 concludes.
2 Fund sample: attributes and investment style
Our fund sample is drawn from the December 31, 1993 Morningstar Principia CDand includes all funds with one of the following prospectus objectives: corporatehigh quality, corporate general, government Treasury, or government general. A fundmust survive for at least three years within its same category to be included in the
2 Both Lipper’s and the Investment Company Institute’s classification systems are similar toMorningstar’s. Lipper typically requires that to be in a specific category at least 65% of all bonds in thefund portfolio should clearly belong to that category. ICI typically requires 80%. But the remainder of theportfolio can be invested in any type of fixed income, cash, or even equity security.
J Econ Finan
sample. Monthly fund returns are obtained from CRSP and cover the period January1994 to December 2009 or until the fund ceases to exist or changes objective. Weconstruct our sample in a similar manner as Boney et al. (2009) and as constructed,our sample is free of survivorship bias but does suffers from look ahead bias giventhat we impose the minimum three year survival period so that we have sufficientdata to estimate our various performance measures.
Table 1 presents descriptive statistics of the fund samples. The general corporateand general government funds compose the majority of our sample (151 and 149funds, respectively) while the high quality corporate and government Treasury fundsamples are much smaller in comparison (84 and 33 funds, respectively). The datapresented in the table are annual data obtained from CRSP and represent year enddata. To obtain the reported averages, we first average over the time series of eachfund and then average across funds.
There do not appear to be any substantial differences in the attributes of the fundsthat would potentially drive any differences in empirical results across the fourcategories. Average annualized returns are consistent with expected positivecompensation for the risk differential between corporate and government funds.The corporate general funds, which would be expected to have the greatest overallrisk have the highest average annualized return of 5.48%. The average returns of theother categories fall into a narrow range from 4.91% to 5.19%. Median total netassets are roughly similar, but average total net assets are much larger for thecorporate funds. This reflects the size difference among the largest five funds withineach classification. The average total net assets of the top five funds are $10.6 billionfor the general corporate group, $5.8 billion for the high quality corporate funds,$2.6 billion for the general government funds, and $1.7 billion for the governmentTreasury funds.
Expense ratios are slightly higher for the general funds (0.84% and 0.97% for thecorporate and government funds respectively) relative to their higher qualitycounterparts (0.74% and 0.68%). This possibly reflects the higher costs of activemanagement given that the general classifications have a broader investmentmandate and greater investment flexibility. Turnover ratios display a similar
Table 1 Descriptive statistics of the corporate and government bond samples
High quality Corporate general Government treasury Government general
No. of funds 84 151 33 149
Annualized return 5.02% 5.48% 5.19% 4.91%
Average size $676.1 mil $838.9 mil $349.0 mil $320.0 mil
Median size $151.6 mil $133.8 mil $172.1 mil $119.9 mil
Expense ratio 0.74% 0.84% 0.68% 0.97%
Income yield 5.15% 5.35% 4.73% 5.10%
Turnover ratio 129.7% 156.7% 143.6% 177.4%
The table presents descriptive statistics for our four samples of bond funds. The data covers the timeperiod January 1994 to December 2009. All values reported in the table represent averages across all fundsin each sample. To obtain the averages, we first average the time series data of each fund and then averageacross funds. Data are from CRSP and represent annual year end values
J Econ Finan
relationship. General funds have higher mean turnover suggesting more activemanagement. The income yield is slightly higher for corporate funds (5.35% and5.15% for the general corporate and high quality respectively) relative to theirgovernment counterparts (4.73% and 5.10% for the Treasury and general funds)likely reflecting greater compensation for credit risk exposure and the fact thatinterest on government securities is generally not taxable at the state and localgovernment levels.
Given the broad investment mandates and similarities in attributes and annualreturns, it is natural to ask if the classifications actually reflect distinct differences ininvesting style across the four categories. Direct observation of fund portfolioholdings would be the preferred approach to address this issue, but no databaseprovides consistent detailed data of a fund’s weighted average maturity norinvestment in high yield securities. CRSP lists weighted average maturity as avariable available for bond funds, but an analysis of the data indicates that 15% ofthe fund year observations are missing. Morningstar asks funds to voluntarilyprovide portfolio holdings and average maturity data, but a significant portion of thefunds do not provide the data.3 So to gain an understanding of the averageinvestment styles of each of the categories, we turn to Sharpe’s (1992) returns basedstyle analysis.
Both Blake et al. (1993) and Boney et al. (2009) have used Sharpe’s methodologyto infer the investment policy of groups of bond funds. Sharpe’s technique allows usto represent a manager’s actual investment portfolio as a hypothetical portfolio ofpassively managed asset classes that best replicate the return series of the fund overtime. To apply this technique, we assume the monthly return for each fund can berepresented by ak factor model:
Ri;t ¼Xp
i¼1
bipRp;t þ ei;t ð1Þ
where Ri,t represents the total return of fund i, bip represents exposure of fund i toasset class p, Rp,t represents the total return of asset class p, and ei,t represents theunexplained component of fund return.
For any individual fund, the average exposure to each index, bip, during a givenobservation window can be estimated by solving the following quadratic program:
min var Ri;t �Xp
i¼1
bipRpt
!" #
subject to
0 � bip � 1 8 i
Xk
p¼1
bip ¼ 1
ð2Þ
In this formulation, the bip can be interpreted as the positive portfolio weights onthe passive indices. Thus, we approximate the fund's actual portfolio allocation over
3 See Morey and O’Neal (2006) which uses this data source.
J Econ Finan
any given estimation window with weights on passive market indices that representthe various choices available to the manager.
Sharpe (1992) specifies that the technique works optimally under the followingthree conditions: 1) the asset classes included in the index model are mutuallyexclusive, 2) the asset classes exhaust the investment set of the fund manager, and 3)the returns of the included indices have significant differences in standard deviationor are weakly correlated. We use two index models initially developed by Comer etal. (2009) as an extension to the Carhart (1997) model which are designed to capturethe sector and maturity allocations of our sample.
We refer to our first index model as the sector model which is composed of fiveindices as follows:
Ri ¼ bi;corpRcorp þ bi;govRgov þ bi;mortRmort þ bi;hiyldRhiyld þ bi;cashRcash þ ei ð3Þwhere Ri represents the total return for fund i, Rcorp represents the total return of thecredit bond index, Rgov represents the total return of the government index, Rmort
represents the total return of the fixed rate mortgage backed security index, Rhiyld
represents the total return of the corporate high yield bond index, and Rcash
represents the total return to cash. We follow Comer et al. (2009) and use the shortTreasury index, which is composed of Treasury bills with a remaining maturity fromone to twelve months, as the proxy for cash.
We refer to our second model as the maturity model and it is composed of thefollowing six indices:
Ri ¼ bi;gc0105Rgc0105 þ bi;gc0510Rgc0510 þ bi;gclongRgclong þ bi;hiyldRhiyld
þ bi;mortRmort þ bi;cashRcash þ ei ð4Þwhere Rgc0105 represents the total return of the 1–5 year government/credit bondindex, Rgc0510 represents the total return of the 5–10 year government/credit bondindex, and Rgclong represents the total return of the long (10+) government/creditbond index. All of the total return indices in both models are obtained from LehmanBrothers. The Lehman Brothers indices are the most comprehensive marketweighted indices available and are the most widely used family of indices for bondportfolio evaluation.
The Lehman indices are designed such that they meet the first criteria of Sharpe(1992). The government and credit indices are constructed such that no security isincluded in more than one of the indices. The same applies for the government/creditmaturity indices. In addition, mortgage backed securities and high yield bonds areconsidered separate classes of fixed income instruments. The securities included inthose indices do not overlap with each other nor with the securities included thegovernment/credit indices.
Evidence from Boney et al. (2009) and portfolio data from Morningstar indicatesthat corporate and government bond fund managers invest in mortgage, high yield,and cash securities. Thus, the set of indices included in each model span theinvestment set of the managers, thus meeting the second criteria. To determine if thethird criteria is met, we test for significant differences in the variances of the indexreturn series composing each model using Levene’s homogeneity of variance test.We can reject the null hypothesis of equal variances at the 5% level for all
J Econ Finan
comparisons within a specific model with only two exceptions. Within the maturitymodel, we can not reject the null when comparing the return series of the longgovernment/credit index and the high yield index. However, this is not an issuegiven that the two indices have a Pearson correlation of only .26 thus meeting theweak correlation condition of Sharpe’s criteria. The other exception is the returnseries for the government and credit indices within the sector model. This ispotentially an issue since the two indices are also highly correlated. As we examineour style estimates, we must view estimated weights for these sectors with somecaution.
We create an equal weighted portfolio of fund returns within each fund categoryover the entire time period and estimate Eq. 2 using both of our index models. Weestimate the regressions for the following consecutive nonoverlapping periods:1994–1997, 1998–2000, 2001–2003, 2004–2006, and 2007–2009 which provides aminimum of 36 observations for the estimation. We then average the coefficientsacross the five periods. Results are reported in Table 2. An examination of the modeladjusted r-squareds indicates that both of our models work well across all fundcategories. The style regressions explain 93% to 99% of the variation in the returnsof the various groups. In addition, the corporate funds have statistically significantnonzero exposure to all of the indices included in the sector and maturity modelswhich emphasizes the importance of including indices that completely span theinvestment set available to the manager.4
We find distinct differences in style across the four categories which are consistentwith the Morningstar classifications. First, we focus on differences between thecorporate and government funds. As expected, government funds have much greaterexposure to the government sector where the majority of their assets are held. Inaddition, government funds hold securities with a much shorter average maturityaccording to the maturity style model. On average, 56% of government Treasuryfund assets and 54% of general government fund assets are in short maturitysecurities. Only 36% of high quality fund assets and 28% of general corporate fundassets are invested in the short maturity securities. Across both models, corporatefunds have much greater exposure to the high yield sector.
Next, we focus on differences within each category of funds. Within the corporatecategories, we find that the primary difference between the high quality and generalfunds lies in the exposure to credit and cash indices. Across both models, highquality funds have much greater cash exposure and much lower credit exposure.High quality cash exposure ranges from 26.4% to 35.8% while the general fundsexposure is no higher than 20.5%.5 But the general funds’ exposure to the creditindex is twelve percent greater according to the sector model.
For the government funds, the general funds have much greater exposure tomortgage securities. Estimates of mortgage exposure for the general funds rangefrom 21.3% to 22.1% while the Treasury fund’s exposure varies from 3.8% to
4 Due to the nonlinear nature of the estimation, the t tests which are used to determine statisticalsignificance are only valid asymptotically. Lobosco and DiBartolomeo (1997) illustrate that Sharpeestimates are approximately normally distributed and the traditional t test is a valid approximation.5 The cash exposure estimate may appear to be high, but it is consistent with the average of 26.2%reported by Boney et al. (2009) in their examination of high quality corporate bond funds.
J Econ Finan
10.6%. When examining the maturity model, this difference in mortgage exposure isreflected in greater exposure to long maturity securities by the Treasury funds, whileresults from the sector model indicate the difference reflects a greater exposure to thegovernment sector.
Overall, our results indicate clear differences in style across the four categories offunds which are consistent with the classification system used by Morningstar. In thenext section, we use our index models to examine whether there are any differencesin the risk adjusted performance across our four fund categories given that the fundshave similar attributes but engage in distinct investment styles.
3 Bond fund alphas
We will use linear index models to measure the performance of our bond fundsamples. This approach is directly comparable to the approach of Blake et al. (1993)
Table 2 Investment style of corporate and government bond funds
High quality Corporate general Government treasury Government general
Panel A: sector model
Credit 0.171* 0.292* 0.027 0.028*
Government 0.308* 0.300* 0.845* 0.518*
High yield 0.046* 0.093* 0.002 0.019
Mortgage 0.114* 0.108* 0.038* 0.221*
Cash 0.358* 0.205* 0.088* 0.212*
Adjusted r2 0.962 0.979 0.987 0.975
Panel B: maturity model
Gov/cred 1–5 0.358* 0.284* 0.560* 0.535*
Gov/cred 5–10 0.143* 0.233* 0.029 0.074*
Gov/cred long 0.082* 0.103* 0.253* 0.109*
High yield 0.049* 0.113* 0 0.005
Mortgage 0.101* 0.117* 0.106* 0.213*
Cash 0.264* 0.148* 0.050* 0.062*
Adjusted r2 0.964 0.977 0.928 0.967
The table presents the results from the Sharpe style analysis technique that is used to estimate the averagestyle of each of our corporate and government bond fund samples. Panel A presents results for an equalweighted portfolio of funds using the sector index model while Panel B presents results for equal weightedportfolios of funds using the maturity index model. Within each partition, a time series of the averagemonthly returns across the funds is calculated. This return is regressed against the returns of the bond andcash portfolios listed in the table which are represented by Lehman Brothers bond indices that are detailedin the text. The regressions are estimated for the following consecutive nonoverlapping periods: 1994–1997, 1998–2000, 2001–2003, 2004–2006, and 2007–2009 and the results reported are the averagesacross the five periods. In the estimation, each coefficient for each portfolio is constrained to be betweenzero and one, and the sum of all coefficients is constrained to equal one. Each coefficient estimaterepresents the average percentage of assets allocated to the specific asset category. * denotes statisticalsignificance at the five percent level using the estimated standard error of the coefficient estimates
J Econ Finan
and is also most familiar to investors given that linear index models are used by bothMorningstar and Lipper in their evaluation of funds.
The models we use to measure risk adjusted performance can be generallydescribed as
ri ¼ ai þXk
p¼1
biprk þ ei ð5Þ
where r represents the excess return rather than the total return of the fund or index.Our first model is a single index model where the Lehman Aggregate bond indexserves as the bond market proxy. We use this model because Morningstar reportsbond fund alphas using this index as the benchmark. In addition, the LehmanAggregate index is considered to be the broad bond market index equivalent to theS&P 500 which is typically used to estimate stock fund alphas when employing theCapital Asset Pricing Model. Our remaining two models are excess return versionsof the sector and maturity models represented by Eqs. 3 and 4 from the previoussection.6
Using our three index models and fund excess returns, we estimate the alphas foreach of our four bond fund samples. Our goal is to examine whether there aredifferences in risk adjusted performance across the funds given that the funds havedistinct investing styles. As discussed in the introduction, the corporate bond marketis perceived to be less efficient and less transparent than the government securitiesmarket. These inefficiencies potentially represent opportunities for skilled corporatemanagers to outperform their government counterparts on a risk adjusted basis.
For each fund category, we first estimate alpha for the entire sample using theequal weighted time series of average fund returns first computed for the styleanalysis. We use the same procedure from the previous section where we estimatethe regressions for the five nonoverlapping periods: 1994–1997, 1998–2000, 2001–2003, 2004–2006, and 2007–2009, and then we average the coefficients across thefive periods. Because we are also interested in inferences for individual funds, wealso estimate individual fund alphas. For all regressions, we correct for potentialheteroskedasticity using the White correction, and all statistical inferences are basedon the adjusted standard errors.
Results for the equal weighted time series are presented in Panel A of Table 3 foreach fund category and each of the three models. The results indicate that for eachindividual model, government funds perform worse than corporate funds. Based onthe single index model, the government funds’ underperformance ranges from 11 to40 basis points. The corresponding ranges for the sector and maturity models are 8 to31 basis points and 13 to 53 basis points respectively. The general corporate fundsalways have the best performance while the high quality funds have the second best.Although not reported in the table, an analysis of the individual time periodsindicates the same relationships hold except for the 2007–2009 period which isheavily influenced by the financial crisis.
6 The return on the cash index is subtracted from each index so that the model is in excess return form.Thus, the sector model is composed of four indices and the maturity model is composed of five.
J Econ Finan
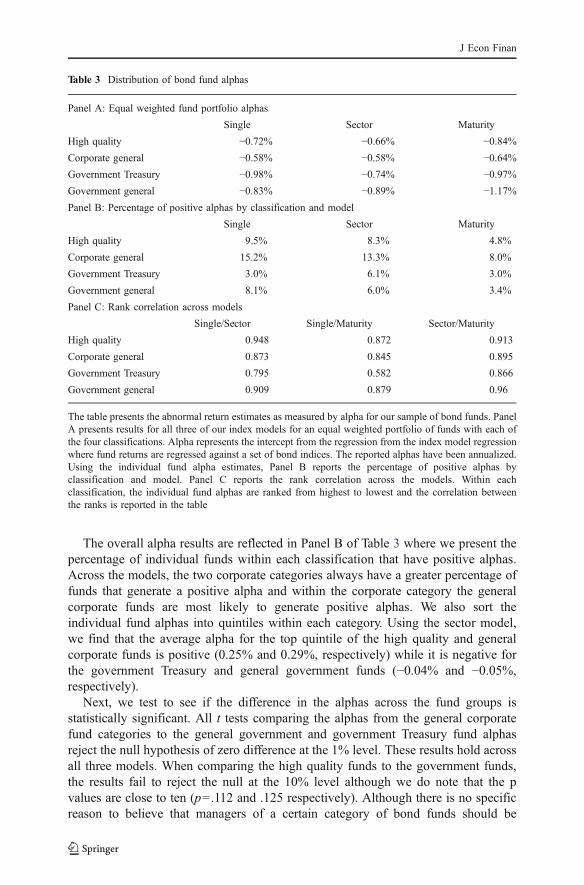
The overall alpha results are reflected in Panel B of Table 3 where we present thepercentage of individual funds within each classification that have positive alphas.Across the models, the two corporate categories always have a greater percentage offunds that generate a positive alpha and within the corporate category the generalcorporate funds are most likely to generate positive alphas. We also sort theindividual fund alphas into quintiles within each category. Using the sector model,we find that the average alpha for the top quintile of the high quality and generalcorporate funds is positive (0.25% and 0.29%, respectively) while it is negative forthe government Treasury and general government funds (−0.04% and −0.05%,respectively).
Next, we test to see if the difference in the alphas across the fund groups isstatistically significant. All t tests comparing the alphas from the general corporatefund categories to the general government and government Treasury fund alphasreject the null hypothesis of zero difference at the 1% level. These results hold acrossall three models. When comparing the high quality funds to the government funds,the results fail to reject the null at the 10% level although we do note that the pvalues are close to ten (p=.112 and .125 respectively). Although there is no specificreason to believe that managers of a certain category of bond funds should be
Table 3 Distribution of bond fund alphas
Panel A: Equal weighted fund portfolio alphas
Single Sector Maturity
High quality −0.72% −0.66% −0.84%Corporate general −0.58% −0.58% −0.64%Government Treasury −0.98% −0.74% −0.97%Government general −0.83% −0.89% −1.17%Panel B: Percentage of positive alphas by classification and model
Single Sector Maturity
High quality 9.5% 8.3% 4.8%
Corporate general 15.2% 13.3% 8.0%
Government Treasury 3.0% 6.1% 3.0%
Government general 8.1% 6.0% 3.4%
Panel C: Rank correlation across models
Single/Sector Single/Maturity Sector/Maturity
High quality 0.948 0.872 0.913
Corporate general 0.873 0.845 0.895
Government Treasury 0.795 0.582 0.866
Government general 0.909 0.879 0.96
The table presents the abnormal return estimates as measured by alpha for our sample of bond funds. PanelA presents results for all three of our index models for an equal weighted portfolio of funds with each ofthe four classifications. Alpha represents the intercept from the regression from the index model regressionwhere fund returns are regressed against a set of bond indices. The reported alphas have been annualized.Using the individual fund alpha estimates, Panel B reports the percentage of positive alphas byclassification and model. Panel C reports the rank correlation across the models. Within eachclassification, the individual fund alphas are ranked from highest to lowest and the correlation betweenthe ranks is reported in the table
J Econ Finan
inferior to managers of other types of funds, we find evidence that government fundsunderperform corporate funds.
Panel C of Table 3 presents the rank order correlations of the individual fundalphas across models, and the results confirm that the relationship between alphas isconsistent across models. There is no strong evidence that the ordering of alpha issensitive to the model used. All correlations are .85 or higher, with the onlyexception being the relationship between single index alphas and the extendedmodels when examining the government Treasury funds. These lower correlationsrange from .58 to .80. This result is consistent with the index fund estimates done inthe previous section and further reinforces that the single index model may not bethe most appropriate model to use when examining government Treasury funds.
Given that the average alphas across both corporate and government funds arenegative, we need to examine the impact of expenses on estimated performance.Since we are comparing fund returns net of expenses to the returns of benchmarkindices, the differences we find across the fund classifications may simply reflect theaverage difference in expense ratios.
We follow the test used by Blake et al. (1993) when they analyzed the impact ofexpenses on bond fund alphas. Using the time series of expense ratios fromSection 1, we calculate an average expense ratio for each fund. We then regress alphaagainst average expenses. Statistically insignificant intercepts but significantcoefficients on the expense variable would indicate that expenses serve as theunderlying cause of negative performance for all classifications and those differencesin expenses explain the difference in performance across categories.
Results are presented in Table 4, and the evidence indicates that expenses areusually a factor in the underperformance of the funds, but there are additionalfactors that impact the estimated performance of corporate funds. The interceptterm is statistically significant for the corporate funds across all three models withthe only exception being the single index model for the general corporate funds. Inaddition, for the sector model, the expense ratio is not a significant factor inexplaining a fund’s alpha. Thus, the difference in performance across the corporateand government funds is not strictly a function of expenses. This result isconfirmed by looking at the results from the equal weighted portfolio of funds ineach category. Using the general corporate funds to illustrate, these funds haveaverage performance ranging from −0.58% to −0.64% which is less negative inmagnitude than their average expense ratio of 0.79reported in Table 1 (0.74% and0.84%).
Our results suggest that corporate bond fund managers, regardless of whether theyconcentrate on high quality issues or have a broader investment mandate,demonstrate more skill on average and outperform government funds on a riskadjusted basis
4 Alpha and cash flows to bond funds
Thus far, our results indicate that corporate bond fund performance is superior togovernment fund performance. The final issue we want to examine is whetherinvestor cash flows to our sample of bond funds reflect these differences in
J Econ Finan
performance or if investor dollars to bond funds are driven by other performancemeasures.
Beginning with 1997 so that we have enough data to estimate our performancemeasures, we calculate new annual cash flow to each fund as follows:
cfi;y ¼ tnai;y � tnai;y�1ð1þ ri;yÞ ð8Þwhere cf represents cash flow, tna represents total net assets, and r represents theannual holding period return of the fund.7 We focus on total rather than percentagecash flows to a fund given that we are interested in the performance measure thatdrives the total investment dollars to our sample of bond funds. Each year, withineach of our fund classifications, we sort funds into quintiles from highest to lowestbased on cash flow to the fund during the year.
Then, within each quintile, we calculate the average of the following fiveperformance measures for each of the individual funds: 1) previous year’s totalreturn, 2) previous 3 years’ cumulative total return, 3) single index alpha estimatedusing the previous 3 years of returns, 4) sector index alpha estimated using the
7 Equation 8 represents the standard cash flow measure used by Gruber 1996; Chevalier and Ellison 1997;Sirri and Tufano 1998; Del Guercio and Tkac 2002; and Zhao 2005 among others.
Table 4 Relationship between bond fund alphas and average expense ratios
Intercept Expense
High quality
Single −.000813* −0.0257*Maturity −.00829* 0.0162
Sector −.000764* 0.0244
Corporate general
Single .000203 −0.0397*Maturity −.000479* −0.0220*Sector −.000325* −0.0254Government treasury
Single −.000785* −0.0244*Maturity −.000601 −0.0273*Sector −.000613 −0.0249Government general
Single .000401* −0.1349*Maturity .000281 −0.1348*Sector .000411* −0.1397*
The table reports the results of regressing fund alpha against fund expense ratio. For each fund, we usethe time series of annual expense ratios provided by CRSP to calculate an average fund expense ratio. Wethen regress the fund expense ratio against the fund alpha estimated from one of our three index models.* denotes statistical significance at the five percent level, ** denotes significance at the ten percent level
J Econ Finan
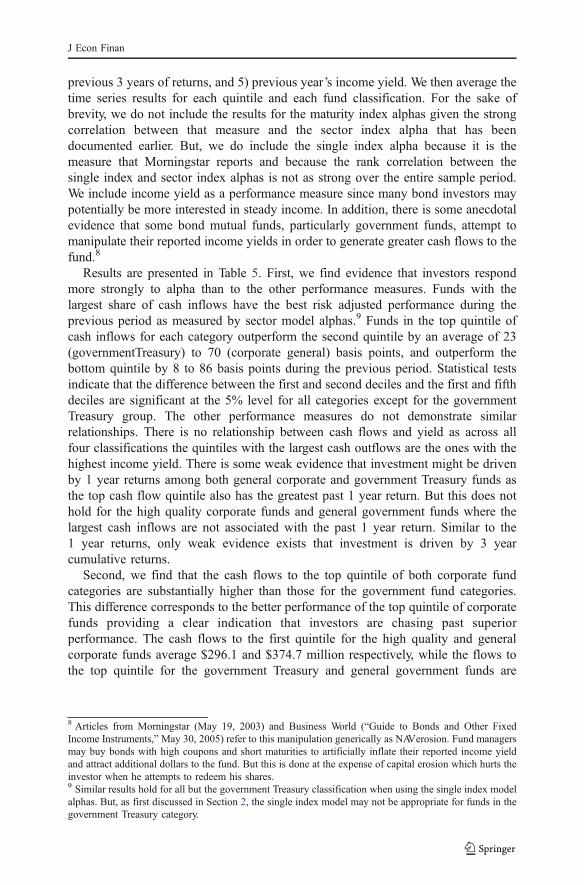
previous 3 years of returns, and 5) previous year’s income yield. We then average thetime series results for each quintile and each fund classification. For the sake ofbrevity, we do not include the results for the maturity index alphas given the strongcorrelation between that measure and the sector index alpha that has beendocumented earlier. But, we do include the single index alpha because it is themeasure that Morningstar reports and because the rank correlation between thesingle index and sector index alphas is not as strong over the entire sample period.We include income yield as a performance measure since many bond investors maypotentially be more interested in steady income. In addition, there is some anecdotalevidence that some bond mutual funds, particularly government funds, attempt tomanipulate their reported income yields in order to generate greater cash flows to thefund.8
Results are presented in Table 5. First, we find evidence that investors respondmore strongly to alpha than to the other performance measures. Funds with thelargest share of cash inflows have the best risk adjusted performance during theprevious period as measured by sector model alphas.9 Funds in the top quintile ofcash inflows for each category outperform the second quintile by an average of 23(governmentTreasury) to 70 (corporate general) basis points, and outperform thebottom quintile by 8 to 86 basis points during the previous period. Statistical testsindicate that the difference between the first and second deciles and the first and fifthdeciles are significant at the 5% level for all categories except for the governmentTreasury group. The other performance measures do not demonstrate similarrelationships. There is no relationship between cash flows and yield as across allfour classifications the quintiles with the largest cash outflows are the ones with thehighest income yield. There is some weak evidence that investment might be drivenby 1 year returns among both general corporate and government Treasury funds asthe top cash flow quintile also has the greatest past 1 year return. But this does nothold for the high quality corporate funds and general government funds where thelargest cash inflows are not associated with the past 1 year return. Similar to the1 year returns, only weak evidence exists that investment is driven by 3 yearcumulative returns.
Second, we find that the cash flows to the top quintile of both corporate fundcategories are substantially higher than those for the government fund categories.This difference corresponds to the better performance of the top quintile of corporatefunds providing a clear indication that investors are chasing past superiorperformance. The cash flows to the first quintile for the high quality and generalcorporate funds average $296.1 and $374.7 million respectively, while the flows tothe top quintile for the government Treasury and general government funds are
8 Articles from Morningstar (May 19, 2003) and Business World (“Guide to Bonds and Other FixedIncome Instruments,” May 30, 2005) refer to this manipulation generically as NAVerosion. Fund managersmay buy bonds with high coupons and short maturities to artificially inflate their reported income yieldand attract additional dollars to the fund. But this is done at the expense of capital erosion which hurts theinvestor when he attempts to redeem his shares.9 Similar results hold for all but the government Treasury classification when using the single index modelalphas. But, as first discussed in Section 2, the single index model may not be appropriate for funds in thegovernment Treasury category.
J Econ Finan
$129.5 million and $156.0 million respectively. An examination of the sector modelalphas indicates a clear difference in performance. The top quintile of generalcorporate fund managers on average have a positive annualized alpha according toboth the single index model (0.11%) and the sector model (0.14%) and receive thelargest average cash inflows. The alphas for the top quintile of the otherclassifications are negative but the government fund performance is clearly inferiorto that of the high quality corporate funds. The high quality corporate funds haveannualized alphas of −0.29% (single index model) and −0.38% (sector index) whilethe alphas for the top quintile of government funds are no better than −0.54%.
Table 5 Relationship between bond cash flows and various bond performance measures
Quintile Cash flow 1 year return 3 year return Single index alpha Sector index alpha Income yield
High quality
1 $296.1 5.9% 19.6% −0.29% −0.38% 5.0%
2 $12.3 5.3% 19.1% −0.68% −0.67% 4.9%
3 −$8.6 5.4% 19.0% −0.71% −0.61% 4.9%
4 −$34.3 5.6% 18.3% −0.74% −0.73% 5.2%
5 −$211.7 6.0% 20.0% −0.76% −0.78% 5.6%
Corporate general
1 $374.7 7.4% 24.2% 0.11% 0.14% 5.3%
2 $13.1 6.1% 19.7% −0.49% −0.56% 5.1%
3 −$1.6 5.4% 19.1% −0.88% −0.90% 5.1%
4 −$23.4 5.3% 19.4% −1.02% −0.98% 5.3%
5 −$198.5 5.5% 20.4% −0.89% −0.72% 5.5%
Government treasury
1 $129.5 6.1% 18.5% −0.92% −0.68% 4.7%
2 $46.8 5.3% 17.0% −1.52% −0.91% 4.8%
3 −$12.7 5.2% 17.6% −1.24% −0.80% 4.6%
4 −$52.9 5.0% 18.5% −1.19% −0.69% 4.6%
5 −$212.9 5.5% 20.2% −0.99% −0.76% 4.6%
Government general
1 $156.0 5.4% 19.6% −0.61% −0.54% 5.0%
2 $6.1 5.3% 19.0% −1.00% −1.11% 4.8%
3 −$19.8 5.8% 19.3% −1.05% −1.14% 5.2%
4 −$46.8 5.2% 18.6% −1.16% −1.13% 5.0%
5 −$161.4 5.3% 19.4% −1.06% −1.02% 5.3%
The table presents the relationship between fund cash flows and past performance measures. Each year,beginning with 1997, we sort funds within each of our fund classificationsinto quintiles from highest tolowest based on cash flow to the fund during the year. Cash flows are defined as the change in total netasset value minus the appreciation in fund assets. Then, within each quintile, we calculate the average ofthe following five performance measures for each of the individual funds: 1) previous year’s total return,2) previous 3 year’s cumulative total return, 3) single index alpha estimated using the previous 3 years ofreturns, 4) sector index alpha estimated using the previous 3 years of returns, and 5) previous year’sincome yield. We then average the time series results for each quintile and each fund classification
J Econ Finan
These results are consistent with Zhao (2005) who suggests that bond fundinvestors respond to risk adjusted rather than raw return measures. More importantly,these results indicate that bond fund investors are aware of the difference in the riskadjusted performance of the corporate and government bond funds within oursample and have been investing accordingly over our sample period.
5 Conclusion
In this study, we analyze the investment style, performance, and cash flows ofinvestment grade corporate and government bond funds. Based on data fromMorningstar, these funds are placed into one of the following four fundclassifications: high quality corporate, general corporate, government Treasury,or general government. But within each of the classifications, the definitionsused to categorize the funds are so broad that it is unclear what the typical stylecharacteristics of the funds are. Thus, our analysis of investment style focuses onunderstanding the average differences in philosophies across the categories.Using Sharpe’s (1992) style analysis and two index models based on sectorallocations and maturity allocations, we find distinct differences across categories.Corporate funds tend to have much greater exposure to cash and high yieldsecurities while government funds tend to hold securities with much shorteraverage maturities.
These differences in investment style lead us to examine differences in riskadjusted performance of the funds. We use linear index models similar to thoseemployed by Blake et al. (1993); Boney et al. (2009), and Comer et al. (2009). Wedocument significant differences in performance as the risk adjusted performance ofgovernment bond funds is inferior to that of corporate bond funds by a risk adjustedaverage of 31 to 74 basis points annually depending on the model used. Althoughboth corporate and government bond fund alphas are negative on average, thecorporate fund alphas are less negative in magnitude than their average expense ratiowhile average government fund performance is worse than the expense ratio.Additional tests clearly establish that the difference in performance across the fundsis not strictly a function of expenses.
This difference in performance between corporate and government fund managerslead us to examine whether bond fund investors are aware of this difference inrisk adjusted performance and invest accordingly. We find that across classifications,the funds with the highest cash flows are the funds with the best risk adjustedperformance during the previous period. Total return nor income yield has a strongrelationship with cash flows. Given their better risk adjusted performance, corporatefunds on average have received greater cash inflows over our sample period relativeto government bond funds. Of particular interest is that the top quintile of generalcorporate funds generates positive alphas on average, and the high subsequent cashflows to these funds indicate that investors are chasing past superior performance.
Overall, our results give us a better understanding of the style, performance, andbehavior of bond fund managers and investors who focus on investment grade andhigh quality securities. And, unlike equity funds, there appear to be distinctperformance differences across classifications of bond funds.
J Econ Finan
References
Blake C, Elton E, Gruber M (1993) The performance of bond mutual funds. J Bus 66:371–403Boney V, Comer G, Kelly L (2009) Timing the investment grade securities market: evidence from high
quality bond funds. J Empirical Finance 16:55–69Brown D, Marshall W (2001) Assessing fixed income manager style and performance from historical
returns. J Fixed Income 10:15–28Carhart M (1997) On persistence in mutual fund performance. J Finance 52:57–82Chan L, Chen H-L, Lakonishok J (2002) On mutual fund investment styles. Rev Finan Stud 15:1407–
1437Chen Y, Ferson W, Peters H (2006) The timing ability of fixed income mutual funds. Working paperChevalier J, Ellison G (1997) Risk taking by mutual funds in response to incentives. J Polit Econ
105:1167–1200Cici G, Gibson S (2011) The performance of corporate-bond mutual funds: evidence based on security-
level holdings (December 1, 2010). AFA. Denver Meetings Paper. Available at SSRN: http://ssrn.com/abstract=1564486
Comer G, Larrymore N, Rodriguez J (2009) Controlling for fixed income exposure in portfolio evaluation:evidence from hybrid mutual funds. Rev Finan Stud 22:481–507
Del Guercio D, Tkac P (2002) The determinants of the flow of funds of managed portfolios: Mutual Fundsvs. Pension Funds. J Finan Quant Anal 37:523–557
Elton E, Gruber M, Blake C (1996) Fundamental economic variables, expected returns, and bond fundperformance. J Finance 50:1229–1256
Ferson W, Henry T, Kisgen D (2006) Evaluating Government bond fund performance with stochasticdiscount factors. Rev Finan Stud 19:423–456
Gruber M (1996) Another puzzle: the growth of actively managed mutual funds. J Finance 51:783–810Lobosco A, DiBartolomeo D (1997) Approximating the confidence intervals for sharpe style weights.
Financ Anal J 53:80–85Morey M, O’Neal E (2006) Window dressing in bond mutual funds. J Finan Res 29:325–340Sharpe W (1992) Asset allocation: management style and performance measurement. J Portfol Manag 7–
19Sirri E, Tufano P (1998) Costly search and mutual fund flows. J Finance 53:1589–1622Zhao X (2005) Determinants of flows into retail bond funds. Financ Anal J 61:47–59