A Comparison of Overlay Routing and Multihoming Route Control Aditya Akella Jeffrey Pang Bruce Maggs † Srinivasan Seshan Carnegie Mellon University {aditya, jeffpang,srini+, bmm}@cs.cmu.edu Anees Shaikh IBM T.J. Watson Research Center [email protected]ABSTRACT The limitations of BGP routing in the Internet are often blamed for poor end-to-end performance and prolonged connectivity interrup- tions. Recent work advocates using overlays to effectively bypass BGP’s path selection in order to improve performance and fault tolerance. In this paper, we explore the possibility that intelligent control of BGP routes, coupled with ISP multihoming, can provide competitive end-to-end performance and reliability. Using exten- sive measurements of paths between nodes in a large content distri- bution network, we compare the relative benefits of overlay routing and multihoming route control in terms of round-trip latency, TCP connection throughput, and path availability. We observe that the performance achieved by route control together with multihoming to three ISPs (3-multihoming), is within 5-15% of overlay rout- ing employed in conjunction 3-multihoming, in terms of both end- to-end RTT and throughput. We also show that while multihom- ing cannot offer the nearly perfect resilience of overlays, it can eliminate almost all failures experienced by a singly-homed end- network. Our results demonstrate that, by leveraging the capabil- ity of multihoming route control, it is not necessary to circumvent BGP routing to extract good wide-area performance and availabil- ity from the existing routing system. Categories and Subject Descriptors C.2 [Computer Systems Organization]: Computer-Communication Networks; C.2.1 [Computer-Communication Networks]: Net- work Architecture and Design General Terms Measurement, Performance, Reliability Keywords multihoming, route control, overlay routing † Bruce Maggs is also with Akamai Technologies. This work was supported by the Army Research Office under grant number DAAD19-02-1-0389. Additional support was provided by IBM. Permission to make digital or hard copies of all or part of this work for personal or classroom use is granted without fee provided that copies are not made or distributed for profit or commercial advantage and that copies bear this notice and the full citation on the first page. To copy otherwise, to republish, to post on servers or to redistribute to lists, requires prior specific permission and/or a fee. SIGCOMM’04, August 30–September 3, 2004, Portland, OR. Copyright 2004 ACM 1-58113-862-8/04/0008 ...$5.00. 1. INTRODUCTION The limitations of conventional Internet routing based on the Border Gateway Protocol (BGP) are often held responsible for fail- ures and poor performance of end-to-end transfers. A number of studies have shown that the underlying connectivity of the Internet is capable of providing much greater performance and resilience than end-points currently receive. Such studies, exemplified by Detour [25, 26] and RON [6], demonstrate that using overlay rout- ing to bypass BGP’s policy-driven routing enables quicker reaction to failures and improved end-to-end performance. In this paper, we question whether overlay routing is required to make the most of the underlying connectivity, or whether better selection of BGP routes at an end-point is sufficient. There are two key factors contributing to the differences between overlay routing and BGP-based routing that have not been carefully evaluated in past work: the number of routing choices available to each system and the policies used to select among these routes. Route Availability. By allowing sources to specify a set of inter- mediate hops, overlay routing allows end-points nearly arbitrary control over the wide-area path that packets take. On the other hand, BGP only allows a network to announce routes that it ac- tually uses. Thus, to reach a given destination, an end-point has access to only a single path from each Internet Service Provider (ISP) to which it is attached [30]. As a result, an end-point’s ability to control routing is tightly linked to the number of ISP connections it has. Past studies showing the relative benefits of overlay routing draw conclusions based on the highly restrictive case wherein paths from just a single ISP are available [6, 25]. In contrast, in this paper, we carefully consider the degree of ISP multihoming at the end- point, and whether it provides sufficient (BGP) route choices for the end-point to obtain the same performance as when employing an overlay network. Route Selection. In addition to having a greater selection of routes to choose from than BGP, overlay routing systems use much more sophisticated policies in choosing the route for any particular trans- fer. Overlays choose routes that optimize end-to-end performance metrics, such as latency. On the other hand, BGP employs much simpler heuristics to select routes, such as minimizing AS hop count or cost. However, this route selection policy is not intrinsic to BGP-based routing – given an adequate selection of BGP routes, end-points can choose the one that results in the best performance, availability, or cost. Several commercial vendors already enable such route control or selection (e.g., [19, 21, 24]). In this paper, we compare overlays with end-point based mech- anisms that use this form of “intelligent” route control of the BGP paths provided by their ISPs. Hereafter, we refer to this as multi- homing route control or simply, route control. Notice that we do
Transcript
A Comparison of Overlay Routing andMultihoming Route Control
ABSTRACTThe limitations of BGP routing in the Internet are often blamed forpoor end-to-end performance and prolonged connectivity interrup-tions. Recent work advocates using overlays to effectivelybypassBGP’s path selection in order to improve performance and faulttolerance. In this paper, we explore the possibility that intelligentcontrol of BGP routes, coupled with ISP multihoming, can providecompetitive end-to-end performance and reliability. Using exten-sive measurements of paths between nodes in a large content distri-bution network, we compare the relative benefits of overlay routingand multihoming route control in terms of round-trip latency, TCPconnection throughput, and path availability. We observe that theperformance achieved by route control together with multihomingto three ISPs (3-multihoming), is within 5-15% of overlay rout-ing employed in conjunction 3-multihoming, in terms of bothend-to-end RTT and throughput. We also show that while multihom-ing cannot offer the nearly perfect resilience of overlays,it caneliminate almost all failures experienced by a singly-homed end-network. Our results demonstrate that, by leveraging the capabil-ity of multihoming route control, it is not necessary to circumventBGP routing to extract good wide-area performance and availabil-ity from the existing routing system.
Categories and Subject DescriptorsC.2 [Computer Systems Organization]: Computer-CommunicationNetworks; C.2.1 [Computer-Communication Networks]: Net-work Architecture and Design
General TermsMeasurement, Performance, Reliability
†Bruce Maggs is also with Akamai Technologies.This work was supported by the Army Research Office under grant numberDAAD19-02-1-0389. Additional support was provided by IBM.
Permission to make digital or hard copies of all or part of this workfor personal or classroom use is granted without fee provided that copiesare not made or distributed for profit or commercial advantage and thatcopies bear this notice and the full citation on the first page. To copyotherwise, to republish, to post on servers or to redistribute to lists, requiresprior specific permission and/or a fee.SIGCOMM’04,August 30–September 3, 2004, Portland, OR.Copyright 2004 ACM 1-58113-862-8/04/0008 ...$5.00.
1. INTRODUCTIONThe limitations of conventional Internet routing based on the
Border Gateway Protocol (BGP) are often held responsible for fail-ures and poor performance of end-to-end transfers. A numberofstudies have shown that the underlying connectivity of the Internetis capable of providing much greater performance and resiliencethan end-points currently receive. Such studies, exemplified byDetour [25, 26] and RON [6], demonstrate that usingoverlay rout-ing to bypass BGP’s policy-driven routing enables quicker reactionto failures and improved end-to-end performance. In this paper,we question whether overlay routing isrequired to make the mostof the underlying connectivity, or whether better selection of BGProutes at an end-point is sufficient.
There are two key factors contributing to the differences betweenoverlay routing and BGP-based routing that have not been carefullyevaluated in past work: the number of routing choices available toeach system and the policies used to select among these routes.
Route Availability. By allowing sources to specify a set of inter-mediate hops, overlay routing allows end-points nearly arbitrarycontrol over the wide-area path that packets take. On the otherhand, BGP only allows a network to announce routes that it ac-tually uses. Thus, to reach a given destination, an end-point hasaccess to only a single path from each Internet Service Provider(ISP) to which it is attached [30]. As a result, an end-point’s abilityto control routing is tightly linked to the number of ISP connectionsit has.
Past studies showing the relative benefits of overlay routing drawconclusions based on the highly restrictive case wherein paths fromjust a single ISP are available [6, 25]. In contrast, in this paper,we carefully consider the degree of ISP multihoming at the end-point, and whether it provides sufficient (BGP) route choices forthe end-point to obtain the same performance as when employingan overlay network.
Route Selection.In addition to having a greater selection of routesto choose from than BGP, overlay routing systems use much moresophisticated policies in choosing the route for any particular trans-fer. Overlays choose routes that optimize end-to-end performancemetrics, such as latency. On the other hand, BGP employs muchsimpler heuristics to select routes, such as minimizing AS hop countor cost. However, this route selection policy is not intrinsic toBGP-based routing – given an adequate selection of BGP routes,end-points can choose the one that results in the best performance,availability, or cost. Several commercial vendors alreadyenablesuch route control or selection (e.g., [19, 21, 24]).
In this paper, we compare overlays with end-point based mech-anisms that use this form of “intelligent” route control of the BGPpaths provided by their ISPs. Hereafter, we refer to this as multi-homing route control or simply, route control. Notice that we do
not assume any changes or improvements to the underlying BGPprotocol. Multihoming route control simply allows a multihomedend-network to intelligently schedule its transfers over multiple ISPlinks in order to optimize performance, availability, costor a com-bination of these metrics.
Our goal is to answer the question:How much benefit does over-lay routing provide over BGP, when multihoming and route con-trol are considered?If the benefit is small, then BGP path selec-tion is not as inferior as it is held to be, and good end-to-endper-formance and reliability are achievable even when operating com-pletely within standard Internet routing. On the other hand, if over-lays yield significantly better performance and reliability character-istics, we have further confirmation of the claim that BGP is fun-damentally limited. Then, it is crucial to develop alternate bypassarchitectures such as overlay routing.
Using extensive active downloads and traceroutes between 68servers belonging to a large content distribution network (CDN),we compare multihoming route control and overlay routing intermsof three key metrics: round-trip delay, throughput, and availabil-ity. Our results suggest that when route control is employedalongwith multihoming, it can offer performance similar to overlays interms of round-trip delay and throughput. On average, the round-trip times achieved by the best BGP paths (selected by an idealroute control mechanism using 3 ISPs) are within 5–15% of thebest overlay paths (selected by an ideal overlay routing schemealso multihomed to 3 ISPs). Similarly, the throughput on thebestoverlay paths is only 1–10% better than the best BGP paths. Wealso show that the marginal difference in the RTT performance canbe attributed mainly to overlay routing’s ability to selectshorterpaths, and that this difference can be reduced further if ISPs im-plement cooperative peering policies. In comparing the end-to-endpath availability provided by either approach, we show thatmulti-homing route control, like overlay routing, is able to significantlyimprove the availability of end-to-end paths.
This paper is structured as follows. In Section 2, we describepast work that demonstrates limitations in the current routing sys-tem, including work on overlay routing and ISP multihoming.Sec-tion 3 provides an overview of our approach. Section 4 gives de-tails of our measurement testbed. In Section 5, we analyze the RTTand throughput performance differences between route control andoverlay routing and consider some possible reasons for the differ-ences. In Section 6, we contrast the end-to-end availability offeredby the two schemes. Section 7 discusses the implications of ourresults and presents some limitations of our approach. Finally, Sec-tion 8 summarizes the contributions of the paper.
2. RELATED WORKPast studies have identified and analyzed several shortcomings
in the design and operation of BGP, including route convergencebehavior [16, 17] and “inflation” of end-to-end paths due to BGPpolicies [28, 32]. Particularly relevant to our study are proposalsfor overlay systems to bypass BGP routing to improve performanceand fault tolerance, such as Detour [25] and RON [6].
In the Detour work, Savage et al. [25] study the inefficienciesof wide-area routing on end-to-end performance in terms of round-trip time, loss rate, and throughput. Using observations drawn fromactive measurements between public traceroute server nodes, theycompare the performance on default Internet (BGP) paths with thepotential performance from using alternate paths. This work showsthat for a large fraction of default paths measured, there are alter-nate indirect paths offering much better performance.
Andersenet al. propose Resilient Overlay Networks (RONs) toaddress the problems with BGP’s fault recovery times, whichhave
been shown to be on order of tens of minutes in some cases [6].RON nodes regularly monitor the quality and availability ofpathsto each other, and use this information to dynamically select di-rect or indirect end-to-end paths. RON mechanisms are showntosignificantly improve the availability and performance of end-to-end paths between the overlay nodes. The premise of the Detourand RON studies is that BGP-based route selection is fundamen-tally limited in its ability to improve performance and react quicklyto path failures. Both Detour and RON compare the performanceand resilience of overlay paths against default paths via asingleprovider. Overlays offer a greater choice of end-to-end routes, aswell as greater flexibility in controlling the route selection. In con-trast, we explore the effectiveness of empowering BGP-based routeselection with intelligent route control at multihomed end-networksin improving end-to-end availability and performance relative tooverlay routing.
Also, several past studies have focused on “performance-aware”routing, albeit not from an end-to-end perspective. Proposals havebeen made for load sensitive routing within ISPs (see [27], for ex-ample) and, intra- and inter-domain traffic engineering [10, 23, 15].However, the focus of these studies is on balancing the utilizationon ISP links and not necessarily on end-to-end performance.Moredirectly related to our work is a recent study on the potential ofmultihoming route control to improve end-to-end performance andresilience, relative to using paths through a single ISP [3]. Finally,a number of vendors have recently developed intelligent routingappliances that monitor availability and performance overmulti-ple ISP links, and automatically switch traffic to the best provider.These products facilitate very fine-grained selection of end-to-endmultihoming routes (e.g., [8, 19, 21, 24]).
3. COMPARING BGP PATHS WITH OVER-LAY ROUTING
Our objective is to understand whether the modest flexibility ofmultihoming, coupled with route control, is able to offer end-to-endperformance and resilience similar to overlay routing. In order toanswer this question, we evaluate an idealized form of multihomingroute control where the end-network has instantaneous knowledgeabout the performance and availability of routes via each ofits ISPsfor any transfer. We also assume that the end-network can switchbetween candidate paths to any destination as often as desired. Fi-nally, we assume that the end-network can easily control theISPlink traversed by packets destined for its network (referred to as“inbound control”).
In a real implementation of multihoming route control, however,there are practical limitations on the ability of an end-network totrack ISP performance, on the rate at which it can switch paths, andon the extent of control over incoming packets. However, recentwork [4] shows that simple active and passive measurement-basedschemes can be employed to obtain near-optimal availability, andRTT performance that is within 5-10% of the optimal, in practicalmultihomed environments. Also, simple NAT-based techniques canbe employed to achieve inbound route control [4].
To ensure a fair comparison, we study a similarly agile form ofoverlay routing where the end-point has timely and accurateknowl-edge of the best performing, or most available, end-to-end overlaypaths. Frequent active probing of each overlay link, makes it pos-sible to select and switch to the best overlay path at almost anyinstant when the size of the overlay network is small (∼50 nodes)1.
We compare overlay routing and route control with respect tothe degree of flexibility available at the end-network. In general,
1Such frequent probing is infeasible for larger overlays [6].
this flexibility is represented byk, the number of ISPs available toeither technique at the end-network. In the case of route control,we considerk-multihoming, where we evaluate the performanceand reliability of end-to-end candidate paths induced by a combi-nation ofk ISPs. For overlay routing, we introduce the notion ofk-overlays, wherek is the number of providers available to an end-point for any end-to-end overlay path. In other words, this is simplyoverlay routing in the presence ofk ISP connections.
When comparingk-multihoming withk-overlays, we report re-sults based on the combination ofk ISPs that gives thebest per-formance(RTT or throughput) across all destinations. In prac-tice an end-network cannot purchase connectivity from all availableproviders, or easily know which combination of ISPs will providethe best performance. Rather, our results demonstrate how muchflexibility is necessary, in terms of the number of ISP connections,and the maximum benefit afforded by this flexibility.
end-network
ISP
BGPdirect paths
3-multihomednetwork
routecontroller
(a) single ISP, BGP routing (b) multihoming with 3 ISPs(1-multihoming) (3-multihoming)
Figure 1: Routing configurations: Figures (a) and (b) show 1-multihoming and 3-multihoming, respectively. Correspondingoverlay configurations are shown in (c) and (d), respectively.
Figure 1 illustrates some possible route control and overlay con-figurations. For example, (a) shows the case of conventionalBGProuting with a single default provider (i.e., 1-multihoming). Fig-ure 1(b) depicts end-point route control with three ISPs (i.e., 3-multihoming). Overlay routing with a single first-hop provider (i.e.,1-overlay) is shown in Figure 1(c), and Figure 1(d) shows thecaseof additional first-hop flexibility in a 3-overlay routing configura-tion.
We seek to answer the following key questions:
1. On what fraction of end-to-end paths does overlay routingoutperform multihoming route control in terms of RTT andthroughput? In these cases, what is the extent of the perfor-mance difference?
2. What are the reasons for the performance differences? For
example, must overlay paths violate inter-domain routing poli-cies to achieve good end-to-end performance?
3. Does route control, when supplied with sufficient flexibilityin the number of ISPs, achieve path availability rates that arecomparable with overlay routing?
4. MEASUREMENT TESTBEDAddressing the questions posed in Section 3 from the perspective
of an end-network requires an infrastructure which provides accessto a number of BGP path choices via multihomed connectivity,andthe ability to select among those paths at a fine granularity.Wealso require an overlay network with a reasonably wide deploymentto provide a good choice of arbitrary wide-area end-to-end pathswhich could potentially bypass BGP policies.
We address both requirements with a single measurement testbedconsisting of nodes belonging to the server infrastructureof theAkamai CDN. Following a similar methodology to that describedin [3], we emulate a multihoming scenario by selecting a few nodesin a metropolitan area, each singly-homed to a different ISP, anduse them collectively as a stand-in for a multihomed network. Rela-tive to previous overlay routing studies [25, 6], our testbed is largerwith 68 nodes. Also, since the nodes are all connected to com-mercial ISPs, they avoid paths that traverse Internet2, which mayintroduce unwanted bias due their higher bandwidth and lower like-lihood of queuing, compared to typical Internet paths. Our mea-surements are confined to nodes located in the U.S., though wedosample paths traversing ISPs at all levels of the Internet hierarchyfrom vantage points in many major U.S. metropolitan areas.
The 68 nodes in our testbed span 17 U.S. cities, averaging aboutfour nodes per city, connected to commercial ISPs of varioussizes.The nodes are chosen to avoid multiple servers attached to the sameprovider in a given city. The list of cities and the tiers of the cor-responding ISPs are shown in Figure 2(a). The tiers of the ISPsare derived from the work in [31]. The geographic distribution ofthe testbed nodes is illustrated in Figure 2(b). We emulate multi-homed networks in 9 of the 17 metropolitan areas where there areat least 3 providers – Atlanta, Bay Area, Boston, Chicago, Dallas,Los Angeles, New York, Seattle and Washington D.C.
City Providers/tier1 2 3 4 5
Atlanta, GA 2 0 1 1 0Bay Area, CA 5 0 3 1 2Boston, MA 1 0 1 0 1Chicago, IL 6 1 0 1 0Columbus, OH 0 1 0 1 0Dallas, TX 3 0 0 1 0Denver, CO 1 0 0 0 0Des Moines, IO 0 1 0 0 0Houston, TX 1 1 0 0 0Los Angeles, CA 3 0 3 0 0Miami, FL 1 0 0 0 0Minneapolis, MN 0 0 1 0 0New York, NY 3 2 2 1 0Seattle, WA 2 0 2 1 1St Louis, MO 1 0 0 0 0Tampa, FL 0 1 0 0 0Washington DC 3 0 3 0 2
##
##
#
#
##
#
#
#
#
#
#
#
#
#
(a) Testbed ISPs (b) Node locations
Figure 2: Testbed details: The cities and distribution of ISPtiers in our measurement testbed are listed in (a). The geo-graphic location is shown in (b). The area of each dot is pro-portional to the number of nodes in the region.
5. LATENCY AND THROUGHPUTPERFORMANCE
We now present our results on the relative latency and through-put performance benefits of multihoming route control comparedwith overlay routing. We first describe our data collection method-ology (Section 5.1) and evaluation metrics (Section 5.2). Then,we present the key results in the following order. First we com-pare 1-multihoming against 1-overlays along the same linesas theanalysis in [25] (Section 5.3). Next, we compare the benefitsof us-ing k-multihoming andk-overlay routing, relative to using defaultpaths through a single provider (Section 5.4). Then, we comparek-multihoming against 1-overlay routing, fork ≥ 1 (Section 5.5).Here, we wish to quantify the benefit to end-systems of greaterflexibility in the choice of BGP routes via multihoming, relative tothe power of 1-overlays. Next, we contrastk-multihoming againstk-overlay routing to understand the additional benefits gained byallowing end-systems almost arbitrary control on end-to-end paths,relative to multihoming (Section 5.6). Finally, we examinesomeof the underlying reasons for the performance differences (Sec-tions 5.7 and 5.8).
5.1 Data CollectionOur comparison of overlays and multihoming is based on obser-
vations drawn from two data sets collected on our testbed. The firstdata set consists of active HTTP downloads of small objects (10KB) to measure theturnaround timesbetween the pairs of nodes.The turnaround time is the time between the transfer of the last byteof the HTTP request and the receipt of the first byte of the response,and provides an estimate of the round-trip time. Hereafter,we willuse the terms turnaround time and round-trip time interchangeably.Every 6 minutes, turnaround time samples are collected betweenall node-pairs (including those within the same city).
The second data set contains “throughput” measurements fromactive downloads of 1 MB objects between the same set of node-pairs. These downloads occur every 30 minutes between all node-pairs. Here, throughput is simply the size of the transfer (1MB)divided by the time between the receipt of the first and last bytesof the response data from the server (source). As we discuss inSection 5.2, this may not reflect the steady-state TCP throughputalong the path.
Since our testbed nodes are part of a production infrastructure,we limit the frequencies at which all-pairs measurements are col-lected as described above. To ensure that all active probes betweenpairs of nodes observe similar network conditions, we scheduledthem to occur within a 30 second interval for the round-trip timedata set, and within a 2 minute interval for the throughput data set.For the latter, we also ensure that an individual node is involved inat most one transfer at any time so that our probes do not contendfor bandwidth at the source or destination network. The transfersmay interfere elsewhere in the Internet, however. Also, since ourtestbed nodes are all located in the U.S., the routes we probe, andconsequently, our observations, are U.S.-centric.
The round-trip time data set was collected from Thursday, De-cember 4th, 2003 through Wednesday, December 10th, 2003. Thethroughput measurements were collected between Thursday,May6th, 2004 and Tuesday, May 11th, 2004 (both days inclusive).
5.2 Performance MetricsWe compare overlay routing and multihoming according to two
metrics derived from the data above: round-trip time (RTT) andthroughput. In the RTT data set, for each 6 minute measurementinterval, we build a weighted graph over all the 68 nodes where theedge weights are the RTTs measured between the corresponding
node-pairs. We then use Floyd’s algorithm to compute the shortestpaths between all node-pairs. We estimate the RTT performancefrom usingk-multihoming to a given destination by computing theminimum of the RTT estimates along the direct paths from thekISPs in a city to the destination node (i.e., the RTT measurementsbetween the Akamai CDN nodes representing thek ISPs and thedestination node). To estimate the performance ofk-overlay rout-ing, we compute the shortest paths from thek ISPs to the destina-tion node and choose the minimum of the RTTs of these paths.
Note that we do not prune the direct overlay edge in the graphbefore performing the shortest path computation. As a result, theshortest overlay path between two nodes could be adirectpath (i.e.,chosen by BGP). Hence our comparison is not limited to directversus indirect paths, but is rather between direct andoverlaypaths.In contrast, the comparison in [25] is between the direct path andthebest indirect path.
For throughput, we similarly construct a weighted, directed graphbetween all overlay nodes every 30 minutes (i.e., our 1 MB ob-ject download frequency). The edge weights are the throughputsof the 1 MB transfers (where throughput is computed as describedin Section 5.1). We compute the throughput performance ofk-multihoming andk-overlay routing similar to the RTT performancecomputation above. Notice, however, that computing the overlaythroughput performance is non-trivial and is complicated by theproblem of estimating the end-to-end throughput for a 1 MB TCPtransfer on indirect overlay paths.
Our approach here is to use round-trip time and throughput mea-surements on individual overlay hops to first compute the under-lying loss rates. Since it is likely that the paths we measuredonot observe any loss, thus causing the transfers to likely remain intheir slow-start phases, we use the small connection latency modeldeveloped in [7]. The typical MSS in our 1MB transfers is 1460bytes. Also, the initial congestion window size is 2 segments andthere is no initial 200ms delayed ACK timeout on the first transfer.In the throughput data set, we measure a mean loss rate of 1.2%and median, 90th, 95th and 99th percentile loss rates of 0.004%,0.5%, 1% and 40% across all paths measured, respectively.
We can then use the sum of round-trip times and a combinationof loss rates on the individual hops as the end-to-end round-triptime and loss rate estimates, respectively, and employ the modelin [7] to compute the end-to-end overlay throughput for the 1MBtransfers. To combine loss rates on individual links, we follow thesame approach as that described in [25]. We consider two possiblecombination functions. The first, calledoptimistic, uses the maxi-mum observed loss on any individual overlay hop along an overlaypath as an estimate of the end-to-end overlay loss rate. Thisas-sumes that the TCP sender is primarily responsible for the observedlosses. In thepessimisticcombination, we compute the end-to-endloss rate as the sum of individual overlay hop loss rates, assumingthe losses on each link to be due to independent background traf-fic in the network2. Due to the complexity of computing arbitrarylength throughput-maximizing overlay paths, we only consider in-direct paths comprised of at most two overlay hops in our through-put comparison.
5.3 1-Multihoming versus 1-OverlaysFirst, we compare the performance of overlay routing against de-
fault routes via a single ISP (i.e., 1-overlay against 1-multihoming),along the same lines as [25]. Note that, in the case of 1-overlays,the overlay path from a source node may traverse through any in-
2The end-to-end loss rate over two overlay links with independentloss rates ofp1 andp2 is 1− (1− p1)(1− p2) = p1 + p2 − p1p2.p1p2 is negligible in our measurements, so we ignore it.
termediate node, including nodes located in the same city asthesource.
City 1-multihoming/1-overlay
Atlanta 1.35Bay Area 1.20Boston 1.28Chicago 1.29Dallas 1.32
Los Angeles 1.22New York 1.29
Seattle 1.71Wash D.C. 1.30
Average 1.33
0
0.2
0.4
0.6
0.8
1
1 2 3 4 5 6 7
Fra
ctio
n of
ove
rlay
path
s w
ith <
x h
ops
Number of overlay hops
AtlantaBay Area
BostonChicago
DallasLos Angeles
New YorkSeattle
Washington D C
(a) 1-multihoming RTT (b) 1-overlay path lengthrelative to 1-overlays
Figure 3: Round-trip time performance: Average RTT perfor-mance of 1-multihoming relative to 1-overlay routing is tabu-lated in (a) for various cities. The graph in (b) shows the dis-tribution of the number of overlay hops in the best 1-overlaypaths, which could be the direct path (i.e., 1 overlay hop).
Round-trip time performance. Figure 3(a) shows the RTT per-formance of 1-multihoming relative to 1-overlay routing. Here,the performance metric (y-axis) reflects the relative RTT from 1-multihoming versus the RTT when using 1-overlays, averagedoverall samples to all destinations. The difference between this metricand 1 represents the relative advantage of 1-overlay routing over1-multihoming. Notice also that since the best overlay pathcouldbe the direct BGP path, the performance from overlays is at leastas good as that from the direct BGP path. We see from the ta-ble that overlay routing can improve RTTs between 20% and 70%compared to using direct BGP routes over a single ISP. The averageimprovement is about 33%. The observations in [25] are similar.
We show the distribution of overlay path lengths in Figure 3(b),where the direct (BGP) path corresponds to a single overlay hop.Notice that in most cities, the best overlay path is only one or twohops in more than 90% of the measurements. That is, the major-ity of the RTT performance gains in overlay networks are realizedwithout requiring more than a single intermediate hop. Also, onan average, the best path from 1-overlays coincides with thedirectBGP path in about 54% of the measurements (average y-axis valueat x=1 across all cities).
Throughput performance. In Table 1, we show the throughputperformance of 1-overlays relative to 1-multihoming for both thepessimistic and the optimistic estimates. 1-overlays achieve 6–20% higher throughput than 1-multihoming, according to thepes-simistic estimate. According to the optimistic throughputestimate,1-overlays achieve 10–25% better throughput. In Table 1, wealsoshow the fraction of times an indirect overlay path obtains betterthroughput than the direct path, for either throughput estimationfunction. Under the pessimistic throughput estimate, on average, 1-overlay routing benefits from employing an indirect path in about17% of the cases. Under the optimistic estimate, this fraction is23%.
Summary. 1-Overlays offer significantly better round-trip timeperformance than 1-multihoming (33% on average). The through-put benefits are lower, but still significant (15% on average). Also,in a large fraction of the measurements, indirect 1-overlaypathsoffer better RTT performance than direct 1-multihoming paths.
City Pessimistic estimate Optimistic estimateThroughput metric Fraction of Throughput metric Fraction of
Table 1: Throughput performance: This table shows the 1 MBTCP transfer performance of 1-overlay routing relative to 1-multihoming (for both estimation functions). Also shown isthefraction of measurements in which 1-overlay routing selects anindirect path in each city.
In this section we compare the flexibility offered by multihom-ing route control at an end point in isolation, and in combinationwith overlay routing, against using default routes via a single ISP(i.e., k-multihoming andk-overlays against 1-multihoming). Themain purpose of these comparisons is to establish a baselinefor theupcoming head-to-head comparisons betweenk-multihoming andk-overlay routing in Sections 5.5 and 5.6.
1
1.2
1.4
1.6
1.8
2
2.2
1 2 3 4 5 6 7 81-m
ultih
omin
g re
lativ
e to
k-m
ultih
omin
g
Number of Providers (k)
AtlantaBay Area
BostonChicago
DallasLos Angeles
New YorkSeattle
Washington D C
1
1.2
1.4
1.6
1.8
2
2.2
1 2 3 4 5 6 7 8k-m
ultih
omin
g re
lativ
e to
1-m
ultih
omin
g
Number of Providers (k)
AtlantaBay Area
BostonChicago
DallasLos Angeles
New YorkSeattle
Washington D C
(a) Relative RTTs (b) Throughput (pessimistic)
Figure 4: Benefits of k-multihoming: The RTT of 1-multihoming relative to k-multihoming is shown in (a) andthroughput (pessimistic estimate) ofk-multihoming relative to1-multihoming is shown in (b).
1-Multihoming versus k-multihoming. Figure 4(a) shows theRTT performance of 1-multihoming relative to the RTT perfor-mance fromk-multihoming averaged across all samples to all des-tinations (y-axis), as a function of the number of providers, k (x-axis). Note that the difference between the performance metric onthe y-axis and 1 indicates the relative advantage ofk-multihomingover 1-multihoming. The RTT benefit from multihoming is about15–30% fork = 2 and about 20–40% fork = 3 across all thecities. Also, beyondk = 3 or 4 the marginal improvement in theRTT performance from multihoming is negligible. The observa-tions made by Akella et al. in [3] are similar.
Figure 4(b) similarly shows the throughput performance ofk-multihoming relative to the throughput from 1-multihoming, ac-cording to the pessimistic estimate. The results for the optimisticestimate are similar and are omitted for brevity. Again,k-multihoming,for k = 3, achieves 15–25% better throughput than 1-multihoming
and the marginal improvement in the throughput performanceisnegligible beyondk = 3.
1
1.2
1.4
1.6
1.8
2
2.2
1 2 3 4 5 6 7 8
1-m
ultih
omin
g re
lativ
e to
k-o
verla
ys
Number of Providers (k)
AtlantaBay Area
BostonChicago
DallasLos Angeles
New YorkSeattle
Washington D C
1
1.2
1.4
1.6
1.8
2
2.2
1 2 3 4 5 6 7 8k-
over
lays
rel
ativ
e to
1-m
ultih
omin
gNumber of Providers (k)
AtlantaBay Area
BostonChicago
DallasLos Angeles
New YorkSeattle
Washington D C
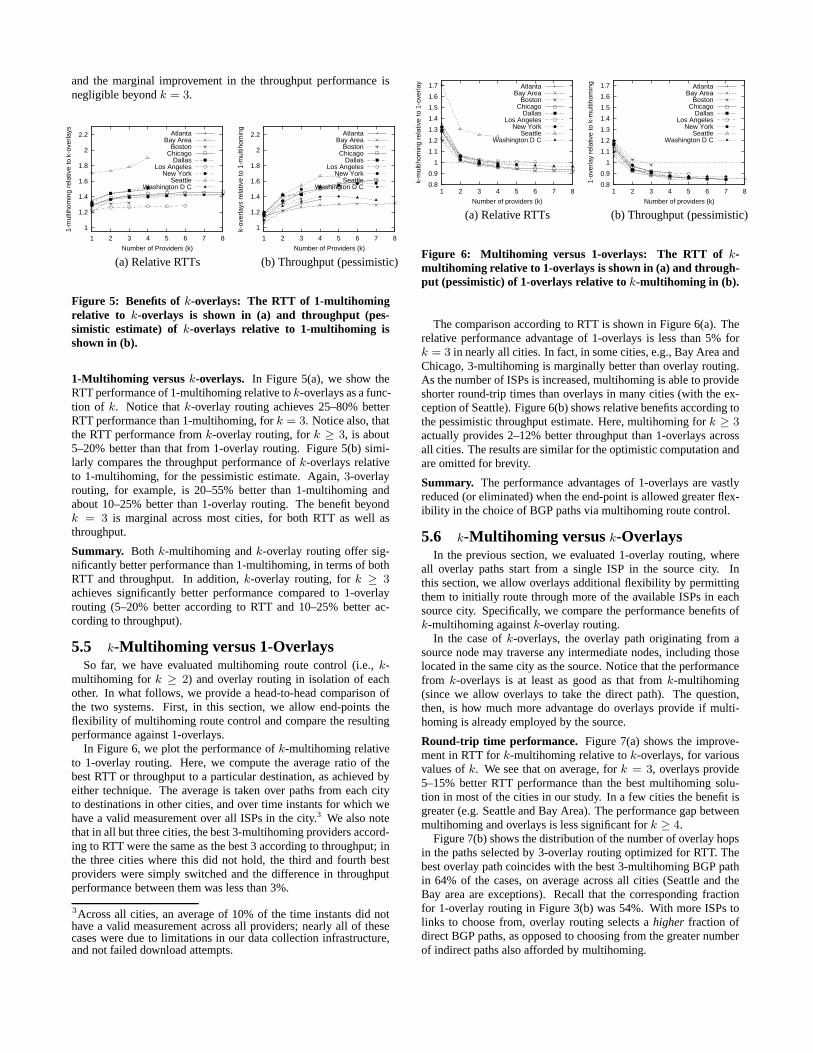
(a) Relative RTTs (b) Throughput (pessimistic)
Figure 5: Benefits ofk-overlays: The RTT of 1-multihomingrelative to k-overlays is shown in (a) and throughput (pes-simistic estimate) of k-overlays relative to 1-multihoming isshown in (b).
1-Multihoming versus k-overlays. In Figure 5(a), we show theRTT performance of 1-multihoming relative tok-overlays as a func-tion of k. Notice thatk-overlay routing achieves 25–80% betterRTT performance than 1-multihoming, fork = 3. Notice also, thatthe RTT performance fromk-overlay routing, fork ≥ 3, is about5–20% better than that from 1-overlay routing. Figure 5(b) simi-larly compares the throughput performance ofk-overlays relativeto 1-multihoming, for the pessimistic estimate. Again,3-overlayrouting, for example, is 20–55% better than 1-multihoming andabout 10–25% better than 1-overlay routing. The benefit beyondk = 3 is marginal across most cities, for both RTT as well asthroughput.
Summary. Both k-multihoming andk-overlay routing offer sig-nificantly better performance than 1-multihoming, in termsof bothRTT and throughput. In addition,k-overlay routing, fork ≥ 3achieves significantly better performance compared to 1-overlayrouting (5–20% better according to RTT and 10–25% better ac-cording to throughput).
5.5 k-Multihoming versus 1-OverlaysSo far, we have evaluated multihoming route control (i.e.,k-
multihoming fork ≥ 2) and overlay routing in isolation of eachother. In what follows, we provide a head-to-head comparison ofthe two systems. First, in this section, we allow end-pointstheflexibility of multihoming route control and compare the resultingperformance against 1-overlays.
In Figure 6, we plot the performance ofk-multihoming relativeto 1-overlay routing. Here, we compute the average ratio of thebest RTT or throughput to a particular destination, as achieved byeither technique. The average is taken over paths from each cityto destinations in other cities, and over time instants for which wehave a valid measurement over all ISPs in the city.3 We also notethat in all but three cities, the best 3-multihoming providers accord-ing to RTT were the same as the best 3 according to throughput;inthe three cities where this did not hold, the third and fourthbestproviders were simply switched and the difference in throughputperformance between them was less than 3%.
3Across all cities, an average of 10% of the time instants did nothave a valid measurement across all providers; nearly all ofthesecases were due to limitations in our data collection infrastructure,and not failed download attempts.
0.8
0.9
1
1.1
1.2
1.3
1.4
1.5
1.6
1.7
1 2 3 4 5 6 7 8
k-m
ultih
omin
g re
lativ
e to
1-o
verla
y
Number of providers (k)
AtlantaBay Area
BostonChicago
DallasLos Angeles
New YorkSeattle
Washington D C
0.8
0.9
1
1.1
1.2
1.3
1.4
1.5
1.6
1.7
1 2 3 4 5 6 7 8
1-ov
erla
y re
lativ
e to
k-m
ultih
omin
g
Number of providers (k)
AtlantaBay Area
BostonChicago
DallasLos Angeles
New YorkSeattle
Washington D C
(a) Relative RTTs (b) Throughput (pessimistic)
Figure 6: Multihoming versus 1-overlays: The RTT of k-multihoming relative to 1-overlays is shown in (a) and through-put (pessimistic) of 1-overlays relative tok-multihoming in (b).
The comparison according to RTT is shown in Figure 6(a). Therelative performance advantage of 1-overlays is less than 5% fork = 3 in nearly all cities. In fact, in some cities, e.g., Bay Area andChicago, 3-multihoming is marginally better than overlay routing.As the number of ISPs is increased, multihoming is able to provideshorter round-trip times than overlays in many cities (withthe ex-ception of Seattle). Figure 6(b) shows relative benefits according tothe pessimistic throughput estimate. Here, multihoming for k ≥ 3actually provides 2–12% better throughput than 1-overlaysacrossall cities. The results are similar for the optimistic computation andare omitted for brevity.
Summary. The performance advantages of 1-overlays are vastlyreduced (or eliminated) when the end-point is allowed greater flex-ibility in the choice of BGP paths via multihoming route control.
5.6 k-Multihoming versus k-OverlaysIn the previous section, we evaluated 1-overlay routing, where
all overlay paths start from a single ISP in the source city. Inthis section, we allow overlays additional flexibility by permittingthem to initially route through more of the available ISPs ineachsource city. Specifically, we compare the performance benefits ofk-multihoming againstk-overlay routing.
In the case ofk-overlays, the overlay path originating from asource node may traverse any intermediate nodes, includingthoselocated in the same city as the source. Notice that the performancefrom k-overlays is at least as good as that fromk-multihoming(since we allow overlays to take the direct path). The question,then, is how much more advantage do overlays provide if multi-homing is already employed by the source.
Round-trip time performance. Figure 7(a) shows the improve-ment in RTT fork-multihoming relative tok-overlays, for variousvalues ofk. We see that on average, fork = 3, overlays provide5–15% better RTT performance than the best multihoming solu-tion in most of the cities in our study. In a few cities the benefit isgreater (e.g. Seattle and Bay Area). The performance gap betweenmultihoming and overlays is less significant fork ≥ 4.
Figure 7(b) shows the distribution of the number of overlay hopsin the paths selected by 3-overlay routing optimized for RTT. Thebest overlay path coincides with the best 3-multihoming BGPpathin 64% of the cases, on average across all cities (Seattle andtheBay area are exceptions). Recall that the corresponding fractionfor 1-overlay routing in Figure 3(b) was 54%. With more ISPs tolinks to choose from, overlay routing selects ahigher fraction ofdirect BGP paths, as opposed to choosing from the greater numberof indirect paths also afforded by multihoming.
1
1.1
1.2
1.3
1.4
1.5
1.6
1.7
1 2 3 4 5 6 7 8
k-m
ultih
omin
g re
lativ
e to
k-o
verla
y
Number of Providers (k)
AtlantaBay Area
BostonChicago
DallasLos Angeles
New YorkSeattle
Washington D C
0
0.2
0.4
0.6
0.8
1
1 2 3 4 5 6 7
Fra
ctio
n of
ove
rlay
path
s w
ith <
x h
ops
Number of overlay hops
AtlantaBay Area
BostonChicago
DallasLos Angeles
New YorkSeattle
Washington D C
(a) Relative RTTs (b) 3-Overlay path length
Figure 7: Round-trip time improvement: Round-trip timefrom k-multihoming relative to k-overlay routing, as a func-tion of k, is shown in (a). In (b), we show the distribution of thenumber of overlay hops in the bestk-overlay paths, for k=3.
1
1.1
1.2
1.3
1.4
1.5
1.6
1.7
1 2 3 4 5 6 7 8
k-ov
erla
y re
lativ
e to
k-m
ultih
omin
g
Number of providers (k)
AtlantaBay Area
BostonChicago
DallasLos Angeles
New YorkSeattle
Washington D C
City Fraction ofindirect paths
Atlanta 5%Bay Area 1%Boston 13%Chicago 3%Dallas 8%
Los Angeles 4%New York 8%
Seattle 31%Wash D.C. 2%
Average 8%
(a) Throughput improvement (b) Fraction of indirect(pessimistic estimate) paths in 3-overlay routing
Figure 8: Throughput improvement: Throughput perfor-mance ofk-multihoming relative to k-overlays for various citiesis shown in (a). The table in (b) shows the fraction of measure-ments on whichk-overlay routing selected an indirect end-to-end path, for the case ofk = 3.
Throughput performance. Figure 8(a) shows the throughput per-formance ofk-multihoming relative tok-overlays using the pes-simistic throughput estimation function. From this figure,we seethat multihoming achieves throughput performance within 1–10%of overlays, fork = 3. The performance improves up tok = 3or k = 4. In all the cities, the throughput performance of4-multihoming is within 3% of overlay routing. In Figure 8(b),wealso show the fraction of measurements where an indirect 3-overlaypath offers better performance than the direct 3-multihoming path,for the pessimistic throughput estimate. On average, this fractionis about 8%. Notice that this is again lower than the correspondingpercentage for 1-overlays from Table 1 (≈ 17%).
Summary. When employed in conjunction with multihoming, over-lay routing offers marginal benefits over employing multihomingalone. For example, multiple ISPs allows overlay routing toachieveonly a 5–15% RTT improvement over multihoming route control(for k = 3), and 1–10% improvement in throughput. In addition,k-overlay routing selects a larger fraction of direct BGP-based end-to-end paths, compared to 1-overlay routing.
5.7 Unrolling the AveragesSo far, we presented averages of the performance differences for
various forms of overlay routing and multihoming route control. Inthis section, focusing on 3-overlays and 3-multihoming, wepresent
the underlying distributions in the performance differences alongthe paths we measure. Our goal in this section is to understand ifthe averages are particularly skewed by: (1) certain destinations,for each source city or (2) a few measurement samples on whichoverlays offer significantly better performance than multihomingor (3) by time-of-day or day-of-week effects.
0
0.2
0.4
0.6
0.8
1
0 5 10 15 20 25
Fra
c. o
f des
tinat
ions
with
mea
n di
ff <
x
Difference in turnaround times (ms)
AtlantaBay Area
BostonChicago
DallasLos Angeles
New YorkSeattle
Washington D C0
0.2
0.4
0.6
0.8
1
0 1 2 3 4 5 6 7 8
Fra
c. o
f des
tinat
ions
with
diff
< x
Difference in throughputs (Mbps)
AtlantaBay Area
BostonChicago
DallasLos Angeles
New YorkSeattle
Washington D C
(a) Mean difference in (b) Mean difference inround-trip times throughputs (pessimistic)
Figure 9: Performance per destination: Figure (a) is a CDFof the mean difference in RTTs along the best overlay pathand the best direct path, across paths measured from each city.Similarly, Figure (b) plots the CDF of the mean difference inthroughputs (pessimistic estimate).
Performance per destination. In Figure 9(a), for each city, weshow the distribution of the average difference in RTT between thebest3-multihoming path and the best 3-overlay path to each desti-nation (i.e., each point represents one destination). In most cities,the average RTT differences across 80% of the destinations are lessthan 10ms. Notice that in most cities (except Seattle), the differ-ence is greater than 15ms for less than 5% of the destinations.
In Figure 9(b), we consider the distribution of the average through-put difference of the best3-multihoming path and the best3-overlaypath for the pessimistic estimate of throughput. We see the through-put difference is less than 1 Mbps for 60–99% of the destinations.We also note that, for 1–5% of the destinations, the difference isin excess of 4 Mbps. Recall from Figure 8, however, that thesedifferences result in an average relative performance advantage foroverlays of less than 1–10% (fork = 3).
Mean versus other statistics.In Figures 10(a) and (b) we plot theaverage, median, and 10th and 90th percentiles of the difference inRTT and (pessimistic) throughput, respectively, between the best
3-multihoming option and the best3-overlay path across paths inall cities. In Figure 10(a) we see that the median RTT differenceis fairly small. More than 90% of the median RTT differences areless than 10ms. The 90th percentile of the difference is marginallyhigher with roughly 10% greater than 15ms. The median through-put differences in Figure 10(b) are also relatively small – less than500 kbps about 90% of the time. Considering the upper range ofthe throughput difference (i.e., the 90th percentile difference), wesee that a significant fraction (about 20%) are greater than 2Mbps.These results suggest that the absolute round-trip and throughputdifferences between multihoming and overlay routing are small forthe most part, though there are a few of cases where differences aremore significant, particularly for throughput.
Time-of-day and day-of-week effects.We also considered the ef-fects of daily and weekly network usage patterns on the relative per-formance ofk-multihoming andk-overlays. It might be expectedthat route control would perform worse during peak periods sinceoverlay paths have greater freedom to avoid congested partsof thenetwork. We do not see any discernible time-of-day effects in pathsoriginating from a specific city, however, both in terms of RTT andthroughput performance.
Similarly, we also examine weekly patterns to determine whetherthe differences are greater during particular days of the week, butagain there are no significant differences for either RTT or through-put. We omit both these results for brevity. The lack of a time-of-day effect on the relative performance may be indicativethatISP network operators already take such patterns into account whenperforming traffic engineering.
Summary. k-overlays offer significantly better performance rela-tive tok-multihoming for a small fraction of transfers from a givencity. We observed little dependence on the time-of-day or day-of-week in the performance gap between overlays and multihoming.
5.8 Reasons for Performance DifferencesNext, we try to identify the underlying causes of performance
differences betweenk-multihoming andk-overlay routing. We fo-cus on the RTT performance and the case wherek = 3. First, weask if indirect paths primarily improve propagation delay or mostlyselect less congested routes than the direct paths. Then, wefocuson how often the best-performing indirect paths violate commoninter-domain and peering policies.
5.8.1 Propagation Delay and CongestionImprovement
In this section, we are interested in whether the modest advan-tage we observe for overlay routing is due primarily to its ability tofind “shorter” (i.e., lower propagation delay) paths outside of BGPpolicy routing, or whether the gains come from being able to avoidcongestion in the network (a similar analysis was done in [25]).
The pairwise instantaneous RTT measurements we collect mayinclude a queuing delay component in addition to the base propaga-tion delay. When performance improvements are due primarily torouting around congestion, we expect the difference in propagationdelay between the indirect and direct path to be small. Similarly,when the propagation difference is large, we can attribute the per-formance gain to the better efficiency of overlay routing comparedto BGP in choosing “shorter” end-to-end paths. In our measure-ments, to estimate the propagation delay on each path, we take the5th percentile of the RTT samples for the path.
In Figure 11, we show a scatter plot of the overall RTT improve-ment (x-axis) and the corresponding propagation time difference(y-axis) offered by the best overlay path relative to the best mul-tihoming path. The graph only shows measurements in which the
-100
-50
0
50
100
0 20 40 60 80 100
Diff
in p
ropa
gatio
n tim
e (m
s)
Difference in round-trip time (ms)
y=x
y=x/2
x=20
Figure 11: Propagation vs congestion: A scatter plot of theRTT improvement (x-axis) vs propagation time improvement(y-axis) of the indirect overlay paths over the direct paths.
indirect overlay paths offer an improved RTT over the best directpath. Points near they = 0 line represent cases in which the RTTimprovement has very little associated difference in propagationdelay. Points near they = x line are paths in which the RTT im-provement is primarily due to better propagation time.
For paths with a large RTT improvement (e.g.,> 50ms), thepoints are clustered closer to they = 0 line, suggesting that largeimprovements are due primarily to routing around congestion. Wealso found, however, that 72% of all the points lie above they =x/2 line. These are closer to they = x line thany = 0, indicatingthat a majority of the round-trip improvements do arise froma re-duction in propagation delay. In contrast, Savage et al. [25] observethat both avoiding congestion and the ability to find shorterpathsare equally responsible for the overall improvements from overlayrouting. The difference in our observations from those in [25] couldbe due to the fact that Internet paths are better provisionedand lesscongested today than 3-4 years ago. However, they are sometimescircuitous, contributing to inflation in end-to-end paths [28].
Total fraction of lower de-lay overlay paths
36%
Fraction of Fraction of alllower delay paths overlay paths
Indirect paths with >
20ms improvement4.7% 1.7%
Prop delay improvement< x% of overall improve-ment (whenever overallimprovement> 20ms)
< 50% 2.2% 0.8%< 25% 1.7% 0.6%< 10% 1.2% 0.4%
Table 2: Analysis of overlay paths: Classification of indirectpaths offering > 20ms improvement in RTT performance.
To further investigate the relative contributions of propagationdelay and congestion improvements, we focus more closely oncases where indirect overlay paths offer a significant improvement(> 20ms) over the best direct paths. Visually, these are all pointslying to the right of thex = 20 line in Figure 11. In Table 2 wepresent a classification of all of the indirect overlay pathsoffering> 20ms RTT improvement. Recall that, in our measurement, 36%of the indirect 3-overlay paths had a lower RTT than the corre-sponding best direct path (Section 5.6, Figure 7 (b)). However, ofthese paths, only 4.7% improved the delay by more than 20ms (Ta-ble 2, row 3). For less than half of these, or 2.2% of all lower delay
overlay paths, the propagation delay improvement relativeto directpaths was less than 50% of the overall RTT improvement. Visu-ally, these points lie to the right ofx = 20 and below they = x/2lines in Figure 11. Therefore, these are paths where the significantimprovement in performance comes mainly from the ability oftheoverlay to avoid congested links. Also, when viewed in termsof alloverlay paths (see Table 2, column 3), we see that these pathsforma very small fraction of all overlay paths (≈ 0.8%).
0
20
40
60
80
100
120
0 20 40 60 80 100 120
Indi
rect
pat
h pr
opag
atio
n (m
s)
Direct path propagation (ms)
y=x
Figure 12: “Circuitousness” of routes: Figure plotting thepropagation delay of the best indirect path (y-axis) against thebest multihoming path (x-axis).
Finally, if we consider the propagation delay of the best indirectoverlay path versus the best multihoming path, we can get someidea of the relative ability to avoid overly “circuitous” paths, arisingfrom policy routing, for example. Figure 12 shows a scatter plot ofthe propagation delay of the best direct path from a city (x-axis)and the best propagation delay via an indirect path (y-axis). Again,points below they = x line are cases in which overlay routingfinds shorter paths than conventional BGP routing, and vice versa.Consistent with the earlier results, we see that the majority of pointslie below they = x line where overlays find lower propagationdelay paths. Moreover, for cases in which the direct path is shorter(above they = x line), the difference is generally small, roughly10-15ms along most of the range.
Summary. A vast majority of RTT performance improvementsfrom overlay routing arise from its ability to find shorter end-to-end paths compared to the best direct BGP paths. However, themost significant improvements (> 50ms) stem from the ability ofoverlay routing to avoid congested ISP links4.
5.8.2 Inter-domain and Peering Policy ComplianceTo further understand the performance gap between some over-
lay routes and direct BGP routes, we categorize the overlay routesby their compliance with common inter-domain and peering poli-cies. Inter-domain and peering policies typically represent businessarrangements between ISPs [11, 20]. Because end-to-end overlaypaths need not adhere to such policies, we try to quantify theper-formance gain that can be attributed to ignoring them.
Two key inter-domain policies [12] arevalley-free routing—ISPs generally do not provide transit between their providers orpeers because it represents a cost to them; andprefer customer—when possible, it is economically preferable for an ISP to routetraffic via customers rather than providers or peers, and peers ratherthan providers. In addition, Spring et al. [28] observed that ISPs of-
4The improvements from overlay routing could also be from over-lays choosing higher bandwidth paths. This aspect is difficult toquantify and we leave it as future work.
ten obey certainpeering policies. Two common policies areearlyexit— in which ISPs “offload” traffic to peers quickly by using thepeering point closest to the source; andlate exit— some ISPs co-operatively carry traffic further than they have to by using peeringpoints closer to the destination. BGP path selection is alsoimpactedby the fact that the routes must have the shortest AS hop count.
We focus on indirect overlay paths (i.e.,> 1 virtual hop) thatprovide better end-to-endround-trip performance than the corre-sponding direct BGP paths. To characterize these routes, weiden-tified AS level paths using traceroutes performed during thesameperiod as the turnaround time measurements. Each turnaround timemeasurement was matched with a traceroute that occurred within20 minutes of it (2.7% did not have corresponding traceroutes andwere ignored in this analysis). We map IP addresses in the tracer-oute data to AS numbers using a commercial tool which uses BGPtables from multiple vantage points to extract the “origin AS” foreach IP prefix [2]. One issue with deriving the AS path from tracer-outes is that these router-level AS paths may be different than theactual BGP AS path [18, 5, 14], often due to the appearance of anextra AS number corresponding to an Internet exchange pointora sibling AS5. In our analysis, we omit exchange point ASes, andalso combine the sibling ASes, for those that we are able to identify.To ascertain the policy compliance of the indirect overlay paths, weused AS relationships generated by the authors of [31] during thesame period as our measurements.
In our AS-level overlay path construction, we ignore the ASes ofintermediate overlay nodes if they were used merely as non-transithops to connect overlay path segments. For example, consider theoverlay path between a source in ASS1 and a destination inD2,composed of the two AS-level segmentsS1 A1 B1 C1 andC1B2 D2, where the intermediate node is located inC1. If the timespent inC1 is short (< 3ms), andB1 andB2 are the same ISP,we consider the AS path asS1 A1 B1 D2, otherwise we con-sider it asS1 A1 B1 C1 B2 D2. Since we do this only for in-termediate ASes that are not a significant factor in the end-to-endround-trip difference, we avoid penalizing overlay paths for pol-icy violations that are just artifacts of where the intermediate hopbelongs in the AS hierarchy.
Table 3 classifies the indirect overlay paths by policy confor-mance. As expected, the majority of indirect paths (70%) violatedeither the valley-free routing or prefer customer policies. How-ever, a large fraction of overlay paths (22%) appeared to be policycompliant. We sub-categorize the latter fraction of paths furtherby examining which AS-level overlay paths were identical totheAS-level direct BGP path and which ones were different.
For each overlay path that was identical, we characterized it asexiting an AS earlier than the direct path if it remained in the ASfor at least 20ms less than it did in the direct path. We characterizedit as exiting later if it remained in an AS for at least 20ms longer.We consider the rest of the indirect paths to be “similar” to thedirect BGP paths. We see that almost all identical AS-level overlaypaths either exited later or were similar to the direct BGP path.This suggests that cooperation among ISPs, e.g., in terms oflateexit policies, can improve performance on BGP routes and furtherclose the gap between multihoming and overlays. We also notethatfor the AS-level overlay paths that differed, the majority were thesame length as the corresponding direct path chosen by BGP.
5Two ASes identified as peers may actually be siblings [31, 11],in which case they would provide transit for each other’s trafficbecause they are administered by the same entity. We classifiedpeers as siblings if they appeared to provide transit in the directBGP paths in our traceroutes, and also manually adjusted pairingsthat were not related.
Earlier AS Exit 1.6 5.3 8 0.7 54.1 119Similar AS Exits 6.1 6.4 12 5.8 39.3 53Later AS Exit 5.6 7.8 14 3.8 45.6 57
Diff AS-Level Path 8.8 8.0 17 9.2 34.7 44Longer than BGP Path 1.9 9.9 20 3.5 32.3 39Same Len as BGP Path 6.4 7.6 16 5.5 36.2 45Shorter than BGP Path 0.5 5.4 11 0.1 35.8 43
Unknown 8.4 10.2
Table 3: Overlay routing policy compliance: Breakdown of themean and 90th percentile round trip time improvement of in-direct overlay routes by: (1) routes did not conform to com-mon inter-domain policies, and (2) routes that were valid inter-domain paths but either exited ASes at different points thanthedirect BGP route or were different than the BGP route.
Summary. In achieving better RTT performance than direct BGPpaths, most indirect overlay paths violate common inter-domainrouting policies. We observed that a fraction of the policy-compliantoverlay paths could be realized by BGP if ISPs employed coopera-tive peering policies such as late exit.
6. RESILIENCE TO PATH FAILURESBGP’s policy-based routing architecture masks a great dealof
topology and path availability information from end-networks inorder to respect commercial relationships and limit the impact oflocal changes on neighboring downstream ASes [10, 22]. Thisde-sign, while having advantages, can adversely affect the ability ofend-networks to react quickly to service interruptions since noti-fications via BGP’s standard mechanisms can be delayed by tensof minutes [16]. Networks employing multihoming route controlcan mitigate this problem by monitoring paths across ISP links,and switching to an alternate ISP when failures occur. Overlay net-works provide the ability to quickly detect and route aroundfailuresby frequently probing the paths between all overlay nodes.
In this section, we perform two separate, preliminary analyses toassess the ability of both mechanisms to withstand end-to-end pathfailures and improve availability of Internet paths. The first ap-proach evaluates the availability provided by route control based onactive probe measurements on our testbed. In the second we com-pute the end-to-end path availability from both route control andoverlays using estimated availabilities of routers along the paths.
6.1 Active Measurements of Path AvailabilityIn our first approach, we perform two-way ICMP pings between
the 68 nodes in our testbed. The ping samples were collected be-tween all node-pairs over a five day period from January 23rd,2004to January 28th, 2004. The probes are sent once every minute witha one second timeout. If no response is received within a second,the ping is deemed lost. A path is considered to have failed if≥ 3consecutive pings (each one minute apart) from the source tothedestination are lost. From these measurements we derive “failureepochs” on each path. The epoch begins when the third failed probetimes out, and ends on the first successful reply from a subsequentprobe. These epochs are the periods of time when the route be-tween the source and destination may have failed.
This method of deriving failure epochs has a few limitations.
Firstly, since we wait for three consecutive losses, we cannot detectfailures that last less than 3 minutes. As a result, our analysis doesnot characterize the relative ability of overlays and routecontrolto avoid such short failures. Secondly, ping packets may also bedropped due to congestion rather than path failure. Unfortunately,from our measurements we cannot easily determine if the losses aredue to failures or due to congestion. Finally, the destination maynot reply with ICMP echo reply messages within one second, caus-ing us to record a loss. To mitigate this factor, we eliminatepathsfor which the fraction of lost probes is> 10% from our analysis.Due to the above reasons, the path failures we identify should beconsidered an over-estimate of the number of failures lasting threeminutes or longer.
From the failure epochs on each end-to-end path, we computethe correspondingavailability, defined as follows:
Availability = 100 ×
(
1 −
∑
iTF (i)
T
)
where,TF (i) is the length of failure epochi along the path, andT is the length of the measurement interval (5 days). The totalsumof the failure epochs can be considered the observed “downtime”of the path.
Figure 13: End-to-end failures: Distribution of the availabilityon the end-to-end paths, with and without multihoming. TheISPs in the 2- and 3-multihoming cases are the best 2 and 3ISPs in each city based on RTT performance, respectively.k-Overlay routing, for any k, achieves 100% availability and isnot shown on the graph.
In Figure 13, we show a CDF of the availability on the paths wemeasured, with and without multihoming. When no multihomingis employed, we see that all paths have at least91% availability(not shown in the figure). Fewer than5% of all paths have lessthan99.5% availability. Route control with multihoming signifi-cantly improves the availability on the end-to-end paths, as shownby the 2- and 3-multihoming availability distributions. Here, forboth 2- and 3-multihoming, we consider the combinations of ISPsproviding the best round-trip time performance in a city. Evenwhen route control uses only 2 ISPs, less than1% of the pathsoriginating from the cities we studied have an availabilityunder99.9%. The minimum availability across all the paths is99.85%,which is much higher than without multihoming. Also, more than94% of the paths from the various cities to the respective destina-tions do not experience any observable failures during the 5dayperiod (i.e.,availability of100%). With three providers, the avail-ability is improved, though slightly. Overlay routing may be ableto circumvent even the few failures that route control couldnotavoid. However, as we show above, this would result in only a
marginal improvement over route control which already offers verygood availability.
6.2 Path Availability AnalysisSince the vast majority of paths did not fail even once during
our relatively short measurement period, our second approach usesstatistics derived from previous long-term measurements to ascer-tain availability. Feamster et al. collected failure data using activeprobes between nodes in the RON testbed approximately every30seconds for several months [9]. When three consecutive probes ona path were lost, a traceroute was triggered to identify where thefailure appeared (i.e., the last router reachable by the traceroute)and how long they lasted. The routers in the traceroute data werealso labeled with their corresponding AS number and also classi-fied as border or internal routers. We use a subset of these measure-ments on paths between non-DSL nodes within the U.S. collectedbetween June 26, 2002 and March 12, 2003 to infer failure rates inour testbed. Though this approach has some drawbacks (whichwediscuss later), it allows us to obtain a view of longer-term availabil-ity benefits of route control and overlay routing that is not otherwisepossible from direct measurements on our testbed.
We first estimate the availabilities of different router classes (i.e.,the fraction of time they are able to correctly forward packets). Weclassify routers in the RON traceroutes by their AS tier (using themethod in [31]) and their role (border or internal router). Notethat the inference of failure location is based on router location, butthe actual failure could be at thelink or router attached to the lastresponding router.
The availability estimate is computed as follows: If∑
T C
F is thetotal time failures attributed to routers of classC were observed,andNC
d is the total number of routers of classC we observed oneach path on dayd,6 then we estimate the availability of a router(or attached link) of classC as:
AvailabilityC = 100 ×
(
1 −
∑
T C
F∑
dNC
d× one day
)
In other words, the fraction of time unavailable is the aggregatefailure time attributed to a router of classC divided by the totaltime we expect to observe a router of classC in any path. Ourestimates for various router classes are shown in Table 4.
Table 4: Availability across router classes: Estimated availabil-ity for routers or links classified by AS tier and location. Weconsider a border router as one with at least one link to an-other AS.
To apply the availability statistics derived from the RON dataset, we identified and classified the routers on paths betweennodes
6The dataset only included a single successful traceroute per day.Therefore, we assumed that all active probes took the same routeeach day.
in our testbed. We performed traceroute measurements approxi-mately every 20 minutes between nodes in our CDN testbed fromDecember 4, 2003 to Dec 11, 2003. For our analysis we used themost often observed path between each pair of nodes; in almost allcases, this path was used more than 95% of the time. Using therouter availabilities estimated from the RON data set, we estimatethe availability of routes in our testbed when we use route controlor overlay routing. When estimating the simultaneous failure prob-ability of multiple paths, it is important to identify whichroutersare shared among the paths so that failures on those paths areaccu-rately correlated. Because determining router aliases wasdifficulton some paths in our testbed,7 we conservatively assumed that therouters at the end of paths toward the same destination were identi-cal if they belonged to the same sequence of ASes. For example, ifwe had two router-level paths destined for a common node thatmapto the ASesA A B B C C andD D D B C C, respectively, weassume the last 3 routers are the same (sinceB C C is common).Even if in reality these routers are different, failures at these routersare still likely to be correlated. The same heuristic was used toidentify identical routers on paths originating from the same sourcenode. We assume other failures are independent.
A few aspects of this approach may introduce biases in our anal-ysis. First, the routes on RON paths may not be representative ofthe routes in our testbed, though we tried to ensure similarity by us-ing only using paths between relatively well-connected RONnodesin the U.S. In addition, we observed that the availabilitiesacrossrouter classes in the RON dataset did not vary substantiallyacrossdifferent months, so we do not believe the difference in timeframesimpacted our results. Second, there may be routers or links in theRON data set that fail frequently and bias the availability of a par-ticular router type. However, since traceroutes are initiated onlywhen a failure is detected, there is no way for us to accurately es-timate the overall failure rates of all individual routers.Third, itis questionable whether we should assign failures to the last reach-able router in a traceroute; it is possible that thenext (unknown)or an even further router in the path is actually the one that failed.Nevertheless, our availabilities still estimate how oftenfailures areobserved at or just after a router of a given type.
Figure 14 compares the average availability using overlaysandroute control on paths originating from 6 cities to all destinations inour testbed. For overlay routing, we only calculate the availabilityof the paths for the first and last overlay hop (since these will bethe same no matter which intermediate hops are used), and assumethat there is always an available path between other intermediatehops. An ideal overlay has a practically unlimited number ofpathchoices, and can avoid a large number of failures in the middle ofthe network.
As expected from our active measurements, the average avail-ability along the paths in our testbed are relatively high, even fordirect paths. 3-multihoming improves the average availability by0.15-0.24% in all the cities (corresponding to about 13-21 morehours of availability each year). Here, the availability isprimarilyupper bounded by the availability of the routers or links immedi-ately before the destination that are shared by all three paths asthey converge.
In most cases, 1-overlays have slightly higher availability (atmost about 0.07%). Since a 1-overlay has arbitrary flexibility inchoosing intermediate hops, only about 2.7 routers are common(on average) between all possible overlay paths, compared to about4.2 in the 3-multihoming case. However, note that a 1-overlay pathusing a single provider is more vulnerable to access link failures
7We found that several ISPs block responses to UDP probe packetsused by IP alias resolution tools such as Ally [29]
99.6
99.65
99.7
99.75
99.8
99.85
99.9
99.95
100
Chicago Wash. D.C. Los Angeles New York Bay Area Seattle
Ave
rage
Ava
ilabi
lity
(per
cent
age)
City
No multihoming3-multihoming
1-overlay3-overlay
Figure 14: Availability comparison: Comparison of availabilityaveraged across paths originating from six cities using a singleprovider, 3-multihoming, 1-overlays, and 3-overlays. ISPs arechosen based on their round-trip time performance.
than when multihoming is employed. For example, the low avail-ability of the 1-overlay in Chicago is due to: (1) the chosen ISP(based on RTT performance) is a tier 4 network, which has internalrouters with relatively lower availability, and (2) all paths exitingthat provider have the first 5 hops in common and hence have a highchance of correlated failures. Finally, we see that using a 3-overlayusually makes routes only slightly more available than whenusinga 1-overlay (between 0.01% to 0.08%, excluding Chicago) . This isbecause at least one router is shared by all paths approaching a des-tination, so failures at that router impact all possible overlay paths.In summary, it is interesting to note that despite the greater flexi-bility of overlays, route control with 3-multihoming is still able toachieve an estimated availability within 0.08-0.10% (or about 7 to9 hours each year) of 3-overlay.
7. DISCUSSIONNext, we discuss observations made from our measurements and
other fundamental tradeoffs between overlay routing and multi-homing route control that are difficult to assess. We also commenton the limitations of our study.
Key observations.As expected, our results show that overlay rout-ing does provide improved latency, throughput, and reliability overroute control with multihoming. We found that overlay routing’sperformance gains arise primarily from the ability to find routesthat are physically shorter (i.e. shorter propagation delay). In ad-dition, its reliability advantages stem from having at its disposal asuperset of the routes available to standard routing. The surprise inour results is that, while past studies of overlay routing have shownthis advantage to be large, we found that careful use of a few ad-ditional routes via multihoming at the end-network was enough tosignificantly reduce the advantage of overlays. Since theirperfor-mance is similar, the question remains whether overlays or multi-homing is the better choice. To answer this, we must look at otherfactors such as cost and deployment issues.
Cost of operation. Unfortunately, it was difficult to consider thecost of implementing route control or overlays in our evaluation. Inthe case of multihoming, a stub network must pay for connectivityto a set of different ISPs. We note that different ISPs chargediffer-ent amounts and therefore the solution we consider “best” may notbe the most cost-effective choice. In the case of overlays, we envi-sion that there will be overlay service offerings, similar to Akamai’sSureRoute [1]. Users of overlays with multiple first hop choices (k-overlay routing in our analysis) must add the cost of subscribing to
the overlay service to the base cost of ISP multihoming.8 Usingan overlay with a single provider (i.e.,1-overlays) would eliminatethis additional cost, but our analysis shows that the performancegain is reduced significantly.
Deployment and operational overhead.Overlays and multihom-ing each have their unique set of deployment and performancechal-lenges that our measurements do not highlight. Below, we considerthe issues of ease of use and deployment, routing table expansionand routing policy violations.
Ease of use and employment.Overlay routing requires a third-partyto deploy a potentially large overlay network infrastructure. Build-ing overlays of sufficient size and distribution to achieve signif-icantly improved round-trip and throughput performance ischal-lenging in terms of infrastructure and bandwidth cost, as well asmanagement complexity. On the other hand, since multihoming isa single end-point based solution, it is relatively easier to deployand use from an end-network’s perspective.
Routing table expansion due to multihoming.An important over-head of multihoming that we did not consider in this study is theresulting increase in the number of routing table entries inback-bone routers. ISPs will likely charge multihomed customersappro-priately for any increased overhead in the network core, thus mak-ing multihoming less desirable. However, this problem occurs onlywhen the stub network announces the same address range to each ofits providers. Since ISPs often limit how small advertised addressblocks can be, this approach makes sense for large and mediumsized stub networks, but is more difficult for smaller ones. Smallernetworks could instead use techniques based on network addresstranslation (NAT) to avoid issues with routing announcements andstill make intelligent use of multiple upstream ISPs [13, 4].
Violation of policies by overlay paths.One of the concerns thatoverlay routing raises is its circumvention of routing policies insti-tuted by intermediate ASes. For example, a commercial endpointcould route data across the relatively well-provisioned, academicInternet2 backbone by using an overlay hop at a nearby university.While each individual overlay hop would not violate any policies(i.e., the nearby university node is clearly allowed to transmit dataacross Internet2), the end-to-end policy may be violated. While ouranalysis quantifies the number of routing policy violations, we didnot consider their impact. Most Internet routing polices are relatedto commercial relationships between service providers. Therefore,it is reasonable to expect that the presence of an overlay node inan ISP network implies that the overlay provider and the ISP havesome form of business agreement. This relationship should requirethat the overlay provider pay for additional expenses that the ISPincurs by providing transit to overlay traffic. Network providerswould thus be compensated for most policy violations, limiting thenegative impact of overlay routing.
Future changes to BGP.Thus far, we have discussed some im-portant issues regarding overlays and route control in today’s en-vironment, but have not considered changes to BGP that may fur-ther improve standard Internet routing performance relative to over-lays. For example, we only consider the impact of performance oravailability-based route selection at the edge of the network. It ispossible that transit ASes could perform similar route control inthe future, thereby, exposing a superior set of AS paths to end net-works. Another future direction is the development of new proto-
8If the ISPs charge according to usage, then the cost of employingmultiple ISP connections in the case ofk-overlays may be higheror lower than the cost of using multiple connections in the case ofk-multihoming.
cols for AS-level source-routing, such as NIRA [33], which allowstub networks greater control over their routes.
Limitations of the study. Our observations may be constrained bya few factors such as the size of our testbed, the coarse granularityof our performance samples, and our limited analysis of resilience.We discuss these issues in detail below.
0
0.5
1
1.5
2
2.5
3
3.5
4
0 10 20 30 40 50 60
Impr
ovem
ent o
ver
mul
tihom
ing
(ms)
Number of overlay nodes
performance difference
Figure 15: Impact of overlay network size on round-trip per-formance: This graph shows the mean difference between 3-overlays and 3-multihoming as overlay nodes are added.
Testbed size.In Figure 15 we compare the average RTT perfor-mance from 3-multihoming against 3-overlays, as a functionof thenumber of intermediate overlay nodes available. The graph showsthe RTT difference between the best 3-overlay path (direct or indi-rect) and best 3-multihoming path, averaged across all measure-ments as nodes are added one-by-one, randomly, to the overlaynetwork. A different heuristic of adding nodes may yield differ-ent results. As the size of the overlay is increased, the performanceof 3-overlays gets better relative to multihoming. Although the rel-ative improvement is marginal, there is no discernible “knee” in thegraph. Therefore it is possible that considering additional overlaynodes may alter the observations in our study in favor of overlayrouting.
Granularity of performance samples.Our performance samples arecollected at fairly coarse timescales (6 minutes intervalsfor round-trip time and 30 minutes for throughput). As a result, our resultsmay not capture very fine-grained changes, if any, in the perfor-mance on the paths, and their effect on either overlay routing ormultihoming route control. However, we believe that our resultscapture much of observable performance differences between thetwo path selection techniques for two key reasons: (1) our conclu-sions are based on data collected continuously over a week-longperiod, and across a fairly large set of paths, and (2) Zhanget al.observed that the “steadiness” of both round-trip time and through-put performance is at least on the order of minutes [34]. Other morerecent measurements of round-trip times on similar paths asthosein our testbed have shown mean intervals of several minutes be-tween changes of 30% or more [4]. As such, we do not expect thata higher sampling frequency would yield significantly different.
Repair and failure detection.Our reliability analysis does not com-pare the relative ability of overlay routing and multihoming to avoidBGP convergence problems. For example, a peering link failuremay affect routing between the peer ISPs until BGP re-converges.It is possible that some multihoming configurations cannot avoidsuch routing failures. We leave this comparison for future work.
8. SUMMARYPast studies have demonstrated the use of overlay routing tomake
better use of the underlying connectivity of the Internet than the
current BGP-based system. However, BGP-based routing can ben-efit from the added capability of two important factors at end-networks:(1) additional access to end-to-end BGP routes via ISP multihom-ing, and (2) implementation of performance- and resilience-awareroute control mechanisms to dynamically select among multipleBGP routes. In this paper, we have compared the relative bene-fits of overlay routing and intelligent route control and investigatedpossible reasons for the differences via an extensive measurement-based analysis. Our findings are as follows:
• Multihoming route control can offer performance similar tooverlay routing. Specifically, overlays employed in conjunc-tion with multihoming to 3 ISPs offer only about 5-15% bet-ter RTTs and 1–10% better throughput than route control inconjunction with multihoming to three ISPs. In fact, whenoverlays are constrained to a single first-hop ISP, they pro-vide inferior performance relative to route control.
• The marginally better RTT performance of overlays comesprimarily from their ability to select shorter end-to-end routes.Also, the performance gap between overlays and route con-trol can be further reduced if, for example, ISPs implementmutually cooperative peering policies such as late-exit.
• While route control cannot offer the near perfect resilience ofoverlays, it can eliminate almost all observed failures on end-to-end paths. The path diversity offered by multihoming canimprove fault tolerance of end-to-end paths by two orders ofmagnitude relative to the direct BGP path.
The results in our paper show that it is not necessary to circum-vent BGP routing to achieve good end-to-end resilience and perfor-mance. These goals can be effectively realized by means of multi-homing coupled with intelligent route control.
AcknowledgmentWe would like to thank Olaf Maennel, Roberto De Prisco, RameshSitaraman and Ravi Sundaram for their support and assistance withour experiments and data collection. We would also like to thankNick Feamster and David Andersen for providing the RON failuredata. Discussions and feedback from the following people havehelped improve this work greatly: David Andersen, Hari Balakr-ishnan, Claudson Bornstein, Nick Feamster, Erich Nahum, VenkatPadmanabhan, Jennifer Rexford, Sambit Sahu and Hui Zhang. Fi-nally, we thank our shepherd, Tom Anderson, and our anonymousreviewers for their valuable feedback and suggestions.
[3] A. Akella, B. Maggs, S. Seshan, A. Shaikh, andR. Sitaraman. A Measurement-Based Analysis ofMultihoming. InProc. of ACM SIGCOMM ’03, Karlsruhe,Germany, August 2003.
[4] A. Akella, S. Seshan, and A. Shaikh. MultihomingPerformance Benefits: An Experimental Evaluation ofPractical Enterprise Strategies. InProc. of the USENIX 2004Annual Technical Conference, Boston, MA, June 2004.
[5] L. Amini, A. Shaikh, and H. Schulzrinne. Issues withInferring Internet Topological Attributes. InProceedings ofSPIE ITCOM, August 2002.
[6] D. Andersen, H. Balakrishnan, M. Kaashoek, and R. Morris.Resilient Overlay Networks. InProc. of the 18th Symposiumon Operating System Principles, Banff, Canada, October2001.
[7] N. Cardwell, S. Savage, and T. Anderson. Modeling TCPLatency. InProc. of IEEE INFOCOM 2000, Tel Aviv, Israel,March 2000.
[8] F5 Networks. BIG-IP link controller.http://www.f5.com/f5products/bigip/LinkController/.
[9] N. Feamster, D. Andersen, H. Balakrishnan, and M. F.Kaashoek. Measuring the Effects of Internet Path Faults onReactive Routing. InProc. of ACM SIGMETRICS 2003, June2003.
[10] N. Feamster, J. Borkenhagen, and J. Rexford. Guidelines forInterdomain Traffic Engineering.ACM SIGCOMMComputer Communication Review, October 2003.
[11] L. Gao. On Inferring Autonomous System Relationships inthe Internet.IEEE/ACM Transactions on Networking, 9(6),December 2001.
[12] L. Gao and F. Wang. The Extent of AS Path Inflation byRouting Policies. InProc. of IEEE GLOBECOM 2002, pages2180–2184, 2002.
[13] F. Guo, J. Chen, W. Li, and T. Chiueh. Experiences inBuilding a Multihoming Load Balancing System. InProceedings of IEEE INFOCOM, Hong Kong, March 2004.to appear.
[14] Y. Hyun, A. Broido, and k claffy. Traceroute and BGP ASPath Incongruities. Technical report, CAIDA, University ofCalifornia, San Diego, 2003.http://www.caida.org/outreach/papers/2003/ASP/.
[15] IETF Traffic Engineering Working Group.http://www.ietf.org/html.charters/tewg-charter.html,2000.
[16] C. Labovitz, A. Ahuja, A. Bose, and F. Jahanian. DelayedInternet routing convergence.IEEE/ACM Transactions onNetworking, 9(3):293–306, June 2001.
[17] Z. Mao, R. Govindan, G. Varghese, and R. Katz. Route FlapDamping Exacerbates Internet Routing Convergence. InProc. of ACM SIGCOMM ’03, Karlsruhe, Germany, August2003.
[18] Z. Mao, J. Rexford, J. Wang, and R. Katz. Towards anAccurate AS-Level Traceroute Tool. InProc. of ACMSIGCOMM ’03, Karlsruhe, Germany, August 2003.
[19] Nortel Networks. Alteon link optimizer.http://www.nortelnetworks.com/products/01/alteon/optimizer/.
[20] W. B. Norton. Internet Service Providers and Peering. InProceedings of NANOG 19, Albuquerque, NM, June 2000.
[22] Y. Rekhter and T. Li. A Border Gateway Protocol 4 (BGP-4).Internet Request for Comments (RFC 1771), March 1995.
[23] M. Roughan, M. Thorup, and Y. Zhang. Traffic Engineeringwith Estimated Traffic Matrices. InInternet MeasurementConference, Miami, FL, November 2003.
[24] RouteScience Technologies, Inc. Routescience PathControl.http://www.routescience.com/products.
[25] S. Savage, A. Collins, E. Hoffman, J. Snell, and T. Anderson.The End-to-End Effects of Internet Path Selection. InProceedings of ACM SIGCOMM, Boston, MA, September1999.
[26] S. Savage et al. Detour: A Case for Informed InternetRouting and Transport.IEEE Micro, 19(1):50–59, 1999.
[27] A. Shaikh, J. Rexford, and K. G. Shin. Load-SensitiveRouting of Long-Lived IP Flows. InProc. of ACMSIGCOMM ’99, Cambridge, MA, September 1999.
[28] N. Spring, R. Mahajan, and T. Anderson. Quantifying theCauses of Internet Path Inflation. InProc. of ACMSIGCOMM ’03, August 2003.
[29] N. Spring, R. Mahajan, and D. Wetherall. Measuring ISPTopologies with Rocketfuel. InProc. of ACM SIGCOMM’02, Pittsburgh, PA, August 2002.
[30] J. W. Stewart.BGP4: Inter-Domain Routing in the Internet.Addison-Wesley, 1999.
[31] L. Subramanian, S. Agarwal, J. Rexford, and R. H. Katz.Characterizing the Internet Hierarchy from Multiple VantagePoints. InProceedings of IEEE INFOCOM, June 2002.
[32] H. Tangmunarunkit, R. Govindan, and S. Shenker. InternetPath Inflation Due to Policy Routing. InSPIE ITCOM,August 2001.
[33] X. Yang. NIRA: A New Internet Routing Architecture. InProc. of the ACM SIGCOMM Workshop on FutureDirections in Network Architecture (FDNA), August 2003.
[34] Y. Zhang, N. Duffield, V. Paxson, and S. Shenker. On theConstancy of Internet Path Properties. InProc. of ACMSIGCOMM Internet Measurement Workshop (IMW),November 2001.