Puin 56 (1904) 117-2% &q ,494 Elsevier Science B.V. All rights reserved 0304-3959/Y4/$07.00 ‘I7 PAIN 024.11 A comparison of pain measurement characteristics of mechanical visual analogue and simple numerical rating scales Donald D. Price ‘I,*, Francis M. Bush “, Stephen Long ” and Stephen W. Harkins ’ lApurtnwrrr.s of ” At~~.srlzcsrolo~~, ” Resrorut~~~ Denfi.~tty uml ’ Gerontology. Mudid ~‘ollegc of’ Virprlrcr. Rdut~or~tl. I 14 _‘.iNS (1 ‘.%A) (Received I1 December 1992, revised I2 July 1993. accepted 3 July 100.7) Summary Numerical rating scales and mechanical visual analogue scales (M-VAS) were compared for their capacity to provide ratio scale measures of experimental pain. Separate estimates of experimental pain sensation intensity and pain unpleasantness were obtained by each method, as were estimates of clinical pain. Orofacial pain patients made numerical scale and VAS ratings in response to noxious thermal stimuli t45-51°C) applied for 5 set to the forearm by a contact thermode. The derived stimulus-response function was well fit as a power function only in the case of sensory M-VAS. The power function derived from sensory M-VAS ratings predicted temperatures chosen as twice as intense as standard temperatures of 47°C and 48°C thereby providing evidence for ratio scale characteristics of M-VAS. The stimulus-response function derived from sensory numerical ratings differed from that obtained with M-VAS and did not provide accurate predictions of temperatures perceived as twice intcnsc as 47°C or 48°C. Both M-VAS and numerical rating scales produced reliably different stimulus response functions for pain sensation intensity as compared to pain unpleasantness and both provided consistent measures of experimental and clinical pain intensity. Finally, both mechanical and pencil-and-paper VAS produced very similiar stimulus-response functions. The ratio scale properties of M-VAS combined with its ease of administration and scoring in clinical settings offer the possibility of a simple yet powerful pain measurement technology in both research and health cart settings. Key words: Mechanical visual analogue scale; Ratio scale; Experimental pain: Clinical pain Introduction Visual analogue scales (VAS) of pain have been demonstrated to be reliable (Price et al. 1983, 1987; Wade et al. 1990) generalizable (Price and Harkins 1987; Harkins et al. 1989) internally consistent mea- sures of clinical and experimental pain sensation inten- sity (Price et al. 1983; Price and Harkins 1987), sepa- rate measures of pain sensation intensity and pain unpleasantness (Price and Harkins 1987, 1992; Price et al. 1987, 1983; Price 1988; Harkins et al. 19891, and relatively sensitive measures of effects of analgesic treatments (Wallenstein et al. 1980; Seymour 1982; * Corresponding crurhort Dr. Donald D. Price. Pain Management Center, MCV Station. Box 516, Medical College of Virginia. Richmond, VA 232YX. USA. Tel.: (804) 786-1984; FAX: (X04) 37 I-0300. SSDl l13~14-3Y5Y(Y3)E(lI4h-~ Price et al. 1985, 1986). Two studies have additionally provided evidence that at least one type of sensory VAS has ratio scale properties (Price et al. 1983: Price and Harkins 1987. 19Y2a). The validation of a pain scale as a ratio scale is extremely important bccausc only ratio scales provide accurate estimates of ratios of pain intensity and percent changes in pain. The ratio scale properties of VAS should not be surprising. since VAS can easily be conceptualized as a form of cross- modality matching in which line length acts as a rcfer- encc continuum to represent perceived intensity (Guil- ford and Dingman 1954; Marks 1974). An important related advantage of VAS is that. unlike whole num- bers and words, they provide an unlimited number of possible responses along a single continuum (Scott and Huskisson 1976). Indeed, VAS ratings of pain sensa- tion intensities evoked by graded intensities of noxious skin temperatures produce stimulus-response curves that are very similiar to those produced by line produc-
Transcript
Puin 56 (1904) 117-2%
&q ,494 Elsevier Science B.V. All rights reserved 0304-3959/Y4/$07.00
‘I7
PAIN 024.11
A comparison of pain measurement characteristics of mechanical visual analogue and simple numerical rating scales
Donald D. Price ‘I,*, Francis M. Bush “, Stephen Long ” and Stephen W. Harkins ’
lApurtnwrrr.s of ” At~~.srlzcsrolo~~, ” Resrorut~~~ Denfi.~tty uml ’ Gerontology. Mudid ~‘ollegc of’ Virprlrcr. Rdut~or~tl. I 14 _‘.iNS (1 ‘.%A)
(Received I1 December 1992, revised I2 July 1993. accepted 3 July 100.7)
Summary Numerical rating scales and mechanical visual analogue scales (M-VAS) were compared for their capacity to provide ratio scale measures of experimental pain. Separate estimates of experimental pain sensation intensity and pain unpleasantness were obtained by each method, as were estimates of clinical pain. Orofacial pain
patients made numerical scale and VAS ratings in response to noxious thermal stimuli t45-51°C) applied for 5 set to the forearm by a contact thermode. The derived stimulus-response function was well fit as a power function only in the case of sensory M-VAS. The power function derived from sensory M-VAS ratings predicted temperatures chosen as twice as intense as standard temperatures of 47°C and 48°C thereby providing evidence for ratio scale characteristics of M-VAS. The stimulus-response function derived from sensory numerical ratings differed from that obtained with M-VAS and did not provide accurate predictions of temperatures perceived as twice intcnsc as 47°C or 48°C. Both M-VAS and numerical rating scales produced reliably different stimulus response functions for pain sensation intensity as compared to pain unpleasantness and both provided consistent measures of experimental and clinical pain intensity. Finally, both mechanical and pencil-and-paper VAS produced very similiar stimulus-response functions. The ratio scale properties of M-VAS combined with its ease of administration and scoring in clinical settings offer the possibility of a simple yet powerful pain measurement technology in both research and health cart settings.
Visual analogue scales (VAS) of pain have been demonstrated to be reliable (Price et al. 1983, 1987; Wade et al. 1990) generalizable (Price and Harkins 1987; Harkins et al. 1989) internally consistent mea- sures of clinical and experimental pain sensation inten- sity (Price et al. 1983; Price and Harkins 1987), sepa- rate measures of pain sensation intensity and pain unpleasantness (Price and Harkins 1987, 1992; Price et al. 1987, 1983; Price 1988; Harkins et al. 19891, and relatively sensitive measures of effects of analgesic treatments (Wallenstein et al. 1980; Seymour 1982;
* Corresponding crurhort Dr. Donald D. Price. Pain Management
Center, MCV Station. Box 516, Medical College of Virginia.
Richmond, VA 232YX. USA. Tel.: (804) 786-1984; FAX: (X04)
37 I-0300.
SSDl l13~14-3Y5Y(Y3)E(lI4h-~
Price et al. 1985, 1986). Two studies have additionally provided evidence that at least one type of sensory VAS has ratio scale properties (Price et al. 1983: Price and Harkins 1987. 19Y2a). The validation of a pain scale as a ratio scale is extremely important bccausc only ratio scales provide accurate estimates of ratios of pain intensity and percent changes in pain. The ratio scale properties of VAS should not be surprising. since VAS can easily be conceptualized as a form of cross- modality matching in which line length acts as a rcfer- encc continuum to represent perceived intensity (Guil- ford and Dingman 1954; Marks 1974). An important related advantage of VAS is that. unlike whole num- bers and words, they provide an unlimited number of possible responses along a single continuum (Scott and Huskisson 1976). Indeed, VAS ratings of pain sensa- tion intensities evoked by graded intensities of noxious skin temperatures produce stimulus-response curves that are very similiar to those produced by line produc-
tion (Price et al. 1983), a form of cross-modality match-
ing known to produce ratio scale judgements (Stevens 1975) and to provide an unlimited number of potential
responses along a single dimension. Importantly. the consistency between line production and VAS results shows that VAS methods arc a variant of cross-modal- ity matching and that no radical biases are introduced
by anchoring each continuum with verbal descriptors indicative of extremes (i.e., no pain sensation, most intense pain sensation imaginable).
However. VAS may have limitations with regard to their use in research and in clinical pain assessment. First, like other scales of pain measurement, the valid- ity of VAS measures may be dependent on the instruc- tions used for patients and subjects (Price et al. 1983; Seymour et al. 1985; Price and Harkins 19X7; Jensen
and Karoly 1992). A second potential and quite serious limitation is that using VAS requires measuring the distance along a horizontal or vertical line, a task that may be time consuming for health care professionals, especially those who must obtain multiple pain ratings several times a day from several patients. Thus, a dilemma may exist that although VAS provides ratio scale measures of pain, the lack of ease in scoring VAS ratings may limit their use in common health care settings.
That simplicity and ease of obtaining pain ratings is an overriding criterion for pain assessment in clinical
settings is attested to by the prevalence with which simple numerical or verbal pain scales arc used to estimate pain intensity. In a recent survey of attitudes and practices of pain measurement at our medical school. 56% of 21X physicians questionned stated that
their preferred method of patient pain rating was sim- ple numerical rating scales (e.g., O-5 or O-10) and 19.5% preferred verbal rating scales. Only 7”; prc- ferred to use VA!? The remaining 17.5? used only behavioral assessment or did not use patient self-rat- ings of pain. An even lower incidence of preference for VAS might be expected in non-academic clinical set- tings.
A resolution of the dilemma might result if simple numerical rating scales could be shown to fulfill most. if not all. of the criteria for ideal pain measurement, including ratio scale characteristics (Gracely and Dub- ner 1981; Price and Harkins 1992), or if VAS could be designed to be approximately as simple to use and score as numerical rating scales. Therefore, the pur- pose of the present study was to explore these two possibilities by examining and comparing the extent to which two types of pain rating scales fulfilled criteria for ideal pain measurement. The first was a simple numerical scale and the second was a mechanical VAS (M-VASJ ’ that provides immediate numerical mea- sures of length on the back of the device. In order to compare the measurement characteristics of both nu-
merical scales and M-VAS, both scalcx wcrc anchors<! by the same verbal descriptors and both were ti- i!’ scales. The methods used to validate ;tnd study these scales were the same as those used previously and
included the use of both experimental and clinical pain (Price et al. 1983; Price and Harkina 1987. 1992).
Several questions guided this analysis. can M-VAS OI simple numerical scales separately measure the sensory
intensity and affective (unpleasantness) dimensions ot pain‘? Arc either or both scales consistent measures oi both experimental and clinical pain’? Does either OI- both types of pain scale provide mcasurcments of per-
ceived magnitude that at least approximate a ratio scale?
Methods
Characteristics of patients and patient groups Two groups of pain patients were studied in these experiments
and each group was used in 1 of 2 experiments. Group I consisted of
23 orofacial pain patients referred to the MCV/VCV temporo-
mandibular joint (TMJJ and Facial Pain Center and diagnosed as
having myofascial pain dysfunction of the TMJ region based on
well-established criteria (Bush et al. 1989). Twenty-one of these
patients were female and the mean age was 38.7 years (+ S.D. = 19.5).
Group 1 patients participated in Exp. 1. Group 2 consisted of IO
chronic pain patients diagnosed as having chronic myofascial pain
related to the upper back, lower back, or shoulder and/or neck.
These patients were referred to the MCV pain managment center.
Six of these patients were female and the mean age was 44.5 years
(*SD. = 21.5). Group 2 patients participated in Exp. 2.
General format of Experiment 1 Following initial evaluation, and subsequent to their diagnosis,
patients were invited to participate in the research study. After the
experimental procedures were described, patients read and signed a
consent form in which they acknowledged that the study had been
explained adequately, that the chance of tissue damage from thermal
stimulation was minimal, and that they were free to withdraw from
the study without effect on their treatment.
Each orofacial pain patient in group I participated in an expcri-
mental session in which 7 intensities of thermal temperature stimuli
(5 set duration) separated by 1°C‘ steps and ranging from 45°C to
.il”c‘ were applied by a contact thermode system in random order to
the ventral forearm. The interstimulus interval was 30-45 set and
multiple spots were used to prevent sensitization or response sup-
pression (Price et al. 1983). Patients rated these stimuli on M-VAS or on numerical rating scales as described below. The same contact
thermode was applied to the forearm and the temperature was
slowly increased (O.S”C/sec) until each patient reported that the
heat pain intensity matched the sensory intensity of their clinical
pain (3 trials). Similiarly, the temperature was slowly increased to a
point where the patient acknowledged that it was twice as intense ds
a standard of 47°C or 48°C (3 trials for each standard). The use ot
the thermodc system and its parameters as well as the procedures of
’ This mechanical VAS was developed by Algometrics. Inc., in which
the first author but not the other authors has a financial interest.
Specific procedures to minimize bias as much as possible are as
specified in Methods.
this psychophysical paradigm have been described in detail (Price et
al. 1983, 1989: Price and Harkins 1987. 1992a).
All of these psychophysical tasks as well as data collection.
coding, and analyses were conducted by two research assistants who
were not aware of the specific hypotheses of the experiment. These
assistants, as well as all patients in the study, were also unaware of
the first author’s financial interest in the M-VAS. All data collected
are presented in this report. Therefore, the only aspects of the study
that could be significantly influenced by the first author’s bias are the
design (as described here) and the intepretation of the results as
presented in the Discussion.
The range of stimulus intensities to be used (45-51°C) was
presented to the forearms of patients in ascending 2°C steps prior to
their formal participation in the study. They were then questioned
about whether they wished to tolerate the full range of stimulus
intensities and whether they wished to continue in the experiment.
All patients acknowledged that they could tolerate the full range of
intensities and in no case was a reluctant participant encouraged to
remain in the experiment. Once patients gave written informed
consent. they practiced rating 4S”C. 47°C. and 50°C (2 trials each)
using the M-VAS or the numerical rating method.
Experimental design and specific procedures of Experi- ment 1
Patients rated randomly presented stimulus intensities on both
sensory and unpleasantness VAS during 1 block of 2X trials (4
trials/stimulus temperature) and rated the same stimulus intensities
on both sensory and unpleasantness numerical scales during a sec-
ond block of 2X trials (4 trials/stimulus temperature). The order in
which the 2 blocks were presented was counterbalanced across the
23 patients. Patients were instructed how to rate both pain sensation
intensity and unpleasantness according to standardized written state-
ments described in detail elsewhere (Price et al. 1983; Price and
Harkins 1987).
To further reinforce the distinction between sensation intensity
and unpleasantness judgments, both intensity and unpleasantness
ratings were obtained at random for 257~ of the stimuli. Only pain
sensation intensity ratings were made on the remaining 75% of
stimuli. As in previous applications of these scaling methods (Price et
al. 1983, 1989; Price and Harkins 1987, 199231, verbal anchors served
to establish the distinction between these two pain dimensions. Both
the M-VAS-sensory and the numerical sensory scale were anchored
by the descriptors “no pain sensation” and “the most intense pain
sensation imaginable”. Likewise, both numeric and M-VAS unpleas-
antness were anchored by the descriptors “not at all unpleasant” and
“the most unpleasant imaginable” in the case of pain-unpleasant-
ness. Both VAS and numerical scales were in units of t)-10 in order
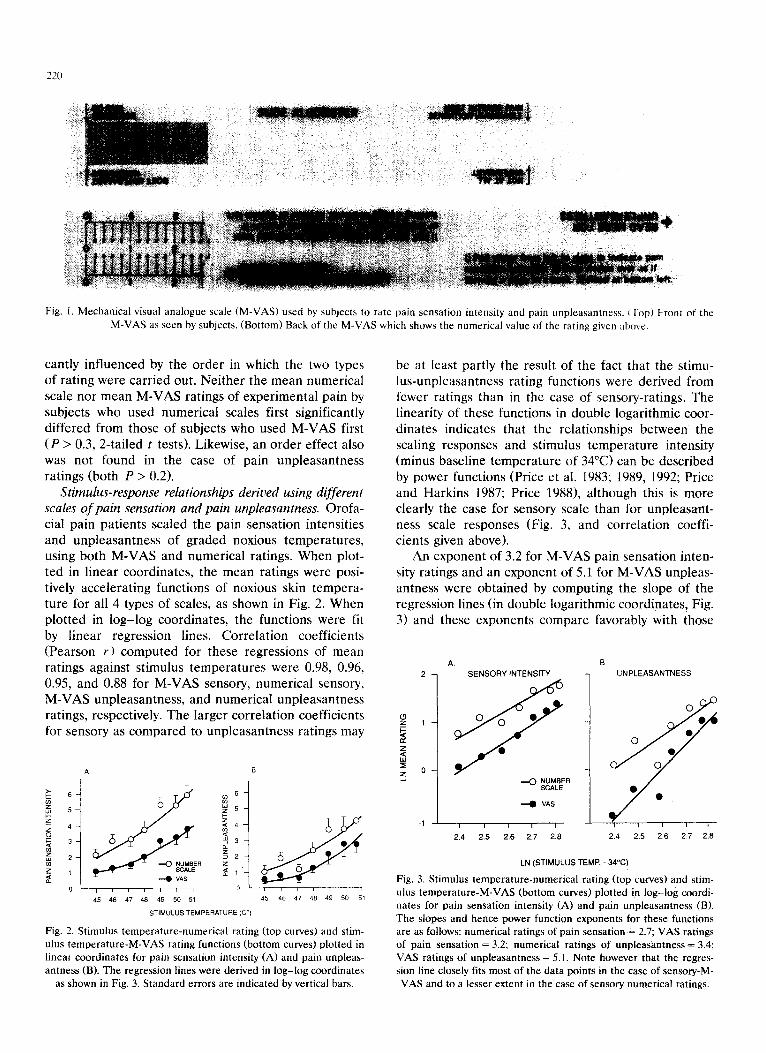
to provide optimum comparisons. However, as shown in Fig. 1, the
M-VAS was a 15cm-length plastic device in which a middle slider
was pulled to the right by the patients. As the slider was pulled to
the right from the left anchor point, a red bar appeared that
indicated perceived intensity (or unpleasantness in the case of affec-
tive VAS) (Fig. If. The numerical scales simply required patients to
state whole numbers from 0 to IO, using the same anchor points of
the M-VAS. Whole numbers between 0 and 10 were used because
this is a common approach used in health care settings.
The procedures for obtaining judgments of ratios of perceived
pain sensation intensity followed precisely those of Price et al.
(1983). First, patients were presented with a standard 5 set stimulus
of 4PC and told that this was a standard stimulus intensity to be
remembered. immediately after this presentation. the tcmpe~ture was increased slowly at 0.5”C/sec from 45°C to a levei that the
patient acknowledged that they perceived as being twice as intense as the standard. Three such trials were carried out for each standard
of 47°C and 4x”C and mean values were computed for each patient.
‘These judgments of ratios of intensity were then statistically com-
pared with those predicted on the basis of derived stimulus-pain
sensation intensity response curves (both M-VAS and numerical).
In order to determine whether M-VAS or numerical scales were
consistent measures of both clinical and experimental pain. the
triangulation procedure of Heft and Gracely (1980). and Gracely
(19791 was carried out. This procedure consists of analysis of 3
response tasks. The first is to derive a stimulus-resp(~ns~ curve
(regression line) based on the type of scale used. The regression lines
were initially derived in double logarithmic coordinates (Fig. 3) and
re-expressed in linear coordinates (Fig. 2). using baseline trmpera-
turr (35°C) for a threshold correction. Baseline temperature was
used because it closely approximates detection threshold for warmth.
The second is to have patients rate their perceived intensity of
clinical pain on the same scale&f used to rate these experim~nt~~l
pain stimuli. The third and final task is to have patients match a
temperature intensity to that of their clinical pain sensation intensity.
This is accomplished by slowly increasing the stimulus tempcraturc
(O.S”C/srcf until the intensity of the pain sensation from the heat
thermode matcher that of thair perceiwd ~r~rmsify of clir~icul pirr (average of 3 trials). The research assistant applied the contact
thermode to the forearm and slowly increased the temper~ltLirc
(O.S”C/secf until patients reported that the temperature-evoked pain
sensation intensity matched that of their clinical pain at its minimum.
usual, or maximum intensity during the past week. Three trial\ were
carried out for each pain level. They also made M-VAS and numeri-
cal ratings of these 3 pain intensities. If patients are judging pain
sensation intensity in an internally consistent manner in all 3 tasks.
then the intersection of their mean scale rating of their clinical pain
intensity (on y axis) and their mean temperature match to their
clinical pain intensity (on X axis) should occur on or very close to
their temperature stimulus-scale response regression line. This test
of internal consistency was separately carried out for both sensory
M-VAS and sensory numerical scales in order to determine whether
either scale provided a c~~rnrn~~n psych(~l~~~icai scale for both clinical
and experimental pain intensity and to determine whether differ-
ences in VAS and numerical ratings of pain applied to both clinical
and experimental pain. This triangulation procedure is feasible for
the sensory, but not the affective dimension of pain. f’atients have
difficulty matching the unpleasantness of experimental pain to that
of clinical pain. quite likely because the contexts and meanings of the
two types of pain are very different (Price and Harkins I9Y2h).
Experiment 2 The aims of Exp. 2 were simply to determine whether the M-VAS
and the pencil-and-paper VAS ratings produced similiar or different
results in response to experimental and clinical pain and to extend
the genera& of our findings in a group of pain patients whose
clinical pain differed from that of the orofacial pain patients in Exp.
I. Using similiar methods as described ahove. Group 7 patients (see
above for characteristics of patients) rated experimental pain and
clinical pain on both pencil-and-paper (first) and mechanical versions
of the same sensory VAS (second) and the triangulation procedure
WBS carried out as described above for orofacial pain patients.
Stimulus intensities presented in random order were 45”(‘, 47°C.
49°C. and 51°C.
Precautions taken to minimize the influence of bias of the first
author were similiar to that of Exp. I. except that only one research
assistant was employed to carry out the procedures.
Results
Experiment I Possible order ejyects. Neither numerical scale ratings
nor M-VAS ratings of experimental pain were signifi-
Fig. 1. Mechanical visual analogue scale CM-VAS) used by subjects to rate pain sensation intensity and pain unpleasantness. (Top) Front of the
M-VAS as seen by subjects. (Bottom) Back of the M-VAS which shows the numerical value of the rating given above.
cantly influenced by the order in which the two types of rating were carried out. Neither the mean numerical scale nor mean M-VAS ratings of experimental pain by subjects who used numerical scales first significantly differed from those of subjects who used M-VAS first (P > 0.3, 2-tailed f tests). Likewise, an order effect also was not found in the case of pain unpleasantness ratings (both P > 0.2).
Stimulus-response relationships derived using different scales of pain sensation and pain unpleasantness. Orofa- cial pain patients scaled the pain sensation intensities and unpleasantness of graded noxious temperatures, using both M-VAS and numerical ratings. When plot- ted in linear coordinates, the mean ratings were posi- tively accelerating functions of noxious skin tempera- ture for all 4 types of scales, as shown in Fig. 2. When plotted in log-log coordinates, the functions were fit by linear regression lines. Correlation coefficients (Pearson r) computed for these regressions of mean ratings against stimulus temperatures were 0.98, 0.96. 0.95, and 0.88 for M-VAS sensory, numerical sensory, M-VAS unpleasantness, and numerical unpleasantness ratings, respectively. The larger correlation coefficients for sensory as compared to unpleasantness ratings may
o- 0’; /,,I /,
45 46 47 48 49 50 51 as 46 47 48 49 50 51
ST,M”L”S TEMPERATURE (CO)
Fig. 2. Stimulus temperature-numerical rating (top curves) and stim-
ulus temperature-M-VAS rating functions (bottom curves) plotted in
linear coordinates for pain sensation intensity (A) and pain unpleas-
antness (B). The regression lines were derived in log-log coordinates
as shown in Fig. 3. Standard errors are indicated by vertical bars.
be at least partly the result of the fact that the stimu- lus-unpleasantness rating functions were derived from fewer ratings than in the case of sensory-ratings. The linearity of these functions in double logarithmic coor- dinates indicates that the relationships between the scaling responses and stimulus temperature intensity (minus baseline temperature of 34°C) can be described by power functions (Price et al. 1983; 1989, 1992; Price and Harkins 1987; Price 1988), although this is more clearly the case for sensory scale than for unpleasant- ness scale responses (Fig. 3, and correlation coeffi- cients given above).
An exponent of 3.2 for M-VAS pain sensation inten- sity ratings and an exponent of 5.1 for M-VAS unpleas- antness were obtained by computing the slope of the regression lines (in double logarithmic coordinates, Fig. 3) and these exponents compare favorably with those
A.
SENSORY INTENSITY
-a VAS
-1 - 2.4 2.5 2.6 2.7 2.6
6.
1 UNPLEASANTNESS
0
*
0 0
0
f
0
l 0
2.4 2.5 2.6 2.7 2.6
LN (STIMULUS TEMP. 34°C)
Fig. 3. Stimulus temperature-numerical rating (top curves) and stim-
ulus temperature-M-VAS (bottom curves) plotted in log-log coordi-
nates for pain sensation intensity (A) and pain unpleasantness (B).
The slopes and hence power function exponents for these functions
are as follows: numerical ratings of pain sensation = 2.7; VAS ratings
of pain sensation = 3.2; numerical ratings of unpleasantness = 3.4;
VAS ratings of unpleasantness = 5.1. Note however that the regres-
sion line closely fits most of the data points in the case of sensory-M- VAS and to a lesser extent in the case of sensory numerical ratings.
derived in previous studies employing contact heat stimuli, standard pencil-and-paper VAS, and the same verbal anchor points as used for these M-VAS (Coghill et al. 1093; Price et al. 198Y). When derived in double iogarithmic coordinates, the slopes of numerical rating functions were 2.7 and 3.4 for pain sensation intensity and unpi~asantness, respectively, and these slopes (power function exponents) are lower than those ob- tained with M-VAS ratings. These distinct differences between power function exponents of M-VAS as com- pared to numerical scale rating functions are consistent with the fact that mean numerical ratings of nocicep- tive temperature stimuli were consistently higher than those of M-VAS ratings (Fig. 2).
To explicitly test potential differences between M- VAS and numerical ratings of experimental pain, each patient’s mean numerical and M-VAS rating of each temperature served as dependent variables in a rc- peated-measures multivariate analysis of variance (MANOVA), with type of rating scale (M-VAS, numer- ical), and stimulus temperature (4S-jl”C) as re-
peated-measures factors. Since very clear and robust differences were observed between sensory and affec- tive stimulus-response functions (cf., Fig. 2) and these expected differences were consistent with several simil- iar previous analyses (Price et al. 19X3. 1987, lY8Y: Harkin et al. 19X9; Douglass et al. lYY2; Coghill et al. lYY3), separate MANOVAs were carried out for sen-
A.
STANDARD
TABLE I
TESTS OF EFFECTS OF TYPE OF PAIN RATING SCALE ON
SENSORY AND AFFECTIVE RATINGS OF EXPERIMENTAL.
PAIN
SUlSO~
Stimulus magnitude 16. 132)
Rating method (I. 23)
Rating method .%’ stimulw
Magnituds
Affwtive
Stimulus magnitude (6, llt3)
Rating method (I. 17)
Stimulus magnitude X
Rating method
F = 54.27 I’ =.. 1).0001
F = 4?.5H F’ c l~.(~ot}i
I.‘= 3.5 I’ - 0.003
p = IO.4 I’ ‘ 0.00(l I p = 20.8 I’ \: 0.0001
p= 1.7h N.S.
svry-VAS and unpleasantness-VAS. The results of these analyses are presented in Table I.
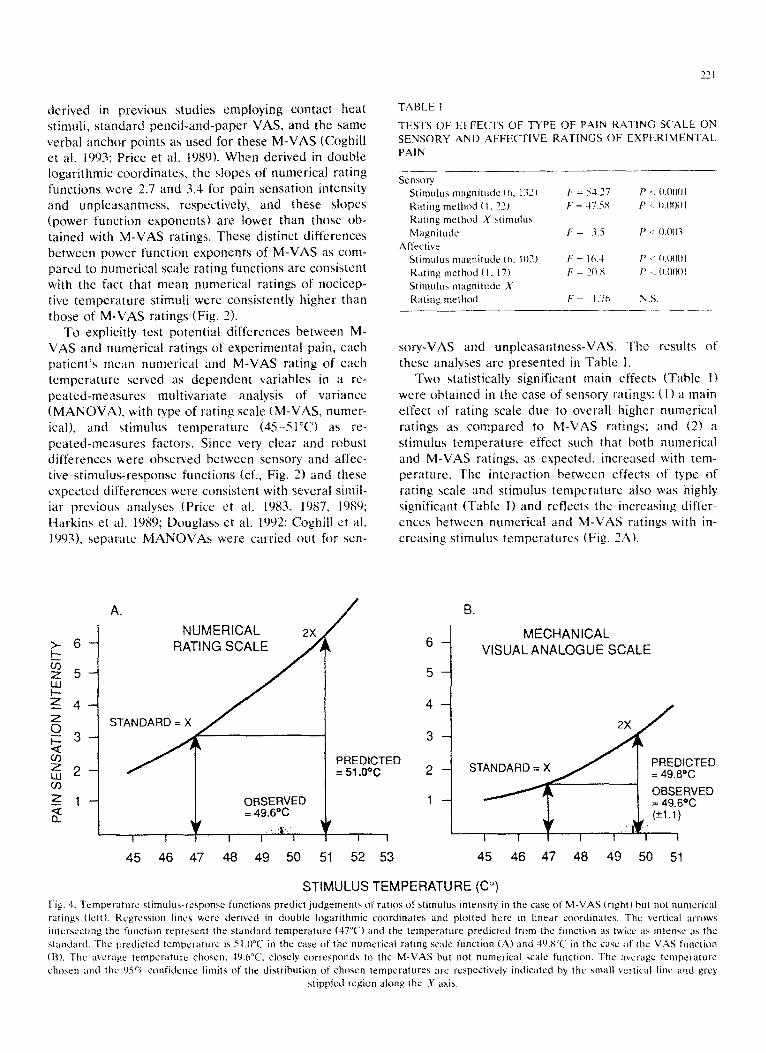
Two statistically significant main effects (Table I) were obtained in the case of sensory ratings: (1) a main effect of rating scale due to overall higher numerical ratings as compared to M-VAS ratings; and 12) a stimulus temperature effect such that both numerical and M-VAS ratings, as expected, increased with tem- perature. The interaction between effects of type of rating scale and stimulus temperature also was highly significant (Table I) and reflects the increasing differ- ences between numerical and M-VAS ratings with in-
a-casing stimulus temperatures (Fig. 7A).
B.
6
i
MECHANICAL VISUALANALOGUE SCALE
E 3-
z
$2 cn
z l-
2 ~~~~R~ED
o,
I I I I 1 I I I I I
45 46 47 48 49 50 51 52 53 45 46 47 48 49 50 51
STIMULUS TEMPERATURE (Co) Fig. 1. Temperature stimuhwresponse functions predict judgemath (II‘ rlitios of stimulus intensity in the case of M-VAS (right) but not numerical
ratings (left). Regression lines were derived in double logarithmic coordinates and plotted hrrc in linrar coordinates. The vertical wrows
intrrsectrng the function represent the standard temperature (47°C) and the trmperature predicted from the function as twcc IIS intrnxc as the
standard. The predicted temperature is Zl.O”C in the case of the numrrical rating scale function (A) and 49.K in the case of the VrZS Iunction
(F3). The avcrape temperature chosen. 4(2.h”C, closely corresponds to the M-VAS but not numerical xalr function. The average temperature
chosen and the Osci confidence limits ot the distribution of chosen temperatures are respectively indicated by the small vertical line and grey
Highly significant main effects of rating scale and stimulus temperature also were obtained in the case of pain unpleasantness ratings (Table I), again reflecting
higher numerical as compared to M-VAS ratings as well as the expected stimulus temperature effect. How- ever, unlike sensory ratings, the interaction term be-
tween stimulus temperature and type of rating scale was not statistically reliable in the case of pain-un- pleasantness ratings (Table I). As can be discerned from Fig. 2B, this lack of interaction is reflected by the nearly parallel stimulus-response curves for numerical and M-VAS ratings.
Tests of ratio scale characteristics of M-VAS and numerical scales. The derived stimulus-response curves for pain sensation intensity were tested in terms of
their ability to predict separate judgments of ratios of pain sensation intensity. All patients chose easily a stimulus temperature that was perceived as twice as intense as the 47°C standard and a stimulus tempera- ture that was perceived as twice as intense as the 48°C standard. As shown in Fig. 4, where the derived stimu- lus-pain sensation intensity curves are compared with mean judgments of ratios of pain sensation intensity. the observed mean temperature that was perceived as
ol / , I * I I , I,
44 45 46 47 48 49 50 51 52
STIMULUS TEMPERATURE (C?)
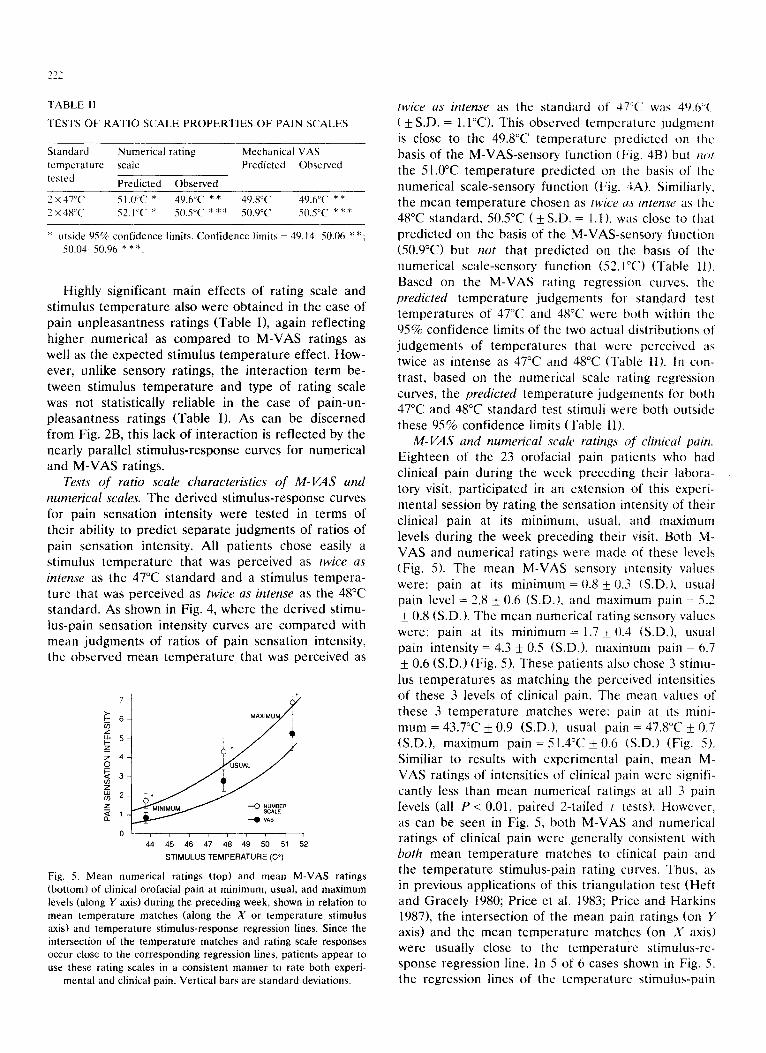
Fig. 5. Mean numerical ratings (top) and mean M-VAS ratings
(bottom) of clinical orofacial pain at minimum, usual, and maximum
levels (along Y axis) during the preceding week, shown in relation to
mean temperature matches (along the X or temperature stimulus axis) and temperature stimulus-response regression lines. Since the
intersection of the temperature matches and rating scale responses
occur close to the corresponding regression lines, patients appear to
use these rating scales in a consistent manner to rate both experi-
mental and clinical pain. Vertical bars are standard deviations.
twice as intense as the standard of’ 37°C’ was 49.h’~ ( + S.D. = l.l’C>. This observed temperature judgment
is close to the 49.8”C temperature predicted on the basis of the M-VAS-sensory function (Fig. 4B) but /LO/ the 51.o”C temperature predicted on the basis of the
numerical scale-sensory function (Fig. 3A). Similiarly, the mean temperature chosen as twice a.\ intense ;LS the 48°C standard, 5OS”C ( f S.D. = 1.1 ), was close to that predicted on the basis of the M-VAS-sensory function (50.9”C) but not that predicted on the basis of the numerical scale-sensory function (52.I”C) (Table 11). Based on the M-VAS rating regression curves. the predicted temperature judgements for standard test temperatures of 47°C and 48°C were both within the 95% confidence limits of the two actual distributions of judgements of temperatures that were perceived as twice as intense as 47°C and 48°C (Table II). In con- trast, based on the numerical scale rating regression curves, the predicted temperature judgements for both 47°C and 48°C standard test stimuli were both outside
these 95% confidence limits (Table II). M-VAS and numerical scale ratings of clinical pain.
Eighteen of the 23 orofacial pain patients who had clinical pain during the week preceding their labora- tory visit, participated in an extension of this experi- mental session by rating the sensation intensity of their clinical pain at its minimum. usual, and maximum levels during the week preceding their visit. Both M- VAS and numerical ratings were made of these levels (Fig. 5). The mean M-VAS sensory intensity values were: pain at its minimum = 0.8 k 0.3 (S.D.), usual pain level = 2.8 + 0.6 (S.D.), and maximum pain = 5.7 i 0.8 (S.D.). The mean numerical rating sensory values
were: pain at its minimum = 1.7 + 0.3 (S.D.), usual pain intensity = 4.3 + 0.5 (S.D.), maximum pain = 6.7 ) 0.6 (S.D.) (Fig. 5). These patients also chose 3 stimu-
lus temperatures as matching the perceived intensities of these 3 levels of clinical pain. The mean values of these 3 temperature matches were: pam at its mini- mum = 43.7”C f 0.9 (S.D.). usual pain = 47.8”C li_ 0.7 (SD.), maximum pain=S1.4”C+O.6 (S.D.) (Fig. 5). Similiar to results with experimental pain, mean M- VAS ratings of intensities of clinical pain were signifi- cantly less than mean numerical ratings at all 3 pain levels (all P < 0.01, paired 2-tailed I tests). However. as can be seen in Fig. 5, both M-VAS and numerical ratings of clinical pain were generally consistent with both mean temperature matches to clinical pain and the temperature stimulus-pain rating curves. Thus, as in previous applications of this triangulation test (Heft and Gracely 1980; Price et al. 1983; Price and Harkins 1987), the intersection of the mean pain ratings (on Y axis) and the mean temperature matches (on X axis) were usually close to the temperature stimulus-re- sponse regression line. In 5 of 6 cases shown in Fig. 5, the regression lines of the tcmperaturc stimulus-pain
;: 2
ii 1 z --0 PENCILAND
d PAPER “AS
45 47 49 51
STIMULUS TEMPERATURE (C”)
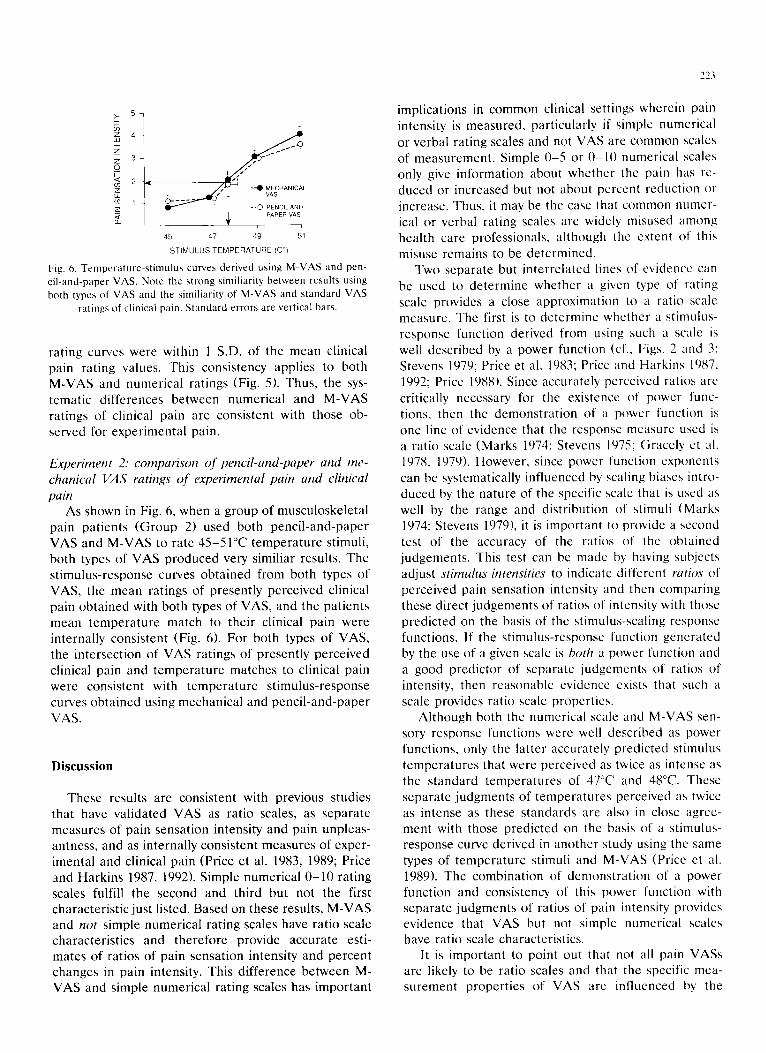
Fig. 6. Temperature-stimulus curves derived using M-VAS and pen-
cil-and-paper VAS. Note the strong similiarity between results using
both types of VAS and the similiarity of M-VAS and standard VAS
ratings of clinical pain, Standard errors are vertical bars.
rating curves were within 1 S.D. of the mean clinical pain rating values. This consistency applies to both M-VAS and numerical ratings (Fig. 5). Thus, the sys- tematic differences between numerical and M-VAS ratings of clinical pain are consistent with those ob- served for experimental pain.
Experiment 2: comparison of pencil-and-paper and me- chanical VAS ratings of experimental pain and clinical pain
As shown in Fig. 6, when a group of musculoskeletal pain patients (Group 2) used both pencil-and-paper VAS and M-VAS to rate 45-51°C temperature stimuli, both types of VAS produced very similiar results. The stimulus-response curves obtained from both types of VAS, the mean ratings of presently perceived clinical pain obtained with both types of VAS, and the patients mean temperature match to their clinical pain were internally consistent (Fig. 6). For both types of VAS, the intersection of VAS ratings of presently perceived clinical pain and temperature matches to clinical pain were consistent with temperature stimulus-response curves obtained using mechanical and pencil-and-paper VAS.
Discussion
These results are consistent with previous studies that have validated VAS as ratio scales, as separate measures of pain sensation intensity and pain unpleas- antness, and as internally consistent measures of exper- imental and clinical pain (Price et al. 1983, 1989; Price and Harkins 1987, 1992). Simple numerical O-10 rating scales fulfill the second and third but not the first characteristic just listed. Based on these results, M-VAS and not simple numerical rating scales have ratio scale characteristics and therefore provide accurate esti- mates of ratios of pain sensation intensity and percent changes in pain intensity. This difference between M- VAS and simple numerical rating scales has important
implications in common clinical settings wherein pain intensity is measured, particularly if simple numerical
or verbal rating scales and not VAS are common scales of measurement. Simple O-S or O-10 numerical scales only give information about whether the pain has re- duced or increased but not about percent reduction or increase. Thus, it may be the case that common numer-
ical or verbal rating scales are widely misused among health care professionals, although the extent of this
misuse remains to be determined. Two separate but interrelated lines of evidence can
bc used to determine whether a given type of rating scale provides a close approximation to a ratio scale measure. The first is to determine whether a stimulus- response function derived from using such a scale is
well described by a power function (cf.. Figs. 2 and 3; Stevens 1979; Price et al. 1983; Price and Harkins 1987. 1992; Price 1988). Since accurately perceived ratios arc
critically necessary for the existence of power func- tions, then the demonstration of a power function is one line of evidence that the response measure used is
a ratio scale (Marks 1974; Stevens 1975; Gracely et al. 1978, 1979). However, since power function exponents can be systematically influenced by scaling biases intro-
duced by the nature of the specific scale that is used as well by the range and distribution of stimuli (Marks 1974; Stevens 19791, it is important to provide a second test of the accuracy of the ratios of the obtained judgements. This test can be made by having subjects adjust stimulus intensities to indicate different ratios of perceived pain sensation intensity and then comparing these direct judgements of ratios of intensity with those predicted on the basis of the stimulus-scaling response functions. If the stimulus-response function generated by the use of a given scale is both a power function and a good predictor of separate judgemcnts of ratios of intensity, then reasonable evidence exists that such a scale provides ratio scale properties.
Although both the numerical scale and M-VAS sen- sory response functions were well described as power functions, only the latter accurately predicted stimulus temperatures that were perceived as twice as intense as the standard temperatures of 47°C and 48°C. These separate judgments of temperatures perceived as twice as intense as these standards are also in close agree- ment with those predicted on the basis of a stimulus- response curve derived in another study using the same types of temperature stimuli and M-VAS (Price ct al. 1989). The combination of demonstration of a power function and consistency of this power function with separate judgments of ratios of pain intensity provides evidence that VAS but not simple numerical scales have ratio scale characteristics.
It is important to point out that not all pain VASs are likely to be ratio scales and that the specific mea- surement properties of VAS are influenced by the
specific words used to anchor the endpoints, by their length, and most critically by the instructions as to how to use them Seymour et al. 1982; Price et al. 19X3. 1989; Jensen and Karoly 1992). For example. power function exponents derived for VAS sensory functions reliably differ from those derived for VAS affective functions because the anchor points differ between these 2 VAS and subjects are well instructed about the difference between these 2 pain dimensions (Price et al. 1983, 1989; Price and Harkins 1987. 1992). How- ever, stimulus-response relationships and power func- tion exponents can even differ within the sensory-dis- criminative domain depending on the words used to anchor the sensory VAS (Price et at. 1983, 1989; Bush- nell and Duncan 1992). In our earlier validation of VAS as ratio scales and in their application in clinical studies, sensory VAS did not use the word “pain” in an attempt to better separate conceptually the sensory and affective aspects of pain experience (Price et al. 1983; Price and Harkins 1987). Consequently. heat stimuli perceived as warm but not painful (such as 43°C and sometimes 45°C) were often rated on the sensory intensity dimension, since they clearly produced de- tectible sensations. More recent studies in our labora- tory and others now use “no pain sensation” and .-the most intense pain sensation imaginable” as verbal an- chors (Price et al. 1989. 1992; Rainville et al. 1992). AS a consequence of this change, lower intensity thermal stimuli, such as 43°C and 45°C are appropriately rated as less intense and the overall stimulus-response func- tion has a steeper slope and hence larger power func- tion exponent (3.2-3.4 for pain sensory VAS as com- pared to 2.1-2.2 for sensory VAS without the word “pain”). Nevertheless, both the earlier and more re- cent versions of these sensory VASs are likely to ap- proximate ratio scales, since stimulus-response func- tions related to both scales accurately predict separate judgements of ratios of intensity. The eariier VAS, which omitted the word “pain” in the verbal anchors, accurately predicts ratios of perceived heat-induced sensation intensity (Price et al. 1983), whereas the presently used VAS accurately predicts ratios of per- ceived pain sensation intensities.
These relatively large power function exponents ob- tained using VAS may seem surprising, since Marks (1974) has shown that power functian exponents de- rived using VAS are approximately one-half that ob- tained using line production or magnitude estimation methods. Presumably~ the verba anchors of VAS have the effect of closing the top end of the scale, which is unlimited in the case of magnitude estimation or line production. The more limited VAS is then claimed to compress the rating values in response to a range of stimulus intensities and thereby lower the derived power function exponent (Marks 1974). However, there well may be exceptions to this general finding. In the
case of contact heat-induced pain, lint production and VAS have been shown to yield the same power furtc- tion exponents (Price et al. 1983). This sim~Ii~lrity may be partly a result of the liklihood that the stimuli presented do not evoke sensations that arc very ~~Iosc to *‘the most intense pain sensation imaginable”. Thus, for the relatively restricted range of stimuli presented in the present and similiar experiments. the top end of the VAS scales may not significantly limrt the obtained ratings. On the other hand, it is quite possible that VAS contain scaling properties near the high end ot the scale that are different than those of line produc- tion and magnitude estimation.
Subjects gave higher numerical ratings than M-VAS ratings to all stimulus intensities used for experimental pain and therefore to a wide range of pain intensities. A related difference is that the stimulus-response func- tions obtained from numerical ratings were less steep than those obtained using M-VA!% when both were compared in double logarithnlic coordinates (Fig. 2). Since the same verbal anchor points were used for both numerical scales and VAS, these differences must be related to differences in scaling responses generated by the type of scale. It appears that it is the influence ot the smaller values chosen with the M-VAS that exag- gerates the slope of the M-VAS regression line in log-log coordinates. The higher ratings and flatter stimulus-response function tin log-log coordinates) in the case of the numerical rating scale appears inte- grally reiated to its lack of ratio scale properties.
One possible basis for the higher rating values in the case of numerical as compared to M-VAS is the well established number preseverence that occurs with nu- merical rating responses (Gracely 1979, 1989; Gracely and Dubner 1981). Such a type of bias would flatten out the stimulus-response curve, since, for a given stimulus within a series of variable intensity stimuli (i.e., 45-51°C) subjects would tend to perservere in using the same number as that used to rate the previ- ous stimulus regardless of whether or not the previous stimulus was less or more intense. An alternative ex- planation for the higher ratings found for the numeri- cal scales is that the categoriai nature of the whole- number rating scale encourages subjects to assign a distinct number to each of the 7 stimuli. While this type of assignment may have resulted in the distribu- tion of the ratings over a larger range of numbers, this categorial and thus arbitrarily linear approach to rating stimuli would reduce the positively accelerating nature of the function in linear coordinates and hence the slope of the log-log function (i.e., the exponent of the power function).
Both mean M-VAS and mean numerical scale rat- ings of 45°C a stimulus level near pain threshold (Price 19881, were above zero (Fig. 2) and therefore may reflect a bias against zero ratings near pain threshold.
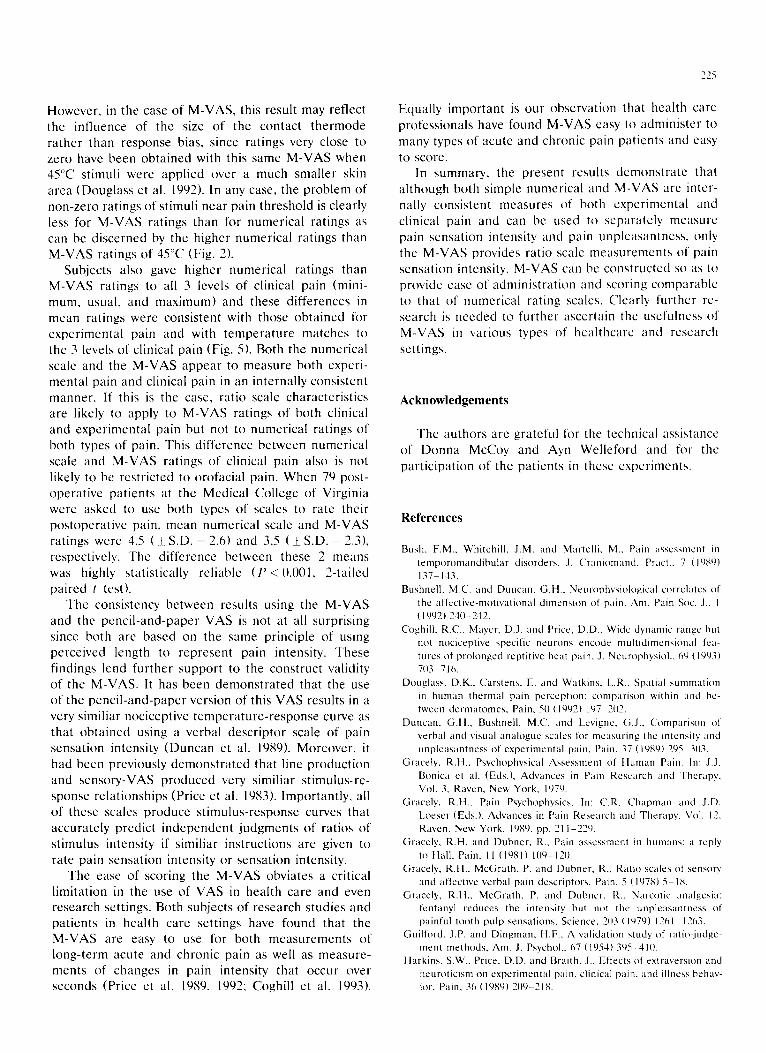
However, in the case of M-VAS, this result may reflect the influence of the size of the contact thermode
rather than response bias. since ratings very close to zero have been obtained with this same M-VAS when 45°C stimuli were applied over a much smaller skin area (Douglass et al. 1992). In any case, the problem of non-zero ratings of stimuli near pain threshold is clearly less for M-VAS ratings than for numerical ratings as can be discerned by the higher numerical ratings than
M-VAS ratings of 45°C (Fig. 2). Subjects also gave higher numerical ratings than
M-VAS ratings to all 3 levels of clinical pain (mini-
mum, usual, and maximum) and these differences in mean ratings were consistent with those obtained for experimental pain and with temperature matches to the 3 levels of clinical pain (Fig. 5). Both the numerical scale and the M-VAS appear to measure both experi- mental pain and clinical pain in an internally consistent
manner. If this is the case, ratio scale characteristics are likely to apply to M-VAS ratings of both clinical and experimental pain but not to numerical ratings of
both types of pain. This difference between numerical scale and M-VAS ratings of clinical pain also is not likely to be rcstrictcd to orofacial pain. When 7Y post- operative patients at the Medical College of Virginia were asked to use both types of scales to rate their postoperative pain, mean numerical scale and M-VAS ratings were 4.5 (+S.D. = 2.6) and 3.5 (&S.D. = 2.3). respectively. The difference between these 2 means was highly statistically reliable (P < 0.001. 2-tailed paired t test).
The consistency between results using the M-VAS and the pencil-and-paper VAS is not at all surprising since both arc based on the same principle of using perceived length to represent pain intensity. These findings lend further support to the construct validity of the M-VAS. It has been demonstrated that the use of the pencil-and-paper version of this VAS results in a very similiar nociceptive temperature-response curve as that obtained using a verbal descriptor scale of pain sensation intensity (Duncan et al. 1989). Moreover, it
had been previously demonstrated that line production and sensory-VAS produced very similiar stimulus-rc- sponse relationships (Price et al. 1983). Importantly. all of these scales produce stimulus-response curves that
accurately predict independent judgments of ratio!, of stimulus intensity if similiar instructions are given to rate pain sensation intensity or sensation intensity.
The ease of scoring the M-VAS obviates a critical limitation in the use of VAS in health care and even research settings. Both subjects of research studies and patients in health care settings have found that the M-VAS are easy to use for both measurements of long-term acute and chronic pain as well as measure- ments of changes in pain intensity that occur over seconds (Price et al. 1989. 1992; Coghill et al. 1993).
Equally important is our observation that health care professionals have found M-VAS easy to administer to
many types of acute and chronic pain patients and easy
to score. In summary, the present results demonstrate that
although both simple numerical and M-VAS are intcr- nally consistent measures of both experimental and clinical pain and can be used to separately measure pain sensation intensity and pain unpleasantness, only the M-VAS provides ratio scale measurements of pain
sensation intensity. M-VAS can be constructed so as to provide ease of administration and scoring comparable to that of numerical rating scales. Clearly further rc- search is needed to further ascertain the uscfulncss of M-VAS in various types of hcalthcarc and rcscarch settings.
Acknowledgements
The authors are grateful for the technical assistance
of Donna McCoy and Ayn Welleford and for the participation of the patients in these expcrimcnts.
References
Bush, F.M.. Whitehill, J.M. and Martelli. M.. Pain aacssmcnt in
t~mporomnndihul~Ir disorders. J. (‘raniomand. Pratt.. 7 (IYXY)
137-143.
Bushnell. M.C. and Duncan. G.H.. Netirophysiologi~~~l corrclatcs ol
the affective-motiv;~tional dimension of pain. Am. Pain Sot. J.. I
( IYY2) 740-132.
Coghill, R.C.. Mayer, D.J. and Price. D.D.. Witle dynamic range hut
not nociceptive specific neurons encode multidimen~ion;II fea-
tures of prolonged rrptitive heat pain. J. Neurophyciol., 6Y (lYY3)
703-716.
Douglass. D.K.. Carstens, E. and Watkins, L.R.. Spatial summation
in human thermal pain perception: comparison within and hc-
twren drrmntomes. Pain, 50 (IYY?) lY7~702.
Duncan. G.f1., Bushnell, M.C. and Lcvigne. (;.J., (‘omparison trt
vcrhal and visual analogue scales for measuring the intensity and
unpleasantness of experimental pain. Pain. 37 (IYXY) 3% 303.
Gracely. R.H.. Psychophysical Assessment of lluman PaIn. In: J.J.
Bonica et al. (Eds.). Advances in Pain Rewarch and Therapy.
Vol. 3. Raven, New York. lY7Y.
Gracely. R.11.. Pain Psychophysics. In: C.R. Chapman and J.D.
Lorser (Eds.). Advances in Pain Research and Therapy. \‘()I. 12.
Raven. New York. IYXY. pp. 21 I-22Y.
Gracely. R.H. and Duhner. R.. Pain asessment in humans: ;I reply
to Ilall. Pain, II (10x1) IO~J~IX).
Gracely. R.H.. McGrath. P. and Duhner. R.. Ratio scales of wnwry
and affective verbal pain descriptor\. Pain. 5 (lY7X) iSIX.
Gracrly, R.11.. McGrath, P. and Duhner. R.. Narcotic an;dgr\ia:
fentanyl reduces the intensity hut not the unpleasantness of