COMMUNITY HEALTH STUDIES VOLUME V, NUMBER 3, 1981 A COMPARISON OF PREMATURE MORTALITY DUE TO CIGARETTE SMOKING AND ROAD CRASHES IN AUSTRALIA Bruce Armstrong and Nicholas de Klerk NH 6 MRC Research Unit in Epidemiology and Preventive Medicine, Department of Medicine, University of Western Australia, Nedlands, 6009. Summary By use of data on smoking induced death in Americans it has been estimated that current levels of cigarette smoking in Australia caused some 10,434 premature deaths in 1978. These deaths represented a total loss of about 156,730 person years of life, of which about 70,005 were lost before the age of 70 years. By way of comparison, in the same year, road crashes caused some 3,728 premature deaths with loss of about 152,211 person years of life in total, or about 123,062 before the age of 70 years. These results illustrate one method of setting priorities for action in preventive medicine. Introduction While, on the personal level, it may be considered that no cost should be spared to prevent even one premature death, such a policy is impractical when the expenditure of limited resources on preventive medicine is being considered. For setting priorities some estimate is required of the size of a health problem which will allow it to be compared with other health problems. Such estimates are often made in terms of the number of deaths due to the problem. However, the degree to which these deaths occur prematurely should also be measured. This may be conveniently summarized as the number of person years of life lost (PYLL) as a result of the cause of death. Alternatively, it may be better to estimate the number of person years of life lost before the age of, say, 70 years [PYLL 70) - on the assumption that 70 years is a reasonable expectation of life and that death after this age is not premature. In addition to premature deaths, the extent of morbidity and disability in life caused by the health problem should be estimated. In some cases, notably congenital abnormalities and disabling disorders arising in the perinatal period [for example, cerebral palsy) this may be far more important than ARMSTRONG & DE KLERK 24 3 premature mortality. Unfortunately it is usually difficult to measure because the data required are unavailable. To illustrate these issues an attempt has been made in this paper to estimate the premature mortality due to cigarette smoking and to compare it with premature mortality due to road crashes. Methods The mortality ratios of cigarette smokers compared with non-smokers (death rate in cigarette smokers divided by the death rate in those who have never smoked regularly) form the basis of this study. Those used were calculated by Hammond from 3-4 years follow-up of 1,067,626 Americans between 1959 and 1963.' Sufficient detail is given in Table 5 of his report to permit estimation of age and sex specific mortality ratios of smokers standardized to the distribution of the numbers of cigarettes smoked per day by smokers in Australia in 1977.2 The categories of amount smoked used by Hammond were 1- 9, 10-19, 20-39 and 40+ cigarettes per day whereas those used in Australia in 1977 were 1-10, 11-20, 21-40 and 41+ per day. While the differences between these categories may appear small they may be quite important because of the tendency for smokers to report their cigarette consumption in multiples of 5 or 10. Their effect would be to produce underestimation of the standardized mortality ratios. Tables of numbers of deaths by cause, age, and sex and the life table of Anstralia in 1978 were obtained from the Australian Bureau of Statistics.3 The number of premature deaths attributable to smoking in 1978 (DA) was estimated for each year of age from 35 years in each sex as follows. D A = D T ~ i+p (6-1) DT is the total number of deaths, p is the COMMUNITY HEALTH STUDIES
Transcript
COMMUNITY HEALTH STUDIES VOLUME V, NUMBER 3, 1981
A COMPARISON OF PREMATURE MORTALITY DUE TO CIGARETTE SMOKING AND ROAD CRASHES IN AUSTRALIA
Bruce Armstrong and Nicholas de Klerk NH 6 MRC Research Unit in Epidemiology and Preventive Medicine, Department of Medicine, University of Western Australia, Nedlands, 6009.
Summary By use of data on smoking induced death in
Americans it has been estimated that current levels of cigarette smoking in Australia caused some 10,434 premature deaths in 1978. These deaths represented a total loss of about 156,730 person years of life, of which about 70,005 were lost before the age of 70 years. By way of comparison, in the same year, road crashes caused some 3,728 premature deaths with loss of about 152,211 person years of life in total, or about 123,062 before the age of 70 years. These results illustrate one method of setting priorities for action in preventive medicine.
Introduction While, on the personal level, it may be
considered that no cost should be spared to prevent even one premature death, such a policy is impractical when the expenditure of limited resources on preventive medicine is being considered. For setting priorities some estimate is required of the size of a health problem which will allow it to be compared with other health problems. Such estimates are often made in terms of the number of deaths due to the problem. However, the degree to wh ich these d e a t h s occur prematurely should also be measured. This may be conveniently summarized a s the number of person years of life lost (PYLL) as a result of the cause of death. Alternatively, it may be better to estimate the number of person years of life lost before the age of, say, 70 years [PYLL 70) - on the assumption that 70 years is a reasonable expectation of life and that death after this age is not premature.
In addition to premature deaths, the extent of morbidity and disability in life caused by the health problem should be estimated. In some cases, notably congenital abnormalities and disabling disorders arising in the perinatal period [for example, cerebral palsy) this may be far more important than
ARMSTRONG & DE KLERK 24 3
premature mortality. Unfortunately it is usually difficult to measure because the data required are unavailable.
To illustrate these issues an attempt has been made in this paper to estimate the premature mortality due to cigarette smoking and to compare it wi th premature mortality due to road crashes.
Methods The mortality ratios of cigarette smokers
compared with non-smokers (death rate in cigarette smokers divided by the death rate in those who have never smoked regularly) form the basis of this study. Those used were calculated by Hammond from 3-4 years follow-up of 1,067,626 Americans between 1959 and 1963.' Sufficient detail is given in Table 5 of his report to permit estimation of age and sex specific mortality ratios of smokers standardized to the distribution of the numbers of cigarettes smoked per day by smokers in Australia in 1977.2 The categories of amount smoked used by Hammond were 1- 9, 10-19, 20-39 and 40+ cigarettes per day whereas those used in Australia in 1977 were 1-10, 11-20, 21-40 and 41+ per day. While the differences between these categories may appear small they may be quite important because of the tendency for smokers to report their cigarette consumption in multiples of 5 or 10. Their effect would be to produce u n d e r e s t i m a t i o n of t h e s t a n d a r d i z e d mortality ratios.
Tables of numbers of deaths by cause, age, and sex and the life table of Anstralia in 1978 were obtained from the Australian Bureau of Statistics.3
T h e n u m b e r of p r e m a t u r e d e a t h s attributable to smoking in 1978 (DA) was estimated for each year of age from 35 years in each sex a s follows.
D A = D T ~ i+p (6-1)
DT is the total number of deaths, p i s the
COMMUNITY HEALTH STUDIES
proportion of smokers a n d e i s the mortality ratio of smokers in the relevant age and sex category (Table 1). This formula follows logically from the standard formula for attributable risk proportion.4 Put more simply, DA is the difference between the number of deaths which actually occurred and the number which would have occurred if the estimated death rate in non-smokers had applied to the whole population. While numbers of deaths were available for single years of age estimates of the mortality ratios and the proportions of smokers were available only for the broad age groups shown in Table 1. The latter were applied, in the calculation, to each age in the relevant range.
c) Deaths in any year of age occurred at the middle of the year;
d) A person “saved” at the middle of a year of age but still dying at that age lives for an additional 1/4 of a year;
e) Deaths after the age of 94 years due to s m o k i n g m a k e n o a p p r e c i a b l e contribution to the total PYLL.
In addition deaths under the age of 1 year were ignored because of the preponderance of perinatal and neonatal causes of death.
Because ratios of mortality from all causes in smokers compared with non-smokers may overestimate the mortality attributable to smoking itself (for example, alcohol consumption with its own attributable mortality is correlated with tobacco smoking)
TABLE 1.
Mortality ratios of smokers to non-smokers and proportions of smokers used in the calculation of estimates of the number of premature deaths attributable to smoking
AGE GROUP MALES FEMALES (years1 Mortality* Proportion of+ Mortality” Proportion of
ratio @) smokers (p) ratio f6) smokers (p) 35-44 45-54 55-64 65-74 75+
* Derived from Hammond’ - for details see text. + Derived from Australian Bureau of Statisticsz.
The PYLL from smoking-caused deaths were calculated by use of methods given by Hakulinen and TeppoS which are derived from Chiang’ss approach to the problem of estimation of death rates following the removal of some but not all causes of death. T h i s i nvo lves t h e a s s u m p t i o n t h a t individuals are subject to independent competing risks of death. The following additional assumptions were made.
a) The average time (t) that a person dying in any [one year) age interval will live in that interval is not altered by elimination of smoking-induced mortality. That is the rate of change of the death rate remains constant although the rate itself may change;
b) The probability of dying before t is the same as the probability of dying after t in the relevant age interval;
ARMSTRONG & DE KLERK 244
estimates were also made of the numbers of premature deaths due to smoking in the categories of cause of death in which the excess deaths in smokers were considered by Doll and Pet07 to be “caused by cigarette smoking” or “probably wholly or partly attributable to smoking”. DA was again calculated for each age except that the mortality ratios used were those derived by Doll and Pet0 from 20 years follow-up from 1951 of 34,440 male British doctors7 adjusted to include, as due to smoking, only the excess deaths in smokers considered by Doll and Pet0 (their Table XIII) as “caused by” or “probably attributable to smoking”. The PYLL as a result of these deaths were calculated as before. It was not possible to standardize the mortality ratios in the British doctors to the distribution of the numbers of cigarettes smoked per day by Australian male
COMMUNITY HEALTH STUDIES
smokers in 1977. 2.2 percent of the corresponding total of
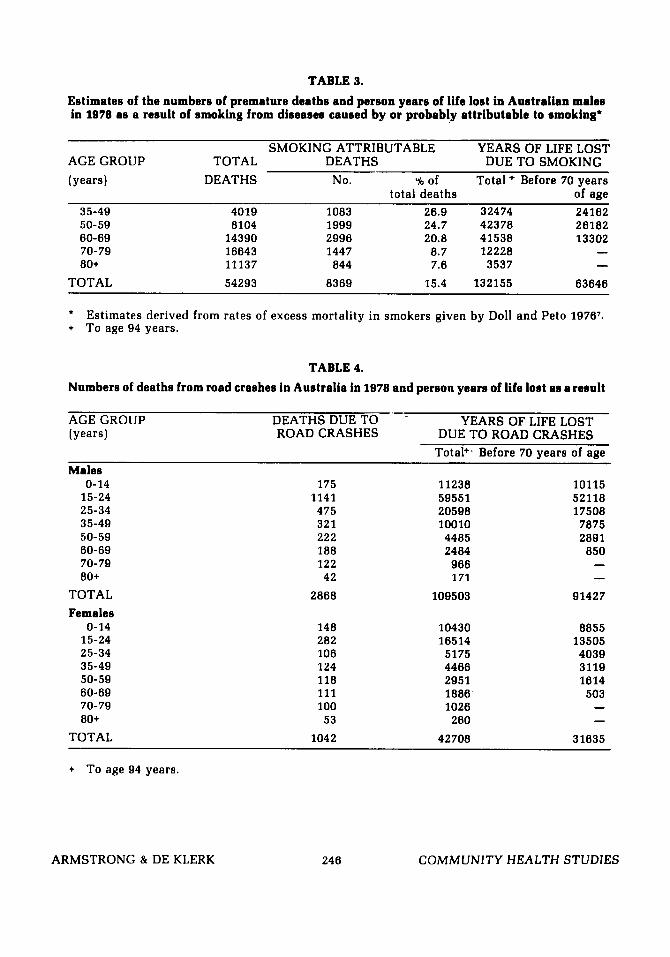
number of deaths attributed to this cause Table 3 shows similar estimates to those of (International Classification of Diseases, 8th Table 2, for men only, based on the rates of revision, rubrics E810 to E819) in the 1978 excess mortality in smokers due to diseases mortality tables. The PYLL were calculated caused by or probably attributable to a s for smoking except that, because numbers smoking reported by Doll and Peto.7The total of deaths were available only in 5-year age of smoking attributable deaths estimated by groups, the additional assumption was made this method, 8,369 was somewhat less than that for each year of age the number of deaths that for men shown in Table 2 (9,378). The from road crashes was in the same proportion estimates of PYLL were also lower. to the 5-year total as the number of deaths Table 4 shows the numbers of deaths from from all causes was to its 5-year total. road crashes in Australia in 1978 and the
For road crashes DA was simply the 251,944 PYLL in women.
TABLE 2.
Estimates of the numbers of premature deaths in Australia in 1978 due to smoking and the corresponding numbers of person years of life lost'
AGE GROUP TOTAL SMOKING ATTRIBUTABLE YEARS OF LIFE LOST (years) DEATHS DEATHS DUE TO SMOKING
No. % of * Total,+ Before 70 years total deaths of age
Estimates derived from mortality ratios of smokers reported by Hammond, 1966l - see text.
Results Table 2 shows estimates, derived from the
data reported by Hammond,' of the numbers of premature deaths in Australia in 1978 due to smoking and the corresponding PYLL. Overall, the total of deaths at 35 years of age and older estimated as attributable to smoking was 10,434 with 156,730 PYLL and 70,005 of these lost before 70 years of age. This last total of 70,005 person years represented 12.5 percent of the total of 515,711 PYLL from all causes of death between the age of 1 and 70 years in males and
corresponding estimates of PYLL. The deaths (3,278 total) were considerably fewer than those attributed to smoking (10,434 at 35 years of age and older). The total PYLL, however, was nearly the same - 156,730 due to smoking and 151,211 due to road crashes. This is not surprising because the deaths from road crashes occur, on average, a t a much younger age than those due to smoking and therefore shorten life to a greater extent. For similar reasons, the PYLL 70 for road crashes (123,062) were greater than those for smoking (70,005). This figure of 123,062
ARMSTRONG & DE KLERK 24 5 COMMUNITY HEALTH STUDIES
TABLE 3.
Estimates of the numbers of premature deaths and person years of life lost in Australian males in 1978 as a result of smoking from diseases caused by or probably attributable to smoking"
SMOKING ATTRIBUTABLE YEARS OF LIFE LOST AGE GROUP TOTAL DEATHS DUE TO SMOKING (years) DEATHS No. Ub of Total + Before 70 years
person years lost by road crash victims represented 17.8 percent of the total lost as a result of death between age 1 and 70 years in males and 12.6 percent of the equivalent total in females.
Discussion A number of caveats must be attached to
these estimates of premature mortality. Firstly, those for smoking are statistically uncertain because they are derived from mortality ratios and prevalence rates of current smoking which are themselves statistically uncertain. Therefore, by chance, the real toll of smoking could be more or less than that estimated. Secondly, the mortality ratios may not correctly reflect the current mortality experience of smokers in Australia. They were derived from the experience of populations in other countries accumulated mainly in the 1960s when the nature of the smoking habit may have been different from what it is now. Changes in the number of cigarettes smoked per day have, as far as possible, been controlled in the analysis but no attempt could be made to control cigarette length, butt length, extent of inhalation and the tar, nicotine, and carbon monoxide delivery of cigarett.es.
The extent of smoking-attributable death in ex-smokers was also not taken into account. To do so would have required assumptions about the extent and duration of prior smoking and the time since giving up which would have been hard to justify. In a similar analysis made in Canada, it was stated that smoking-attributable deaths in ex-smokers were about a quarter of those in continuing smokers.8 The possibility of past heavier smoking, if allowed for, would probably also have increased the estimate of smoking-related deaths. It might reasonably be assumed that smokers are now smoking fewer cigarettes per day than they were 10 to 20 years ago. Mortality was estimated here on the basis of current consumption whereas, at least for some conditions, past consumption l e v e l s m a y h a v e b e e n m o r e v a l i d determinants of the death rate.
Two additional factors which may have led to an underestimate of smoking-attributable deaths are omission of smoking-related deaths in those under 35 years of age (necessary because of the unavailability of estimates of the mortality ratio of smokers of
ARMSTRONG & DE KLERK 24 7
this age] and the absence of any allowance for smoking related deaths in non-smokers. It is probable that few deaths below 35 years of age are due to smoking. For example, in Australia in 1978 there were 11 deaths from lung cancer and 64 deaths from acute myocardial infarction between ages 15 and 34 years, about 9 and 16 of these respectively could reasonably be attributed to smoking. There is, however, a real possibility of smoking-related deaths in non-smokers. Women who have never smoked but are married to men who do, and are therefore exposed passively to cigarette smoke, may have up to twice the expected rate of lung cancer, at least in Greece and Japan.e,10 In addition, perinatal death is more frequent in the infants of smoking mothers than non- smoking mothers. Smoking could have caused as many as 286 perinatal deaths in Australia in 1978 (calculation based on a mortality ratio estimate of 1.26," a 30percent prevalence of current-smoking in pregnant women and a total of 3954 perinatal deaths].
Aspects of the method may also have led to overestimation of the number of deaths attributable to smoking. In using Hammond's data, no allowance was made for the excess deaths in smokers which are not due to smoking but to factors such as alcohol which are correlated with it. The analysis using Doll and Peto's data was undertaken to give an indication of the extent of this problem. The estimate of numbers of deaths attributable to smoking based on these data was 11 percent smaller.
Estimation of the number of smoking- related deaths in women presented a particular problem. The number, 1056, was s m a l l a n d p r o b a b l y a s u b s t a n t i a l underestimate. In 1978 there were 831 deaths from lung cancer in Australian women of which about 600 would be due to smoking: 202 deaths from acute myocardial infarction under 50 years of age with some 150 attributable to smoking;'* 9069 deaths from acute myocardial infarction at older ages with a small proportion at least due to smoking; and 809 deaths due to chronic bronchitis and emphysema with at least half due to smoking. The total of these deaths from the major smoking-related diseases clearly exceeds 1056. The probable reason for underestimation is the fact that women have mainly adopted the habit of cigarette smoking since about 1935 and therefore, at the time of
COMMUNITY HEALTH STUDIES
Hammond’s study, there would have been relatively few who had smoked for longer than about 20 to 25 years.13 It takes, on average, more than 30 to 35 years of smoking for smoking induced cancer to appear (in Australia, the death rate from lung cancer in women did not begin to rise until about 1960).14 Thus the women in Hammond’s study may, at that time, have only just begun to die from smoking related diseases, whereas in Australia now, the effects of smoking in women may be more fully developed.
It is clear that these estimates of smoking- induced premature mortality may be subject to substantial error. Other approaches to their calculation could have been tried but would have been subjec t to s imi la r uncertainty. That they may not be too far from the truth is suggested by the similarity of estimates (in males) derived from two different sets of mortality ratios. In addition, the estimate, based on Hammond’s data, of 9.1 percent of premature mortality between ages 1 and 70 years being due to smoking is similar to an estimate of 8.0 percent made for Canada.8 The Canadian estimate w a s obtained by use of mortality ratios of the main smoking related causes of death considered individually.
The comparison between the premature mortality due to smoking and that due to road crashes illustrates the different inferences which may be drawn depending on the measure of premature mortality which is used. If numbers of deaths are considered, smoking appears to be the greater problem; if total PYLL then they are about the same size: if PYLL 70 then road crashes are the greater problem. These differences come about because the estimates of person years of life lost give greater weight to deaths which occur earlier in life (the peak mortalitv from road
crashes is in those aged 20 to 24 years). This may not be entirely appropriate. For example, is it correct to view a death between 15 and 24 years of age a s more important than one between 35 and 49 years of age? The former leads to loss of more years of life but the person aged between 35 and 49 is more likely to have family and social responsibilities and his or her loss may be more keenly felt than that of the younger person. Smoking is a much more important cause of death at 35 to 49 years of age (and beyond) than are road crashes.
In a complete comparison of the health effects of smoking and road crashes, morbidity would also be considered and, in assessing the total social consequences, damage to property would be taken into account. While it may appear that road crashes would be the greater problem on each count, substantial morbidity and disability are also produced by smoking in the form of non-fatal vascular disease, and acute and chronic respiratory disease.13 Cigarettes are also a substantial cause of property damage through fires although, from United States estimates, it is likely that the cost of this is only a small proportion of the cost of property damage caused by road crashes.ls
The validity of this comparison of the importance of smoking and road crashes as causes of premature death is limited mainly by the uncertainty of the estimates of mortality due to smoking. When other agents of disease are being considered similar or greater uncertainty will generally be present. Nonetheless the exercise is probably worth doing because priorities set on the basis of imperfect estimates of the size of health problems are more likely to be correct than those based on no estimates at all.
References
1. Hammond EC. Smoking in relation to the death rates of one million men and women. Nat Cancer Inst Monograph
2. Australian Bureau of Statistics. Alcohol and tobacco consumption pat terns, February 1977. Catalogue No. 4312.0, A u s t r a l i a n Bureau of S t a t i s t i c s , Canberra, 1978.
1966: 19: 127-204.
ARMSTRONG & DE KLERK 248
3. Australian Bureau of Statistics. Deaths Australia, 1978, Catalogue No. 3302.0, A u s t r a l i a n Bureau of S t a t i s t i c s , Canberra, 1980.
4. Cole P and MacMahon B. Attributable risk percent in case-control studies. Brit J Prev SOC Med 1971: 25: 242-244.
5. Hakulinen T and Teppo L. The increase in working years due to elimination of
COMMUNITY HEALTH STUDIES
cancer as a cause of death, lnt J Cancer
6. Chiang CL. On the probability of death from specific causes in the presence of competing risks, Fourth Berkl Symp
7. Doll R and Pet0 R. Mortality in relation to smoking: 20 years’ observations on male British doctors, Brit Med J 1976: 2: 1525- 1536.
8. Ouellet BL, Romeder JM and Lance JM. Premature mortality attr ibutable to smoking and hazardous drinking in Canada, Am J Epidemiol 1979: 109: 451- 463.
9. Hirayama T. Non-smoking wives of heavy smokers have a higher risk of lung cancer: A study from Japan, Brit Med J
10. Trichopoulos D, Kalandidi A, Sparros L and MacMahon B. Lung cancer and passive smoking, Int J Cancer 1981: 27: 1- 4.
11. Meyer MB. Effects of maternal smoking and alt i tude on birth weight and
1976: 17: 429-435.
1961: 4: 169-180.
1981: 282: 183-185.
ARMSTRONG 81 DE KLERK 249
gestation. In Reed DM and Stanley FJ, The Epidemiology of Prematurity, Urban and Schwarzenberg, Baltimore, 1977: 81- 104.
12. Slone D, Shapiro S, Rosenberg L, et al. Relation of c igare t te smoking to myocardial infarction in young women. New Engl J Med 1978: 298: 1273-1276.
13. Surgeon General of the United States of America. The health consequences of smoking for women - a report of the Surgeon General. US Department of Health and Human Services, Washington 1980.
14. Rohan T and Christie D. Australian lung cancer mortality. Med JAust 1980: 1: 489- 490.
15. Luce BR and Schweitzer SO. Smoking and alcohol abuse: A comparison of their economic copsequences. New Engl J Med 1978: 298: 569-571.
ACKNOWLEDGEMENTS The constructive criticism provided by Dr. J.W. Donovan
and the other referee was greatly appreciated. We take full responsibility, however, for the final text.