A Comparison of Raw-to-Scale Conversion Consistency Between Single- and Multiple-Linking Using a Nonequivalent Groups Anchor Test Design December 2014 Research Report ETS RR–14-13 Jinghua Liu Hongwen Guo Neil J. Dorans
Transcript
A Comparison of Raw-to-Scale ConversionConsistency Between Single- andMultiple-Linking Using a NonequivalentGroups Anchor Test Design
Donald PowersManaging Principal Research Scientist
Gautam PuhanSenior Psychometrician
John SabatiniManaging Principal Research Scientist
Matthias von DavierSenior Research Director
Rebecca ZwickDistinguished Presidential Appointee
PRODUCTION EDITORS
Kim FryerManager, Editing Services
Ayleen StellhornEditor
Since its 1947 founding, ETS has conducted and disseminated scientific research to support its products and services, andto advance the measurement and education fields. In keeping with these goals, ETS is committed to making its researchfreely available to the professional community and to the general public. Published accounts of ETS research, includingpapers in the ETS Research Report series, undergo a formal peer-review process by ETS staff to ensure that they meetestablished scientific and professional standards. All such ETS-conducted peer reviews are in addition to any reviews thatoutside organizations may provide as part of their own publication processes. Peer review notwithstanding, the positionsexpressed in the ETS Research Report series and other published accounts of ETS research are those of the authors andnot necessarily those of the Officers and Trustees of Educational Testing Service.
The Daniel Eignor Editorship is named in honor of Dr. Daniel R. Eignor, who from 2001 until 2011 served the Research andDevelopment division as Editor for the ETS Research Report series. The Eignor Editorship has been created to recognizethe pivotal leadership role that Dr. Eignor played in the research publication process at ETS.
ETS Research Report Series ISSN 2330-8516
R E S E A R C H R E P O R T
A Comparison of Raw-to-Scale Conversion ConsistencyBetween Single- and Multiple-Linking Using a NonequivalentGroups Anchor Test Design
Jinghua Liu,1,2 Hongwen Guo,1 & Neil J. Dorans1
1 Educational Testing Service, Princeton, NJ2 Secondary School Admission Test Board, Princeton, NJ
Maintaining score interchangeability and scale consistency is crucial for any testing programs that administer multiple forms acrossyears. The use of a multiple linking design, which involves equating a new form to multiple old forms and averaging the conversions, hasbeen proposed to control scale drift. However, the use of multiple linking often conflicts with the need for minimizing old item/formexposure and the need for pretesting. This study tried to find a balance point where the needs for equating, item/form exposure andcontrolling, and pretesting can be satisfied. Three equating scenarios were examined using real data: equating to one old form, equatingto two old forms, or equating to three old forms. The finding is that the equating based on one old form produced persistent scoredrift and also showed increased variability in score means and standard deviations over time. In contrast, equating back to two or threeold forms produced much more stable conversions and had less variation. Overall, equating based on multiple linking designs showsthe promise of producing more consistent results and preventing scale drift. We recommend that testing programs and practitionersconsider the use of multiple linking whenever possible.
Keywords Scale drift; raw-to-scale conversion consistency; single linking; multiple linking
doi:10.1002/ets2.12014
For any testing program that administers multiple forms per year across many years, it is crucial to maintain score com-parability and scale consistency. Test score equating is used to adjust for form difficulty differences such that the resultingscores can be used interchangeably. However, the act of equating test scores does not necessarily ensure score interchange-ability. Equating is subject to error: systematic error, random error, or both.
Haberman and Dorans (2011) described conditions that are likely to lead to sound equating: tests are perfectly parallelor nearly so, populations are fairly stable, and equating samples are representative and large enough such that samplingerror is minimal. If all of these conditions are met, measurement is flawless and the score scale can be well-maintained inthis ideal world. However, when these ideal conditions are not met in the real world, error is inevitable, and scale drift isinevitable. As discussed by Kolen (2006, p. 169), “Even though an equating process can maintain the score scale for sometime, the cumulative effects of changes might result in scores at one time being not comparable with scores at a later time.”
One method that has been used for over 60 years to control scale drift is the use of a multiple linking design: a newform is equated back to multiple old forms instead of a single old form, and the final conversion is the average of multipleconversions. Donlon and Angoff (1971) reported that the SAT® test began linking each new form back to two old formsin the mid-1950s in order to control better for scale drift. Harris and Kolen (1994) examined the ACT scale stability byreadministering and re-equating two forms that were previously administered and equated. They found that the raw-to-scale conversions were somewhat different when the same form was equated to different reference forms. They suggestedthat the best procedure might be to combine the results of the two equatings and average the two equating results to obtainthe final conversion.
Kolen and Brennan (2004) provided an analytical explanation, which shows that the random equating error variance ofthe average conversion over two links was less than the equating error variance for either of the individual links. In a laterstudy, Hanson, Harris, and Kolen (1997) used empirical data from ACT Assessment and compared random equating errorvariance when using single versus multiple equating links under the random groups design. The result was consistent with
J. Liu et al. A Comparison of Raw-to-Scale Conversion Consistency
Kolen and Brennan’s example: the equating error variance for averages across links was less than or equal to the equatingerror variance for any of the individual links.
Besides reducing equating error variance, equating based on multiple links is potentially less sensitive to the effects ofold-form scaling. If a new form is equated to a single old form and the old form happens to have a quite high raw-to-scaleconversion, the new form tends to have a high raw-to-scale conversion. Lawrence (1990) found that when a new formis equated to different old forms, the mean difference could be 5 to 10 points on the 200-to-800 SAT scale. Hence, sheproposed to equate a new SAT form to four old forms, a practice which has been employed for SAT equating since 1995.This four-old-form linking plan has been proved effective, producing very stable conversions. Haberman, Guo, Liu, andDorans (2008) examined the consistency of SAT I Reasoning Test raw-to-scale conversions during the period from April1995 to December 2003. They found that the raw-to-scale variability is small. The results strongly suggest that equatinghas been rather effective at reducing the impact on scores of variation in form characteristics, which is precisely thepurpose of equating.
The use of multiple old-form linkings, on the other hand, has its own complications. It requires more old-form expo-sure, which could be a big risk, especially for tests presented on the Internet. If a testing program collects pretest data inoperational administrations, the anchor items needed for the additional equatings could potentially reduce the numberof items that can be pretested, which in turn can cause problems for developing new forms. Hence, the use of multipleold-form linkings to produce more accurate and stable equatings needs to be balanced with the need for pretesting andminimizing the old-form exposure, without compromising the quality of equating.
The purpose of this study is to find a balance point that can accommodate the need for equating, pretesting, and itemexposure control. As SAT equating involves four old forms, it provides us with an opportunity to examine and to comparethe results based on single-, two-, three-, and four-old-form linkings, and to explore their effects in maintaining scaleconsistency. Hence, we use SAT data in this study for illustration purposes.
Data Collection Design
Four-Old-Form Linking Design
Each equating between a new form X and an old form Y has two components: a raw-to-raw equating function and a raw-to-scale scaling function. The first step is to obtain a raw-to-raw equating function, y= e(x), that transforms X-raw-scoreto Y-raw-score. The second step is to convert the equated raw score of X to the reporting scale of Y , through a scalingfunction s(y) that maps the raw scores of Y to the scale. The first step of raw-to-raw equating function and the secondstep of the raw-to-scale scaling function are composed to convert the raw scores of X onto the reporting scale of Y . Thecomposition function, s(x)= s · e(x)= s(e(x)), is called the score conversion function for X (Holland & Dorans, 2006).
As mentioned above, each new SAT form is equated back to four old forms. For each pair of new-form/old-formequating, there is a different raw-to-raw equating function and a raw-to-scale scaling function:
si (x) = si · ei (x) ,
where i= 1, … 4. An average across the four equatings defines the operational conversion,
sfinal (x) =4∑
i=1wisi (x) ,
where wi is the weight assigned to the ith new-form/old-form equating.The data were collected from 44 SAT I Verbal and Mathematics forms administered from March 1995 to December
2003,1 a relatively stable period for SAT during which there was no test redesign. During that period, there were six admin-istrations each year when new forms were administered. We use M1 (Month 1), M2 (Month 2)… , and M6 (Month 6) todesignate different administrations. As mentioned above, each new form was equated to four old forms, and a weightedaverage conversion was created as the final operational conversion. Among the four old forms, one old form was admin-istered to a population that was similar to the new form population in ability. We name this old form “short leg” (SL).The other three old forms are called “long leg” (LL). The test-taking population across theses three LL administrationscomposes the majority of the college bound cohort group. In the following discussion, we use the terms SL, LL1, LL2, andLL3 to designate each of the old forms.
J. Liu et al. A Comparison of Raw-to-Scale Conversion Consistency
Table 1 Linking Design Based on One Old Form
M1 2003 SL
M1 2002 SL
M1 2001 SL
M1 2000 SL
M11999 SL
M11998 SL
M11997 SL
M11996 SL
M11995
M1=month 1; SL= short leg.
We examined different equating scenarios where a new form was equated to one old form, two old forms, or three oldforms. The conversions were compared to the operational conversions that were based on four-old-form equating.
One-Old-Form Linking Design
What would have happened if a new form had been equated to only one old form? In this scenario, we equated each newform X to the corresponding SL only. The old form SL was chosen because the population taking SL is usually similar tothe population taking form X in ability.
Table 1 provides a demonstration of the one-old-form linking design. For example, for forms administered in M1 ineach year, the linking plan works in the following way:
• The starting point is the form administered in M1 of 1995.• The 1995 M1 form became the SL of the 1996 M1 form. The 1996 M1 form was equated back to the 1995 M1 form
only, and the raw-to-scale conversion was derived based on this single link.• The 1996 M1 form became the SL to which the 1997 M1 form was equated. The newly derived conversion for the
1996 M1 form in the above step served as the reference form conversion.• Similarly, the newly derived 1997 M1 conversion served as the reference form conversion when the 1998 M1 form
was equated to the 1997 M1 form, and so on.
Two-Old-Form Linking Design
In this linking scenario, we equated each new form back to two old forms. For each new form X, the corresponding oldform SL was always included for the sake of equating quality and scale stability. The other old form was one of the LLs, andit was alternated across administrations within the year and between years. The rationale for this alternation is to avoidbuilding up certain strains.
Table 2 lists the braiding plan for the two-old-form equating in 1997. As can be seen from Table 2, we started applyingthis plan with the 1997 forms because some old forms were administered 2 years prior. For the new form X that was givenin M1 1997, the old forms were SL1 and LL3. Moving forward, the new form administered in M2 1997 was equated back
J. Liu et al. A Comparison of Raw-to-Scale Conversion Consistency
Table 2 Equating Design Based on Two, Three, and Four Old Forms in 1997
New form Two-old-form linking Three-old-form linking Four-old-form linking
M1 SL1 1/2 SL1 1/2 SL1 1/2LL3 1/2 LL2 1/4 LL1 1/6
LL1 1/4 LL2 1/6LL3 1/6
M2 SL2 1/2 SL2 1/2 SL2 1/2LL2 1/2 LL1 1/4 LL1 1/6
LL3 1/4 LL2 1/6LL3 1/6
M3 SL3 1/2 SL3 1/2 SL3 1/2LL1 1/2 LL3 1/4 LL1 1/6
LL2 1/4 LL2 1/6LL3 1/6
M4 SL4 1/2 SL4 1/2 SL4 1/2LL3 1/2 LL2 1/4 LL1 1/6
LL1 1/4 LL2 1/6LL3 1/6
M5 SL5 1/2 SL5 1/2 SL5 1/2LL2 1/2 LL1 1/4 LL1 1/6
LL3 1/4 LL2 1/6LL3 1/6
M6 SL6 1/2 SL6 1/2 SL6 1/2LL1 1/2 LL3 1/4 LL1 1/6
LL2 1/4 LL2 1/6LL3 1/6
M=month; LL= long leg; SL= short leg.
to old forms SL2 and LL2, and the new form administered in M3 1997 was equated to old forms SL3 and LL1. Note thethree long legs LL3, LL2, and LL1, finished one cycle across these three administrations. Another rotation of long legsLL3-2-1 started with the M4 1997 form and ended with the M6 1997 form. In the final conversion, the SL and the LL wereeach weighted 50%.
Three-Old-Form Linking Design
In the scenario of three-old-form linking design, each new form was equated back to three old forms. Again, one of theold forms was the corresponding SL, and the two LLs were the ones that were not used in the two-old-form equating forthat particular form. For the form that was administered in M1 of 1997, LL1 and LL2 were used because LL3 was usedin the two-old-form equating. Similarly, LL1 and LL3 were used to equate the M2 form, and LL3 and LL2 were used toequate the M3 form. The SL conversion was weighted 50%, and each of the LL conversions was weighted 25%. The patternwas repeated with the M4, M5, and M6 forms.
The rotation is not only alternated within a year, but also across years. In 1998, we started with LL2 in the M1 admin-istration for the two-old-form equating plan. LL1 moved up for M2, and LL3 shifted down for M3. So the LL pattern wasLL2-1-3. In 1999, the pattern was LL1-3-2. The three-old-form linking design alternated correspondingly as well.
Comparison Indexes
As the four-old-form linking plan has been proved effective, producing very stable conversions (Haberman et al., 2008),and our purpose is to find out a way to balance the equating needs and needs for pretesting and/or minimizing old-formexposure, we use the operational conversions that are based on the four-old-form equating as the criterion.
Difference Plots of Conversions
The difference plot, newly derived conversions based on one-, two- or three-old-form equatings minus the operationalconversions based on four-old-form equating, is the most direct means of assessing conversion difference. At each scorepoint level, the new conversion is compared to the criterion.
J. Liu et al. A Comparison of Raw-to-Scale Conversion Consistency
Differences in Means and Standard Deviations
We also compute average scores that were obtained from use of the four-old-form conversion versus average scores thatwould have been obtained from use of the one-, two-, and three-old-form conversions, respectively, as well as the differencein these score standard deviations.
Difference That Matters (DTM)
To evaluate the relative magnitude of a difference in score conversions, we adopted the notion of score differences thatmatter (DTM), proposed by Dorans and Feigenbaum (1994). In this study, the DTM was defined as 5 scaled score points,which is half of the SAT score unit. Note that this difference is best thought of as an indifference threshold. Any differencesless than the DTM are considered not big enough to warrant any concern, as they are smaller than the smallest differencethat might actually matter.
Results
In this section, we present the results by first showing the difference in conversions between each pair of one- versus four-old-form equating, two- versus four-old-form equating, and three- versus four-old-form equating. We then summarizethe mean differences based on different numbers of old-form equating. As there is a very similar pattern between Verbaland Math results, we only present the Verbal results in this section.
Difference Plots of Conversions
One- Versus Four-Old-Form Equating
The differences of raw-to-scale conversions between the one-old-form equating and four-old-form equating are examinedfor each strain of the six administrations (e.g., in the strain of M1/M2/… /M6 administrations) from 1996 to 2003.
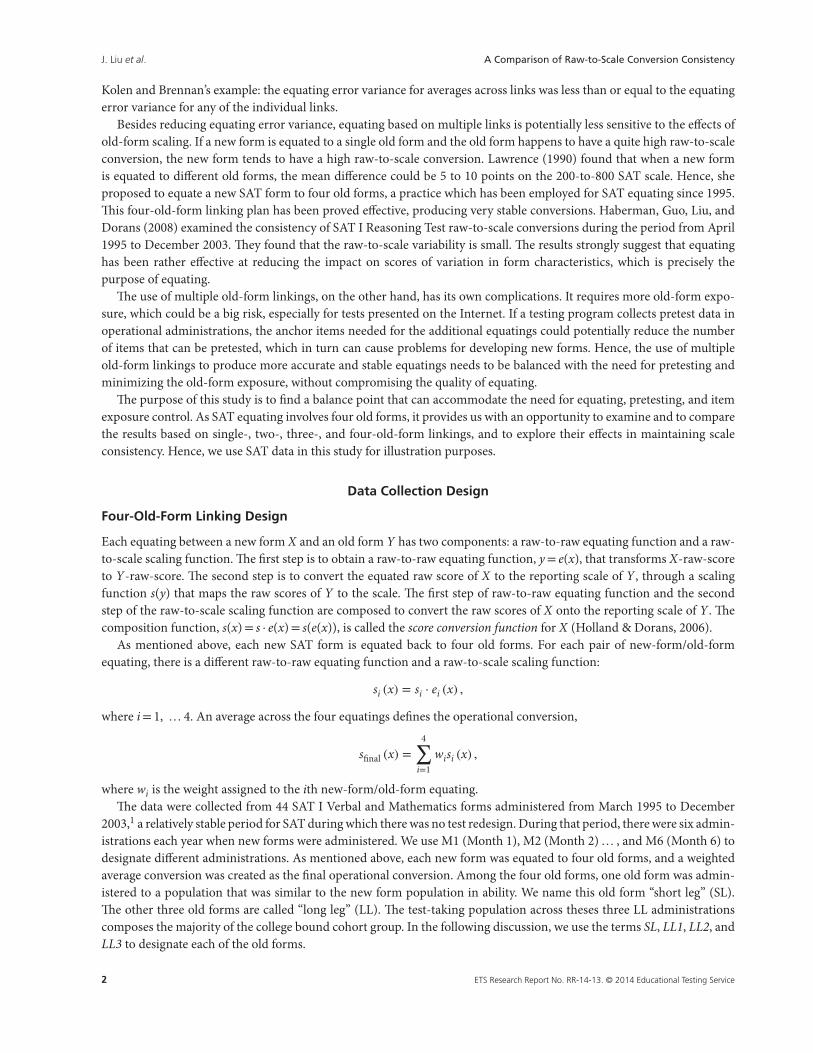
Figure 1 is the difference plot of raw-to-scale conversions between one-old-form equating and four-old-form equatingacross all the M2 forms. The 1996 M2 form raw-to-scale conversion based on one-old-form equating was very close tothe actual conversion that was based on the four-old-form equating, as the difference plot was intertwining with the zeroline. The largest difference was smaller than 2, well below the DTM threshold of 5.
Moving forward, the raw-to-scale conversion for the 1997 M2 form based on one-old-form equating started to deviatemore from the operational conversion derived from the four-old-form equating, although the difference was still not quiteobvious. As mentioned above, the 1997 M2 one-old-form equating used the conversion based on 1996 M2 one-old-formequating. If we consider the 1995 M2 form as the starting point, then the 1996 M2 form equating involved one intermediateequating (from 1995), whereas the 1997 M2 form equating had two intermediate equatings involved (from 1995 and 1996).When increasing numbers of intermediate equatings were involved, it can be observed that the differences tended to getlarger and larger. Not surprisingly, the largest differences occurred for 2003, where the differences were approaching 30points at the top and bottom of the scale range, and were larger than DTM across virtually the entire scale range.
Two- Versus Four-Old-Form Equating
Figure 2 shows the differences of raw-to-scale conversions between two-old-form equating and four-old-form equatingacross all the M2 forms. Comparing to Figure 1, the score drift due to the intermediate equating effects was dramaticallyreduced: the largest differences were around the extremes of the scale, yet they did not exceed ±10 points. In the middleof the scale, the differences were not larger than the DTM. Although the 2003 M2 form still deviated a little further thanthe 1997 M2 form did, the difference is no longer that obvious.
Three- Versus Four-Old-Form Equating
The difference plots between three-old-form equating and four-old-form equating are shown in Figure 3. With this com-parison, the biggest differences over the tails did not even exceed the DTM threshold. Across the majority of the scalerange, all the difference lines are on the top of each other. The score drifting trend is almost diminished.
J. Liu et al. A Comparison of Raw-to-Scale Conversion Consistency
Figure 3 Month 2 (M2) conversion difference between the three- and four-old-form equatings for SAT I Verbal scores.
The results for other strains (M3, M4, M5, and M6 forms) exhibited a similar pattern. Among the three equatingscenarios, the one-old-form equating produced the most different results from the criterion, whereas the three-old-formequating produced the most similar conversions.
Difference in Scaled Score Means and Standard Deviations
We also calculated the means and standard deviations for each administration based on one-, two-, and three-old-formequatings, and calculated the mean and standard deviation differences from the four-old-form equating.
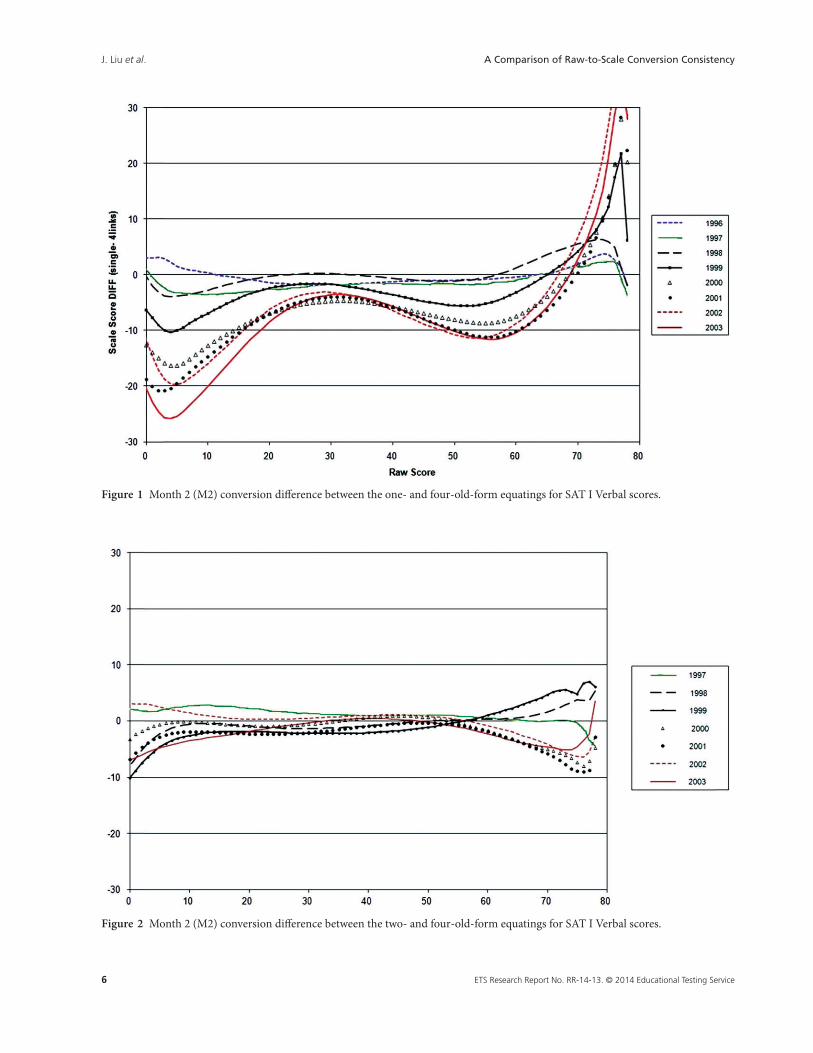
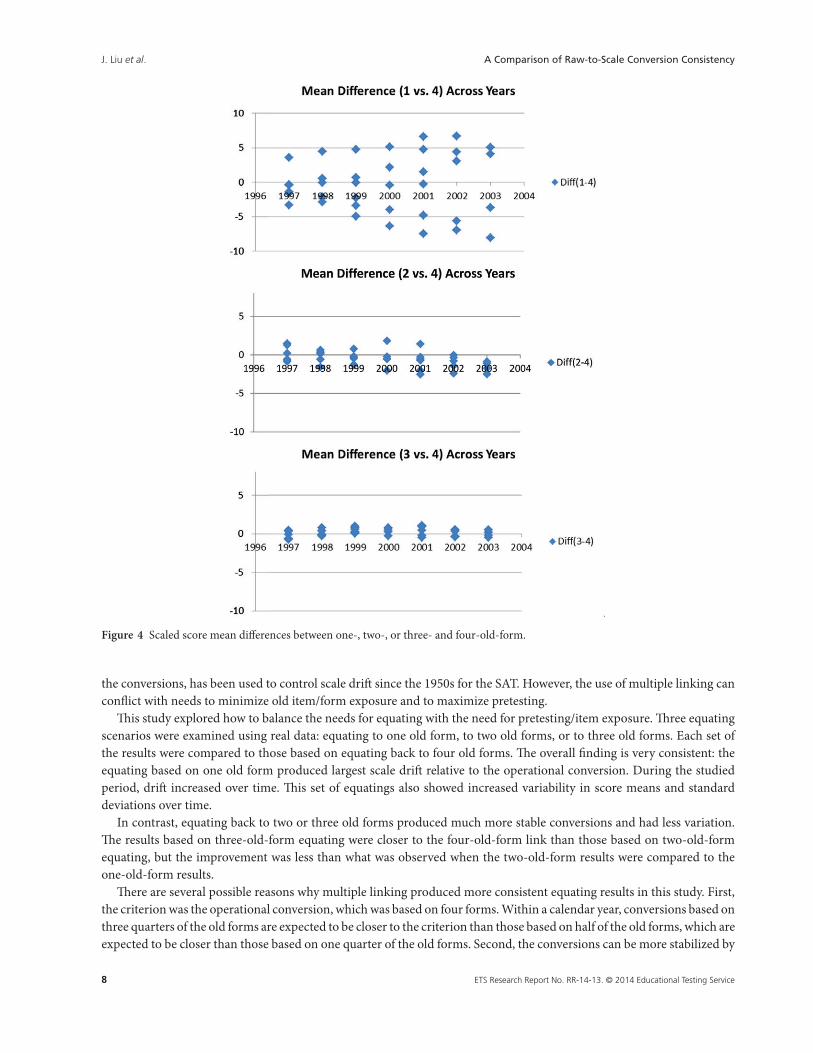
Figure 4 illustrates each set of differences. The mean differences between the one- and four-old-form equatings, inthe top panel of Figure 4, ranged from −4 to +4 in 1997. Moving forward, the differences have been increasing, with themean differences reaching±8 points in 2002 and 2003. The variability of the mean differences in each set of administrationmonth is relatively large as well.
The mean differences between the two- and four-old-form equatings, shown in the middle panel of Figure 4, weremuch smaller. Most of the differences were confined within the −2 to +2 point range across the 7 years. The variability ofthe mean differences in each strain of administration month is much smaller as well.
The bottom panel of Figure 4 depicts the mean differences between the three- and four-old-form equatings. As it can beseen, the scaled score mean differences were the smallest, most of which were within −1 to +1 point range. The variabilityof the mean differences in each administration month is even smaller.
Figure 5 depicts the standard deviation differences. A very similar pattern is observed: the differences between theone- and four-old-form equatings were the largest among the three sets of comparisons, and the differences between thethree- and four-old-form equatings were the relative smallest. In general, the differences tended to get larger over time.The positive differences observed for both the two- and three-old-form differences in 2003 are worthy of investigationand suggest a potential bias that may increase with each additional testing year.
Discussion
Maintaining score interchangeability and scale consistency is crucial for any testing program that administers multipleforms across years. The use of a multiple linking design, which equates a new form to multiple old forms and averages
J. Liu et al. A Comparison of Raw-to-Scale Conversion Consistency
Figure 4 Scaled score mean differences between one-, two-, or three- and four-old-form.
the conversions, has been used to control scale drift since the 1950s for the SAT. However, the use of multiple linking canconflict with needs to minimize old item/form exposure and to maximize pretesting.
This study explored how to balance the needs for equating with the need for pretesting/item exposure. Three equatingscenarios were examined using real data: equating to one old form, to two old forms, or to three old forms. Each set ofthe results were compared to those based on equating back to four old forms. The overall finding is very consistent: theequating based on one old form produced largest scale drift relative to the operational conversion. During the studiedperiod, drift increased over time. This set of equatings also showed increased variability in score means and standarddeviations over time.
In contrast, equating back to two or three old forms produced much more stable conversions and had less variation.The results based on three-old-form equating were closer to the four-old-form link than those based on two-old-formequating, but the improvement was less than what was observed when the two-old-form results were compared to theone-old-form results.
There are several possible reasons why multiple linking produced more consistent equating results in this study. First,the criterion was the operational conversion, which was based on four forms. Within a calendar year, conversions based onthree quarters of the old forms are expected to be closer to the criterion than those based on half of the old forms, which areexpected to be closer than those based on one quarter of the old forms. Second, the conversions can be more stabilized by
J. Liu et al. A Comparison of Raw-to-Scale Conversion Consistency
Figure 5 Scaled score standard deviation difference between one-, two-, or three- and four-old-form.
averaging multiple conversions, which can minimize the old-form scaling effects in case a particular old-form conversionis an extreme (too high or too low). Third, the multiple linking design can slow down the process of accumulating equatingerror and building of equating bias in one direction (Guo, 2010; Haberman & Dorans, 2011). Furthermore, having morethan one link for a new form safeguards against a problematic equating: the problematic equating can be downweighted(even given zero weight) in the final conversion if there is sound reason to question the old-form scaling, which can reducethe effect of bias due to one link (Hanson et al., 1997). As multiple links are employed, the occurrence of aberrant old-formscaling decreases.
Overall, equatings based on multiple linking designs produce more consistent results and prevent scale drift. Werecommend that testing programs and practitioners consider the use of multiple linking whenever possible. In termsof how many old-form equatings should be adapted, it depends on the program needs, the minimum requirementfor equating accuracy and scale stability, the test security situation, and so on. We suggest that a new form should beequated to at least two old forms. This procedure should prevent scale drift and reduce the score variability effectivelyacross administrations. As indicated in this study and by Haberman and Dorans (2011), the need for multiple linkageincreases as the number of test administrations increases, because under such circumstances, scale drift may occureven when optimal equating conditions are met (e.g., similar populations, high anchor-total correlation, and tight testspecifications).
J. Liu et al. A Comparison of Raw-to-Scale Conversion Consistency
There are certain limitations in this study. The criterion we used is the actual operational conversion that wasderived based on the four-old-form equating, which means that the results for each of the alternative equating methods(two-old-form, three-old-form, and four-old-form) looked better than they would, had we employed independentold-form links. A better design that could avoid the overlap dependency problem in the SAT case, for example, couldtake the following steps. First, find a form X that was originally administered in year t, and readminister this formlater, say, in year t + 5. Re-equate the old form X, and derive a new raw-to-scale conversion S(t + 5) : 4, where number“4” indicates that it is a four-old-form linking plan. Compare the new conversion to the original conversion thatwas obtained in year t, St , and the difference of S(t + 5) : 4 − St , indicates the scale drift that occurred during the 5-yearperiod.
The second step is to apply a different equating scenario. For example, how much scale drift would have occurred ifa new form had only been equated to one old form? We can employ the same one-old-form linking design used in thisstudy and re-equate all the forms during this period. New conversions will be developed for each form and eventuallyfor the readministered form X. We name this new conversion S(t + 5) : 1, where number “1” indicates that it is a one-old-form linking plan. If the scale drift of S(t + 5) : 4 − St is smaller than the scale drift of S(t + 5) : 1 − St , then this is direct andquantified evidence that multiple linking can more effectively control scale drift. Similarly, the scale drift based on two- orthree-old-form equatings can be estimated and compared to the scale drift based on four-old-form equating. This designcould avoid the overlap dependency problem.
In summary, depending on the program needs, a multiple linking design that can maintain scale consistency and con-trol scale drift reasonably well while minimizing form/item exposure and satisfying pretesting needs should be consideredfor operational use.
Notes
1 During the studied period from March 1995 to December 2003, there were four administrations where reprints wereadministered instead of new forms. Therefore, the total number of forms was 44 rather than 48.
References
Donlon, T. F. & Angoff, W. H. (1971). The scholastic aptitude test. In W. H. Angoff (Ed.), The College Board Admissions Testing Program:A technical report on research and development activities relating to the Scholastic Aptitude Test and Achievement Tests (pp. 15–47).Princeton, NJ: Educational Testing Service.
Dorans, N. J., & Feigenbaum, M. D. (1994). Equating issues engendered by changes to the SAT and PSAT/NMSQT (Research Memoran-dum No. RM-94-10). Princeton, NJ: Educational Testing Service.
Guo, H. (2010). Accumulative equating errors after a chain of linear equatings. Psychometrika, 75, 438–453.Haberman, S., & Dorans, N. J. (2011). Sources of score scale inconsistency (Research Report No. RR-11-10). Princeton, NJ: Educational
Testing Service.Haberman, S. J., Guo, H., Liu, J., & Dorans, N. J. (2008). Consistency of SAT I Reasoning Test score conversions (Research Report No.
RR-08-67). Princeton, NJ: Educational Testing Service.Hanson, B., Harris, D., & Kolen, M. (1997, March). A comparison of single- and multiple-linking in equipercentile equating with random
groups. Paper presented at the annual meeting of the American Educational Research Association, Chicago, IL.Harris, D., & Kolen, M. (1994, April). Stability checks in random groups equating. Paper presented at the annual meeting of the American
Educational Research Association, New Orleans, LA.Holland, P. & Dorans, N. (2006). Linking and equating. In R. L. Brennan (Ed.), Educational measurement (4th ed., pp. 155–185).
Westport, CT: Preager.Kolen, M. (2006). Scaling and norming. In R. L. Brennan (Ed.), Educational measurement (4th ed., pp. 221–256). Westport, CT: Praeger.Kolen, M. & Brennan, R. (2004). Test equating, scaling, and linking (2nd ed.). New York, NY: Springer-Verlag.Lawrence, I. (1990). SAT equating plans for 1991-92 and 1992-93. (Unpublished manuscript).Liu, J., Guo, H., & Dorans, N. (2014). A comparison of raw-to-scale conversion consistency between single- and multiple-linking
using a nonequivalent groups anchor test design (Research Report No. RR-14-13). Princeton, NJ: Educational Testing Service.doi: 10.1002/ets2.12014
J. Liu et al. A Comparison of Raw-to-Scale Conversion Consistency
Suggested citation:
Liu, J., Guo, H., & Dorans, N. (2014). A comparison of raw-to-scale conversion consistency between single- and multiple-linkingusing a nonequivalent groups anchor test design (Research Report No. RR-14-13). Princeton, NJ: Educational Testing Service.doi:10.1002/ets2.12014
Action Editor: Gautam Puhan
Reviewers: Nuo Xi and Hyeon-Joo Oh
ETS, the ETS logo, and LISTENING. LEARNING. LEADING. are registered trademarks of Educational Testing Service (ETS). SAT is aregistered trademark of the College Board. All other trademarks are property of their respective owners.
Find other ETS-published reports by searching the ETS ReSEARCHER database at http://search.ets.org/researcher/