A Comparison of Screen/Film and Digital Imaging: Image Processing, Image Quality, and Dose Ralph Schaetzing, Ph.D. Agfa Corporation Greenville, SC AAPM 2005-Continuing Education Course in Radiographic and Fluoroscopy Physics and Technology
Transcript
A Comparison of Screen/Film and Digital Imaging: Image Processing, Image Quality, and Dose
Ralph Schaetzing, Ph.D.Agfa Corporation
Greenville, SC
AAPM 2005-Continuing Education Course inRadiographic and Fluoroscopy Physics and Technology
1
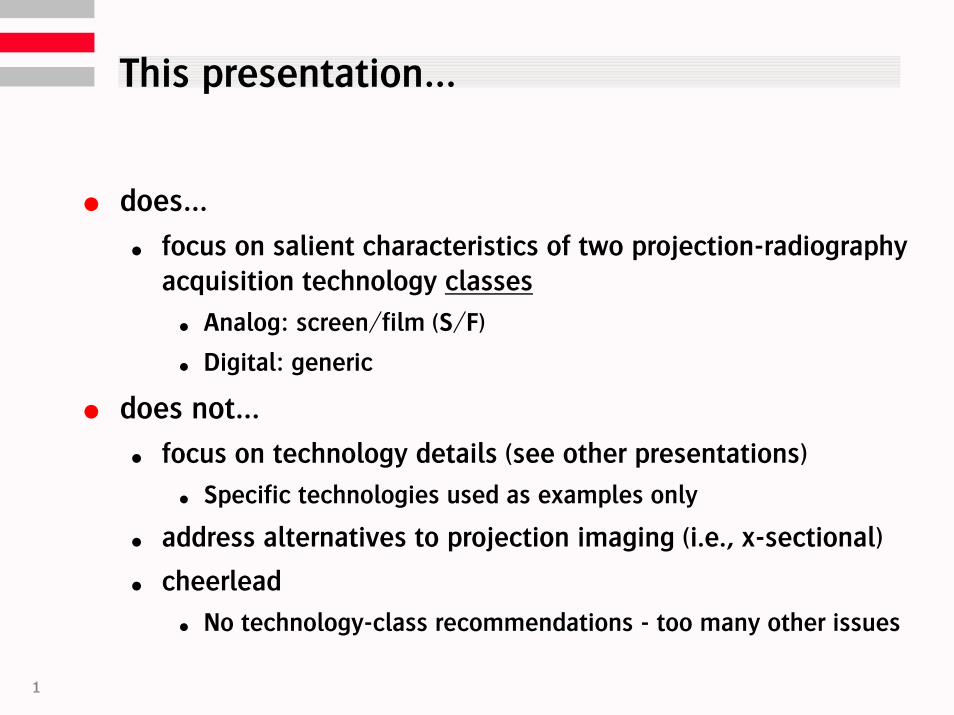
This presentation…
does…
focus on salient characteristics of two projection-radiography acquisition technology classes
Analog: screen/film (S/F)
Digital: generic
does not…
focus on technology details (see other presentations)
Specific technologies used as examples only
address alternatives to projection imaging (i.e., x-sectional)
cheerlead
No technology-class recommendations - too many other issues
2
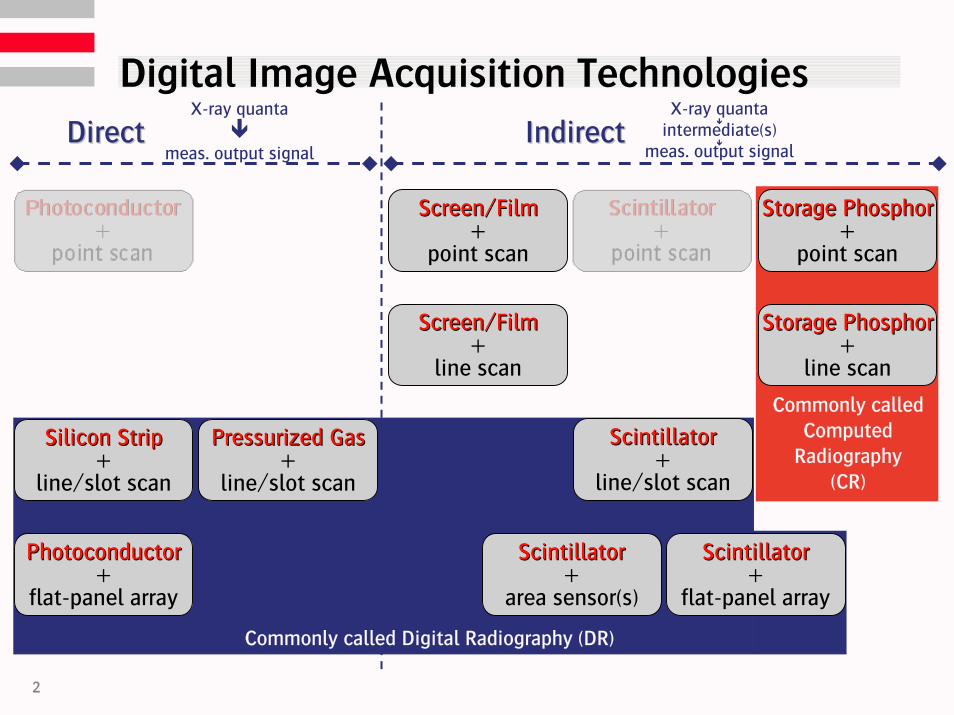
Storage PhosphorStorage Phosphor+
line scan
Storage PhosphorStorage Phosphor+
point scan
Screen/FilmScreen/Film+
point scan
PhotoconductorPhotoconductor+
flat-panel array
ScintillatorScintillator+
area sensor(s)
ScintillatorScintillator+
flat-panel array
Silicon StripSilicon Strip+
line/slot scan
ScintillatorScintillator+
line/slot scan
Pressurized GasPressurized Gas+
line/slot scan
Storage PhosphorStorage Phosphor+
line scan
Storage PhosphorStorage Phosphor+
point scan
Commonly calledComputed
Radiography(CR)
PhotoconductorPhotoconductor+
flat-panel array
ScintillatorScintillator+
area sensor(s)
ScintillatorScintillator+
flat-panel array
Silicon StripSilicon Strip+
line/slot scan
ScintillatorScintillator+
line/slot scan
Pressurized GasPressurized Gas+
line/slot scan
Commonly called Digital Radiography (DR)
Digital Image Acquisition Technologies
DirectDirectX-ray quanta
meas. output signalIndirectIndirect
X-ray quantaintermediate(s)
meas. output signal
Screen/FilmScreen/Film+
line scan
3
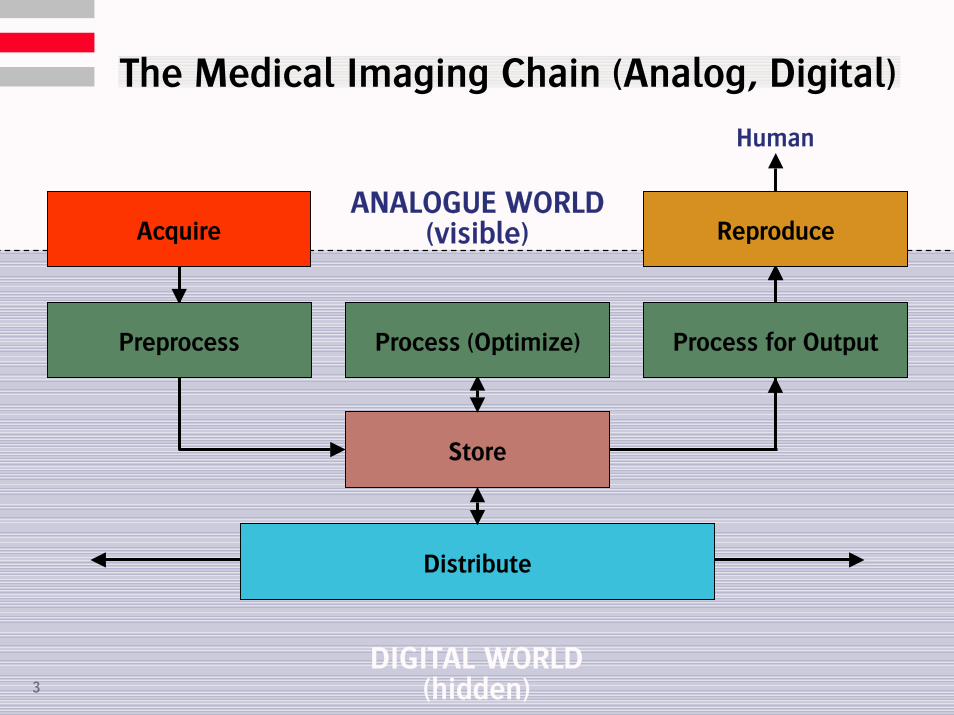
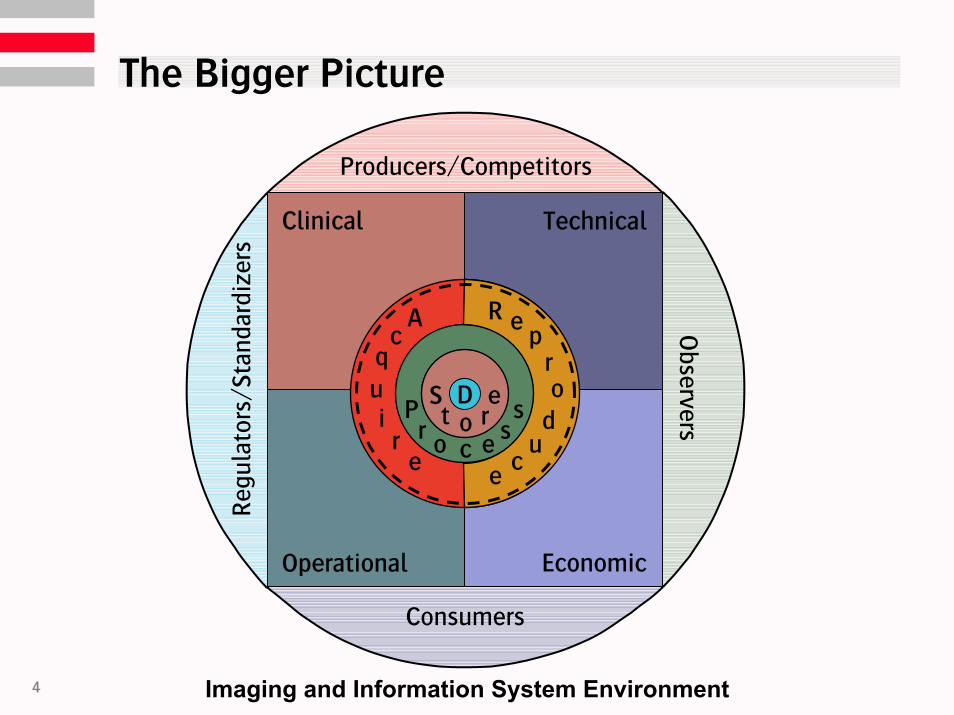
The Medical Imaging Chain (Analog, Digital)
Human
DIGITAL WORLD(hidden)
Distribute
Store
ProcessProcess (Optimize) Process for OutputPreprocess
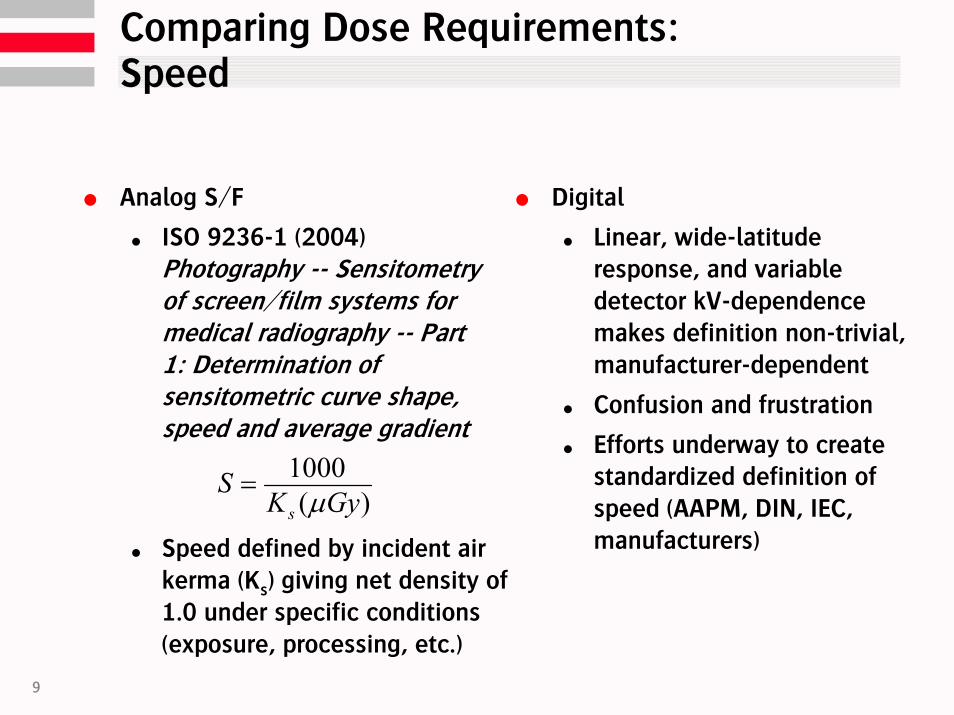
ISO 9236-1 (2004) Photography -- Sensitometry of screen/film systems for medical radiography -- Part 1: Determination of sensitometric curve shape, speed and average gradient
Digital
Linear, wide-latitude response, and variable detector kV-dependence makes definition non-trivial, manufacturer-dependent
Confusion and frustration
Efforts underway to create standardized definition of speed (AAPM, DIN, IEC, manufacturers)
)(1000GyK
Ss µ
=
Speed defined by incident air kerma (Ks) giving net density of 1.0 under specific conditions (exposure, processing, etc.)
10
Comparing Dose Requirements: Speed
0
1
2
3
4
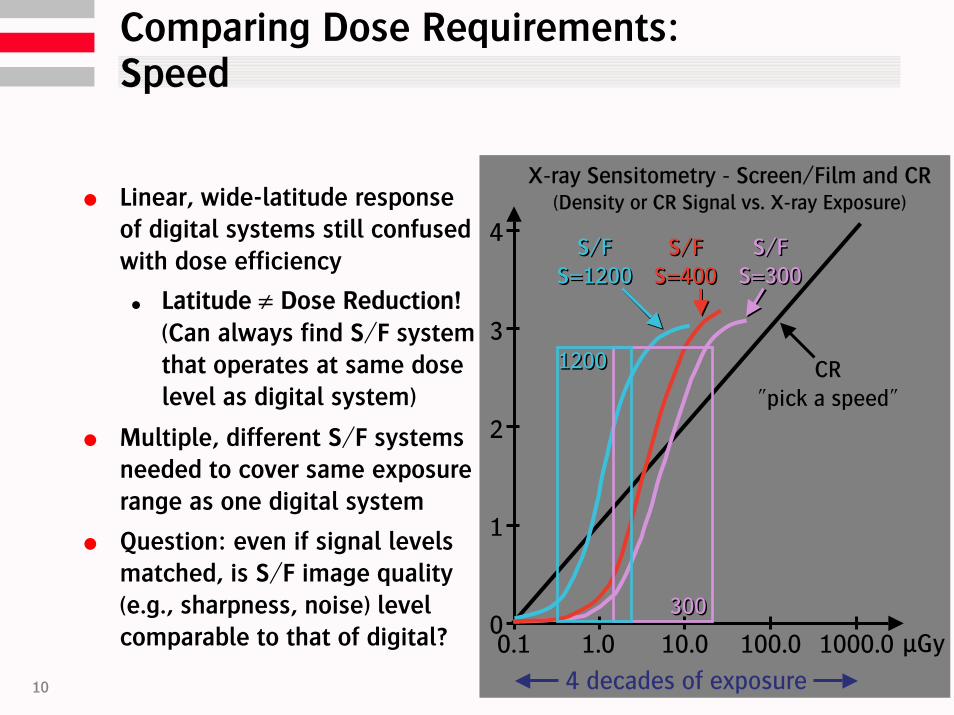
0.1 1.0 10.0 100.0 1000.0 µGy
X-ray Sensitometry - Screen/Film and CR(Density or CR Signal vs. X-ray Exposure)
4 decades of exposure
S/FS=1200
S/FS=1200
S/FS=400
S/FS=400
S/FS=300
S/FS=300
CR"pick a speed"
300300
12001200
Linear, wide-latitude responseof digital systems still confused with dose efficiency
Latitude ≠ Dose Reduction!(Can always find S/F system that operates at same dose level as digital system)
Multiple, different S/F systems needed to cover same exposure range as one digital system
Question: even if signal levels matched, is S/F image quality (e.g., sharpness, noise) level comparable to that of digital?
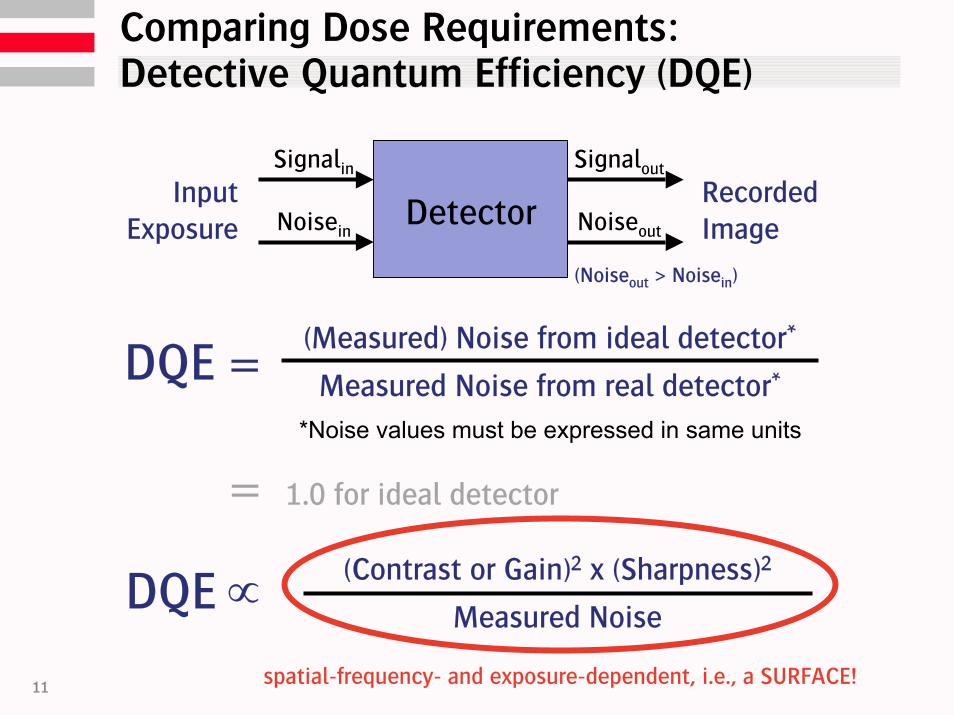
spatial-frequency- and exposure-dependent, i.e., a SURFACE!
= 1.0 for ideal detector
12
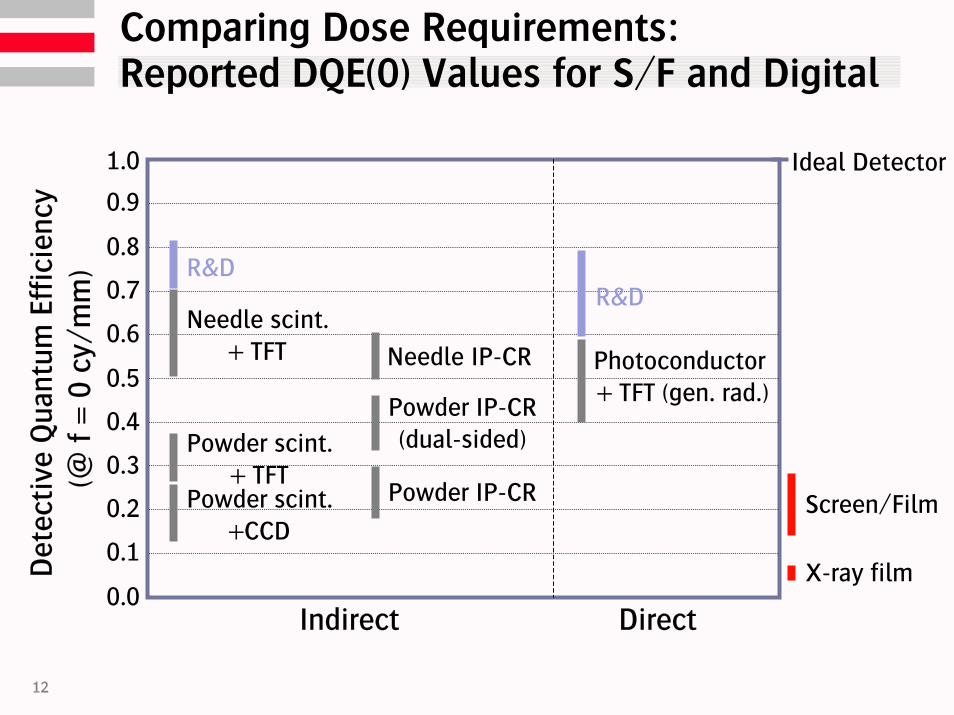
Comparing Dose Requirements: Reported DQE(0) Values for S/F and Digital
DirectIndirect
0.1
0.2
0.3
0.4
0.5
0.6
0.7
0.8
0.9
1.0
0.0
Photoconductor+ TFT (gen. rad.)
Powder scint.+CCD
Needle scint.+ TFT
Powder scint.+ TFT
Needle IP-CR
Powder IP-CR(dual-sided)
Powder IP-CR
R&DR&D
Det
ecti
ve Q
uant
um E
ffic
ienc
y (@
f =
0 c
y/m
m)
Ideal Detector
Screen/Film
X-ray film
13
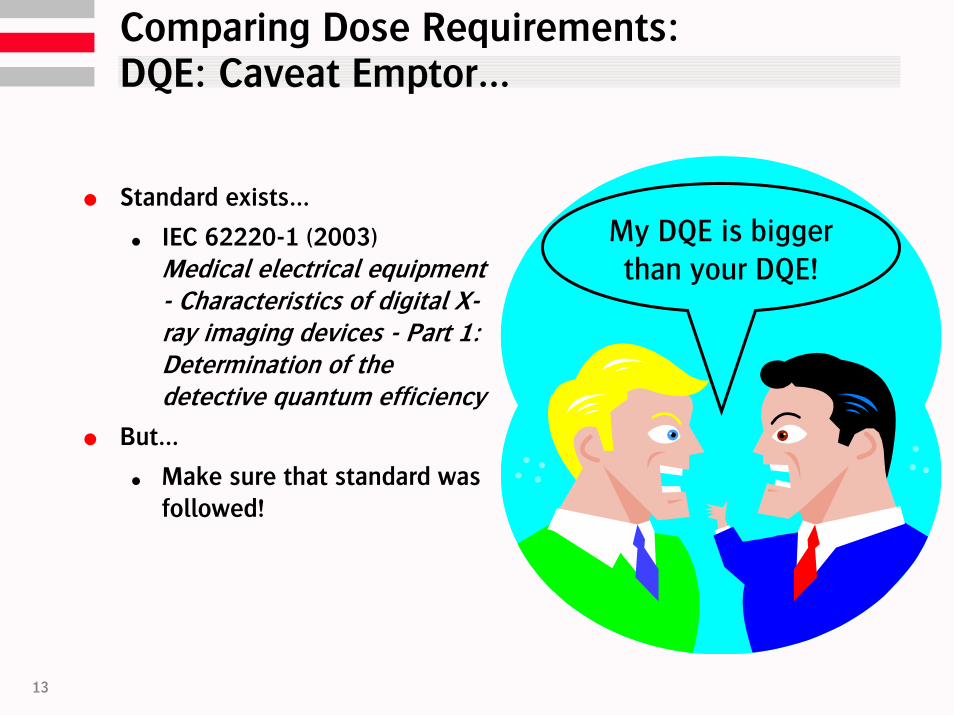
Comparing Dose Requirements: DQE: Caveat Emptor…
My DQE is bigger than your DQE!
Standard exists…
IEC 62220-1 (2003) Medical electrical equipment - Characteristics of digital X-ray imaging devices - Part 1: Determination of the detective quantum efficiency
But…
Make sure that standard was followed!
14
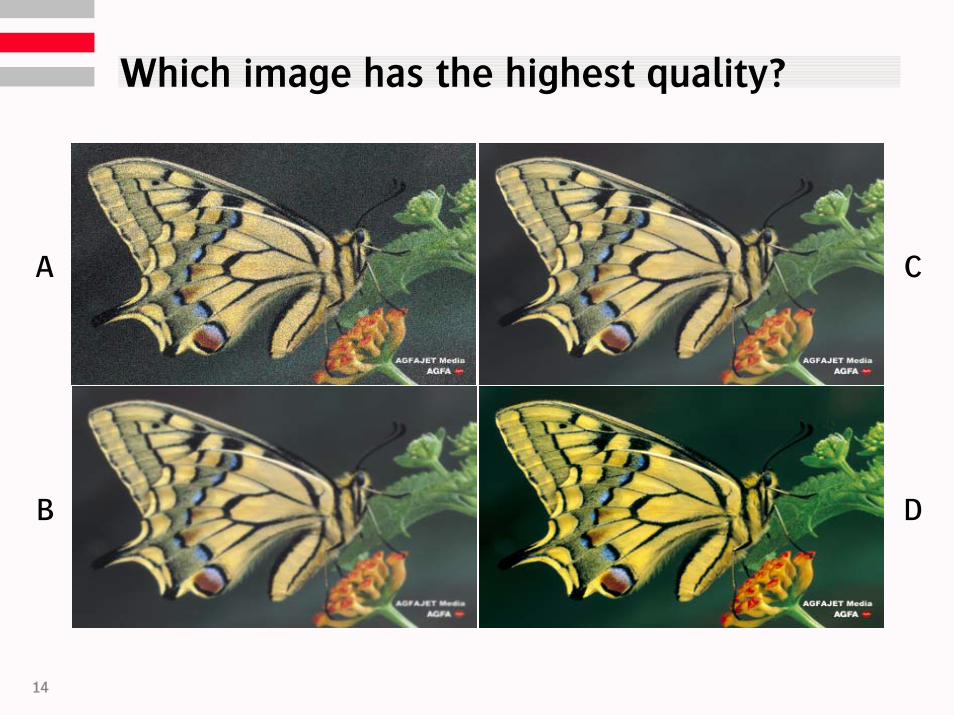
Which image has the highest quality?
A C
B D
15
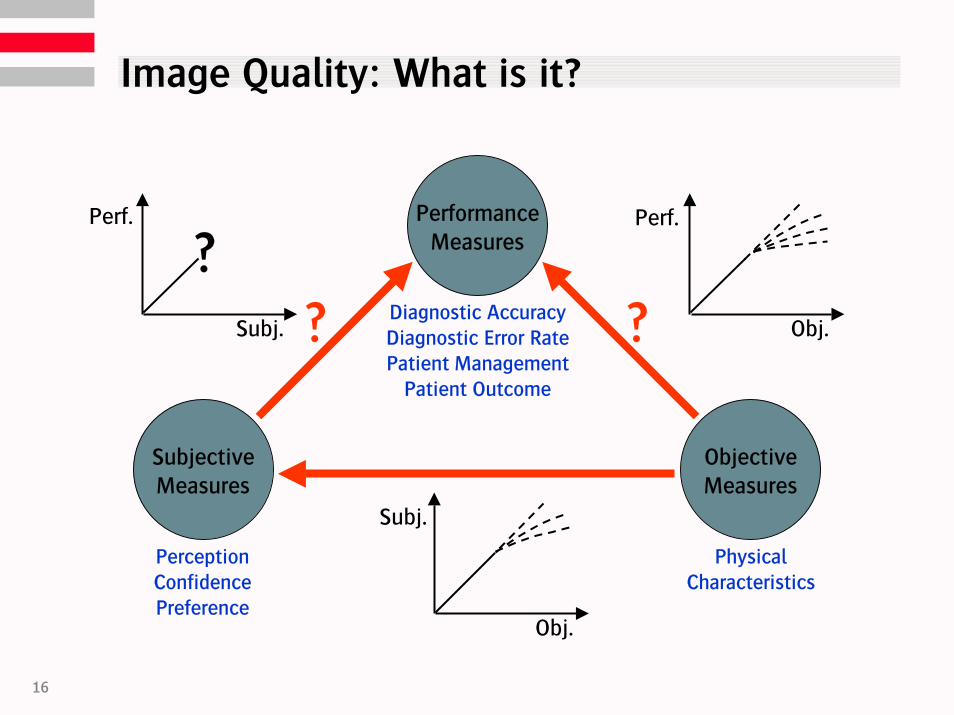
Image Quality: What is it?
Image quality depends only on intrinsic, objective physical characteristics of an imaging system, and can be measured independently of an observer
Image quality is whatever the observer says it is (i.e., it is a subjective perception of the image, "in the eye of the beholder")
Image quality is defined by an observer's ability to achieve an acceptable level of performance for a specified task
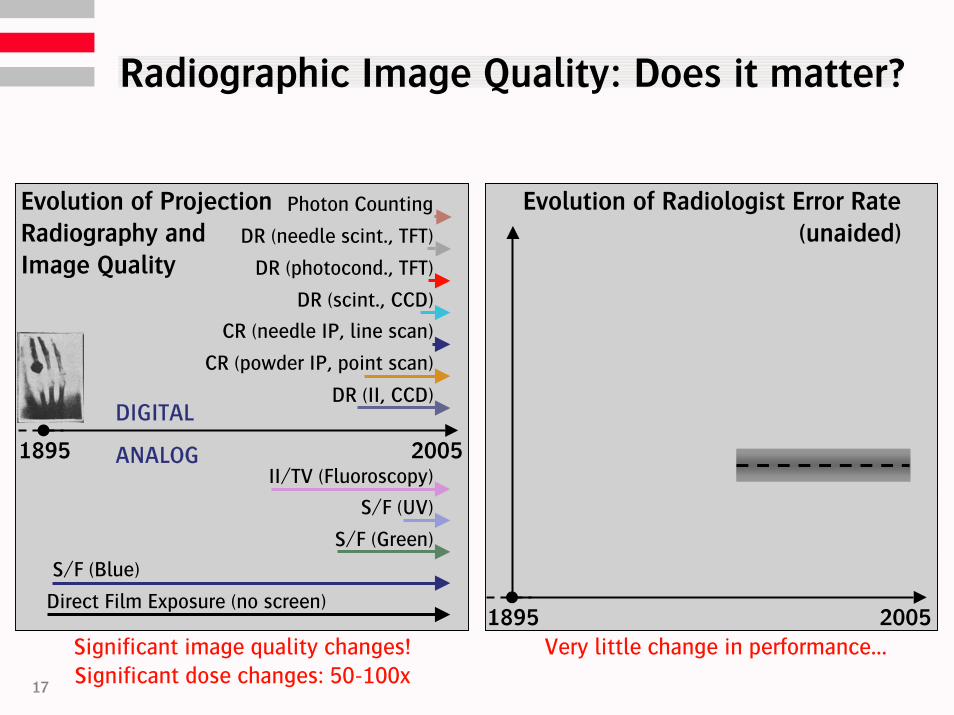
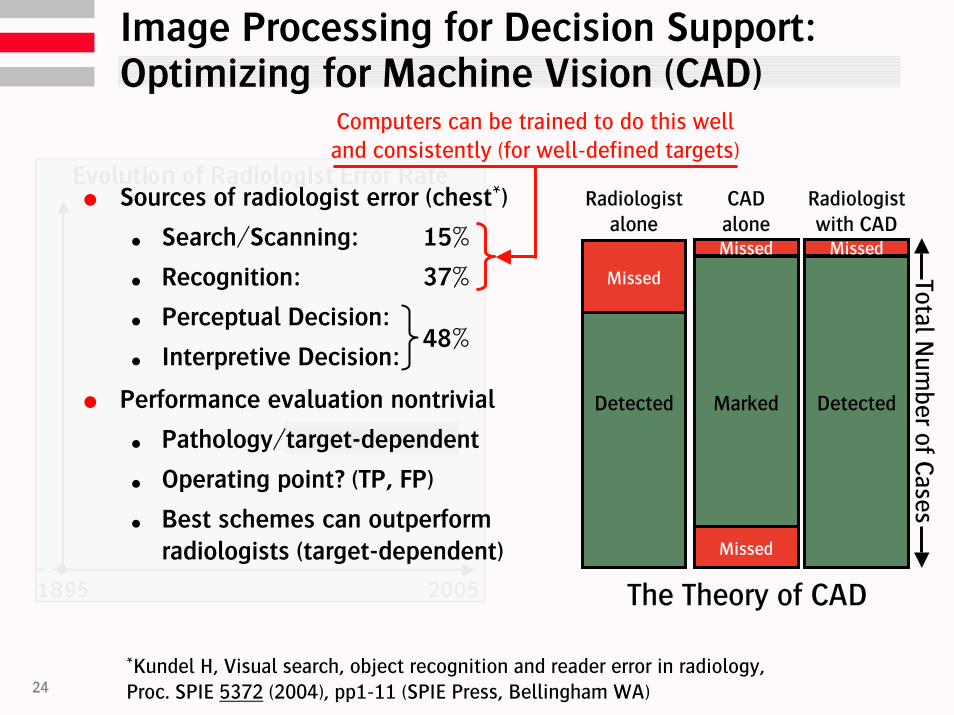
Photon CountingEvolution of ProjectionRadiography and Image Quality
Evolution of Radiologist Error Rate(unaided)
20051895Very little change in performance…
18
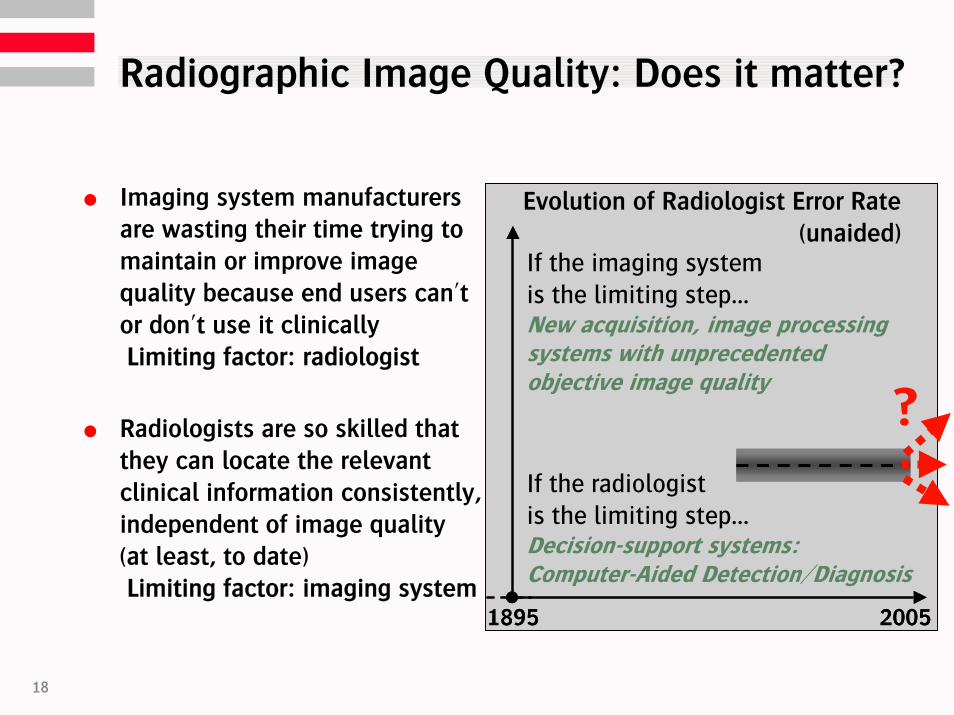
Radiographic Image Quality: Does it matter?
Evolution of Radiologist Error Rate(unaided)
20051895
?
20051895
If the imaging systemis the limiting step…New acquisition, image processingsystems with unprecedented objective image quality
If the radiologistis the limiting step…Decision-support systems: Computer-Aided Detection/Diagnosis
Imaging system manufacturers are wasting their time trying to maintain or improve image quality because end users can't or don't use it clinicallyLimiting factor: radiologist
Radiologists are so skilled that they can locate the relevant clinical information consistently, independent of image quality (at least, to date)Limiting factor: imaging system
19
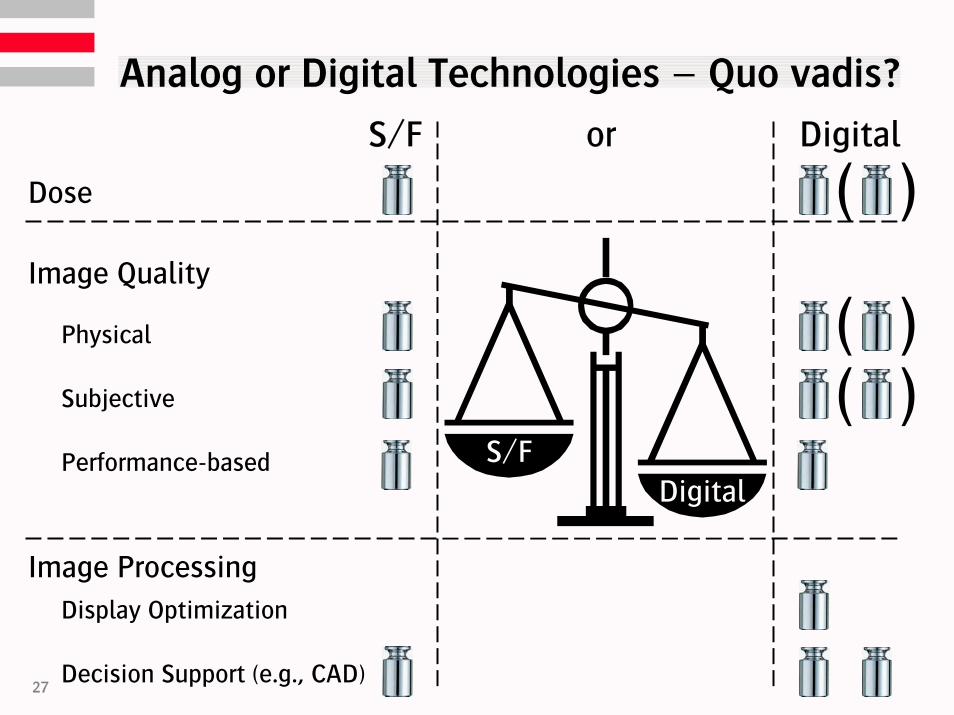
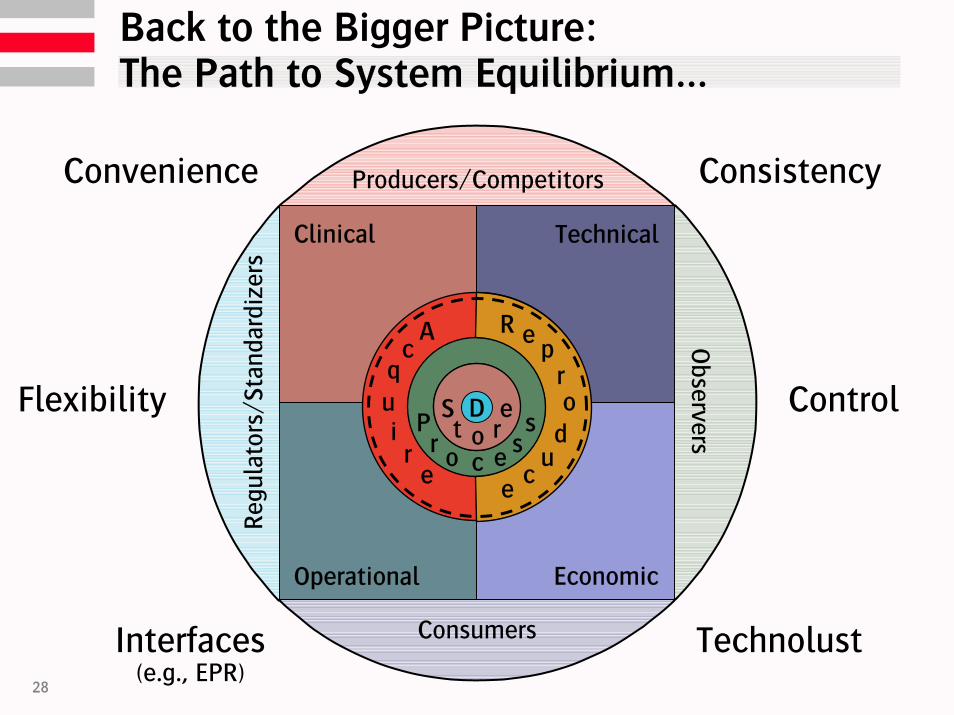
Outline of Presentation
Dose and Image Quality in S/F and Digital Systems
Dose requirements: the speed limit
Image quality as a dose metric
Does image quality really matter?
Image Processing in S/F and Digital Systems
Image processing for display optimization
Image processing for decision support
Wrap-up and Conclusions
20
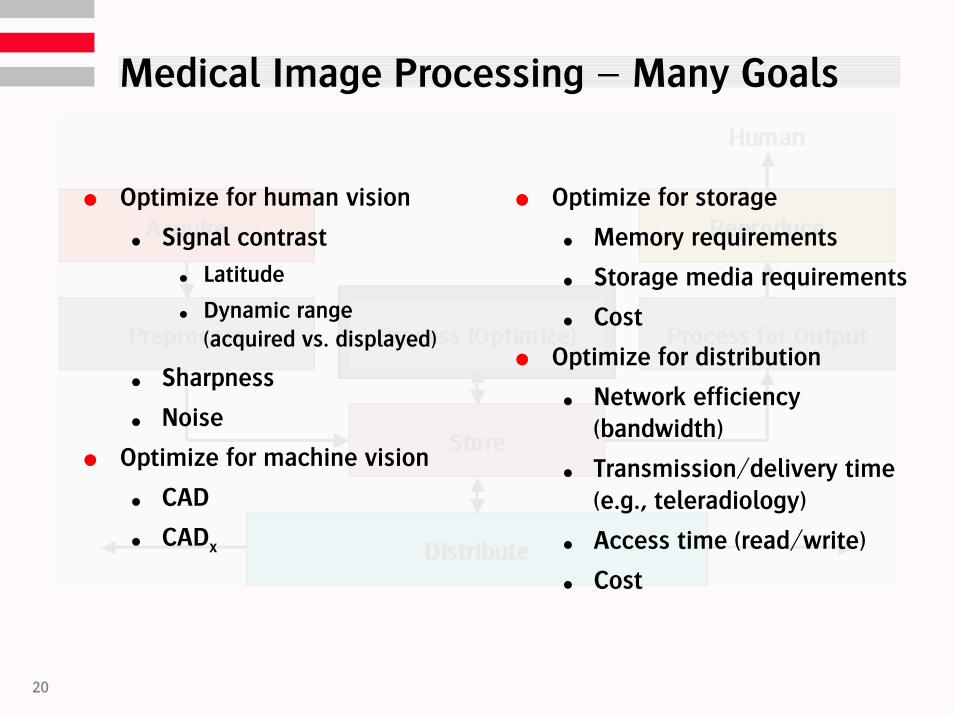
Medical Image Processing – Many Goals
Optimize for human vision
Signal contrast
Latitude
Dynamic range (acquired vs. displayed)
Sharpness
Noise
Optimize for machine vision
CAD
CADx
Optimize for storage
Memory requirements
Storage media requirements
Cost
Optimize for distribution
Network efficiency (bandwidth)
Transmission/delivery time(e.g., teleradiology)
Access time (read/write)
Cost
21
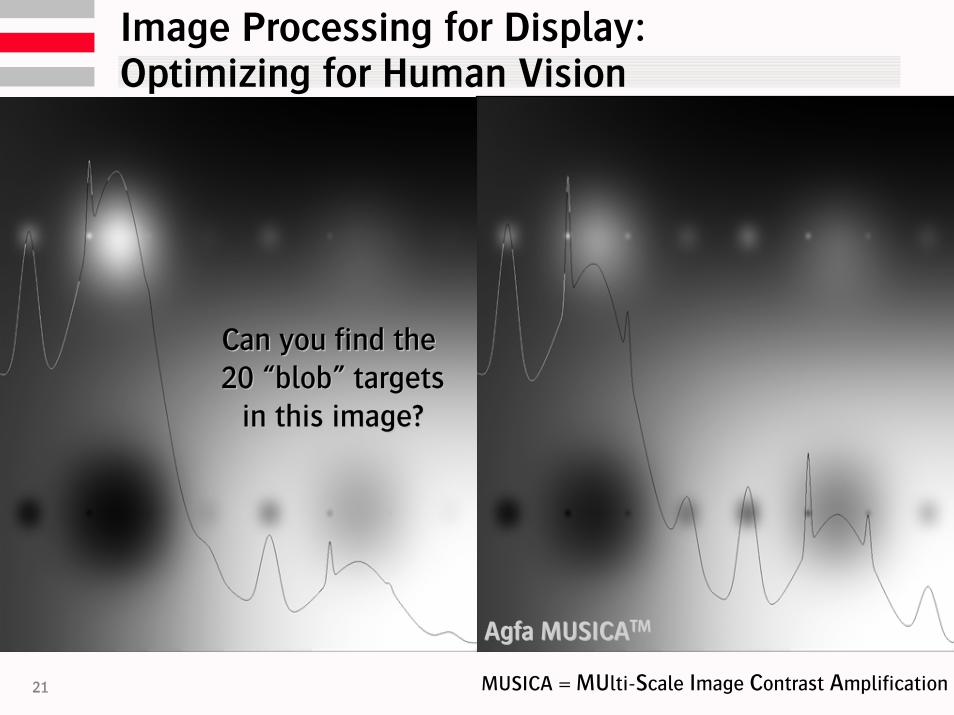
Image Processing for Display:Optimizing for Human Vision
Can you find the Can you find the 20 “blob” targets20 “blob” targets
in this image?in this image?
Agfa MUSICAAgfa MUSICATMTM
MUSICA = MUlti-Scale Image Contrast Amplification
22
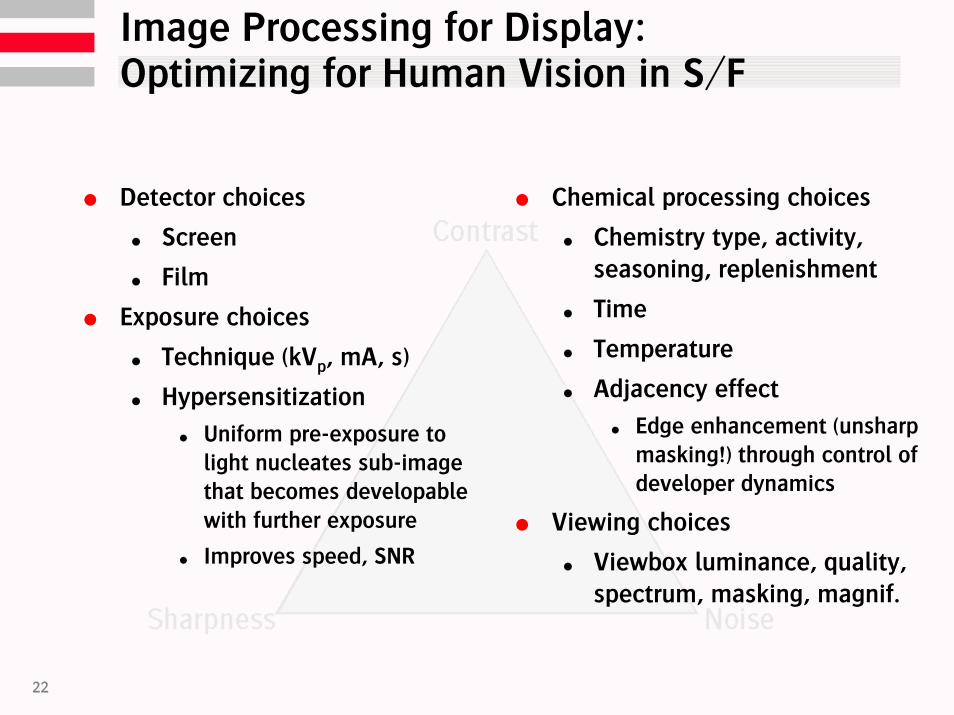
Image Processing for Display:Optimizing for Human Vision in S/F