52
A Comparison of State-Funded Pre-K Programs: Lessons for Indiana February, 2017 CENTER FOR EVALUATION & EDUCATION POLICY INDIANA UNIVERSITY
A Comparison of State-Funded Pre-K Programs: Lessons for Indiana
February, 2017
C E N T E R F O R E V A L U A T I O N & E D U C A T I O N P O L I C Y
I N D I A N A U N I V E R S I T Y


A B O U T T H E A U T H O R S Colleen Chesnut, Ph.D., ([email protected]) is a Research Associate at the Center for Evaluation and Education Policy (CEEP). Her research focuses on policy implementation for stakeholders across the P-16 spectrum, educational leadership, issues of equity for English lanugage learners, and school law.
Gina Mosier is a Ph.D. candidate in Inquiry Methodology at Indiana University Bloomington. She was a Graduate Research Assistant for the Center for Evaluation and Education Policy. She is currently an impact methods and analysis specialist with Thomas P. Miller & Associates.
Thomas Sugimoto ([email protected]) is an Evaluation Coordinator with CEEP. He received his Master in Public Affairs degree from the School of Public and Environmental Affairs (SPEA) at Indiana University. He has experience in K-12 program evaluation and finance analysis, including randomized controlled trial studies, formative evaluations, and data visualization.
Anne-Maree Ruddy, Ph.D. ([email protected]) is the Director for Education Policy and a Senior Research Associate at the Center for Evaluation and Education Policy. Her research focuses on analysis of policy, its development, and implementation in education systems emphasizing school environments and higher education. Dr. Ruddy coordinates CEEP’s policy-related activities to promote high-quality information about P–20 education used by the general public, education community and policymakers.
For questions about this research or accompanied data visualization, please contact Colleen Chesnut at [email protected]. A C K N O W L E D G E M E N T S The authors would like to thank three CEEP staff members for their assistance with this report: Rebekah Sinders, for formatting and designing the tables, LeeAnn Sell, for assisting with early phases of research, and Lisa Simmons-Thatcher, for assisting with final edits.
Table of ContentsExEcutivE Summary 4
LitEraturE rEviEW 5
HigHLigHtS and trEndS acroSS StatES 10
tabLE 1. ELigibiLity rEquirEmEntS for StatE-fundEd prE-K
programS, 2014-2015 12
tabLE 2. quaLity StandardS and mEaSurES of program
EffEctivEnESS for StatE-fundEd prE-K programS, 2014-2015 13
StatE profiLES
gEorgia 14
iLLinoiS 16
maSSacHuSEttS 18
micHigan 20
nEbraSKa 22
oHio 24
SoutH caroLina 26
tEnnESSEE 28
virginia 30
WiSconSin 32
indiana 34
rEcommEndationS 35
rEfErEncES 37
rEfErEncES by StatE 41
appEndix: gLoSSary of acronymS and tErmS 49

4
EXECUTIVE SUMMARY
Indiana University | Center for Evaluation & Education Policy
In order to inform the Indiana State Board of Education’s decision-making on Indiana’s On My Way Pre-K Pilot program, researchers at the Center for Evaluation and Education Policy (CEEP) at Indiana University compiled existing data on ten states that have implemented pilot pre-Kindergarten (pre-K) programs and subsequently expanded these programs beyond the pilot phase. This technical report presents the results of this inquiry, including a review of research on pre-K programs, highlights and trends across the states, individual state profiles, and recommendations for Indiana.
States and Program Characteristics ExaminedThe ten states selected for this research were: Georgia, Illinois, Massachusetts, Michigan, Nebraska, Ohio, South Carolina, Tennessee, Virginia, and Wisconsin. These states were selected because they have piloted state-funded pre-K programs and subsequently expanded their programs beyond the pilot phase. Publicly-available data were examined on characteristics of state-funded pre-K programs. These characteristics were selected in order to provide comprehensive snapshots of state-funded pre-K programs in each state. The characteristics include:
• History of program development and expansion• Funding source(s) and amounts• Quality standards for service providers• Eligibility requirements for students/families• Enrollment numbers • Number and types of service providers• Measures of program effectiveness
Key Findings and RecommendationsThe states with the highest amounts of total funding allocated to pre-K serve the most students. Most of the ten states provide funding for pre-K via general revenue funds, but a few use lottery funding. For example, Georgia funded pre-K with $312 million in lottery funds, enrolled 80,430 students, and served 100% of school districts during 2014-2015. By contrast, the three states with the lowest levels of total funding (Nebraska, Ohio, and South Carolina) also enrolled the fewest children. An increase in total funding and consideration of funding sources in addition to the state’s general revenue fund are recommended for expanding access to pre-K in Indiana. This may include funding options available through federal grants; several of the states examined in this report have recently received federal funding to enhance quality of and access to their state-funded pre-K programs.
All states have a minimum age requirement for children to be eligible for pre-K, generally three or four years old. Most states also utilize family income level as an eligibility factor, and some employ additional criteria to target at-risk children. Indiana is the only state that limits access to state-funded pre-K to children in just a few counties. Expanding eligibility beyond these five counties is recommended for Indiana’s pre-K programs.
States vary in terms of meeting or exceeding program quality benchmarks established by NIEER and outlined in research on effective pre-K programs (e.g., Barnett et al., 2016; Weschler et al., 2016), including accreditation, teacher quality, staff to child ratios, curricula, and quality monitoring. Those meeting benchmarks generally have more clearly-established accreditation guidelines, well-prepared teachers, lower staff to child ratios, and research-based curricula, assessments, and quality monitoring processes. Furthermore, several states have dedicated funds and efforts towards regular external evaluation of their pre-K programs. While increasing access to Indiana’s pre-K programs is important, it will also be crucial to focus on enhancing the quality of these programs, via attention to best practices exemplified in other states and research on early education. For a detailed overview of the state programs including funding, enrollment, eligibility requirements, and quality measurements please refer to CEEP’s interactive data visualization.

5
LITERATURE REVIEW
History of the pre-Kindergarten Movement The pre-Kindergarten (pre-K) movement has its roots in the 1960s, with the creation of the Head Start program in 1965, which ensured half-day preschool for children from low-income families. Today, the federal Head Start/Early Head Start program offers not only preschool, but nutrition, health, and other services for infants and children who are at-risk. However, the program serves less than half of the eligible children from low-income families (Schmit, Matthews, Smith, & Robbins, 2013). To fill this void, local, city, and county providers have created programs across the country (Muenchow & Weinberg, 2016) and state-funded programs have increased in number.
Enrollment in pre-K Education From 2000 onward, the nation has seen growth in state-funded pre-K programs, despite a downturn in the economy and the economic challenges of funding for early education programs. In the 2001–2002 school year, 581,705 four-year-olds, or 14.8 percent of the entire population in this age group, were enrolled in 45 state-funded pre-K programs in 40 states (Barnett et. al., 2003). By 2009-2010, the number increased to 1,292,310. Throughout this period the number of programs increased as well, with 52 different state-funded programs in 40 states and the District of Columbia (Barnett et al., 2010.). Despite this continuing upward trend, in 2013 only half of all three- and four-year-olds in the United States (U.S.) were enrolled in preschool programs (both public and private). Of these children, the majority were from high-income families rather than middle-and low-income families (National Women’s Law Center, 2013). Yet, research has shown that children from low-income families are the ones that benefit the most from pre-K education (Garcia, Heckman, Leaf, & Prados, 2016).
Benefits of pre-K Education Research shows that investing in pre-K education provides a myriad of benefits, both in the short-term as well as long-term. Not only did children in their early years in pre-K education programs perform better than children not enrolled in pre-K education, but they also had better learning outcomes later in their education and were more likely to graduate high school and retain their jobs than students who did not attend pre-K education. Furthermore, students who were enrolled in pre-K education had higher salaries and had fewer arrests than those who were not in pre-K education (Schweinhart, Montie, Xiang, Barnett, Belfield, & Nores, 2005). The families of these students also benefitted if the program offered childcare as well (Barnett & Masse, 2007). Lastly, students enrolled in pre-K programs had better health than those who were not enrolled (Campbell et al., 2014). According to O’Brien and Devarics (2007), pre-K programs are the “gift that keeps on giving” because children in programs experienced a multitude of educational, economic, and health benefits. Lynch (2007) found that investing in pre-K programs helped create billions of dollars in benefits for state and federal governments.
Not only does the child who attends pre-K benefit, but so does society. When students were enrolled in pre-K education programs, less taxpayer money was spent on special education, criminal justice, unemployment benefits, and public benefits (Karoly & Bigelow, 2005). Furthermore, since participants in the pre-K programs had higher incomes than those who were not in pre-K programs, these participants contributed more taxes on their earnings. A cost-benefit analysis of pre-K spending found a $12.90 return on each dollar spent on pre-K education. For a cost of $15,166 of pre-K education, the total public benefit was $195,621 per student (Schweinhart et al., 2005).
Two seminal studies cited frequently on pre-K education: (a) the HighScope Perry Preschool Study, and (b) the Abecedarian Early Childhood Intervention Project detail the aforementioned advantages. These studies utilized randomized control trials that examined longitudinal outcomes of students who were enrolled in pre-K programs compared to students who were not enrolled. The results from these studies contribute to our knowledge of the benefits of pre-K programs, as the studies were some of the few randomized control trials that examined longitudinal outcomes of students who were enrolled in pre-K programs compared to students who were not enrolled (Barnett & Masse, 2007). In addition to these two studies, researchers examining early childhood education have found similar benefits of pre-K programs.

6 Indiana University | Center for Evaluation & Education Policy
The HighScope Perry Preschool study investigated the impact of pre-K education on children from low-income families that were considered at-risk for failing in school. Children aged three and four were randomly separated into two groups. One group received a pre-K program that followed HighScope’s instructional approach, while another group received no pre-K program (Schweinhart et al., 2005). Researchers followed students in both groups from the start of the program through later in life, and the most recent follow-up was performed when these participants were 40 years old. Researchers also collected data from the participants’ schools, as well as social services and arrest information. They found that students in the pre-K programs experienced better learning outcomes, earned more income, and had fewer arrests (Schweinhart et al., 2005).
The North Carolina Abecedarian Early Childhood Intervention project was similar to the HighScope Perry Preschool study in that it was a randomized control study examining the benefits of pre-K education for children from minority low-income families. Four cohorts of infants were randomly assigned to one of two groups. One group received early education programs, and the other group did not. Whereas the HighScope project only included half-day preschool, the Abecedarian project included half-day preschool as well as full-day childcare.1 Additionally, children attended this program from infancy to kindergarten (Ramey et al., 1974). Akin to the HighScope study, researchers in the Abecedarian study found that children who received early education programs experienced better outcomes. Several follow-up studies have been performed with study participants. A recent follow-up study with participants aged 30 years old found that individuals in the program experienced better social-emotional, educational, and economic outcomes than those who did not receive early childhood education programs (Campbell et al., 2012). Past studies have also found increased academic and cognitive scores as well as increased likelihood of college attendance among other benefits (Campbell, Ramey, Pungello, Sparling, & Miller-Johnson, 2002; Clarke & Campbell, 1998). Furthermore, results from a benefit-cost analysis showed that mothers of children in the program earned greater income than the mothers of children in the control group. Additionally, children who received the early education program earned more income (Barnett & Masse, 2007).
The Chicago Longitudinal Study examined the effects of an early education initiative on low-income students. This early educational program operated in 20 different schools and provided assistance for children from low-income families beginning at age three up to the age of nine. In the study, the outcomes of children who participated in the program were examined, as well as outcomes from a comparison group. The most recent study followed up with participants at age 26. Similar to the HighScope project, researchers performed a cost-benefit analysis and found an 18 percent return on investment annually for the program. Additionally, for every one dollar that was invested in the early childhood program, there was approximately an $11 return to the community over the child’s lifetime. These returns were found through increased income for participants, tax revenues, and decreased costs from the criminal justice system (Reynolds, Temple, White, Ou, & Robertson, 2011).
Another recent study which evaluated the outcomes of two influential early childhood programs in North Carolina through randomized control trails showed positive longitudinal results. The program targeted children from low-income families, and the study followed the participants into their mid-thirties. The researchers found a plethora of other benefits, including: increased salaries for participants and their mothers, improvements in health, quality of life and education, and a decrease in crime. Additionally, researchers estimated that the benefit-cost ratio of 6.3 and a rate of return of 13% annually, after adjusting for welfare costs of funding the program through taxes, providing a benefit for taxpayers and the community at large (Garcia et al., 2016).
Other studies estimate the return on investment for non-targeted universal pre-K programs is between two and four dollars for every dollar invested (O’Brien & Devarics, 2007). As not all pre-K programs are created equal, high-quality programs garner the most gains (Lynch, 2007). Successful programs such as HighScope and Abecedarian had small staff-to-student ratios and small class sizes, which have been shown to be most beneficial for student learning (Ackerman & Barnett, 2006). Researchers have found that some of the core elements of success for high-quality pre-K programs include: learning goals connected
LITERATURE REVIEW
1 Some research has shown that low-income students enrolled in full-day pre-K programs have more significantly improved learning outcomes than those in half-day programs (Robin, Frede, & Barnett, 2006).

7
LITERATURE REVIEW
to K-12 standards, low student/staff ratios, small class sizes, and highly-trained teachers with proficiency in early childhood education (Gayl, 2008).
There is some critique on whether pre-K programs such as HighScope and Abecedarian can be replicated with fidelity across the U.S. Moreover, would the same results be found for all children? Though researchers did find positive results for these two randomized control studies for these particular disadvantaged children, it is uncertain if these results are generalizable to other groups of children (Barnett, 2011). Equally, there is some critique of the long term outcomes of some of the pre-K programs (Lipsey, Farran, & Hofer, 2015; Puma, Bell, Cook, & Heid, 2010; Puma et al., 2012). These studies have suggested that the positive effects of pre-K may fade over time. Further studies indicate that variables, and thus findings, differ considerably across pre-K research studies related to the following program elements:
• Program quality and implementation,• Program financial resources,• Program duration,• Program populations served, and• Elementary school quality and continuing attention from teachers (Workman, Palaich, & Wool, 2016, p. 11).
Enrollment numbers for the nation are provided earlier in this review of the literature. Further, four of the variables specifically addressed in our study, quality, funding, duration, and eligibility requirements are briefly discussed, below.
Quality. Research not only illustrates the benefits of pre-K education but also illustrates the importance of high-quality early childhood programs (Yoshikawa et al., 2013). Many states have established quality standards, requirements or guidelines for pre-K service providers, and these vary across the states. Work conducted by Wechsler, Melnick, Maier, and Bishop (2016) summarizes the comprehensive research on programs, “demonstrating positive results, as well as the professional standards for early education, identifying important elements of quality,” (p. 1). According to Weschler et al. (2016, p.1), these elements of quality include but are not limited to:
• Early learning standards and curricula that address the whole child, are developmentally appropriate, and areeffectively implemented.
• Assessments that consider children’s academic, social-emotional, and physical progress and contribute toinstructional and program planning.
• Well-prepared teachers who provide engaging interactions and classroom environments that support learning.• Ongoing support for teachers, including coaching and mentoring.• Support for English learners and students with special needs.• Meaningful family engagement.• Sufficient learning time.• Small class sizes with low student-to-teacher ratios.• Program assessments that measure structural quality and classroom interactions.• A well-implemented state quality rating and improvement system.
The National Institute for Early Education Research (NIEER), which compiles data annually on state-funded pre-K programs in the U.S., uses similar metrics to assess program quality. Since 2003, annual NIEER yearbooks on pre-K programs indicated which state programs meet certain benchmarks related to program quality in the following areas: early learning standards, teacher and assistant teacher degrees or certifications and training, teacher in-service, class sizes, staff to child ratios, additional screening and support services, meals, and quality monitoring (Barnett et al., 2016). As some research on pre-K outcomes demonstrates, even state-funded programs that meet quality benchmarks may not benefit all students in the long term. For example, in response to findings that positive effects of pre-K participation diminished by the time students were in third grade, policymakers in Tennessee increased their focus on enhancing quality standards, even though state-funded programs already met most of the benchmarks outlined by NIEER (Lipsey et al., 2015).

8 Indiana University | Center for Evaluation & Education Policy
LITERATURE REVIEW
Funding. In the 2015-2016 fiscal year, state funding for pre-K in all states increased by $755 million to a total of nearly $7 billion. The Education Commission of the States noted that “this is a 12 percent increase in state investment in pre-K programs, which builds on an additional 12 percent increase during the 2014–2015 fiscal year,” (Parker, Atchison, & Workman, 2016, p. 2). The authors also noted that in 2015-2016, only five states (Idaho, Montana, New Hampshire, South Dakota, and Wyoming) did not provide state funding for pre-K in some form. This compares to 11 states that were not investing in pre-K three years prior. While funding levels for pre-K programs increased in 32 states in 2015-2016, as noted previously, less than half of preschool aged students nationally have access to pre-K programs.
In terms of federal funding, starting in 2012, the U.S. Department of Education began offering competitive awards for early learning programs, and several of the states examined in this report applied for and received these grant monies. In 2016, the Every Student Succeeds Act (ESSA) created an opportunity to increase funding for early childhood education via Title I and Title II funding as well as Preschool Development Grants. In January 2017, the Office of Head Start announced that it will disburse $290 million to 665 Head Start and Early Head Start programs around the country that may be used to expand to full school day and year offerings (Samuels, 2017). Congress appropriated the supplemental funding in a fiscal 2016 budget bill (P.L. 114-113).
Duration. Research indicates that pre-K program duration, including number of days per year and number of hours per day, may impact the programs’ effects on children and families. For example, a study examining cognitive gains in reading and math for children attending preschool centers found that the most significant gains occurred for low-income children who attended at least 30 hours per week and nine months or more per year (Loeb, Bridges, Bassok, Fuller, & Rumberger, 2007). A study examining the effects of an early literacy intervention implemented in preschool classrooms also found that the intervention had the greatest positive impacts for children who attended full-day, rather than half-day programs (Landry, Swank, Smith, Assel, & Gunnewig, 2006). Cost-benefit analysis has also shown that returns on investment for full-day pre-K programs are higher than those for half-day programs, particularly for low-income and working parents (Barnett & Masse, 2007).
Recent data from national research on state-funded pre-K programs reveals that among state programs, there is roughly an even split between those offering full-day (between four and eight hours) and half-day (fewer than four hours) programs. In most state pre-K programs, services are offered during the academic year. Additionally, 11 states allow for localities to determine the number of hours per day for their programs, and 19 states allow for local determination of programs’ operating schedules (Barnett et al., 2016).
Eligibility. Eligibility requirements vary across states. Generally, states offer services for children who are at least four years old (who are not yet kindergarten-eligible), with some extending services to three-year-olds.
The National Institute for Early Education Research (NIEER) 2013 State of Preschool Yearbook reported on the eligibility policies of 53 state-funded pre-K programs, offered in 40 states and the District of Columbia (Barnett et al., 2013). Carolan and Connors-Tadros (2015, p.5) noted that, “of the 53 programs profiled, 17 (32%) have no eligibility requirements beyond age, though the program may not be universally available, due to limited funding.” The authors detailed that of the remaining programs:
• Low-income status is the most commonly used criteria in determining eligibility. About 28 programs (58%) reportedusing a state-specified income requirement as an eligibility criterion for the program, either on its own or in concert with other factors, including age.
• Eligibility is determined most often by individual child or family characteristics in addition to age. This is the case in 32of the programs (60%).
• 21 programs (40 %) report that age is the only enrollment factor for children in districts (or the entire state) wherethe program is offered.
• Five (9%) programs reported that income was the only risk factor used for eligibility.(Carolan and Connors-Tadros, 2015, p.5)

9
LITERATURE REVIEW
Income Eligibility. Barnett et al. (2016) stated that 33 state programs have an income eligibility requirement. In general, most states calculate eligibility based on a multiple of the federal poverty level (FPL). FPL is calculated annually and takes into account income and family size. In 2015, families of three making less than $20,090 were considered to be living in poverty (Office of the Federal Register, 2015). The most commonly used eligibility criteria for state pre-K programs is 185% of the FPL (or less than $37,167 for a family of three). The 185% FPL cut-off is also the cut-off for reduced-price lunch that is administered through the United States Department of Agriculture, and is a common definition of low-income employed by public schools. Another income measure often used, noted by Carolan and Connors-Tadros (2015), is a multiple of State Median Income (SMI).
Early Education in IndianaOver the past five years, enrollment in pre-K programs has increased sharply in Indiana. In the 2011-2012 academic year, 10,906 students were enrolled in public and non-public pre-K programs (which report enrollment data to the Indiana Department of Education). In 2015-2016, 22,222 students were enrolled in these pre-K programs. Though this has occurred, there are still large numbers of children (many from low-income families) who are not enrolled in pre-K programs. Unlike the other states in this study, Indiana does not have a comprehensive state-funded pre-K program, though one is in the pilot phase. In 2015-2016, the state’s pilot pre-K program (On My Way Pre-K) only served 1,585 children in five counties, though demand by families for preschool aid has far outpaced the number of spots available (Cavazos, 2016).
A recent study has shown that many Indiana families do not have access to high-quality pre-K programs due to cost, availability, or lack of knowledge about the benefits of investing in early education (Nelson, Brodnax, & Fischer, 2016). The economic impact in Indiana would likely be quite positive if policymakers invested in a high-quality, publically-funded pre-K program in Indiana. The return on investment is estimated to be $3.83 to $4.00 per dollar invested in present dollars. Furthermore, the authors indicate that the cost would be a small portion of the overall K-12 education budget. The researchers estimate that the total cost per annum for a high-quality publically-funded program would be 0.8 to 2.0 percent of Indiana’s current spending on K-12 education. It is estimated that the return on this spending would be significant, similar to previous studies on longitudinal outcomes of pre-K programs. An investment in a high-quality early education program in Indiana would likely reduce future spending on K-12 education as well as crime. Additionally, it is estimated that children from low-income families could expect a $3.09 increase in their income over their lifetime for each dollar invested, while children from higher-income families could expect to realize a $2.79 increase in earnings over their lifetime for every dollar invested (Nelson et al., 2016).
Based on the information presented in this literature review, the remainder of the report proceeds with the assumption that pre-K is beneficial and that in particular, the economic benefit of investing in scaling up the pilot pre-K education program in Indiana would be realized. As such, the focus of this report is how the ten states selected for this study have implemented state-wide programs following pilot programs. To address this key question, we include a state comparison of key elements and trends as well as individual state profiles on the following characteristics:
• History of program development and expansion• Funding source(s) and amounts• Quality standards for service providers• Eligibility requirements for students/families• Enrollment numbers• Number and types of service providers• Measures of program effectiveness

10 Indiana University | Center for Evaluation & Education Policy
Development and Growth of State-Funded pre-KAll ten states selected for this study established legislation to provide state funding for pre-K programs in the mid-1980’s (Illinois, Massachusetts, Michigan, South Carolina, and Wisconsin) or the 1990’s (Georgia, Nebraska, Ohio, Tennessee, and Virginia). More recently, in 2007, Massachusetts piloted an additional pre-K initiative, focused on enhancing program quality and expanding access for at-risk children (Fountain & Goodson, 2008). South Carolina also added a second state-funded full-day pre-K program in 2006 as a result of a school funding equity lawsuit (SC Education Oversight Committee, 2008). For these two states, with two separate state-funded pre-K programs, this report presents data to the extent possible only on the more recently-established and rigorous (full-day) program: Universal Pre-Kindergarten (UPK) in Massachusetts and the Child Development Education Pilot Program (CDEPP) in South Carolina.
For a detailed overview of the state programs including funding, enrollment, eligibility requirements, and quality measurements please refer to CEEP’s interactive data visualization.
Each state’s profile depicts the percentage of school districts offering state-funded pre-K programs in 2014-2015, which ranges from 90% or greater in five states (Georgia, Illinois, Tennessee, Virginia, and Wisconsin) to 25% in Massachusetts. By comparison, Indiana’s On My Way Pre-K Pilot Program was available in 3% of school districts in 2014-2015 (Barnett et al., 2016).
Funding and enrollments. There is also a wide range of per-student state funding reported for each state in 2014-2015, from $6,447 in Michigan to $2,759 in Nebraska; Indiana’s per-student funding was $2,558 (Barnett et al., 2016). Figure 1 illustrates a comparison in the levels of per-student state funding over time.
Charts within each state’s profile illustrate trends over time in the state’s total funding for pre-K programs, total student enrollments, and total enrollments compared with per-student funding levels. Data for the total enrollments and total funding charts were derived both from NIEER state yearbooks (Barnett et al., 2003-2015) and for programs established prior to 2002 from state-specific sources. Enrollment numbers and total funding levels vary by state; Georgia enrolled the greatest number of students in their pre-K programs in 2014-2015, with a total of 80,430 students, and South Carolina’s program enrolled the fewest, at 10,665. By contrast, Indiana’s On My Way Pre-K program enrolled 421 students for 2014-2015 and 1,585 students in 2015-2016 (Indiana Family & Social Services Administration, 2015). Total funding for state pre-K programs was also highest in Georgia for 2014-2015, at $312.1 million, while Nebraska’s total funding was the lowest among the ten states examined, at $33.3 million. Most states fund their pre-K programs through their general revenue funds; however, Georgia and Virginia currently utilize lottery funds, and Tennessee utilized lottery funds to scale up pre-K funding between 2006 and 2008.
HIGHLIGHTS AND TRENDS ACROSS STATES
2 Total and per-student funding amounts have been adjusted for inflation to reflect dollars as of 2015.
Figure 1. Per-student state funding for pre-K programs, 2002-2015
Source: NIEER State of Preschool Yearbooks, 2003-2015.
01,0002,0003,0004,0005,0006,0007,0008,0009,000
2002 2003 2004 2005 2006 2007 2008 2009 2010 2011 2012 2013 2014 2015
Per
Stu
dent
fund
ing
($20
15)2
GA IL MA MI NE OH SC TN VA WI

11
Federal grant awards. Starting in 2012, the U.S. Department of Education began offering competitive awards for early learning programs, and several of the states examined here applied for and received these grant monies. Massachusetts, Wisconsin, Michigan, Illinois, and Ohio received awards for their pre-K programs under the Race to the Top-Early Learning Challenge program, and Massachusetts, Virginia and Tennessee received Preschool Development-Expansion grants. The awards ranged from multi-year grants totaling up to $70 million (Ohio) to yearly awards over the course of three to five years of $17.5 million (Tennessee and Virginia) or $15 million (Massachusetts). The states receiving these awards proposed a variety of ways to enhance access to and/or quality of pre-K programming using the grant monies. For example, Massachusetts, Tennessee, and Virginia planned to expand access to high quality programs in specific high-needs communities. Illinois, Michigan, and Wisconsin proposed to enhance integration and collaboration with other state and local agencies serving pre-K students and their families. Several states also proposed to increase quality and alignment of staff professional development (Massachusetts, Ohio, and Virginia), to improve data collection processes and use of data to inform programming (Massachusetts, Ohio, Virginia, and Wisconsin), or to create or improve statewide early learning standards (Massachusetts and Ohio).
Eligibility. Eligibility criteria vary across the ten states, although the child’s age is a factor in all states. All ten states offer services for children who are at least four years old (who are not yet kindergarten-eligible), with some extending services to three-year-olds (Illinois, Nebraska, and Ohio). In Massachusetts, children as young as two years and nine months are eligible (Barnett et al., 2016). Three states, including Georgia, Massachusetts, and Wisconsin, do not have any additional eligibility requirements beyond the age of the child. The other seven states include factors such as family income (as measured by a certain percentage of the FPL or eligibility for free/reduced price lunch or Medicaid) or student/family characteristics (e.g., homelessness, English learner status, disability, teen parents, or parents who did not finish high school) among their eligibility or priority criteria. States that utilize priority criteria (Illinois and Tennessee) technically do not limit eligibility for students who meet age requirements; limited funding restricts enrollment to prioritized students/families with certain risk factors. Some states (Illinois, Michigan, and Virginia) allow for local choice in determining eligible children based on certain risk factors. Only South Carolina and Indiana specify residency requirements for eligibility. Similar to the other states, Indiana’s other eligibility criteria include the child’s age (four years by August 1 and not yet kindergarten-eligible) and the family’s income (below 127% of the FPL). Table 1 depicts the eligibility criteria across all ten states.
Program quality. All states have established certain quality standards or guidelines for pre-K program service providers, and these vary somewhat across the ten states. Nebraska, Tennessee, Virginia and Wisconsin have staffing and/or program quality standards codified in their state statutes. Georgia, Illinois, and South Carolina require programs to be licensed by a state agency, and Massachusetts requires programs outside of public schools to be accredited by a national accrediting organization (e.g., NAEYC). Requirements for staff vary across the ten states, as well; all require lead teachers to have at least a certification or Associate’s degree in early childhood education, while some require teachers to have a valid state teaching license (Illinois, Michigan, Nebraska, Wisconsin) or to have at least a Bachelor’s degree in a field related to early childhood education (Georgia, Massachusetts, Virginia). Most states have established the maximum staff to student ratio in their state-funded pre-K programs, with some having different ratios for different ages of students (e.g., Michigan, Ohio, and Indiana). Wisconsin has recommended guidelines for acceptable staff to student ratios but allows for these to be determined locally.
Most of the states (Georgia, Illinois, Massachusetts, South Carolina, Tennessee, Virginia, and Wisconsin) have developed early learning standards to inform the curricula for pre-K programs and the other three states require curricula to be developmentally appropriate and research-based. In all states except Ohio and Tennessee, some form of assessment is mandated to monitor students’ progress, and in many states, programs can select the instrument to use for assessment (e.g., PALS-pre-K, TS-GOLD, Woodcock-Johnson III Achievement Battery). All states conduct some form of quality monitoring for their pre-K programs, with most states requiring yearly site visits, and many states utilize research-based quality improvement rating systems, such as CLASS or ECERS-R. In Virginia, desk monitoring of program data and documentation takes the place of site visits. Table 2 depicts program quality standards and measures of effectiveness for all ten states.
HIGHLIGHTS AND TRENDS ACROSS STATES

12 Indiana University | Center for Evaluation & Education Policy
TABLE 1. ELIGIBILITY REQUIREMENTS FOR STATE-FUNDED PRE-K PROGRAMS, 2014-2015
State Age of Student Family income proxies
Student factors
Parent factors
Locality factors Other
Georgia 4 yrs. by Sept. 1 Universal
Illinois3 3-5 yrs. and not K eligible by Sept. 1 400% FPL HL, FC, EL, TP, HS Community choice in criteria
Massachusetts
2 yrs, 9 mo to kindergarten eligibility age, which is locally determined
N/A, Programs must be able to serve children with income levels at or below 85% median income
Universal
Michigan 4 yrs. by Sept. 1 250% FPL EL Children prioritized based on risk factors by local personnel
Nebraska
3 yrs. to kindergarten entrance age (5 yrs. by July 31)
FRL DD, EL, BW TP, HS
At least 70% of state funding must support children with one or more identified risk factors.
Ohio 3 or 4 yrs.
Free for families up to 100% FPL, families 101-200% FPL pay on sliding scale, families over 200% FPL pay full tuition
In FY 2017, only four-year-olds funded for early childhood education, other ages (3-5) can use pre-K SPED
South Carolina 4 yrs. by Sept. 1 185% FPL (Medicaid)
70% federal poverty index
Tennessee 4 yrs. by Aug. 31 FRL SPED, EL, FC
Community choice
At risk of abuse or neglect
Military parent killed in action, MIA, or POW
Virginia 4 yrs. by Sept. 30 200% FPLHL; SPED (may by 350% FPL)
HS Community choice in criteria
Wisconsin 4 yrs. by Sept. 1 Universal
Indiana 4 yrs. by Aug. 1 < 127% FPL
Reside in Allen, Jackson, Lake, Marion, or Vanderburgh county
Family income proxies include the family’s poverty level as determined by a percentage of the FPL; eligibility for Medicaid or the Free/Reduced-priced Lunch program (FRL)Student factors include student-level traits such as premature birth or low birth weight (BW), disability or developmental delay (DD or SPED), English learner status (EL), homelessness (HL), or status in a foster care system (FC)Parent factors include parent-level traits, such as teen parents (TP), parents without a high school diploma (HS)Locality factors include geographic location, district/locality poverty index
3 Illinois operates a universal program pre-school program, with priority for a-risk children. However, the state has yet to allocate sufficient funding for non-at-risk children to be served. Eligibility requirements, other than age, listed on the table are those for priority status.
Source: NIEER State of Preschool Yearbooks 2003-2015; See References by state for additional sources.

13
TABLE 2. QUALITY STANDARDS AND MEASURES OF PROGRAM EFFECTIVENESS FOR STATE-FUNDED PRE-K PROGRAMS, 2014-20154
4 Please see Appendix for a glossary of acronyms used in this table.5 States with assessments listed specify one or more required by state law/regulatory guidance; those listing “research-based authentic assessments” allow for local choice.6 Appendix includes a list of research-based authentic assessments commonly used in pre-K programs.7 These are recommended guidelines, staff to student ratios are locally determined.
Source: NIEER State of Preschool Yearbooks 2003-2015; See References by state for additional sources.
State Accreditation Staff Training/Licensing Learning Standards/Curriculum Staff-to-Child Ratio Assessments5 Quality Monitoring
Georgia
Licensed by GA Dept. of Early Care & Learning (Bright from the Start)
Lead teacher: BA in ECE or related degree or certification Assistant teacher: AA credential or equivalent
State preapproved curricula Georgia Early Learning and Development Standards
1:11 WSS Site visits and other types of monitoring; CLASS
Illinois
Licensed by Dept. of Children & Family Services (for childcare centers)
Teachers: professional educator license w/ ECE endorsement Assistant teacher: current, registered paraprofessional approval
Curriculum aligned to IL Early Learning & Development Standards (IELDS)
1:10Research-based authentic assessments6
Site visits (3 year basis): ECERS-R and ISBE Early Childhood Block Grant 3-5 Compliance checklist
Massachusetts
Group child care programs: NAEYC or NEASC Family child care providers: NAFCC
All teachers: ECC Public site teachers: BA Nonpublic site teachers: No degree requirement
Early Childhood Program Standards and Guidelines for Preschool Learning Experiences
1:7-10One of the following: WSS; COR; CCDC; ASQ
Site visits and other types of monitoring; QRIS (voluntary)
Michigan N/A
Teacher: valid MI teaching certificate with ECE or Early Childhood-General and Special Education endorsement or BA in EE or CD with focus in teaching pre-K Asst. teacher must have CDA or AA in ECE, CD or equivalent
Comprehensive learning standards Research-validated curriculum which can include: -Creative Curriculum -High Scope Early Childhood Curriculum Combinations of other curricula
1:8 (four-year-olds only)
Assessments inform all areas of the ECSQ-PK; research-based authentic assessments
Site visits and other types of monitoring; Great Start to Quality system
Nebraska
Compliance with Rule 11 Regulations for Early Childhood Education Grant Programs
Teacher: NE teaching certificate with endorsement in ECE, ECSE, or ECI Paraeducators: CDA, NE teaching certificate with K-6 endorsement, 12 hours of credit in child development or ECE
Developmentally and culturally appropriate curriculum, practices, and assessment
1:10 TS-GOLD
Site visits to selected programs, periodic program evaluations required; ECERS-R, ITERS-R, CLASS, HoVRS
Ohio N/A
Teacher: AA in approved field of study Asst. teacher: HS diploma or equivalent
Comprehensive learning standards
three-year-olds: 1:12 four-year-olds: 1:14 N/A
Site visits and other types of monitoring Rating system called Step Up to Quality
South Carolina
Licensed by SC Dept. of Social Services (for providers outside of public schools)
Teacher: ECE certification Assistant: HS diploma, minimum 2 yrs. experience, ECD enrollment and completion within 1 year
SC Early Learning Standards 1:10
One of the following: WSS; CCDC; TS-GOLD; COR; Montessori assessment (Montessori programs only)
Annual site visits for Dept. of Social Service-licensed providers, first-year site visits for public school providers
Tennessee
New rules from Public Chapter 703, 2016 will establish “high qualified pre-Kindergarten program” criteria
Teacher: ECE certification Assistant: HS diploma
TN Early Learning Development Standards 1:10 N/A Site visits and other
monitoring, ECERS & ELLCO
VirginiaCompliance w/ staffing standards in Sec. 22.1-199.1C, VA Code
Teacher: BA (for public schools); HS (nonpublic); training in early primary or elementary education
VA Foundation Blocks for Early Learning 1:9 PALS-pre-K Desk monitoring; CLASS,
ERS
Wisconsin
Must meet applicable school district standards under Wis. Stats. § 121.02
Teacher: BA & licensure with Dept. of Public Instruction
Wisconsin Model Early Learning Standards 1:10, 1:13, 1:15
Research-based authentic assessments
Site visits and other monitoring
Indiana
Rating of 3 or 4 on Paths to Quality (NAEYC or NAFCC accreditation at Level 4)
50% of staff have CDA or equivalent, or early childhood degree or equivalent, or have completed 60 hours of training leading to one of these within last three years, at least 50% of staff participate in 20 hrs/year of training focused on early childhood
Planned curriculum that is developmentally appropriate
four-year-olds: 1:12 five-year-olds: 1:157
Assessment appropriate to the curriculum; ISTAR-KR
Site visits and other monitoring

14
GEORGIA
Indiana University | Center for Evaluation & Education Policy
HistoryGeorgia’s pre-K pilot program began in 1992 as a result of the governor’s proposal to create a lottery to fund educational programs, which would specifically support a preschool initiative. In the first year of the program, 750 at-risk four-year-olds were served at 20 sites, supported by $3 million in state funding. Risk factors to determine eligibility for participation in the pre-K program were eligibility for federal assistance programs, such as Medicaid, AFDC, or WIC, residence in subsidized federal housing, or referral by another agency serving children and families. Lottery funds were first used in 1993-1994 to provide pre-K programming, and the program expanded to serve nearly 9,000 at-risk four-year-olds. The program expanded again in 1995, when eligibility became universal for four year old children in Georgia, not just those deemed at-risk. Enrollments continued to grow throughout the late 1990’s and 2000’s (Georgia Department of Early Care and Learning, 2016a).
Unique FeaturesGeorgia is among a few states that fund their pre-K programs primarily through the state lottery, and this funding mechanism is outlined in state statutes. Similar to Wisconsin, pre-K in Georgia is free and open to all four-year-olds, regardless of risk factors. Although the child’s age is the only eligibility requirement, public school-based programs may prioritize students in their attendance zone, and any site may also prioritize access for homeless children or children in the foster care system, at their discretion. As of 2014-2015, 100% of districts in Georgia had pre-K services available (Barnett et al., 2016).
0.0
50.0
100.0
150.0
200.0
250.0
300.0
350.0
400.019
9319
9419
9519
9619
9719
9819
9920
00
200
120
02
200
320
04
200
520
06
200
720
08
200
920
1020
1120
1220
1320
1420
15
$M
illio
ns,
infla
tio
n a
dju
sted
($
20
15)
Total state funding by year
Source: NIEER State of Preschool Yearbooks – 2003-2015; See Georgia Reference List for additional sources. Values for years with missing data not shown in chart.
0
20,000
40,000
60,000
80,000
100,000
0
2,000
4,000
6,000
8,000
10,000E
nro
llmen
t
Per
stu
den
t fu
nd
ing,
$2
015
Per Student Funding Enrollment
Funding per student and total enrollment by year
Source: NIEER State of Preschool Yearbooks – 2003-2015
0
10,000
20,000
30,000
40,000
50,000
60,000
70,000
80,000
90,000
1993
1994
1995
1996
1997
1998
1999
200
020
01
200
220
03
200
420
05
200
620
07
200
820
09
2010
2011
2012
2013
2014
2015
Source: NIEER State of Preschool Yearbooks – 2003-2015; See Georgia Reference List for additional sources. Values for years with missing data not shown in chart.
Total student enrollment by year
The program expanded again in 1995, when eligibility became universal for four year old children in Georgia, not just those deemed at-risk. Enrollments continued to grow throughout the late 1990’s and 2000’s.
Georgia is among a few states that fund their pre-K programs primarily through the state lottery.

15
GEORGIA
Current StatusAs of 2015, Georgia provides $312 million in annual funding for pre-K programs, or $3,880 per child enrolled (Barnett et al., 2016). Enrollment totaled 80,430 in 2015, and services were provided in a mix of public school, center-based and home-based programs, including both private, non-profit and for-profit organizations, for a total of 1,819 providers (Georgia Department of Early Care and Learning, 2016b). About half of classrooms are operated by public school districts. Lead teachers must have a Bachelor’s degree in early childhood education or a related field, and curricula must be approved by the state and based on the Georgia Early Learning and Development Standards (GELDS) (Barnett et al., 2016). Student outcomes are assessed through a formative assessment called the Work Sampling System (WSS), and all indicators assessed align with the GELDS (Georgia Department of Early Care and Learning, 2016d).
100%
No Local Match Required
Percentage of school districts offering state-funded pre-K programs, 2014-2015
Number/Type of Providers: 1819 public school, center, home-based providersSource of State Funding: State lotterySource: Barnett et al., 2016; Georgia Department of Early Care and Learning, 2016b
Timeline of Georgia’s Pre-K Program
Source: NIEER State of Preschool Yearbooks – 2003-2015; See Georgia Reference List for additional sources

16 Indiana University | Center for Evaluation & Education Policy
ILLINOIS
HistoryAs part of school reform legislation in 1985, Illinois established a preschool program for at-risk children, with an initial $12.1 million of funding for FY 1986 provided only to public school districts (Illinois Board of Education [ISBE], 2012). Funding levels and enrollments expanded through the late 1980’s and 1990’s, and state legislation in 1998 combined several early intervention and education programs to form the Early Childhood Block Grant (ISBE, 2016). A two-year pilot program, Preschool for All, was established through legislation in 2006, which provided $45 million in new funds for another 101 preschool programs. After the first two years of the PFA program, the pilot was extended for another two years in 2008 with priority expanding to include students from families whose incomes were up to 400% of the FPL. Technically, all children who meet the age requirement are eligible to enroll in Illinois’s PFA program, but levels of funding limit availability. Thus, priority criteria are utilized to target at-risk students. In 2011, PFA and the Early Childhood Block Grant were combined, and the program is now known as Preschool for All (ISBE, 2012).
Unique FeaturesSimilar to other states, eligibility and priority requirements for students to be served by PFA programs include age, residency, and certain risk factors, such as family income, homelessness, a primary language other than English, teen parents, or parents who have not completed high school. Eligibility criteria may also be prioritized to meet the needs of the community in which a program operates. One aspect of selection for PFA programs in Illinois that differs from other states’ programs is the screening process. A “research-based screening tool” is used to identify children who are prioritized to participate; performance on the screener is used to indicate whether a child is academically “at-risk.” The screening instrument is meant to measure a child’s development in cognitive, academic, social, and motor skill areas, and interviews with parents/guardians are part of the process (ISBE, 2016).
0
10,000
20,000
30,000
40,000
50,000
60,000
70,000
80,000
90,000
100,000
Source: NIEER State of Preschool Yearbooks – 2003-2015; See Illinios Reference List for additional sources
Total student enrollment by year
0.0
50.0
100.0
150.0
200.0
250.0
300.0
350.0
400.0
$M
illio
ns,
infla
tio
n a
dju
sted
($
20
15)
Total state funding by year
Source: NIEER State of Preschool Yearbooks – 2003-2015; See Illinios Reference List for additional sources. Values for years with missing data not shown in chart.
0
20,000
40,000
60,000
80,000
100,000
0
2,000
4,000
6,000
8,000
10,000E
nro
llmen
t
Per
stu
den
t fu
nd
ing,
$2
015
Per student funding, $2015 Enrollment
Funding per student and total enrollment by year
Source: NIEER State of Preschool Yearbooks – 2003-2015
A “research-based screening tool” is used to identify children who are eligible to participate; performance on the screener is used to indicate whether a child is academically “at-risk.”

17
ILLINOIS
Current StatusState funding for PFA in Illinois was approximately $238 million for FY 2015, or $3,161 per child. Enrollment for 2014-2015 was 75,514, and 100% of counties had providers offering PFA programs (Barnett et al., 2016). PFA programs housed in childcare centers must be licensed by the Illinois Department of Children and Family Services, and teachers must be licensed with an endorsement in early childhood education (Early Childhood Block Grant, 2011; Barnett et al., 2016). Curricula must be aligned to the Illinois Early Learning & Development Standards, and program quality is assessed during state monitoring visits using ECERS-R and an ISBE compliance monitoring checklist (ISBE, 2016). Student outcomes are assessed through research-based authentic assessments and student portfolios to track progress (ISBE, 2016).
Illinois was awarded a $52 million Race to the Top-Early Learning Challenge grant in 2013. The priorities identified in the state’s application for this award include enhanced integration of state programs and services for early learning programs, increased collaboration with local communities to serve the most at-risk children, and increasing overall program quality (U.S. DOE, 2016).
100%
No Local Match Required
Percentage of school districts offering state-funded pre-K programs, 2014-2015
Number/Type of Providers: 461 LEAs, family child care homes, public schools, Head Start, private child care and faith-based centersSource of State Funding: Illinois Early Childhood Block Grant (ECBG)Source: Barnett et al., 2016; Illinois State Board of Education, 2012
Illinois was awarded a $52 million Race to the Top-Early Learning Challenge grant in 2013.
Timeline of Illinois’ Preschool for All Program (PFA)
Source: NIEER State of Preschool Yearbooks – 2003-2015; See Illinios Reference List for additional sources

18
MASSACHUSETTS
Indiana University | Center for Evaluation & Education Policy
HistoryAs part of the Massachusetts School Improvement Act of 1985, the state established the Community Partnerships for Children (CPC) initiative, which provided coordination for early care and education programs in communities receiving funding (Barnett et al., 2009). The CPC initiative has been renamed to Preschool Scholarships, and operates alongside the more recently established pilot program. Massachusetts’s Universal Pre-Kindergarten Program (UPK) began as a pilot initiative in 2007, with $4.6 million appropriated by the state legislature. The pilot grants were awarded to providers in a competitive process, and criteria focused on the ability of providers, which could be based in a variety of settings, to provide high-quality and developmentally-appropriate programming in accredited settings (Fountain & Goodson, 2008). Programs that would serve at-risk children and those from low-income families were prioritized for the pilot initiative. The UPK pilot expanded in 2008 with $7.1 million in state funding, and again in 2009 with $10.9 million. For the first round of grant funding, in 2007, 131 programs received grants, and 105 additional sites were awarded grants in 2008 (Fountain & Goodson, 2008). The primary distinction between UPK programs and Preschool Scholarships programs is the program schedule; UPK programs are required to provide access to full-day and full-year programs, whereas Preschool Scholarships programs vary in their hours and months per year of operation (Barnett et al., 2009).
Unique FeaturesThe UPK program focuses on enhancing quality of early childhood settings; as of 2008, all center-based and family home-based providers are required to be accredited by either NAEYC (center-based) or NAFCC (family) and/or have teachers with Bachelor’s degrees and early childhood certifications. Requirements for the program state that grant monies should be used to enhance quality through increased teacher salaries/benefits, training on administering, interpreting, and using assessment data, staff professional development, incorporating
0.0
50.0
100.0
150.0
$M
illio
ns,
infla
tio
n a
dju
sted
($
20
15)
Total state funding by year
Source: NIEER State of Preschool Yearbooks – 2003-2015; See Massachusetts Reference List for additional sources. Please note that funding numbers for 2003-2014 include both CPC and UPK programs.
0
5,000
10,000
15,000
20,000
25,000
0
2,000
4,000
6,000
8,000
10,000
En
rollm
ent
Per
stu
den
t fu
nd
ing,
$2
015
Funding per student and total enrollment by year
Source: NIEER State of Preschool Yearbooks – 2003-2015. Please note that enrollment and funding numbers for 2003-2014 include both CPC and UPK programs.
UPK programs serve children as young as two years, nine months, another feature setting these apart from other states that only serve three- and four-year-olds in their preschool programs.
0
5,000
10,000
15,000
20,000
25,000
Source: NIEER State of Preschool Yearbooks – 2003-2015; See Massachusetts Reference List for additional sources. Please note that enrollment numbers for 2003-2014 include both CPC and UPK programs.
Total student enrollment by year

19
MASSACHUSETTS
comprehensive services, enhancing developmentally appropriate practice, and providing access to full-day/full-year programs (Fountain & Goodson, 2008). Distinct from many other states, programs receiving UPK funding are not required to provide local matching funds. UPK programs serve children as young as two years, nine months, another feature setting these apart from other states that only serve three- and four-year-olds in their preschool programs (Barnett et al., 2016).
Current StatusAs of 2014-2015, Massachusetts’s spending on the UPK program totaled $39.6 million.8 State spending per child enrolled was $5,252, and enrollment in UPK programs totaled 7,540 children. Providers include public schools, private centers, Head Start programs, home-based, and faith-based centers (Barnett et al., 2016). Curricula must align with the Early Childhood Program Standards and Guidelines for Preschool Learning Experiences, both of which are based on standards for pre-K in the Massachusetts Curriculum Frameworks (Fountain & Goodson, 2008). Student outcomes are assessed through instruments such as the Work Sampling System, High Scope Child Observation Record, Creative Curriculum Developmental Continuum, or Ages and Stages Questionnaire (Barnett et al., 2016).
25%
No Local Match Required
Percentage of school districts offering state-funded pre-K programs, 2014-2015
Number/Type of Providers: 224 public schools, private child-care centers, Head Start programs, family child care, and faith-based centersSource(s) of State Funding: Universal pre-Kindergarten (UPK) grants (competitive)Source: Barnett et al., 2016
In 2012, Massachusetts was awarded a three-year, $50 million federal Race to the Top—Early Learning Challenge grant, with goals of developing statewide early learning standards, enhancing use of assessments, increased family engagement, early childhood workforce development, and enhanced quality and use of data systems (U.S. DOE, 2016). They were subsequently awarded a federal Preschool Development-Expansion grant, providing $15 million per year, over five years to expand access, program quality, family engagement, and partnerships in five high-need communities.
Timeline of Massachusetts Universal Pre-K Program (UPK)
Source: NIEER State of Preschool Yearbooks – 2003-2015; See Massachusetts Reference List for additional sources8 Enrollment and funding numbers in charts reflect both CPC and UPK programs; numbers in text reflect only UPK programs

20
MICHIGAN
HistoryThe Michigan School Readiness Program (MSRP) was established in 1985, with $1 million in initial funding and slots for 694 at-risk four-year-olds. The program became permanent in 1987 through state legislation, and funding increased to $2 million in formula funding, with additional competitive grants. In FY 1988, there were 7,718 slots available, and these have continued to increase over the years, along with funding amounts. Expansions have included moving from funding part-time to full-day programs. In 2008-2009, the program’s name was changed to Great Start Readiness Program (GSRP), which is overseen by the Office of Great Start within Michigan’s Department of Education.
Unique FeaturesStarting in 1994-1995, funds were allocated towards a longitudinal evaluation of the program, which was conducted by HighScope Educational Research Foundation and has included several reports through the years. Findings from these which compare a cohort of children who attended the preschool program in 1995-1996 to demographically similar children who did not attend the program showed positive academic and behavioral outcomes for children who attended the program, up to on-time high school graduation (Schweinhart, Xiang, Daniel-Echols, Browning, & Wakabayashi, 2012). Researchers affiliated with HighScope also have provided resources to programs such as curriculum, assessments for children, and program quality assessments.
0
5,000
10,000
15,000
20,000
25,000
30,000
35,000
40,000
Source: NIEER State of Preschool Yearbooks – 2003-2015; See Michigan Reference List for additional sources
Total student enrollment by year
$0
$50
$100
$150
$200
$250
$300
1986
1987
1988
1989
1990
1991
1992
1993
1994
1995
1996
1997
1998
1999
200
020
01
200
220
03
200
420
05
200
620
07
200
820
09
2010
2011
2012
2013
2014
2015
Total state funding by year
Source: NIEER State of Preschool Yearbooks – 2003-2015; See Michigan Reference List for additional sources
0
10,000
20,000
30,000
40,000
50,000
0
2,000
4,000
6,000
8,000
10,000
En
rollm
ent
Per
stu
den
t fu
nd
ing,
$2
015
Per student funding, $2015 Enrollment
Funding per student and total enrollment by year
Source: NIEER State of Preschool Yearbooks – 2003-2015
Indiana University | Center for Evaluation & Education Policy
In January 2014, Michigan was awarded a $51.7 million Race to the Top-Early Learning Challenge competitive federal grant. Over the grant period of four years, the Office of Great Start proposed to increase access to high-quality programs for at-risk children, implement and coordinate an integrated system of programs, and continue to evaluate and rate program quality (U.S. DOE, 2016).

21
MICHIGAN
Current StatusAs of 2014-2015, the GSRP served 37,112 four-year-olds in Michigan, with a total of $239 million in state funding. State spending per child is $6,447, and a local match is required (Barnett et al., 2016). Providers include school districts and community-based organizations, and 73% of school districts offer the program. All providers must attain a 3-star or higher rating in Michigan’s Great Start to Quality system. Eligibility requirements include the child’s age (four years by September 1), family income (250% of FPL), and English learner status (primary language other than English). Children may also be prioritized for enrollment based on other risk factors determined locally. The lead teacher must have a valid Michigan teaching certificate with an early childhood endorsement or a Bachelor’s degree in early childhood or child development, and programs can choose among research-based curricula, including Creative Curriculum or HighScope’s Early Childhood Curriculum (Wechsler et al., 2016). Assessment of children must provide information for all areas in the Early Childhood Standards of Quality for Pre-Kindergarten (ECSQ-PK), and a variety of developmental screeners may be selected.
73%
Local Match Required
Percentage of school districts offering state-funded pre-K programs, 2014-2015
Number/Type of Providers: 480 school districts and community-based organizations, such as child care centers and Head Start through Intermediate School DistrictsSource(s) of State Funding: State General Revenue Fund through appropriation in formula funding and competitive grantsSource: Barnett et al., 2016; The Center for Early Education Evaluation at HighScope, 2016
Timeline of Michigan’s Great Start Readiness Program (GSRP)
Source: NIEER State of Preschool Yearbooks – 2003-2015; See Michigan Reference List for additional sources
22
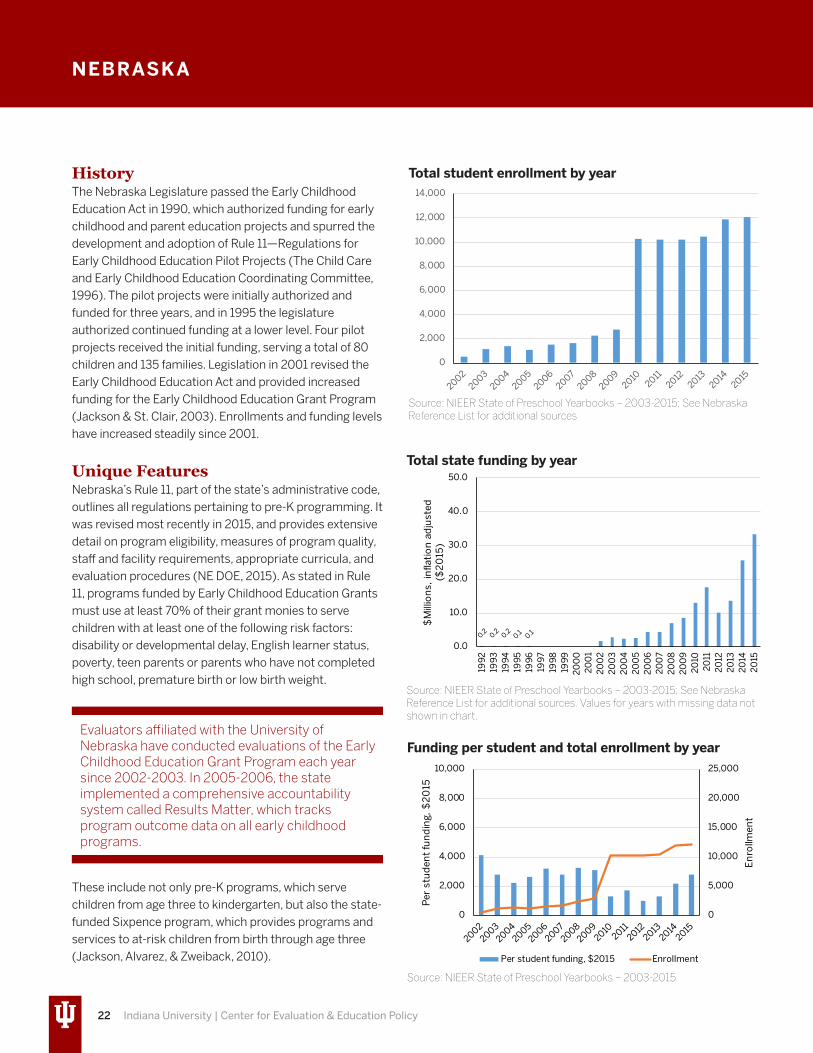
HistoryThe Nebraska Legislature passed the Early Childhood Education Act in 1990, which authorized funding for early childhood and parent education projects and spurred the development and adoption of Rule 11—Regulations for Early Childhood Education Pilot Projects (The Child Care and Early Childhood Education Coordinating Committee, 1996). The pilot projects were initially authorized and funded for three years, and in 1995 the legislature authorized continued funding at a lower level. Four pilot projects received the initial funding, serving a total of 80 children and 135 families. Legislation in 2001 revised the Early Childhood Education Act and provided increased funding for the Early Childhood Education Grant Program (Jackson & St. Clair, 2003). Enrollments and funding levels have increased steadily since 2001.
Unique FeaturesNebraska’s Rule 11, part of the state’s administrative code, outlines all regulations pertaining to pre-K programming. It was revised most recently in 2015, and provides extensive detail on program eligibility, measures of program quality, staff and facility requirements, appropriate curricula, and evaluation procedures (NE DOE, 2015). As stated in Rule 11, programs funded by Early Childhood Education Grants must use at least 70% of their grant monies to serve children with at least one of the following risk factors: disability or developmental delay, English learner status, poverty, teen parents or parents who have not completed high school, premature birth or low birth weight.
These include not only pre-K programs, which serve children from age three to kindergarten, but also the state-funded Sixpence program, which provides programs and services to at-risk children from birth through age three (Jackson, Alvarez, & Zweiback, 2010).
NEBRASKA
Indiana University | Center for Evaluation & Education Policy
0
2,000
4,000
6,000
8,000
10,000
12,000
14,000
Source: NIEER State of Preschool Yearbooks – 2003-2015; See Nebraska Reference List for additional sources
Total student enrollment by year
0.0
10.0
20.0
30.0
40.0
50.019
9219
9319
9419
9519
9619
9719
9819
9920
00
200
120
02
200
320
04
200
520
06
200
720
08
200
920
1020
1120
1220
1320
1420
15
$M
illio
ns,
infla
tio
n a
dju
sted
($
20
15)
Total state funding by year
Source: NIEER State of Preschool Yearbooks – 2003-2015; See Nebraska Reference List for additional sources. Values for years with missing data not shown in chart.
0
5,000
10,000
15,000
20,000
25,000
0
2,000
4,000
6,000
8,000
10,000
En
rollm
ent
Per
stu
den
t fu
nd
ing,
$2
015
Per student funding, $2015 Enrollment
Funding per student and total enrollment by year
Source: NIEER State of Preschool Yearbooks – 2003-2015
Evaluators affiliated with the University of Nebraska have conducted evaluations of the Early Childhood Education Grant Program each year since 2002-2003. In 2005-2006, the state implemented a comprehensive accountability system called Results Matter, which tracks program outcome data on all early childhood programs.

23
NEBRASKA
Current StatusIn 2014-2015, Nebraska spent $33 million on the Early Childhood Education Grant Program, or $2,759 per child, with a local match of funding required (Barnett et al., 2016). Total enrollment in all programs was 12,073 in 2014-2015 and services were provided in 188 public school districts or Educational Service Units (ESUs) as of 2013-2014 (Jackson, 2014). Teachers must have a Nebraska teaching certificate with an endorsement in early childhood education or equivalent. Program quality is measured using ECERS-R, and student outcomes are assessed using TS-GOLD. As stated above, compliance with Rule 11 Regulations for Early Childhood Education Grant Programs for curricula and program quality is required, which “reflects research-based elements of quality early learning and childhood education programs,” (NE DOE, 2015).
84%
Local Match Required
Percentage of school districts offering state-funded pre-K programs, 2014-2015
Number/Type of Providers: 188 public school districts or Educational Service Units (ESUs)Source of State Funding: Early Childhood Education Grant ProgramSource: Barnett et al., 2016; Jackson, 2014
Timeline of Nebraska’s Early Childhood Education Grant Program
Source: NIEER State of Preschool Yearbooks – 2003-2015; See Nebraska Reference List for additional sources

24 Indiana University | Center for Evaluation & Education Policy
OHIO
HistoryAfter four years in a pilot phase, Ohio officially established its Public Preschool Program in 1990. In the same year, the state began providing state general revenue funds to Head Start providers, with the goal of offering services to more low-income children (Schilder, Kimura, Elliot, & Curenton, 2011). Between 1990 and 2000, funding for both the Public Preschool Program and state supplemental funds for Head Start increased. The legislature reduced state funding for the Head Start programs in 2001, and began using Temporary Assistance for Needy Families funds to supplement Head Start funding in 2003, which resulted in declining enrollments in these programs during subsequent years (Schilder et al., 2011). State funding increased again in 2008 and eligibility expanded. However, budget cuts occurred again in 2009, resulting in a reduction in state spending per child between 2008 and 2010 (Barnett et al., 2016).
Unique FeaturesIn Ohio, state funds are provided for both preschool programs administered through the Ohio Department of Education (Early Childhood Education), and preschool childcare programs. In 2014-2015, the most recent year for which data are available, approximately 34,000 preschool-aged children attended these highly-rated preschool childcare programs, nearly triple the number served in the Early Childhood Education program (Barnett et al., 2016).
Current StatusIn 2014-2015, state funding for the Early Childhood Education program was $44 million, with an enrollment of 11,090, or $4,000 per child. Currently, three- and four-year-olds are eligible to participate, but beginning in 2017, only four-year-olds will be funded (Barnett et al., 2016). Services are provided in 61% of school districts, and providers include the public school districts, highly-rated childcare providers (both public and private), and charter
0
2,000
4,000
6,000
8,000
10,000
12,000
Source: NIEER State of Preschool Yearbooks – 2003-2015; See Ohio Reference List for additional sources
Total student enrollment by year
0.0
10.0
20.0
30.0
40.0
50.0
$M
illio
ns,
infla
tio
n a
dju
sted
($
20
15)
Total state funding by year
Source: NIEER State of Preschool Yearbooks – 2003-2015; See Ohio Reference List for additional sources
0
5,000
10,000
15,000
20,000
25,000
0
2,000
4,000
6,000
8,000
10,000
En
rollm
ent
Per
stu
den
t fu
nd
ing,
$2
015
Per student funding, $2015 Enrollment
Funding per student and total enrollment by year
Source: NIEER State of Preschool Yearbooks – 2003-2015
The program is free for children whose families are at or below 100% of the FPL, families who fall between 101% and 200% of the FPL pay tuition on a sliding scale, and families with incomes above 200% FPL pay full tuition (Barnett et. al., 2016; ODE, 2016a).

25
OHIO
schools (State of Ohio, 2015). Programs are assessed on a tiered quality rating and improvement system scale that ranges from 1 star (worst) to 5 stars (best). The domains in which the programs are evaluated are: (a) learning and development, (b) administrative and leadership practices, (c) staff qualifications and professional development, and (d) family and community partnerships (ODOE & ODJFS, 2013). Lead teachers should have an Associate’s degree from an accredited institution in an approved field of study (Barnett et al., 2016). Student outcomes are evaluated through the Ready for Kindergarten assessment which includes mathematics, social foundations, language, literacy, physical well-being, and motor development (ODOE, 2016b).
In 2012, Ohio was awarded a $70 million, three-year federal Race to the Top—Early Learning Challenge grant. With these monies, they proposed to develop high quality early learning and development standards to align with existing guidelines and standards for birth through kindergarten programs, to enhance the use of comprehensive assessment systems, including kindergarten readiness assessments, align professional development systems for early childhood educators, and enhance early learning data systems (U.S. DOE, 2012).
61%
No Local Match Required
Percentage of school districts offering state-funded pre-K programs, 2014-2015
Number/Type of Providers: 1,630 public school districts, highly rated child-care providers, charter schools (both public and private)Source of State Funding: State General Revenue FundSource: Barnett et al., 2016; State of Ohio, 2015
Timeline of Ohio’s Public Preschool Program
Source: NIEER State of Preschool Yearbooks – 2003-2015; See Ohio Reference List for additional sources

26
HistorySouth Carolina’s first preschool initiative began in 1984 as a result of the Education Improvement Act. This program provides funds to school districts to implement half-day education programs for at-risk four-year-olds. A second preschool program was initiated in 2006, resulting from a school funding equity lawsuit. One outcome of the court’s decision in Abbeville Co. Sch. Dist. v. South Carolina was that full-day four-year-old pre-Kindergarten (4K) should be implemented for at-risk children in the eight plaintiff school districts (SC Education Oversight Committee, 2008). Thus began the Child Development Education Pilot Program (CDEPP), which was initially funded at $23.6 million per year for the first two years. Both public schools and private centers house CDEPP classrooms, and enrollments have grown steadily since the program’s inception. Additional funding for original CDEPP districts and expansion to new districts, totaling $48.8 million, was allocated in 2013-2014, 76% of which was allotted for public school programs, with the remaining 24% for private centers (SC Education Oversight Committee, 2014).
Unique FeaturesEligibility requirements for participation in CDEPP have expanded over the years. At the program’s inception, eligibility was limited to at-risk four-year-olds residing in the districts identified in the aforementioned lawsuit, with “at-risk” children defined as those who were eligible for the federal free/reduced lunch program or Medicaid, or who had a documented developmental delay. When additional funding was allocated in 2013-2014, eligibility expanded beyond the original districts to include at-risk four-year-olds residing in districts with a poverty index of 75% or greater, which added 17 districts. In 2014-2015 eligibility expanded again, to include at-risk four-year-olds in districts with a poverty index of 70% or greater (SC Education Oversight Committee, 2016). CDEPP continues to operate alongside the state’s half-day 4K program,
SOUTH CAROLINA
Indiana University | Center for Evaluation & Education Policy
South Carolina’s Child Development Education pilot program was initiated in 2006, with the purpose of serving at-risk four-year-olds in Plaintif School Districts identified in a school funding equity lawsuit.
0
2,000
4,000
6,000
8,000
10,000
12,000
2007 2008 2009 2010 2011 2012 2013 2014 2015
Source: NIEER State of Preschool Yearbooks – 2003-2015; See South Carolina Reference List for additional sources
Total student enrollment by year
0.0
10.0
20.0
30.0
40.0
50.0
2007 2008 2009 2010 2011 2012 2013 2014 2015
$M
illio
ns,
infla
tio
n a
dju
sted
($
20
15)
Total state funding by year
Source: NIEER State of Preschool Yearbooks – 2003-2015; See South Carolina Reference List for additional sources
0
5,000
10,000
15,000
20,000
25,000
0
2,000
4,000
6,000
8,000
10,000
2007 2008 2009 2010 2011 2012 2013 2014 2015
En
rollm
ent
Per
stu
den
t fu
nd
ing,
$2
015
Funding per student, $2015 Enrollment
Funding per student and total enrollment by year
Source: NIEER State of Preschool Yearbooks – 2003-2015

27
SOUTH CAROLINA
which serves more children, but is offered in only 26% of school districts, as compared with 74% of school districts offering CDEPP (Barnett et. al., 2016).
Current StatusAll CDEPP providers, public and private, must be licensed by the South Carolina Department of Social Services, and the South Carolina Department of Education oversees public school providers, while the Office of First Steps oversees qualified non-public providers. The projected total number of CDEPP classrooms for 2015-2016 was 772, which includes 570 public school classrooms and 202 private center classrooms (SC Education Oversight Committee, 2016). Enrollment for 2014-2015 was 10,655 (Barnett et. al., 2016), and was projected to be up to 13,771 for 2015-2016 (SC Education Oversight Committee, 2016). Total state funding for 2014-2015 was $47.2 million, or $4,429 per child (Barnett et. al., 2016). The South Carolina Education Oversight Committee has conducted regular evaluations of CDEPP, in 2007, 2008, 2010, 2014, and 2016, and an Early Childhood Work Group is currently reviewing assessments for program quality. A variety of tools to measure student progress are used, and the South Carolina Early Learning Standards guide the curriculum.
74%
No Local Match Required
Percentage of school districts offering state-funded pre-K programs, 2014-2015
Number/Type of Providers: 702 public schools and private center providersSource of State Funding: State General Revenue FundSource: Barnett et al., 2016; South Carolina Education Oversight Committee, 2016
Timeline of South Carolina’s Child Development Education Pilot Program (CDEPP)
Source: NIEER State of Preschool Yearbooks – 2003-2015; See South Carolina Reference List for additional sources

28 Indiana University | Center for Evaluation & Education Policy
TENNESSEE
HistoryAs a result of state legislation passed in 1996, Tennessee allocated approximately $3 million in 1998 to fund ten early childhood pilot programs serving 600 at-risk three- and four-year-olds. Initially, only children living below the FPL qualified for the pilot program, but legislation in 2003 expanded eligibility to include children who were eligible for the free or reduced price lunch program. During these first several years, state funding increased from $3 million to $6 million (2000-2002), and again to $10 million (2003-2004). Enrollments also increased, from 600 in FY 1999 to 3,000 in FY 2005. In 2005, the Voluntary Pre-Kindergarten (VPK) Act passed, increasing state funding for high quality programs to serve at-risk children. Subsequently, from FY 2006 to FY 2009, $25 million per year in lottery funds supplemented state funding for pre-K. By 2009, enrollment had reached over 18,000 children in 934 classrooms, reaching students in 94 out of 95 Tennessee counties (Offices of Research and Education Accountability, 2009; Strategic Research Group, 2009).
Unique FeaturesAccording to state law, all VPK programs are tuition-free for students, and enrollments are based on a three-tiered priority system. Students with first priority for enrollment are those who are eligible for free or reduced-price lunch. The second priority tier includes students with disabilities, ELL students, students in state custody, or students who have been abused or neglected. The third priority tier allows for some local input for eligibility and enrollment. If there is still space in the program after students have been identified through tiers one and two, the local district’s Community Pre-K Advisory Council (C-PAC) may enroll additional children who are unserved or underserved in their community (TN Department of Education, 2016).
0
2,000
4,000
6,000
8,000
10,000
12,000
14,000
16,000
18,000
20,000
Source: NIEER State of Preschool Yearbooks – 2003-2015; See Tennessee Reference List for additional sources
Total student enrollment by year
0.0
10.0
20.0
30.0
40.0
50.0
60.0
70.0
80.0
90.0
100.0
$M
illio
ns,
infla
tio
n a
dju
sted
($
20
15)
Total state funding by year
Source: NIEER State of Preschool Yearbooks – 2003-2015; See Tennessee Reference List for additional sources
0
5,000
10,000
15,000
20,000
25,000
0
2,000
4,000
6,000
8,000
10,000
En
rollm
ent
Per
stu
den
t fu
nd
ing,
$2
015
Per student funding, $2015 Enrollment
Funding per student and total enrollment by year
Source: NIEER State of Preschool Yearbooks – 2003-2015
All VPK programs are tuition-free for students, and enrollments are based on a three-tiered priority system. Students with first priority for enrollment are those who are eligible for free or reduced-price lunch. The second priority tier includes students with disabilities, ELL students, students in state custody, or students who have been abused or neglected. The third priority tier allows for some local input for eligibility and enrollment.

29
TENNESSEE
Current StatusEnrollment in VPK programs has dropped somewhat since peaking at over 18,600 in 2013. According to the most recent data, enrollment was 16,274 in 2015, with a total of $85 million in state funding, or $5,219 per child (Barnett et al., 2016). Lottery proceeds of up to $25 million may still be appropriated to education, but recently these provide funding to afterschool programs, rather than the VPK. Recent legislation in 2016 outlines that criteria for “high qualified pre-Kindergarten programs” are to be established and that programs should implement plans for parent engagement and professional development for teachers. Currently, lead teachers must be certified in early childhood education and assistants must have a high school diploma. There are no specific state requirements for assessing student outcomes (Lipsey, Farran, & Hofer, 2015).
96%
Local Match Required
Percentage of school districts offering state-funded pre-K programs, 2014-2015
Number/Type of Providers: 935 classrooms that are partnerships between local school systems and non-profit and for profit providersSource of State Funding: General FundSource: Barnett et al., 2016; Tennessee Department of education, n.d.
Tennessee was awarded a three-year federal Preschool Development Grant—Expansion Grant, in the amount of $17.5 million for the first year (2015). With these funds, the state proposes to increase both access to and quality of the state-funded pre-K program specifically within two large high-needs communities.
Timeline of Tennessee’s Voluntary pre-Kindergarten Program (VPK)
Source: NIEER State of Preschool Yearbooks – 2003-2015; See Tennessee Reference List for additional sources

30
VIRGINIA
Indiana University | Center for Evaluation & Education Policy
HistoryVirginia’s General Assembly first appropriated state funds ($9.3 million) in FY 1996 for the At-Risk Four-Year-Old Program, also known as the Virginia Preschool Initiative (VPI) (Virginia Department of Education, 2015). Funding and enrollments increased steadily through the decade following, with a majority of VPI services provided through public schools. For FY 2008, the General Assembly allocated an additional $2.6 million for a pilot initiative to expand access to at-risk four-year-olds who were not already served through VPI. The pilot program provided funding to localities to enhance partnerships among local school districts, community organizations, Head Start programs, and private or family child-care centers, in order to increase access and efficient use of resources. The one-year pilot provided VPI services to 2% more at-risk children statewide, and 10% more in the 12 participating localities (Bradburn, Hawdon, & Sedgwick, 2008).
Unique FeaturesThe main factors used to identify “at-risk” children who are eligible for VPI services are the child’s age (four years by September 30) and family income (at or below 200% of the FPL, or below 350% for children with special needs or disabilities). However, communities may choose additional risk factors to incorporate into their eligibility criteria, which can include parents who are high school dropouts, parent incarceration, military deployment, status in the foster care system, English language proficiency, or homelessness (Bradburn, Hawdon, & Sedgwick, 2008; VDOE, 2016b).
Current StatusAs of 2014-2015, state spending on VPI totaled $68.3 million, or $3,742 per child (Barnett et al., 2016). For the biennium beginning in 2016, the General Assembly has increased VPI funding to $70.7 million for the first year and $70.9 million for the second year, all of which is from
0
2,000
4,000
6,000
8,000
10,000
12,000
14,000
16,000
18,000
20,000
Source: NIEER State of Preschool Yearbooks – 2003-2015; See Virginia Reference List for additional sources
Total student enrollment by year
0.0
10.0
20.0
30.0
40.0
50.0
60.0
70.0
80.0
90.0
100.0
$M
illio
ns,
infla
tio
n a
dju
sted
($
20
15)
Total state funding by year
Source: NIEER State of Preschool Yearbooks – 2003-2015; See Virginia Reference List for additional sources
0
5,000
10,000
15,000
20,000
25,000
0
2,000
4,000
6,000
8,000
10,000
En
rollm
ent
Per
Stu
den
t Fu
nd
ing,
$2
015
Per student funding, $2015 Enrollment
Funding per student and total enrollment by year
Source: NIEER State of Preschool Yearbooks – 2003-2015
Communities may choose additional risk factors to incorporate into their eligibility criteria, which can include parents who are high school dropouts, parent incarceration, military deployment, status in the foster care system, English language proficiency, or homelessness.

31
VIRGINIA
the Lottery Proceeds Fund (VDOE, 2016a). Local match of state funding (up to 50%) is required and is based on a locality’s ability to pay. Statewide enrollment in VPI programs in 2014-2015 totaled 18,250, and services were provided in 90% of school districts (Barnett et al., 2016). Teachers in public school settings must have a Bachelor’s degree; in nonpublic settings they must have a high school diploma and training in early primary or elementary education. Programs use PALS-Pre-K to assess students in the fall and spring of each year and curricular standards are based on Virginia’s Foundation Blocks for Early Learning. Program quality is assessed using CLASS or ERS, and participation in Virginia’s QRIS is voluntary.
90%
Local Match Required
Percentage of school districts offering state-funded pre-K programs, 2014-2015
Number/Type of Providers: 121 local school districts, community organizations, Head Start programs and private or family child-care centersSource(s) of State Funding: State lotterySource: Barnett et al., 2016; Virginia Department of Education, 2015
In 2015, the Virginia Department of Education was awarded a $17.5 million federal Preschool Expansion Grant. This award has spurred the creation of VPI+, which will increase access to preschool services and quality of those services in 11 “high-needs” school divisions (Virginia Office of the Governor, 2014). The grant monies will also be applied towards strengthening preschool data systems, quality improvement systems, evaluation, and staff training (U.S. DOE, 2014).
Timeline of Virginia’s Preschool Initiative (VPI)
Source: NIEER State of Preschool Yearbooks – 2003-2015; See Virginia Reference List for additional sources
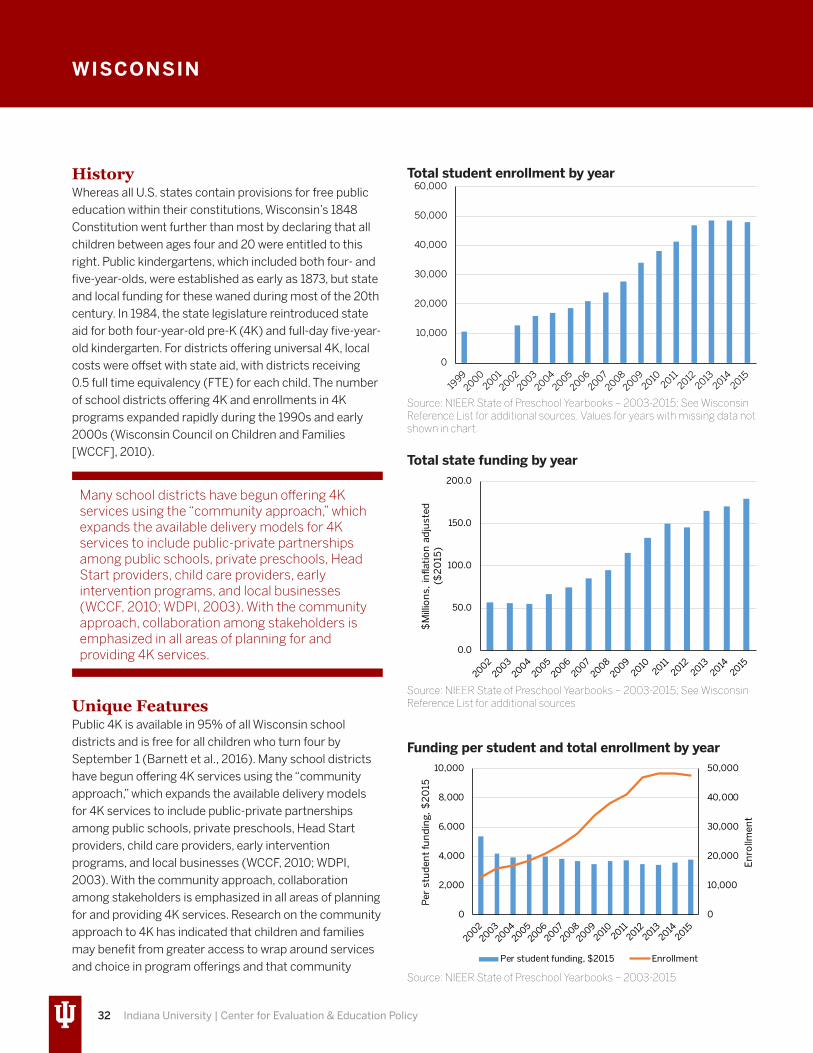
32
HistoryWhereas all U.S. states contain provisions for free public education within their constitutions, Wisconsin’s 1848 Constitution went further than most by declaring that all children between ages four and 20 were entitled to this right. Public kindergartens, which included both four- and five-year-olds, were established as early as 1873, but state and local funding for these waned during most of the 20th century. In 1984, the state legislature reintroduced state aid for both four-year-old pre-K (4K) and full-day five-year-old kindergarten. For districts offering universal 4K, local costs were offset with state aid, with districts receiving 0.5 full time equivalency (FTE) for each child. The number of school districts offering 4K and enrollments in 4K programs expanded rapidly during the 1990s and early 2000s (Wisconsin Council on Children and Families [WCCF], 2010).
Unique FeaturesPublic 4K is available in 95% of all Wisconsin school districts and is free for all children who turn four by September 1 (Barnett et al., 2016). Many school districts have begun offering 4K services using the “community approach,” which expands the available delivery models for 4K services to include public-private partnerships among public schools, private preschools, Head Start providers, child care providers, early intervention programs, and local businesses (WCCF, 2010; WDPI, 2003). With the community approach, collaboration among stakeholders is emphasized in all areas of planning for and providing 4K services. Research on the community approach to 4K has indicated that children and families may benefit from greater access to wrap around services and choice in program offerings and that community
Indiana University | Center for Evaluation & Education Policy
WISCONSIN
Many school districts have begun offering 4K services using the “community approach,” which expands the available delivery models for 4K services to include public-private partnerships among public schools, private preschools, Head Start providers, child care providers, early intervention programs, and local businesses (WCCF, 2010; WDPI, 2003). With the community approach, collaboration among stakeholders is emphasized in all areas of planning for and providing 4K services.
0
10,000
20,000
30,000
40,000
50,000
60,000
Source: NIEER State of Preschool Yearbooks – 2003-2015; See Wisconsin Reference List for additional sources. Values for years with missing data not shown in chart.
Total student enrollment by year
0.0
50.0
100.0
150.0
200.0
$M
illio
ns,
infla
tio
n a
dju
sted
($
20
15)
Total state funding by year
Source: NIEER State of Preschool Yearbooks – 2003-2015; See Wisconsin Reference List for additional sources
0
10,000
20,000
30,000
40,000
50,000
0
2,000
4,000
6,000
8,000
10,000
En
rollm
ent
Per
stu
den
t fu
nd
ing,
$2
015
Per student funding, $2015 Enrollment
Funding per student and total enrollment by year
Source: NIEER State of Preschool Yearbooks – 2003-2015

33
WISCONSIN
partners are often able to provide greater opportunities for serving children via sharing resources (WDPI, 2003). The number of public school districts utilizing the community approach has increased steadily since 2001-2002, with 113 districts in 2015-2016 (WDPI, 2016).
Current StatusAs of the 2014-2015 school year, state spending on 4K in Wisconsin totaled $179 million, or approximately $3,741 per child. State equalization aid is the major source of funding; districts receive 0.5 FTE per child if they offer programming for a minimum of 437 hours per year. Teachers must have a Bachelor’s degree and be licensed by the Wisconsin Department of Public Instruction, and curricula are based on the Wisconsin Model Early Learning Standards, most recently revised in 2013. Progress assessments for students are locally determined, and many use the Phonological Awareness Literacy Screening (PALS). For the 2014-2015 school year, 4K enrollment was 47,844 (Barnett et al., 2016), and according to WDPI data, enrollment for 2015-2016 was 49,062.
95%
Local Match Required
Percentage of school districts offering state-funded pre-K programs, 2014-2015
Number/Type of Providers: 399 districts, 114 community approach (public-private partnerships among public schools, private preschools,Head Start providers, child care providers, early intervention programs,and local businesses)Source of State Funding: State General Revenue FundSource: Barnett et al., 2016; Wisconsin Department of Public Instruction, 2016
Wisconsin was awarded a $34 million Race to the Top—Early Learning Challenge grant in 2013. With this federal award, the state proposes to increase access to high-quality 4K, particularly for at-risk students and families, to improve data systems for tracking both program quality and student progress, and to align efforts among early learning and child health/development agencies.
Timeline of Wisconsin’s Four-year-old Kindergarten (4K)
Source: NIEER State of Preschool Yearbooks – 2003-2015; See Wisconsin Reference List for additional sources

34
INDIANA
Indiana University | Center for Evaluation & Education Policy
In order to apply to receive a grant, the child’s family must agree to participate in “family engagement activities” provided by the program, to ensure that their child will attend the program at least 85% of the time, and to enroll their child in kindergarten for the following school year.
HistoryIndiana established its first state funded pilot pre-K program (On My Way Pre-K) for eligible four-year-olds in 2014, to be fully implemented in August of 2015 in five counties: Allen, Jackson, Lake, Marion, and Vanderburgh. The program provides grants to families for their children to access quality pre-K programs. Families are eligible to apply for these grants if they meet the following eligibility requirements: earning less than 127% of the FPL, residing in one of the five pilot counties, agreeing to participate in family engagement activities and meet attendance thresholds, and if their child is four years old by August 1. If a family receives the grant, they decide which service provider the funds should go to and whether they want their child to attend a full or part day program and/or a program that ends with the school year or continues to the summer. Providers can include public and private schools, community-based organizations, faith-based programs, licensed centers and licensed home-based programs. To be eligible to receive state funds, providers must be rated at a Level 3 or Level 4 on Indiana’s Paths to QUALITY scale (IN Family & Social Services Administration, 2015).
Unique FeaturesIn its pilot phase, the On My Way Pre-K program is available only to families residing in five out of Indiana’s 92 counties, which results in only 3% of the state’s school districts offering the program (Barnett et. al, 2016). Eighteen counties were selected as “finalists” for the program, and each of these submitted a statement of consideration. The selection of the five counties that were ultimately chosen was based on the need for the program and “the county’s ability and readiness to meet that need” (IN Family & Social Services Administration, 2014). Eligibility requirements for families, similar to many other states, include family income below a certain threshold and the child’s age. Additionally, in order to apply to receive a grant, the child’s family must agree to participate in “family engagement activities” provided by the program, to ensure that their child will attend the program at least
To be eligible to receive state funds, providers must be rated at a Level 3 or Level 4 on Indiana’s Paths to QUALITY scale.
85% of the time, and to enroll their child in kindergarten for the following school year (IN Family & Social Services Administration, 2015).
Current StatusAs of 2014-2015, Indiana’s On My Way Pre-K programs enrolled 415 students, with total state spending around $1 million, and per-student state spending at $2,588 (Barnett et al, 2016). According to the On My Way Pre-K Program’s 2015 Annual Report, $10 million per year has been appropriated for the program from the state’s General Fund, and pilot programs must match between 10-50% of funds awarded. Enrollment for 2015-2016 in On My Way Pre-K programs across the five counties served totaled 1,585 children, and there are 219 eligible providers, including all provider types (IN Family & Social Services Administration, 2015). Programs are required to assess students twice per year using Indiana Standards Tool for Alternate Reporting of Kindergarten Readiness (ISTAR-KR). An evaluation of the program’s impact is in progress, conducted by faculty at Purdue University (IN Family & Social Services Administration, 2016).
3%
Local Match Required
Percentage of school districts offering state-funded pre-K programs, 2014-2015
Number/Type of Providers: 219 public, private & charter schools, licensed centers & homes, registered ministriesSource of State Funding: General FundSource: Barnett et al., 2016; Indiana Family & Social Services Administration, 2015

35
RECOMMENDATIONS
This section provides recommendations for consideration by policymakers regarding the expansion of state-funded pre-K programs in Indiana. These recommendations are based on the review of scholarship on pre-K programs and findings of the research on state-funded pre-K pilot programs and their expansions in ten states: Georgia, Illinois, Massachusetts, Michigan, Nebraska, Ohio, South Carolina, Tennessee, Virginia, and Wisconsin. The characteristics of state-funded pre-K programs examined for each state included history, funding sources and amounts, provider quality standards and measures of effectiveness, student eligibility requirements, enrollments, and numbers/types of service providers. The recommendations outlined here correspond to the extent possible with these characteristics, comparing Indiana’s current state-funded pre-K program to states where access to and quality of programs are exemplary.
FundingSimilar to Indiana, most of the states examined here provide funding for their pre-K programs via their general revenue funds. States that allotted the highest dollar amounts from their general funds to pre-K programs served the greatest numbers of students in 2014-2015: Illinois ($238 million; 75,154 students), Michigan ($239 million; 37,112 students), and Wisconsin ($179 million; 47,844 students). As this research illuminates, increases in funding levels and enrollments occurred steadily over time in the states examined. Trends in each state generally reveal a correlation between total funding and enrollment, thus increased overall funding for pre-K programs is recommended.
A few states (Georgia, Virginia, and Tennessee) currently or previously have utilized lottery funds in lieu of or in addition to general revenue funds to support their state-funded pre-K programs. Among the ten states examined, Georgia had both the highest total funding amount ($312 million) and the greatest number of students enrolled (80,430) for 2014-2015. Additionally, Georgia’s state-funded pre-K programs are the most accessible among those examined here; available to all four-year-olds in 100% of school districts. As the case of Georgia demonstrates, alternate funding sources, such as lottery funds, may be used to great effect in expanding access to pre-K programs. In the light of these findings policymakers in Indiana should consider exploring sources of funding in addition to the general fund to support expansion of pre-K programs.
EligibilityThe requirement for students to be four years old by a certain date in August or September in order to be eligible to enroll in state-funded pre-K was present in six out of the ten states examined, which is similar to Indiana’s requirement that children must be four by August 1. Eligibility based on family income proxies, such as a specific percentage of the FPL, were also present in Indiana and in most of the ten states. In terms of student eligibility for state-funded pre-K programs, where Indiana differs most starkly from the states on which this research focused is in the limitation of availability of programs only to families residing in five counties (Allen, Jackson, Lake, Marion, and Vanderburgh). This denies access to programs for otherwise-eligible students in all other areas of the state, as evidenced by the fact that only 3% of school districts served students in state-funded pre-K programs in Indiana during 2014-2015 (Barnett et al., 2016). Thus, it is recommended that eligibility for students to access state-funded pre-K programs is expanded to additional Indiana counties.
Some states have eligibility or priority criteria in addition to student age and family income levels, targeting groups that may be at-risk. Examples of these criteria include homelessness, English learner status, disability or developmental delay, premature or low birth weight, parents without a high school diploma, or status in the foster care system. Several states, such as Illinois, Michigan, Tennessee, and Virginia allow for localities to prioritize eligibility for students based on community choice. If access for Indiana students to state-funded pre-K is expanded beyond the five counties currently being served, policymakers should consider including eligibility criteria that would target at-risk children.

36 Indiana University | Center for Evaluation & Education Policy
RECOMMENDATIONS
Program QualityIn most of the states examined in this report, pre-K providers outside of public school settings must be either licensed by a state agency, accredited by a state or national organization, or in compliance with statutory guidelines. This finding reflects some of the efforts to ensure quality in programs funded through Indiana’s On My Way Pre-K initiative; pre-K programs must achieve a rating of Level 3 or Level 4 on Indiana’s Paths to Quality (PTQ) rubric in order to enroll eligible students. The areas of quality measured by the PTQ system have been found to be both valid and aligned with early education research on best practices promoted by national accrediting organizations (Elicker, Langill, Ruprecht, & Kwon, 2007). However, an evaluation of the PTQ system found wide variation on certain quality measures when scores were compared with those on metrics from other research-based quality rating scales, such as ERS (Elicker, Langill, Ruprecht, Lewsader, & Anderson, 2011). The recommendations that follow here pertain to strengthening the PTQ measures to align with quality benchmarks in other states and as reflected in scholarship on pre-K programs.
Requirements for teacher training and certification did vary somewhat among the states examined in this report, and within some states, requirements for teachers in pre-K programs housed in public school settings differed from those for teachers in private or home-based centers. Five of the states (Georgia, Illinois, Michigan, Nebraska, and Wisconsin) require all lead teachers in pre-K programs to have at least a Bachelor’s degree with specialization or endorsement in a field related to early education. This requirement meets the benchmark established for quality by NIEER (Barnett et al., 2016) as well as research on elements of quality in pre-K programs (Weschler et al., 2016). Currently, education and training requirements for staff in Indiana’s pre-K programs do not meet this benchmark; only 50% of caregivers or teaching staff must have a CDA or equivalent, including the lead teacher (Elicker et al., 2007). Program quality in Indiana’s pre-K classrooms may be enhanced if lead teachers are required to have Bachelor’s degrees and training in early education.
Of the states examined in this report, eight have statewide standards for early learning and require their state-funded pre-K programs to either select among approved curricula or implement curricula aligned with the standards. Most of the states also require programs to assess student progress at least annually, either with a specific assessment or a research-based authentic assessment selected from several options (e.g., PALS-pre-K, TS-GOLD, WSS). Indiana’s PTQ system requires that approved pre-K programs have planned curricula that are developmentally appropriate, but does not explicitly mandate that the curricula align with Indiana’s Early Learning Foundations, developed in 2015. Furthermore, assessments appropriate to the curriculum are required, as well as ISTAR-KR, which assesses students for kindergarten readiness. Resources related to the Early Learning Foundations regarding training, planning, and other guidance, are publicly available on Indiana’s Department of Education website. Requiring pre-K programs to align their curricula with these standards is recommended, as well as continuing to require appropriate and authentic assessments.
There was some variation among the states examined in terms of acceptable staff to child ratios in pre-K settings, with most states meeting or exceeding the NIEER benchmark of 1:10. Some states, including Indiana, establish different ratios for different ages of students, for example, the ratio of staff to children is lower for three-year-olds than for four-year-olds. In order to meet the quality benchmark established by NIEER, like other states, it is recommended that Indiana require its pre-K programs to maintain 1:10 staff to student ratios for all students in their classrooms.
Across the states examined, most utilize site visits as a means of program quality monitoring for their pre-K providers, with some additionally using research-based quality rating improvement systems (QRS), such as ECERS-R or CLASS. Furthermore, some states, such as Nebraska, have regularly funded external evaluations of their state-funded pre-K programs, reporting not only on descriptive participation and demographic data, but also on participant outcomes. Indiana also requires site visits for its On My Way Pre-K providers and has contracted with researchers at Purdue University to conduct an evaluation of the program, including a longitudinal study of participants. If Indiana’s state-funded pre-K program is expanded, it is recommended that research and evaluation efforts extend to new programs, in order to inform program quality improvement throughout the state.

37
REFERENCES
Ackerman, D., & Barnett, W.S. (2006). Increasing the Effectiveness of Preschool Programs. New Brunswick, NJ: National Institute for Early Education Research. Retrieved from http://nieer.org/wp-content/uploads/2016/08/11.pdf
Barnett, W.S. (2011). Effectiveness of early educational intervention. Science, 333(6045) 975-978. doi: 10.1126/science.1204534
Barnett, W.S., Carolan, M.E., Fitzgerald, J. & Squires, J.H. (2011). The state of preschool 2011. National Institute for Early Education Research. Retrieved from http://nieer.org/wp-content/uploads/2012/03/2011yearbook-1.pdf
Barnett, W.S., Carolan, M.E., Fitzgerald, J. & Squires, J.H. (2012). The state of preschool 2012. National Institute for Early Education Research. Retrieved from http://nieer.org/wp-content/uploads/2016/08/yearbook2012.pdf
Barnett, W.S., Carolan, M.E., Squires, J.H., Clarke Brown, K., & Horowitz, M. (2015). The state of preschool 2014. National Institute for Early Education Research. Retrieved from http://nieer.org/wp-content/uploads/2016/08/Yearbook2014_full3.pdf
Barnett, W.S., Carolan, M.E., Squires, J.H., & Clarke Brown, K. (2013). The state of preschool 2013. National Institute for Early Education Research. Retrieved from http://nieer.org/wp-content/uploads/2016/08/Yearbook2014_full3.pdf
Barnett, W.S., Epstein, D.J., Carolan, M.E., Fitzgerald, J., Ackerman, D.J., & Friedman, A.H. (2010). The state of preschool 2010. National Institute for Early Education Research. Retrieved from http://nieer.org/wp-content/uploads/2012/02/yearbook.pdf
Barnett, W.S., Epstein, D.J., Friedman, A.H., Sansanelli, R.A., & Hustedt, J.T. (2009). The state of preschool 2009. National Institute for Early Education Research. Retrieved from http://nieer.org/wp-content/uploads/2016/10/200920yearbook-1.pdf
Barnett, W.S., Epstein, D.J., Friedman, A.H., Stevenson Boyd, J., & Hustedt, J.T. (2008). The state of preschool 2008. National Institute for Early Education Research. Retrieved from http://nieer.org/wp-content/uploads/2016/10/2008yearbook.pdf
Barnett, W.S., Friedman-Krauss, A.H., Gomez, R.E., Horowitz, M., Weisenfeld, G.G., Clarke Brown, K., & Squires, J.H. (2016). The state of preschool 2015. National Institute for Early Education Research. Retrieved from http://nieer.org/wp-content/uploads/2016/05/Yearbook_2015_rev1.pdf
Barnett, W.S., Hustedt, J.T., Friedman, A.H., Stevenson Boyd, J., & Ainsworth, P. (2007). The state of preschool 2007. National Institute for Early Education Research. Retrieved from http://nieer.org/wp-content/uploads/2016/10/2007yearbook.pdf
Barnett, W.S., Hustedt, J.T., Hawkinson, L.E., & Robin, K.B. (2006). The state of preschool 2006. National Institute for Early Education Research. Retrieved from: http://nieer.org/wp-content/uploads/2016/10/2006yearbook.pdf
Barnett, W.S., Hustedt, J.T., Robin, K.B., & Schulman, K.L. (2004). The state of preschool: 2004 state preschool yearbook. Retrieved from http://nieer.org/wp-content/uploads/2016/10/2004yearbook.pdf
Barnett, W.S., Hustedt, J.T., Robin, K.B., & Schulman, K.L. (2005). The state of preschool: 2005 state preschool yearbook. Retrieved from http://nieer.org/wp-content/uploads/2016/10/2005yearbook.pdf
Barnett, W.S., & Masse, L.N. (2007). Comparative benefit–cost analysis of the Abecedarian program and its policy implications. Economics of Education Review, 26 (1), 113–125. Retrieved from http://dx.doi.org/10.1016/j.econedurev.2005.10.007

38
REFERENCES
Indiana University | Center for Evaluation & Education Policy
Barnett, W.S., Robin, K.B., Psy, M., Hustedt, J.T., & Schulman, K.L. (2003). The State of Preschool: 2003 State Preschool Yearbook. National Institute for Early Education Research. Retrieved from http://nieer.org/wp-content/uploads/2016/10/2003yearbook.pdf
Campbell F., Conti, G., Heckman, J.J., Moon, S.H., Pinto, R., Pungello, E., & Pan, Y. (2014, Mar 28). Early childhood investments substantially boost adult health. Science, 343(6178): 1478-85. doi: 10.1126/science.1248429
Campbell, F. A., Pungello, E. P., Burchinal, M., Kainz, K., Pan, Y., Wasik, . . . Ramey, C. T. (2012). Adult outcomes as a function of an early childhood educational program: An Abecedarian Project follow-up. Applied Developmental Psychology 48(4), 1033-1043. doi: 10.1037/a0026644
Campbell, F. A., Ramey, C. T., Pungello, E. P., Sparling, J., & Miller-Johnson, S. (2002). Early Childhood Education: Young Adult Outcomes from the Abecedarian Project. Applied Developmental Science, 6, 42-57.
Carolan, M. & Connors-Tadros, L. (2015). Eligibility policy for state pre-K programs: Research on risk factors and approaches to developing state policy (CEELO Policy Report). New Brunswick, NJ: Center on Enhancing Early Learning Outcomes. Retrieved from: http://ceelo.org/wp-content/uploads/2015/05/ceelo_policy_report_prek_eligibility_approaches.pdf
Cavazos, S. (2016, December 14). Not so fast: Indiana senators worry about cost of expanding preschool. Chalkbeat. Retrieved from http://www.chalkbeat.org/posts/in/2016/12/14/not-so-fast-indiana-senators-worry-about-cost-of-expanding-preschool/
Clarke, S., & Campbell, F. A. (1998). Can intervention early prevent crime later? The Abecedarian Project compared with other programs. Early Childhood Research Quarterly, 13(2), 319–343.
Garcia, J.L., Heckman, J.J., Leaf, D.E., & Prados, M.J. (2016). The Life-cycle Benefits of an Influential Early Childhood Program. The National Bureau of Economic Research, NBER Working Paper No. 22993. doi: 10.3386/w22993
Gayl, C. (2008). The Research on pre-K. Alexandria, VA: The Center for Public Education. Retrieved from http://www.centerforpubliceducation.org/Main-Menu/pre-Kindergarten/pre-Kindergarten
Indiana Department of Education [IDOE] (2016). IDOE: Compass. Retrieved from http://compass.doe.in.gov/dashboard/enrollment.aspx?type=state
Karoly, L. & Bigelow, J. (2005). The Economics of Investing in Universal Preschool Education in California. RAND Corporation. Retrieved from http://www.rand.org/content/dam/rand/pubs/monographs/2005/RAND_MG349.pdf
Klein, L., & Knitzer, J. (2006). Pathways to Early School Success: Effective Preschool Curricula and Teaching Strategies. New York, NY: National Center for Children in Poverty, Mailman School of Public Health at Columbia University. Retrieved from http://files.eric.ed.gov/fulltext/ED522728.pdf
Landry, S.H., Swank, P.R., Smith, K.E., Assel, M.A. & Gunnewig, S.B. (2006). Enhancing early literacy skills for preschool children: Bringing a professional development model to scale. Journal of Learning Disabilities, 39(4), 306-324. doi: 10.1177/00222194060390040501
Loeb, S., Bridges, M., Bassok, D., Fuller, B., & Rumberger, R.W. (2007). How much is too much? The influence of preschool centers on children’s social and cognitive development. Economics of Education Review, 26, 52-66.
Lynch, R.G. (2007). Enriching Children, Enriching the Nation: Public Investment in High Quality Kindergarten. Washington, DC: Economic Policy Institute.

39
REFERENCES
Muenchow, S. and Weinberg, E. (2016) Ten Questions Local Policymakers Should Ask About Expanding Access to Preschool. Washington, DC: American Institutes of Research.
National Women’s Law Center (2013). Fact Sheet: High-Quality pre-Kindergarten is a Wise Investment. Washington, DC: National Women’s Law Center. Retrieved from http://www.nwlc.org/sites/default/files/pdfs/prekfactsheet.pdf
Nelson, A.A., Brodnax, N., & Fischer, L. (2016). The Economic Impact of Investing in Early Childhood Education in Indiana. Bloomington, IN: Indiana University School of Public and Environmental Affairs.
O’Brien, E.M., & Devarics, C. (2007). Pre-Kindergarten: What the research shows. Center for Public Education. Retrieved from http://www.centerforpubliceducation.org/Main-Menu/pre-Kindergarten/pre-Kindergarten
Office of the Federal Register (2015). Annual Update of the HHS Poverty Guidelines. Retrieved from https://www.federalregister.gov/documents/2015/01/22/2015-01120/annual-update-of-the-hhs-poverty-guidelines
Parker, E., Atchison, B. & Workman, E. (2016) State pre-K Funding for 2015-16 Fiscal Year: National trends in state preschool funding. Denver, CO: Education Commission of the States.
Phillips, D., & Zaslow, M. (2013). Investing in Our Future: The Evidence Base on Preschool Education. Society for Research in Child Development. Foundation for Child Development.
Puma, M., Bell, S., Cook, R., Heid, C., Broene, P., Jenkins, F., . . . Downer, J. (2012). Third Grade Follow-up to the Head Start Impact Study: Final Report. Office of Planning, Research and Evaluation (OPRE), Administration for Children and Families, U.S. Department of Health and Human Services.Retrieved from http://files.eric.ed.gov/fulltext/ED539264.pdf
Puma, M., Bell, S., Cook, R., & Heid, C. (2010). Head Start Impact Study: Final Report. Office of Planning, Research and Evaluation (OPRE), Administration for Children and Families, U.S. Department of Health and Human Services. Retrieved from http://www.acf.hhs.gov/sites/default/files/opre/hs_impact_study_final.pdf
Ramey, C. T., Collier, A. M., Sparling, J. J., Loda, F. A., Campbell, F. A., Ingram, D. L., & Finkelstein, N.W. (1974). The Carolina Abecedarian Project: A longitudinal and multidisciplinary approach to the prevention of developmental retardation. (ERIC Publication No. ED104548). Chapel Hill, NC: University of North Carolina at Chapel Hill.
Reynolds, A.J., Temple, J.A., White, B.A., Ou, S.R., Robertson, D.L. (2011). Age 26 Cost-Benefit Analysis of the Child-Parent Center Early Education Program. Child Development, 82(1), 379-404. doi: 10.1111/j.1467-8624.2010.01563.x
Robin, K.B., Frede, E.C., & Barnett, W.S. (2006). Is more better? The effects of full-day vs. half-day preschool on early school achievement. New Brunswick, NJ: National Institute for Early Education Research. Retrieved from: http://nieer.org/research-report/is-more-better-the-effects-of-full-day-vs-half-day-preschool-on-early-school-achievement
The Hechinger Report (2010). Notable Researcher on pre-Kindergarten Education. Retrieved from http://hechingerreport.org/notable-research-on-pre-Kindergarten-education-2/
Samuels, C. (2017) More Than 600 Head Start Programs to Lengthen Hours Under New Funding. Retrieved from: http://blogs.edweek.org/edweek/early_years/2017/01/more_than_600_head_start_programs_to_lenghten_hours_under_new_congressional_funding.html?cmp=emlenl-eu-news2&print=1
Schmit, S., Matthews, H., Smith, S., & Robbins, T. (2013). Investing in young children: A fact sheet on early care and education participation, access and quality. New York and Washington, DC: National Center for Children in Poverty and Center for Law and Social Policy.

40
REFERENCES
Indiana University | Center for Evaluation & Education Policy
Schweinhart, L. J., Heckman, J. J., Malofeeva, L., Pinto, R. Moon, S., & Yavitz, A. (2010). The cost-benefit analysis of the Preschool Curriculum Comparison Study (appendix tables and mathematical appendix). Final Report to the John D. and Catherine T. MacArthur Foundation. Ypsilanti, MI: HighScope. Retrieved from http://www.highscope.org/file/Research/Final%20Report%20to%20MacArthur%20Foundation%20092810.pdf
Schweinhart, L. J., Montie, J., Xiang, Z., Barnett, W. S., Belfield, C. R., & Nores, M. (2005). Lifetime effects: The HighScope Perry Preschool study through age 40. (Monographs of the HighScope Educational Research Foundation, 14). Ypsilanti, MI: HighScope Press. Retrieved from http://www.highscope.org/file/research/perryproject/specialsummary_rev2011_02_2.pdf
Wechsler, M., Kirp, D., Tinubu Ali, T., Gardner, M., Maier, A., Melnick, H., & Shields, P. (2016). The road to high-quality early learning: Lessons from the states. Palo Alto: Learning Policy Institute. Retrieved from https://learningpolicyinstitute.org/sites/default/files/product-files/Road_to_High_Quality_Early_Learning_REPORT.pdf
Wechsler, M., Melnick, H., Maier, A. & Bishop, J. (2016). The Building Blocks of High-Quality Early Childhood Education Programs. Palo Alto: Learning Policy Institute.
Workman, S., Palaich, R., & Wool, S. (2016, January). A Comprehensive Analysis of pre-Kindergarten in Maryland. Denver, CO: APA Consulting.
Yoshikawa, H., Weiland, C., Brooks-Gunn, J., Burchinal, M., Espinosa, L., Gormley, W., . . . Zaslow, M. (2013). Investing in Our Future: The Evidence Base on Preschool Education. Society for Research in Child Development. Foundation for Child Development.

41
REFERENCES BY STATE
GeorgiaGeorgia Department of Early Care and Learning (2016a). Georgia Early Learning and Development Standards. Retrieved from
http://www.gelds.decal.ga.gov/Default.aspx
Georgia Department of Early Care and Learning. (2016b). Georgia’s pre-K program public bulletin. Retrieved from http://decal.ga.gov/documents/attachments/preKFactSheet.pdf
Georgia Department of Early Care and Learning. (2016c). Georgia’s pre-K Work Sampling System Assessment Program. Retrieved from http://www.decal.ga.gov/Prek/PreKChildAssessmentProgram.aspx
Georgia Department of Early Care and Learning. (2016d). History of Georgia’s pre-K program. Retrieved from http://decal.ga.gov/Prek/History.aspx
Georgia Department of Early Care and Learning. (2016e). Pre-K providers’ operating guidelines. Retrieved from http://decal.ga.gov/documents/attachments/Guidelines.pdf
Peisner-Feinberg, E.S., Schaaf, J.M, Hildebrandt, L.M. & Pan, Y. (2015). Children’s pre-K outcomes and classroom quality in Georgia’s pre-K program: Findings from the 2013-2014 Evaluation Study. Chapel Hill, NC: The University of North Carolina, FPG Child Development Institute. Retrieved from http://fpg.unc.edu/sites/fpg.unc.edu/files/resources/reports-and-policy-briefs/GAPreKEval2013-2014%20Report.pdf
Raden, A. (1999). Universal pre-Kindergarten in Georgia: A case study of Georgia’s Lottery-funded pre-K program. New York, NY: Foundation for Child Development. Retrieved from https://www.fcd-us.org/assets/2016/04/Universal-PreK-in-Georgia.pdf
IndianaElicker, J., Langill, C.C., Ruprecht, K. & Kwon, K. (2007). Paths to QUALITY—Child care quality rating system for Indiana: What is
its scientific basis?. Center for Families and Department of Child Development and Family Studies, Purdue University. Retrieved from http://www.in.gov/fssa/files/ScientificBasisPTQ.pdf
Elicker, J., Langill, C.C., Ruprecht, K.M., Lewsader, J. & Anderson, T. (2011). Evaluation of “Paths to QUALITY,” Indiana’s child care quality rating and improvement system: Final report (Technical report #3). Center for Families and Department of Human Development and Family Studies, Purdue University. Retrieved from http://www.in.gov/fssa/files/PTQFinalReportRev11012.pdf
Indiana Family & Social Services Administration. (2015). On My Way pre-K Program 2015 Annual Report. Retrieved from https://www.in.gov/fssa/files/On_My_Way_Pre-K_Annual_Report_SFY2015.pdf
Indiana Family & Social Services Administration. (2016). 2016-17 On My Way pre-K Grants [Provider webinar]. Retrieved from http://www.in.gov/fssa/files/2016-17_On_My_Way_Pre-K_grants.pdf
Indiana Governor’s Office. (2014, July 22). Governor Pence announces counties selected for pre-K pilot program. [Press release]. Retrieved from http://www.in.gov/fssa/files/FINAL_Pre-K_5_county_winners_072214.pdf
IllinoisEarly Childhood Block Grant, 23 Il. Adm. Code 235.10(b). (2011). Retrieved from ftp://www.ilga.gov/JCAR/
AdminCode/023/023002350A00100R.html

42
REFERENCES BY STATE
Indiana University | Center for Evaluation & Education Policy
Gaylor, E., Spiker, D., Fleming, J. & Korfmacher, J. (2012). Illinois Preschool for All (PFA) program evaluation. Chicago, IL: Erikson Institute, Herr Research Center for Children and Social Policy. Retrieved from http://www.erikson.edu/wp-content/uploads/PFA-Evaluation-Final-Report-June-2012.pdf
Illinois State Board of Education. (2001). The pre-Kindergarten at-risk program in Illinois from FY 86 to FY 2001. Retrieved from https://www.isbe.net/Documents/prek86-01.pdf
Illinois State Board of Education. (2007). Illinois pre-Kindergarten program for children at risk of academic failure: 2005-2006 evaluation report. Retrieved from https://www.isbe.net/Documents/prek_evaluation06.pdf
Illinois State Board of Education. (2010). Illinois pre-Kindergarten program report, 2008-2009. Retrieved from https://www.isbe.net/Documents/prek_evaluation09.pdf
Illinois State Board of Education. (2012). Illinois Preschool for All children program: A three-year report, SY 2010 through SY 2012. Division of Early Childhood in Coordination with the Division of Data Analysis and Accountability. Retrieved from https://www.isbe.net/Documents/pfa-report-2010-2012.pdf
Illinois State Board of Education. (2016). Preschool for All implementation manual. Retrieved from https://www.isbe.net/Documents/pfa-imp-manual-0216.pdf
U.S. Department of Education. (2016). Race to the Top—Early Learning Challenge: 2015 Annual Performance Report: Illinois. Retrieved from http://www2.ed.gov/programs/racetothetop-earlylearningchallenge/2015apr/ilapr2015.pdf
MassachusettsFountain, A.R. & Goodson, B. (2008). Massachusetts universal pre-Kindergarten pilot program evaluation. Boston, MA: Abt
Associates, Inc. Retrieved from http://www.eec.state.ma.us/docs/MA%20UPK%20Evaluation%20Final%20Report%2012-29-08_FINAL.pdf
Massachusetts Department of Early Education and Care. (2007). Universal pre-Kindergarten Pilot Program (UPK): Report to Legislature. Retrieved from http://www.eec.state.ma.us/docs/UPKLegislativeReport.pdf
Massachusetts Department of Early Education and Care. (2009a). The Capacity of the Early Care and Education System. Boston, MA: EEC Central Office. Retrieved from http://www.eec.state.ma.us/docs1/research_planning/capacity_rpt_2009.pdf
Massachusetts Department of Early Education and Care. (2009b). Universal pre-Kindergarten (UPK) Pilot Grand Program Fact Sheet. Boston, MA: EEC Central Office. Retrieved from http://www.mass.gov/edu/docs/eec/programs-licensing/20091217-upk-factsheet.pdf
Oldham LaChance, E., Simpson, N., & Johnson-Staub, C. (2010). Child Assessment in Universal pre-Kindergarten Department of Early Education and Care. Cambridge, MA: Oldham Innovative Research. Retrieved from http://www.eec.state.ma.us/docs1/research_planning/20101103_upk_assessment.pdf
U.S. Department of Education. (2016). Race to the Top—Early Learning Challenge: 2015 Annual Performance Report: Massachusetts. Retrieved from http://www2.ed.gov/programs/racetothetop-earlylearningchallenge/2015apr/maapr2015.pdf
U.S. Department of Education. (n.d.) Preschool development grants—Expansion grants. Grantee abstract: Massachusetts. Retrieved from http://www2.ed.gov/programs/preschooldevelopmentgrants/abstracts/mapdgabsfinal.pdf

43
REFERENCES BY STATE
MichiganThe Center for Early Education Evaluation at HighScope. (2016). 2014-15 Great Start Readiness Program Program Quality
Assessment Statewide Data Report. Ypsilanti, MI: HighScope Educational Research Foundation. Retrieved from https://www.michigan.gov/documents/mde/Updated_GSRP_2014_-_2015_statewide_PQA_Report_29_Jan_16-ADA_515321_7.pdf
Center for Educational Performance and Information for Michigan. (2016). Early childhood count, All ISDs, GSRP /Head Start blend and GSRP, all ISDs (2014–15) [Data file]. Retrieved from https://www.mischooldata.org/EarlyChildhood/EarlyChildhoodCount.aspx
Michigan Department of Education. (2015a). GSRP Implementation Manual: Child Assessment. Retrieved from: http://www.michigan.gov/documents/mde/Child_Assessment_353323_7.pdf
Michigan Department of Education. (2015b). History of Funding. Retrieved from https://www.michigan.gov/documents/mde/Funding_History_317203_7.pdf
Schweinhart, L.J., Zongping, X., Daniel-Echols, M., Browning, K. & Wakabayashi, T. (2012). Michigan Great Start Readiness Program evaluation 2012: High school graduation and grade retention findings. Ypsilanti, MI: HighScope Educational Research Foundation. Retrieved from http://www.highscope.org/file/Research/state_preschool/MGSRP%20Report%202012.pdf
U.S. Department of Education. (2016). Race to the Top—Early Learning Challenge: 2015 Annual Performance Report: Michigan. Retrieved from http://www2.ed.gov/programs/racetothetop-earlylearningchallenge/2015apr/miapr2015.pdf
NebraskaThe Child Care and Early Childhood Education Coordinating Committee. (1996). The status of child care and early childhood
education. Lincoln, NE: Nebraska State Department of Education. Retrieved from http://files.eric.ed.gov/fulltext/ED408084.pdf
Jackson, B. (2008). Nebraska Early Childhood Education Grant Program: Annual Evaluation Report, July 1, 2007-June 30, 2008. Omaha, NE: University of Nebraska Medical Center’s Munroe-Meyer Institute. Retrieved from https://www.education.ne.gov/oec/pdfs/ec_grant_reports/2007_2008_report.pdf
Jackson, B. (2009). Nebraska Early Childhood Education Grant Program—Ages 3-5: Annual Evaluation Report, July 1, 2008-June 30, 2009. Omaha, NE: University of Nebraska Medical Center’s Munroe-Meyer Institute. Retrieved from https://www.education.ne.gov/oec/pdfs/ec_grant_reports/2008-2009_grant_program_report.pdf
Jackson, B. (2010). Early Childhood Education Grant Program—Ages 3-5: 2009-2010 State Report. Omaha, NE: University of Nebraska Medical Center’s Munroe-Meyer Institute. Retrieved from https://www.education.ne.gov/oec/pdfs/ec_grant_reports/2009-2010_ECE_grant_program_state_report.pdf
Jackson, B. (2011). Early childhood education in Nebraska public school districts and educational service units: 2010-2011 State Report. Omaha, NE: University of Nebraska Medical Center’s Munroe-Meyer Institute. Retrieved from https://www.education.ne.gov/oec/pubs/eceg_reports/2010-2011.pdf
Jackson, B. (2013). Early childhood education in Nebraska public school districts and educational service units: 2012-2013 State Report. Omaha, NE: University of Nebraska Medical Center’s Munroe-Meyer Institute. Retrieved from https://www.education.ne.gov/oec/pubs/eceg_reports/2012-2013.pdf

44
REFERENCES BY STATE
Indiana University | Center for Evaluation & Education Policy
Jackson, B. (2014). Early Childhood Education in Nebraska Public School Districts and Educational Service Units: 2013-2014 State Report. Omaha, NE: University of Nebraska Medical Center’s Munroe-Meyer Institute. Retrieved from http://nebraskalegislature.gov/FloorDocs/103/PDF/Agencies/Education__Department_of/175_20141229-134041.pdf
Jackson, B., Alvarez, L. & Zweiback, R. (2010). Sixpence annual evaluation report: 2009-2010. Omaha, NE: University of Nebraska Medical Center’s Munroe-Meyer Institute. Retrieved from http://www.singasongofsixpence.org/file_download/21db1bed-e2ea-470c-bf9c-e31b8a7aaf6c
Jackson, B. & St. Clair, L. (2003). Nebraska Early Childhood Education Grant Program evaluation progress report. Omaha, NE: University of Nebraska Medical Center, Department of Education & Child Development, Munroe-Meyer Institute. Retrieved from http://nlc1.nlc.state.ne.us/epubs/E2230/B003-200203.pdf
Jackson, B. & St. Clair, L. (2004). Nebraska Early Childhood Education Grant Program: Annual Evaluation Report, July 1, 2003-June 30, 2004. Omaha, NE: University of Nebraska Medical Center’s Munroe-Meyer Institute. Retrieved from https://www.education.ne.gov/oec/pdfs/ec_grant_reports/2003_2004_report.pdf
Jackson, B. & St. Clair, L. (2005). Nebraska Early Childhood Education Grant Program: Annual Evaluation Report, July 1, 2004-June 30, 2005. Omaha, NE: University of Nebraska Medical Center’s Munroe-Meyer Institute. Retrieved from https://www.education.ne.gov/oec/pdfs/ec_grant_reports/2004_2005_report.pdf
Jackson, B. & St. Clair, L. (2006). Nebraska Early Childhood Education Grant Program: Annual Evaluation Report, July 1, 2005-June 30, 2006. Omaha, NE: University of Nebraska Medical Center’s Munroe-Meyer Institute. Retrieved from https://www.education.ne.gov/oec/pdfs/ec_grant_reports/2005_2006_report.pdf
Jackson, B. & St. Clair, L. (2007). Nebraska Early Childhood Education Grant Program: Annual Evaluation Report, July 1, 2006-June 30, 2007. Omaha, NE: University of Nebraska Medical Center’s Munroe-Meyer Institute. Retrieved from https://www.education.ne.gov/oec/pdfs/ec_grant_reports/2006_2007_report.pdf
Nebraska Department of Education. (2005). Nebraska early childhood policy study. Retrieved from https://www.education.ne.gov/oec/pubs/ec_policy_study.pdf
Nebraska Department of Education. (2015). Rule 11: Regulations for the approval of pre-Kindergarten programs established by school boards or educational service units and for the issuance of early childhood education grants. Title 92, Nebraska Administrative Code, Chapter 11. Retrieved from https://www.education.ne.gov/sbsummary/June_2015/Rule_11.pdf
OhioEarly Childhood Ohio. (2016). Early Learning Assessment. Retrieved from http://earlychildhoodohio.org/sutq/Early-Learning-
Assessment.stm
Ohio Department of Education. (2012). Ohio’s Early Learning and Development Standards in All Essential Domains of School Readiness (Birth-Age 5). Retrieved from: http://education.ohio.gov/Topics/Early-Learning/Early-Learning-Content-Standards/Birth-Through-Pre_K-Learning-and-Development-Stand
Ohio Department of Education. (2016a). Early Childhood Education: New Grantee Information Webinar [PDF Document]. Retrieved from: http://education.ohio.gov/getattachment/Topics/Early-Learning/Early-Childhood-Education-Grant/Early-Childhood-Education-2-18-16-Webinar.pdf.aspx
Ohio Department of Education. (2016b). Early Childhood Education Grant: Teacher Credentials-FY17 [PDF Document]. Retrieved from: http://education.ohio.gov/getattachment/Topics/Early-Learning/Early-Childhood-Education-Grant/FY17-Teacher-Credentials.pdf.aspx

45
REFERENCES BY STATE
Ohio Department of Education. (2016c). Ohio’s Kindergarten Readiness Assessment. Retrieved from http://education.ohio.gov/Topics/Early-Learning/Kindergarten/Ohios-Kindergarten-Readiness-Assessment
Ohio Department of Education. (2016d). Preschool Funding Models PDF Document]. Retrieved from: http://education.ohio.gov/getattachment/Topics/Early-Learning/Early-Childhood-Education-Grant/Preschool-Funding-Models-Breakout.pdf.aspx
Ohio Department of Education. (2016e). Preschool Licensing. Retrieved from: http://education.ohio.gov/Topics/Early-Learning/Preschool-Licensing
Ohio Department of Education & Ohio Department of Job and Family Services (2013). Standards for Programs. Retrieved from: http://earlychildhoodohio.org/sutq/pdf/ProgramStandards081913.pdf
Schilder, D., Kimura, S., Elliott, K., & Curenton, S. M. (2011). Perspectives on the impact of pre-K expansion: Factors to consider and lessons from New York and Ohio. (Preschool Policy Brief Issue 21). New Brunswick, NJ: National Institute for Early Education Research. Retrieved from http://nieer.org/policy-issue/policy-brief-perspectives-on-the-impact-of-pre-k-expansion-factors-to-consider-and-lessons-from-new-york-and-ohio
State of Ohio. (2015). Race to the Top: Early Learning Challenge 2014 Annual Performance Report. Retrieved from http://education.ohio.gov/getattachment/Topics/Early-Learning/Early-Learning-Challenge-Grant/2014-Early-Learning-Challenge-Grant-Annual-Report.pdf.aspx
South CarolinaGriggs, M. (n.d.). Public 4K in South Carolina: An overview of existing programs and considerations for decision makers.
Institute for Child Success. Retrieved from https://www.instituteforchildsuccess.org/themencode-pdf-viewer/?file=https://www.instituteforchildsuccess.org/wp-content/uploads/2016/07/4k_issue_brief_electronic.pdf
Rao, V., Tester, D., Googe, H. S., Knopf, H. T., & Wang, W. (2014). South Carolina Child Care Initiatives: Supported by Research Evidence. Columbia, SC: Yvonne & Schuyler Moore Child Development Research Center, University of South Carolina. Retrieved from https://www.sc.edu/study/colleges_schools/education/research/cdrc/projects/south_carolina_childcare_initiatives.pdf
South Carolina Department of Education. (2009). South Carolina early learning standards for 3, 4, & 5 year-old children. Retrieved from https://ed.sc.gov/scdoe/assets/file/programs-services/64/documents/EarlyLearningGoodStart.pdf
South Carolina Department of Education. (2016). South Carolina Child Development Education Program: 2016-2017 Public School Guidelines. Retrieved from https://ed.sc.gov/scdoe/assets/File/instruction/early-learning-literacy/CDEP/2016-17%20CDEP%20Guidelines%20Final%20Aug%202016.pdf
South Carolina Education Oversight Committee. (2007). Interim evaluation on the first year implementation of the child development education pilot program (CDEPP). Retrieved from http://www.eoc.sc.gov/Evaluations%20in%20Progress/CDEPP/The%20First%20Year%20Implementation%20of%20the%20CDEPP%20Report.pdf
South Carolina Education Oversight Committee. (2008). Implementation and expansion of the child development education pilot program (CDEPP): Evaluation report, 2007-08. Retrieved from http://www.eoc.sc.gov/Reports%20%20Publications/Current%20Reports%202008-14/Child%20Development%20Programs/FullCDEPPEvaluationReportJan2008withCoverPage.pdf

46
REFERENCES BY STATE
Indiana University | Center for Evaluation & Education Policy
South Carolina Education Oversight Committee. (2009). Implementation and expansion of the child development education pilot program (CDEPP): Evaluation report, 2008-09. Retrieved from http://www.eoc.sc.gov/Reports%20%20Publications/Current%20Reports%202008-14/Child%20Development%20Programs/FinalColorVersionJanuary232009.pdf
South Carolina Education Oversight Committee. (2010). Implementation and expansion of the child development education pilot program (CDEPP): Evaluation report, 2009-10. Retrieved from http://www.eoc.sc.gov/Reports%20%20Publications/Current%20Reports%202008-14/Child%20Development%20Programs/CDEPP%20Report%201-12-10.pdf
South Carolina Education Oversight Committee. (2014). Expansion of the SC Child Development Education Pilot Program (CDEPP), 2013-14 Report. Retrieved from http://www.eoc.sc.gov/Reports%20%20Publications/Current%20Reports%202008-14/Child%20Development%20Programs/CDEPP%20Report%20FINAL-21JJAN14%20-%20E.pdf
South Carolina Education Oversight Committee. (2016). Evaluation of state-funded full-day 4K, Part I. Retrieved from http://www.eoc.sc.gov/Reports%20%20Publications/CDEP%202016/CDEP%20Report%20-%20Final%201-19-16.pdf
TennesseeGrehan, A., Cavalluzzo, L., Gnuschke, J., Hanson, R., Oliver, S, and Vosters, K. (2011). Participation during the first four years of
Tennessee’s Voluntary pre-Kindergarten program. (Issues & Answers Report, REL 2011–No. 107). Washington, DC: U.S. Department of Education, Institute of Education Sciences, National Center for Education Evaluation and Regional Assistance, Regional Educational Laboratory Appalachia. Retrieved from http://ies.ed.gov/ncee/edlabs
Lipsey, M. W., Farran, D.C., & Hofer, K. G., (2015). A Randomized Control Trial of the Effects of a Statewide Voluntary pre-Kindergarten Program on Children’s Skills and Behaviors through Third Grade (Research Report). Nashville, TN: Vanderbilt University, Peabody Research Institute. Retrieved from http://peabody.vanderbilt.edu/research/pri/VPKthrough3rd_final_withcover.pdf
Offices of Research and Education Accountability, Tennessee Comptroller of the Treasury. (2009). Policy history: Tennessee’s pre-Kindergarten program. Retrieved from http://www.comptroller.tn.gov/Repository/RE/PreKHistory.pdf
Strategic Research Group. (2009). Assessing the Effectiveness of Tennessee’s pre-Kindergarten Program: Annual Report 2008-2009. Columbus, OH: Strategic Research Group. Retrieved from http://www.comptroller.tn.gov/repository/re/srgannualreport08-09.pdf
Tennessee Department of Education. (2012). Revised Tennessee early learning developmental standards for four-year-olds. Retrieved from https://tn.gov/assets/entities/education/attachments/std_tnelds_4yo.pdf
Tennessee Department of Education. (n.d.) 2013-14 Tennessee Voluntary pre-Kindergarten Fact Sheet. Retrieved from https://www.tn.gov/assets/entities/education/attachments/prek_fact_sheet.pdf
U.S. Department of Education. (n.d.) Preschool development grants—Expansion grants. Grantee abstract: Tennessee. Retrieved from http://www2.ed.gov/programs/preschooldevelopmentgrants/abstracts/tnpdgabsfinal.pdf
VirginiaBradburn, I., Hawdon, J., & Sedgwick, D. (2008). The Commonwealth of Virginia’s Preschool Pilot Initiative: A final report
prepared on behalf of the Virginia Department of Education. Virginia Polytechnic Institute and State University. Retrieved from http://leg2.state.va.us/dls/h&sdocs.nsf/By+Year/RD2422008/$file/RD242.pdf

47
REFERENCES BY STATE
U.S. Department of Education. (n.d.) Preschool development grants—Expansion grants. Grantee abstract: Virginia. Retrieved from http://www2.ed.gov/programs/preschooldevelopmentgrants/abstracts/vapdgabsfinal.pdf
Virginia Department of Education. (2013a). Virginia’s foundation blocks for early learning: Comprehensive standards for four-year-olds. Richmond, VA: Virginia Department of Education. Retrieved from http://www.doe.virginia.gov/instruction/early_childhood/preschool_initiative/foundationblocks.pdf
Virginia Department of Education. (2013b). Virginia’s quality indicators for responsive teaching: Creating a high quality preschool learning environment. Richmond, VA: Virginia Department of Education. Retrieved from http://www.doe.virginia.gov/instruction/early_childhood/preschool_initiative/preschool_quality_indicators.pdf
Virginia Department of Education. (2016a). 2016 Appropriation Act Language. Retrieved from http://www.doe.virginia.gov/instruction/early_childhood/preschool_initiative/appropriation_act_language.pdf
Virginia Department of Education. (2016b). Virginia Preschool Initiative: Guidelines for the Virginia Preschool Initiative Application, 2016-2017. Retrieved from http://www.doe.virginia.gov/instruction/early_childhood/preschool_initiative/guidelines.pdf
Virginia Department of Education. (2015). Virginia Preschool Initiative (VPI): Program information. Presentation to the Joint Subcommittee on the Virginia Preschool Initiative. Retrieved from http://sfc.virginia.gov/pdf/Jt%20Sub%20Education/August%2025%202015/No5_VPI.pdf
Virginia Early Childhood Foundation. (2013). Virginia’s biennial school readiness report card. Richmond, VA: Smart Beginnings. Retrieved from http://www.smartbeginnings.org/portals/5/pdfs/va2013reportcardfinal.pdf
Virginia Early Childhood Foundation. (2016). Virginia’s school readiness report card. Richmond, VA: Smart Beginnings. Retrieved from http://www.smartbeginnings.org/Portals/5/2016SRRC_VECF.pdf
Virginia Early Childhood Foundation. (n.d.). Virginia’s preschool puzzle: A community guide for smart beginnings. Retrieved from http://www.smartbeginnings.org/Portals/5/PDFs/VAPreschoolPuzzleWEB.pdf
Virginia Office of the Governor. (2014). Governor McAuliffe Announces $17.5 Million Federal Preschool Expansion Grant. Retrieved from http://www.doe.virginia.gov/news/news_releases/2014/12_dec10_gov.shtml
WisconsinAdams, D., Bierbrauer, J., Edie, D., Fisher, A., Riley, D., Roach, M., . . . Vinijtrongjit, C. (2006a). Executive summary: Assessing
the value of 4K in Wisconsin: A study of 4K community approach districts (2005-06). Wisconsin Child Care Research Partnership. Retrieved from https://sohe.wisc.edu/outreach/wccrp/pdfs/EEM2_Executive_Summary.pdf
Adams, D., Bierbrauer, J., Edie, D., Fisher, A., Riley, D., Roach, M., . . . Vinijtrongjit, C. (2006b). Report A: Family experiences and parent satisfaction with 4-year-old kindergarten in Wisconsin. Wisconsin Child Care Research Partnership. Retrieved from https://sohe.wisc.edu/outreach/wccrp/pdfs/EEM2_Report_A.pdf
Adams, D., Roach, M. & Schmitt, S. (2005). Final report: Year 1: Charting progress in 4-year-old kindergarten (4K) in Wisconsin: Focus on the “community approach,” 2003-04 and 2004-05. Wisconsin Child Care Research Partnership, University of Wisconsin-Extension. Retrieved from https://sohe.wisc.edu/outreach/wccrp/pdfs/finalreportyear1.pdf
U.S. Department of Education. (2015.) Race to the Top—Early Learning Challenge 2015 Annual Performance Report: Wisconsin. Retrieved from http://www2.ed.gov/programs/racetothetop-earlylearningchallenge/2015apr/wiapr2015.pdf

48
REFERENCES BY STATE
Indiana University | Center for Evaluation & Education Policy
Wisconsin Council on Children and Families. (2010). The unique history of four-year-old kindergarten in Wisconsin. Great Start Series: Policy Brief #6. Retrieved from http://www.wccf.org/assets/great_start_6_history_4K.pdf
Wisconsin Department of Public Instruction. (2003). Community approaches to serving four-year-old children in Wisconsin: Lessons learned from Wisconsin communities. Retrieved from http://dpi.wi.gov/sites/default/files/imce/fscp/pdf/eccommap.pdf
Wisconsin Department of Public Instruction. (2016). State Superintendent’s Advisory Committee on Four-Year-Old Kindergarten: Presentation. Retrieved from http://dpi.wi.gov/sites/default/files/imce/early-childhood/pdf/suptcommittee4kpresentation2016.pdf

49
APPENDIX: GLOSSARY OF ACRONYMS AND TERMS
Early Education Accrediting and Research OrganizationsNAEYC: National Association for the Education of Young Children (https://www.naeyc.org/)NAFCC: National Association for Family Child Care (https://www.nafcc.org/)NEASC: New England Association of Schools and Colleges (https://www.neasc.org/)NIEER: National Institute for Early Education Research (http://nieer.org/)
Staff Training/LicensingAA: Associate of ArtsBA: Bachelor of ArtsCD: Child DevelopmentCDA: Child Development AssociateECC: Early Childhood CertificationECD: Early Childhood Development CredentialECE: Early Childhood EducationECI: Early Childhood InclusiveECSE: Early Childhood Special EducationEE: Early EducationHS: High School
Research-based Authentic AssessmentsASQ: Ages and Stages Questionnaire (http://agesandstages.com/)BDIS: Battelle Developmental Inventory Screener (http://www.hmhco.com/hmh-assessments/early-childhood/bdi-2)BECS-III: Brigance Early Childhood Screens III (http://www.curriculumassociates.com/products/brigance-early-childhood.
aspx)CCDC: Creative Curriculum Developmental ContinuumCOR: HighScope Child Observation Record (http://coradvantage.org/)Cooper-Farran Behavioral Ratings ScalesECSQ-PK: Early Childhood Standards of Quality-pre-K (http://www.michigan.gov/documents/mde/ECSQ_OK_
Approved_422339_7.pdf)IGDI-EL: Individual Growth and Development Indicators of Early Literacy (http://www.myigdis.com/preschool-assessments/
early-literacy-assessments/)ISTAR-KR: Indiana Standards Tool for Alternate Reporting of Kindergarten Readiness (http://www.doe.in.gov/assessment/
kindergarten-readiness-assessment)PALS-pre-K: Phonological Awareness Literacy Screening-pre-K (https://pals.virginia.edu/tools-preK.html)PPVT-4: Peabody Picture Vocabulary Test-4 (http://www.pearsonclinical.com/language/products/100000501/peabody-
picture-vocabulary-test-fourth-edition-ppvt-4.html)Preschool Learning Behaviors ScalePreschool & Kindergarten Behavior Scales-2 (http://www.hmhco.com/hmh-assessments/other-clinical-assessments/pkbs-
2)TS-GOLD: Teaching Strategies-Gold (https://teachingstrategies.com/gold-early-childhood-assessment/)Woodcock-Johnson Achievement Battery III (http://www.hmhco.com/hmh-assessments/woodcock-johnson)WSS: Work Sampling System (http://www.pearsonclinical.com/childhood/products/100000755/the-work-sampling-system-
5th-edition.html)

50
APPENDIX: GLOSSARY OF ACRONYMS AND TERMS
Indiana University | Center for Evaluation & Education Policy
Program Quality Monitoring Tools CLASS: Classrooms Assessment Scoring System (http://teachstone.com/classroom-assessment-scoring-system/)ECERS-R: Early Childhood Environmental Rating Scale-Revised (http://ers.fpg.unc.edu/early-childhood-environment-rating-
scale-ecers-r)ELLCO: Early Language and Literacy Classroom Observation (http://www.brookespublishing.com/resource-center/screening-
and-assessment/ellco/ellco-pre-K/)ERS: Environment Rating Scales (http://ers.fpg.unc.edu/)HoVRS: Home Visit Rating Scales (http://communityaction.com/wp-content/uploads/2013/10/Home-Base-Visit-Rating-
Scale.pdf)ITERS-R: Infant Toddler Environment Rating Scale-Revised (http://ers.fpg.unc.edu/infanttoddler-environment-rating-scale-
iters-r)QPM: Quality Improvement System Program Manager (http://www.mass.gov/edu/birth-grade-12/early-education-and-care/
qris/qris-program-manager-qpm.html)QRIS: Quality Rating Improvement System (https://qrisguide.acf.hhs.gov/)

51

I N D I A N A U N I V E R S I T Y
C E N T E R F O R E V A L U A T I O N & E D U C A T I O N P O L I C Y
1900 East 10th Street, Bloomington, IN 47406Website: ceep.indiana.edu E-mail: [email protected]
Phone: (812) 855-4438Fax: (812) 856-5890


