Journal of Information Technology Education Volume 8, 2009 Editor: Janice Whatley A Comparison of Student Perceptions of their Computer Skills to their Actual Abilities Donna M. Grant, Alisha D. Malloy, and Marianne C. Murphy North Carolina Central University, Durham, NC, USA [email protected]; [email protected]; [email protected]Executive Summary In this technology intensive society, most students are required to be proficient in computer skills to compete in today’s global job market. These computer skills usually consist of basic to ad- vanced knowledge in word processing, presentation, and spreadsheet applications. In many U.S. states, students are required to demonstrate computer proficiency early in their educational ex- perience by means of passing an assessment test. This research was conducted in North Carolina where all students must pass a computer/technology skills assessment test prior to completing twelfth grade. This study explored U.S. college students’ perceived mastery of their computer skills, evaluated their actual scores on a computer skills assessment, and compared the results to realign and enhance an introductory business computer applications course. Two instruments were developed to accomplish the objectives for this research: a survey to capture students’ per- ceptions of their computer proficiency and a computer skills assessment to measure their actual performance. The assessment tool evaluated their knowledge of three computer application skills – word processing, presentation, and spreadsheet – with three levels of proficiency – basic, mod- erate, and advanced. The survey and assessment instruments were administered to over 200 busi- ness students in a medium sized, public university with a required introductory computer applica- tions course. The findings of this study indicate some differences in the students’ perception of their word processing skills and actual performance, no difference in perception and performance for their presentation skills, and a significant difference in perception and performance for their spreadsheet skills. As a result of this research, the curriculum for the introductory course was re- designed to concentrate primarily on the substantial skill deficiency in spreadsheet skills while still allowing the students to demonstrate their level of proficiency in word processing and pres- entation skills through a mandatory online assessment test beginning in fall semester 2008. Any student who does not perform well on the word processing and presentation assessment will be required to obtain additional training to enhance these skills. These findings have important implications for two reasons: 1) schools with a similar profile can possibly replicate the realignment and enhancement of the business computer application course and 2) any school interested in comparing their students’ perception of their computer skill profi- ciency and actual performance on three different levels can apply a modified version of this study. Keywords : computer literacy, computer self-efficacy, computer proficiency, computer skills assessment, perceived computer skills, word processing, spreadsheets, presentation software Material published as part of this publication, either on-line or in print, is copyrighted by the Informing Science Institute. Permission to make digital or paper copy of part or all of these works for personal or classroom use is granted without fee provided that the copies are not made or distributed for profit or commercial advantage AND that copies 1) bear this notice in full and 2) give the full citation on the first page. It is per- missible to abstract these works so long as credit is given. To copy in all other cases or to republish or to post on a server or to redistribute to lists requires specific permission and payment of a fee. Contact [email protected]to request redistribution permission.
Transcript
Journal of Information Technology Education Volume 8, 2009
Editor: Janice Whatley
A Comparison of Student Perceptions of their Computer Skills to their Actual Abilities
Donna M. Grant, Alisha D. Malloy, and Marianne C. Murphy North Carolina Central University, Durham, NC, USA
Executive Summary In this technology intensive society, most students are required to be proficient in computer skills to compete in today’s global job market. These computer skills usually consist of basic to ad-vanced knowledge in word processing, presentation, and spreadsheet applications. In many U.S. states, students are required to demonstrate computer proficiency early in their educational ex-perience by means of passing an assessment test. This research was conducted in North Carolina where all students must pass a computer/technology skills assessment test prior to completing twelfth grade. This study explored U.S. college students’ perceived mastery of their computer skills, evaluated their actual scores on a computer skills assessment, and compared the results to realign and enhance an introductory business computer applications course. Two instruments were developed to accomplish the objectives for this research: a survey to capture students’ per-ceptions of their computer proficiency and a computer skills assessment to measure their actual performance. The assessment tool evaluated their knowledge of three computer application skills – word processing, presentation, and spreadsheet – with three levels of proficiency – basic, mod-erate, and advanced. The survey and assessment instruments were administered to over 200 busi-ness students in a medium sized, public university with a required introductory computer applica-tions course. The findings of this study indicate some differences in the students’ perception of their word processing skills and actual performance, no difference in perception and performance for their presentation skills, and a significant difference in perception and performance for their spreadsheet skills. As a result of this research, the curriculum for the introductory course was re-designed to concentrate primarily on the substantial skill deficiency in spreadsheet skills while still allowing the students to demonstrate their level of proficiency in word processing and pres-entation skills through a mandatory online assessment test beginning in fall semester 2008. Any student who does not perform well on the word processing and presentation assessment will be required to obtain additional training to enhance these skills.
These findings have important implications for two reasons: 1) schools with a similar profile can possibly replicate the realignment and enhancement of the business computer application course and 2) any school interested in comparing their students’ perception of their computer skill profi-
ciency and actual performance on three different levels can apply a modified version of this study. Keywords: computer literacy, computer self-efficacy, computer proficiency, computer skills assessment, perceived computer skills, word processing, spreadsheets, presentation software
Material published as part of this publication, either on-line or in print, is copyrighted by the Informing Science Institute. Permission to make digital or paper copy of part or all of these works for personal or classroom use is granted without fee provided that the copies are not made or distributed for profit or commercial advantage AND that copies 1) bear this notice in full and 2) give the full citation on the first page. It is per-missible to abstract these works so long as credit is given. To copy in all other cases or to republish or to post on a server or to redistribute to lists requires specific permission and payment of a fee. Contact [email protected] to request redistribution permission.
Introduction Information Technology (IT) has changed and continues to change the way we live, do business, and interact socially. IT is undergoing rapid change. New and improved technological advances appear almost daily. Most jobs require personnel to have some level of interaction and expertise with IT. These technologies are intricately woven into businesses, including healthcare industry’s use of electronic medical records, manufacturing industry’s use of automated production lines, banking industry’s use of online banking, and restaurant and food industries’ use of computerized ordering and tracking systems.
If the U.S. is to remain competitive in an ever-increasing global economy, then it becomes in-creasingly important to hire workers who are adequately prepared to utilize current and future information technology. In order to build and sustain information technology proficiency, people must have formal and informal opportunities to interact with computers. Early development of computer literacy may be as critical as reading and writing literacy. Computer literacy is defined as “an understanding of computer characteristics, capabilit ies, and applications, as well as an ability to implement this knowledge in the skillful, productive use of computer applications suitable to individual roles in society” (Simonson, Mauer, Toradi, & Whitaker, 1987). Computer proficiency is the knowledge and ability to use specific computer applications (spreadsheet, word processors, etc.). Computer literacy and proficiency are often used interchangeably; however, it is our belief that increasing computer proficiency positively impacts computer literacy.
Educators recognize the need to increase the proficiency skill levels of all students pertaining to information technology. Most courses now strive to incorporate information technology into all aspects of the learning continuum. The No Child Left Behind (NCLB) Act of 2001 requires as-sessments in order for U.S. kindergarten through twelfth grade (K-12) school systems to receive federal funding (No Child Left Behind [NCLB], 2008). In North Carolina, starting with the Class of 2001, students are required to pass a computer literacy assessment in order to complete twelfth grade and graduate from high school (North Carolina Online Test of Computer Skills, 2007). Therefore, it is assumed that every student in North Carolina entering college has some basic computer proficiency skills.
Many college freshmen have a basic perception about their computer proficiency skills that is affected by not only passing a required assessment but also by their prior computer experiences. Students that are required to take an introductory computer applications course at the college lev-el often feel that the course is not necessary since they have previously passed an assessment in K-12 or had a computer course in high school (9th – 12th grade). Additionally, many educators have a perception that students are becoming more computer literate. Universities must make a determination as to the accuracy of these perceptions in order to adjust the curriculum so that stu-dents are adequately prepared and challenged.
In many U.S. business schools, the Information System (IS) discipline delivers an introductory information technology course. Often this course serves as the only required information tech-nology course for business students. The goals of most introductory computer applications courses are to familiarize incoming college freshmen with computer operating systems, funda-mental and intermediate word processing commands, spreadsheet applications, presentation graphics, and database management. These skills are necessary to successfully matriculate throughout the business school, as well as to compete and secure future employment (Keengwe, 2007). However, if the educators’ perceptions are correct and, in fact, students are more com-puter literate, then educators must adjust the delivery of this introductory course accordingly or eliminate it all together (Wallace & Clariana, 2005).
Grant, Malloy, & Murphy
143
Computer literacy is well defined, and it is well accepted that educators must ensure a level of computer literacy in all students. Additionally, self-efficacy literature defines a relationship be-tween one’s beliefs and performance. Therefore, in order to provide a curriculum that addresses this literacy, it is imperative to understand the student’s perception of his or her computer applica-tion skills. The purpose of this research is to evaluate the student’s perception of his or her computer applica-tion skills by comparing this perception to how he or she actually performs on a computer as-sessment prior to taking the required college introductory information technology course. In this paper, the perceived mastery of mostly freshmen students entering a core IS course is compared with their actual scores on a computer application skills assessment in order to evaluate the nec-essary content and alignment of the introductory computer applications course.
Background
The North Carolina Standard Course of Study North Carolina (NC) is a state that receives federal funding and, as such, must adhere to the No Child Left Behind Act assessment requirement. The North Carolina Standard Course of Study (2004) provides every content area a set of competencies for each K-12 course. The intent of this standard is to ensure rigorous student academic performance standards that are uniform across the state. The basis for this standard is a philosophy of teaching and learning that is consistent with current research, exemplary practices and national standards.
The strength of technology is that it provides an excellent platform where stu-dents can collect information in multiple formats and then organize, link, and discover relationships between facts and events. An array of tools for acquiring information and for thinking and expression allows more students more ways to enter the learning enterprise successfully and to live productive lives in the glob-al, digital, and information-based future they all face. (Stratham & Torell, 1996, p.3)
The NC K-12 Computer/Technology Skills Standard Course of Study identifies the essential knowledge and skills that all students need to be active, lifelong learners in a technology intensive environment. The curriculum is designed to form the foundation for continuous learning and to be applicable to ever-changing innovations (NC Standard Course of Study – Computer Skills, 2004). The NC Computer/Technology Skills Standard Course of Study describes the progressive development of knowledge and skills in six strands: Societal and Ethical Issues, Database, Spreadsheet, Keyboard Utilization/Word Processing/Desktop Publishing, Multime-dia/Presentation, and Telecommunications/Internet. The NC Computer/Technology Skills Standard Course of Study involves the development of skills over time. Computer/Technology Skills proficiency is not an end in itself, but lays a foun-dation for lifelong learning. These skills become building blocks with which to meet the chal-lenges of personal and professional life. To become technologically proficient, the student must develop the skills over time, through integrated activities in all content areas K-12 rather than through one specific course. These skills are necessary for all students and should be introduced and refined collaboratively by all K-12 teachers as an integral part of the learning process.
The NC Computer/Technology Skills Standard Course of Study is designed to integrate skills into all content area instruction, not to be taught in isolation. According to research done by the Cen-ter for Applied Research in Educational Technology (2005) close alignment of technology in reg-ular instruction in a practical manner with all areas of instruction creates better learning opportu-
Comparison of Student Perceptions
144
nities for students across the curriculum and positively impacts student achievement. Beginning with the high school graduating class of 2001, students in eighth grade for the 1996–1997 school year and beyond are required to satisfy the computer proficiency requirement in order to receive a North Carolina high school diploma. Although there is no specific computer skills course re-quirement, students must demonstrate proficiency through successfully passing the NC Com-puter/Technology Skills Assessment prior to graduation in order to receive a high school gradua-tion diploma. Students are first given this assessment during their eighth grade year and continu-ally through twelfth grade until the student successfully passes. Approximately 75% of students who participated in this research study are from North Carolina. Compeau and Higgins (1995) state that prior computer experience/performance and assessment has been shown to positively impact students’ perception of their computer skills and usage. Con-sequently, this research seeks to explore our students’ perception of their skills as it relates to their actual computer skills.
Computer Self-Efficacy Computer self-efficacy is a specialized paradigm of Bandura’s (1977) self-efficacy. Self-efficacy is rooted in Social Learning Theory (SLT), which contains extensively accepted and empirically rich models of individual behavior. SLT explains human behavior from the perspective of a con-tinuous feedback loop among behavioral, cognitive, and environmental determinants.
Self-efficacy refers to an individual’s belief in his or her ability to perform a specific task (i.e. what a person perceives is his or her capability of performing a specific task). Self-efficacy re-flects an individual’s perception of his or her ability based on past performance or experience, but it also forms a crucial influence on future intentions. Understanding the factors that influence an individual’s use of computers has been a goal of IS Research since the mid-1970s. Through their review of the plethora of literature regarding computer self-efficacy, Marakas, Yi, and Johnson (1998) argued that contradictions found might be due to the lack of attention to the dynamic, multileveled, and multifaceted nature of the computer self-efficacy construct and the need for an integrative framework for the research. Computer self-efficacy research evolved to investigate both general and specific computer self-efficacy and the relationship between them (Agarwal, Sambamurthy, & Stair, 2000). General computer self-efficacy is defined as an indi-vidual’s judgment of efficacy across multiple computer application domains while specific com-puter skills is defined as perceptions of ability to perform specific computer-related tasks in the domain of general computing. Research has often demonstrated that computer experience has positive impacts on computer self-efficacy. Hasan (2003) showed that certain computer experiences had varying levels of impact on a person’s perceived computer self-efficacy. Hasan’s research showed that experience with computer programming and graphics applications have strong and significant effects on computer self-efficacy beliefs while spreadsheet and database applications demonstrated weak effects. This research will concentrate on computer self-efficacy as it pertains to specific tasks in word proc-essing, presentation graphics, and spreadsheet applications. Computer programming and database skills are taught in another course and were not explored in this research.
Computer Literacy as an Essential Requirement for Employment As stated earlier, technology is radically transforming every industry including healthcare, energy production, construction, education, and the military. Employers demand graduates who are pre-pared to leverage technology in a scalable fashion to advance the firms’ strategies and operations. In order to respond to the demand for technologically savvy graduates, technology-enriched pe-
Grant, Malloy, & Murphy
145
dagogy, founded on technology-equipped facilit ies and new curricula is required to keep pace and hopefully ahead of industry (Association to Advance Collegiate School of Business, 2002). Computers are often seen as the gateway to membership in the global information society and a requirement for the workforce of the future (Stovers, 2003). Since computing continues to have a significant impact on the world, an understanding of computer technology and its uses is impor-tant for all members of our society to be effective consumers and producers in the 21st century and beyond (McCoy, 2001).
In most, if not all, business organizations, a computer is as customary as a pen and paper. To-day’s organizations demand that workers have a basic level of computer literacy due to their de-pendency on computers to operate better, faster, and cheaper. Therefore, it is likely that in almost all areas of employment the computer will be a basic tool that is essential for accomplishing job responsibilit ies. Keengwe (2007) found that students lack computer skill in various computer ap-plications that are necessary to support and enhance their learning experience. In Carter and Boyle (2002), the authors discussed the effects of student and faculty expectations along with cur-ricular issues in achieving success.
Preparing students for employment and beyond requires that the current and emerging needs of industry be assessed in an effort to ensure that graduates are equipped with toolkits to be produc-tive (Johnson, Bartholomew, & Miller, 2006). The primary responsibility for teaching computer skills during the last two decades has been placed in business education programs, which often teach business related applications such as spreadsheet, word processing, and databases (Tesch, Murphy, & Crable, 2006). Educators are facing tremendous challenges in identifying, develop-ing, and designing curriculum that will prepare undergraduates in the next century (Hunt & Per-reault, 1999; Wang, 2007).
An essential element of designing the curriculum is the content delivered in the basic computer applications course. Understanding how students rate the importance of topics covered in a com-puter applications course is important in evaluating this course content (Martin & Dunsworth, 2007). These ratings are based in part on the students’ perceptions of their current skill level.
This research contends that these perceptions alone are not enough to direct the course content. The current study begins to analyze and assess the computer proficiency and self-efficacy of stu-dents entering our introductory business applications course.
Methodology This study seeks to examine the discrepancies between students’ perception of their computer applications skills and their actual performance on computer applications assessments. This in-formation is vital for business schools in developing effective curriculum. Based on the literature review the following hypotheses were used to guide this study:
Hypothesis
H1: A majority (>50%) of the students would indicate a high skill level profici ency in Word process-ing applications (e.g., MS Word).
H2: A majority (>50%) of the students would indicate at least an average skill level proficiency in Presentation applications (e.g., MS PowerPoint)
H3: A majority (>50%) of the students would indicate at least an average skill level proficiency in spreadsheet applications (e.g., MS Excel)
H4: When evaluated, most students (>50%) will correctly answer questions pertaining to basic and moder-ate tasks in MS Word. However, most students will incorrectly answer questions pertaining to advanced tasks.
Comparison of Student Perceptions
146
H5: When evaluated, most students (>50%) will correctly answer questions pertaining to basic tasks in MS PowerPoint. Therefore, their average perceived skill level matches their performance on basic tasks.
H6: When evaluated, most students (>50%) will incorrectly answer questions pertaining to basic, moder-ate, and advanced tasks in MS Excel.
H7: Regarding their skill level in MS Word, most students (>50%) will have a discrepancy between their perceived skill level and actual performance.
H8: Regarding their skill level in MS PowerPoint, most students (>50%) will have a discrepancy between their perceived skill level and actual performance.
H9: Regarding their skill level in MS Excel, most students (>50%) will have a discrepancy between their perceived skill level and actual performance.
In order to test the above hypotheses two instruments were developed. First, a survey was devel-oped to capture basic demographics and information regarding computer application experience. Additionally, this survey captured how students perceived their proficiency in business applica-tion skills such as word processing, spreadsheet, and presentation graphics. This survey was adapted from an assessment mechanism designed to describe alumni satisfaction with their busi-ness school training in IT skills (Tesch, Crable, & Braun, 2003). Second, an online computer ap-plications skills assessment was prepared using a basic computer skills assessment tool.
Participants The sample for this study was undergraduate students enrolled in a medium sized public univer-sity. These students were all enrolled in an introductory business computer applications course. This course is the only information technology course required for all students pursuing majors within the School of Business. For the fall 2007 semester, twelve sections of this course were taught with a combined total of 235 students. The semester long course was offered in two for-mats: 1) a Monday/Wednesday/Friday fifty-minute and 2) a Tuesday/Thursday seventy-five min-ute format.
Students across the twelve introductory computer applications courses were given the voluntary survey and the optional online, computer-based skills assessment. Of the 235 students enrolled in twelve sections of this course, 182 completed the online assessment and 173 completed the sur-vey. Although the same students were asked to participate in both the survey and the online as-sessment, some students elected to opt out of one or both.
Instruments (Survey and Assessment) The Perceived Computer Skills Survey utilized in this study is designed to capture demographic information, computer experience, computer access, computer usage, and students’ perception of their computer application skills prior to starting the introductory business computer application course. The survey consists of three major sections. The first section of the survey1, Personal Data, is designed to capture demographics of the participants. The second section, Computer Ex-perience, is designed to capture students’ access to and experience with computer applications. The last section, Perceived Degree of Proficiency, is designed to allow students to rate their per-ceived computer proficiency using a 5-point Likert-scale evaluation where 1- indicates negligible or no skill and 5- indicates expert skill in seven (7) specific computer applications areas: file op-eration, word processing applications, spreadsheet applications, presentations, web page devel-opment, and applications programming. 1 Contact authors for full copy of this survey.
Grant, Malloy, & Murphy
147
The computer-based assessment developed in this study is designed to test the actual skills of stu-dents in the three content areas of the introductory computer applications course in which they were enrolled. The basic computer skills assessment tool assessed students’ skill proficiency in word processing, spreadsheets, and presentation graphics. Various computer applications training and assessment tools exist in the market (MyIT lab, SimNet, etc.). All of these tools assess a wide range of skills in computer applications. SAM Challenge 2003 version 3.0 was chosen for this study as it was compatible with a comprehensive set of Microsoft Office textbooks. These texts were used to develop the specific tasks. Additionally, the assessment design of the SAM tool is aimed at testing the application knowledge in solving real world problems, an essential element of computer literacy (Simonson et al., 1987). SAM Challenge 2003 is a skills assessment manager from Course Technology that offers skills assessment of the Microsoft Office Suite in a simulated environment. SAM 2003 includes true open simulations that allow students to complete most tasks using any acceptable method. These simulations allow students to move freely through the application, even opening up random dialog boxes without penalty.
Skills assessment tasks were chosen using SAM 2003 tasks available from the Course Technol-ogy New Perspectives text series orientation. This orientation offers tasks categorized as brief, introductory, or comprehensive skills. Tasks were categorized as basic, moderate, and advanced based on when presented in the text as well as the expertise of instructors. Additionally, since the primary interest of this study is to determine the extent of students’ ability to perform basic tasks (particular emphasis on word and spreadsheets), few advanced tasks were selected and only basic tasks were selected for presentation graphics. Once selected, task lists were generated and re-viewed by select IS faculty members. The initial assessment was modified from 54 to 35 tasks in order to provide for a thirty-five minute testing limit. The SAM 2003 development experts at Course Technology validated that the final assessment test containing 35 questions would require approximately 36 minutes for completion.
Procedures Students were given the survey on the first day of class, asked to complete the survey and hand it to the instructor prior to the class ending. Students were informed that the survey was voluntary and would not affect their performance or evaluation in the course. Skills assessment tests were scheduled during the first week of class and were given at the begin-ning of the session. Students were instructed to consider the assessment strictly an informational mechanism designed to capture the skill level of the students in order to adjust the instruction ma-terial for the course and in no way would affect their grade in such course. Further, students were instructed that they could skip questions and/or end the exam at any point.
The value of surveying students at the beginning of a computer applications course was identified by Hindi, Miller, and Wenger (2002) as an important instrument to direct the delivery of the course content. These authors recommend that areas identified as weak should be addressed in the course. However, the assumption that areas not identified as weak are in fact strong or have less importance in the course content is not addressed. This research extends the survey results to determine how well the ratings of individual applications matched their actual assessment scores.
Results and Discussion This research is interested in how students perceive their skills in the three applications discussed previously and how that perception compares to their actual performance. Nine hypotheses were developed to test the indicated perception and determine if any discrepancy exists between per-ception and performance. In the following sections these hypotheses are evaluated and the results summarized in tables. A one-tailed z statistic sample test of a proportion with a 95% confidence
Comparison of Student Perceptions
148
level was performed using the SAS statistical tool for each hypothesis. This study used a p-value of .05 to determine the level of significance. Therefore, if the p-value is < or = .05 then the null hypothesis is rejected. However, if the p-value is > .05 then the null hypothesis is not rejected.
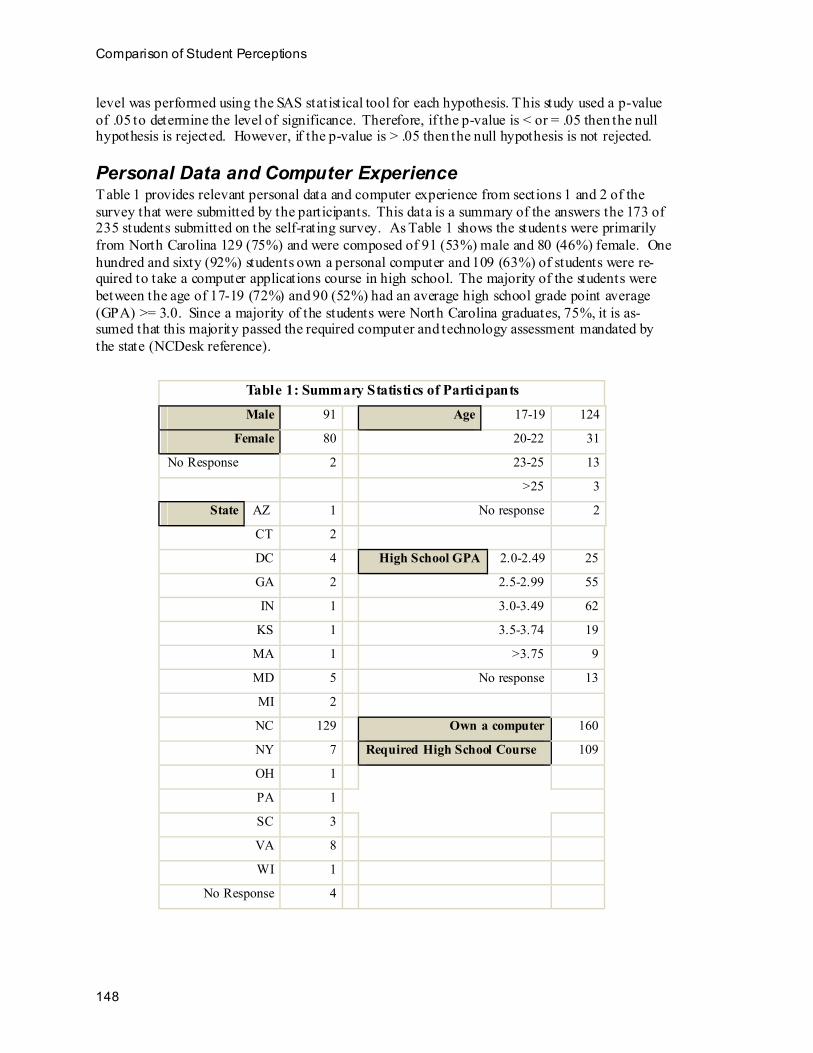
Personal Data and Computer Experience Table 1 provides relevant personal data and computer experience from sections 1 and 2 of the survey that were submitted by the participants. This data is a summary of the answers the 173 of 235 students submitted on the self-rating survey. As Table 1 shows the students were primarily from North Carolina 129 (75%) and were composed of 91 (53%) male and 80 (46%) female. One hundred and sixty (92%) students own a personal computer and 109 (63%) of students were re-quired to take a computer applications course in high school. The majority of the students were between the age of 17-19 (72%) and 90 (52%) had an average high school grade point average (GPA) >= 3.0. Since a majority of the students were North Carolina graduates, 75%, it is as-sumed that this majority passed the required computer and technology assessment mandated by the state (NCDesk reference).
Table 1: Summary Statistics of Participants Male 91 Age 17-19 124
Female 80 20-22 31
No Response 2 23-25 13
>25 3
State AZ 1 No response 2
CT 2
DC 4 High School GPA 2.0-2.49 25
GA 2 2.5-2.99 55
IN 1 3.0-3.49 62
KS 1 3.5-3.74 19
MA 1 >3.75 9
MD 5 No response 13
MI 2
NC 129 Own a computer 160
NY 7 Required High School Course 109
OH 1
PA 1
SC 3
VA 8
WI 1
No Response 4
Grant, Malloy, & Murphy
149
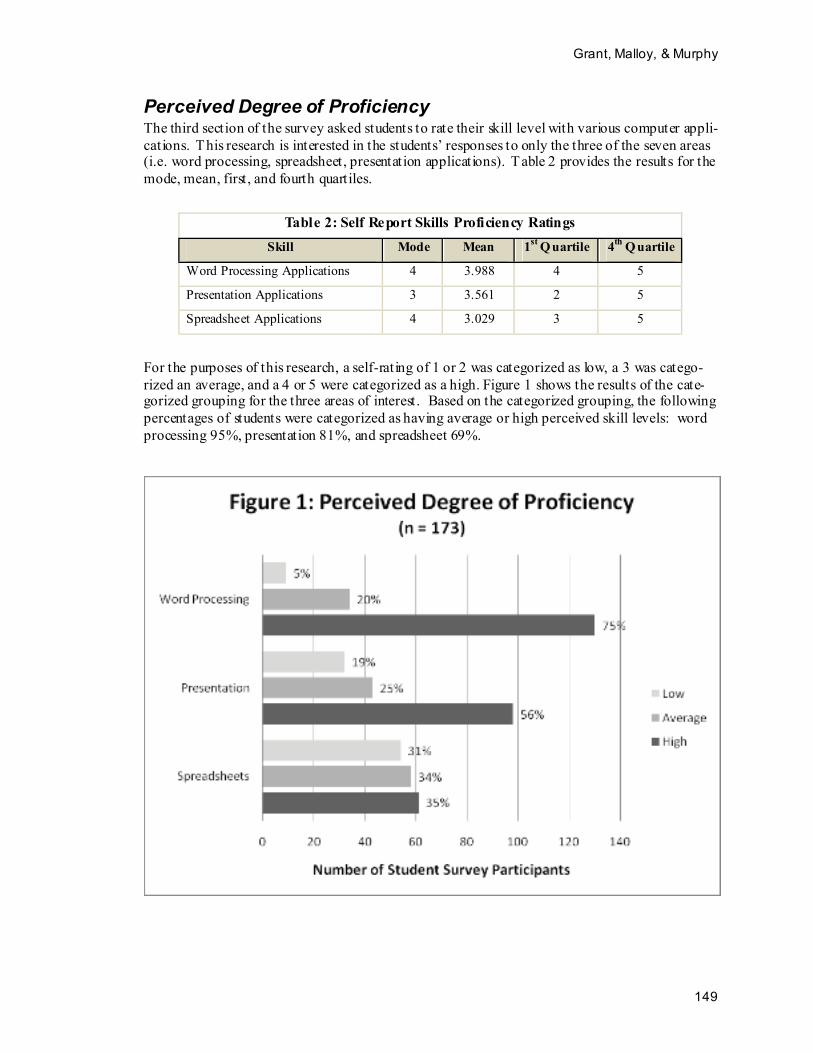
Perceived Degree of Proficiency The third section of the survey asked students to rate their skill level with various computer appli-cations. This research is interested in the students’ responses to only the three of the seven areas (i.e. word processing, spreadsheet, presentation applications). Table 2 provides the results for the mode, mean, first , and fourth quartiles.
Table 2: Self Report Skills Proficiency Ratings
Skill Mode Mean 1st Quartile 4th Quartile
Word Processing Applications 4 3.988 4 5
Presentation Applications 3 3.561 2 5
Spreadsheet Applications 4 3.029 3 5
For the purposes of this research, a self-rating of 1 or 2 was categorized as low, a 3 was catego-rized an average, and a 4 or 5 were categorized as a high. Figure 1 shows the results of the cate-gorized grouping for the three areas of interest. Based on the categorized grouping, the following percentages of students were categorized as having average or high perceived skill levels: word processing 95%, presentation 81%, and spreadsheet 69%.
Comparison of Student Perceptions
150
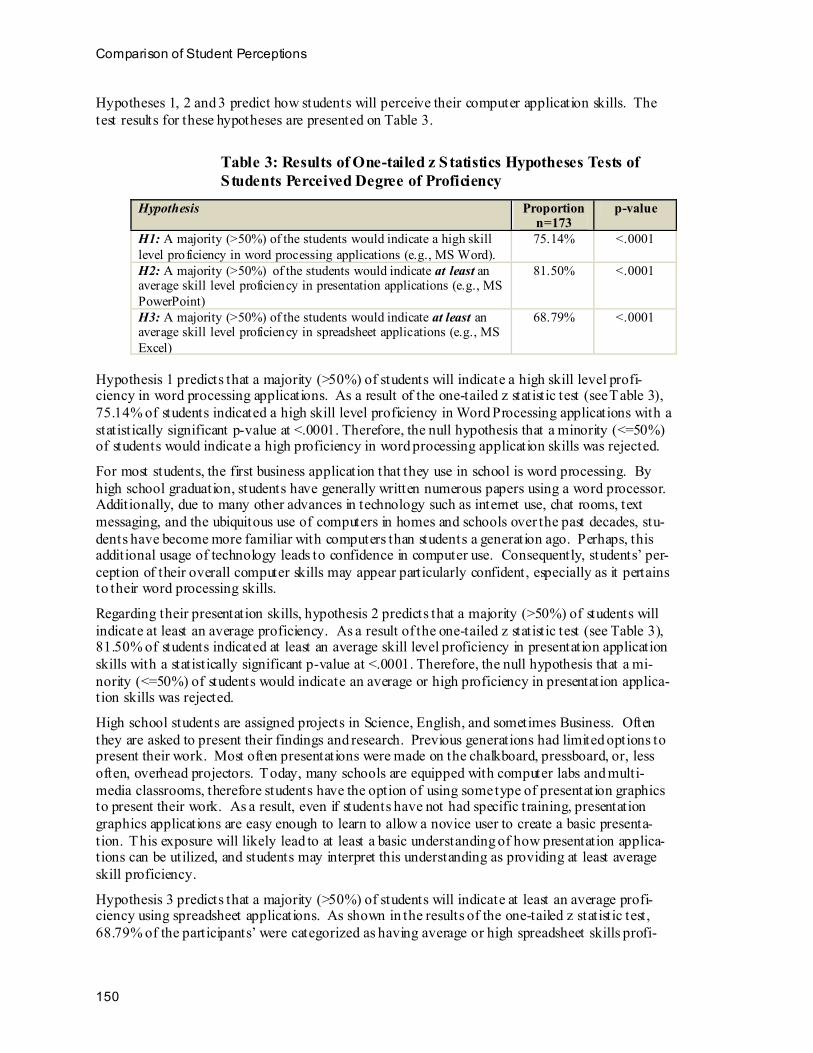
Hypotheses 1, 2 and 3 predict how students will perceive their computer application skills. The test results for these hypotheses are presented on Table 3.
Table 3: Results of One-tailed z Statistics Hypotheses Tests of Students Perceived Degree of Proficiency
Hypothesis Proportion n=173
p-value
H1: A majority (>50%) of the students would indicate a high skill level proficiency in word processing applications (e.g., MS Word).
75.14% <.0001
H2: A majority (>50%) of the students would indicate at least an average skill level proficiency in presentation applications (e.g., MS PowerPoint)
81.50% <.0001
H3: A majority (>50%) of the students would indicate at least an average skill level proficiency in spreadsheet applications (e.g., MS Excel)
68.79% <.0001
Hypothesis 1 predicts that a majority (>50%) of students will indicate a high skill level profi-ciency in word processing applications. As a result of the one-tailed z statistic test (see Table 3), 75.14% of students indicated a high skill level proficiency in Word Processing applications with a statistically significant p-value at <.0001. Therefore, the null hypothesis that a minority (<=50%) of students would indicate a high proficiency in word processing application skills was rejected.
For most students, the first business application that they use in school is word processing. By high school graduation, students have generally written numerous papers using a word processor. Additionally, due to many other advances in technology such as internet use, chat rooms, text messaging, and the ubiquitous use of computers in homes and schools over the past decades, stu-dents have become more familiar with computers than students a generation ago. Perhaps, this additional usage of technology leads to confidence in computer use. Consequently, students’ per-ception of their overall computer skills may appear particularly confident, especially as it pertains to their word processing skills.
Regarding their presentation skills, hypothesis 2 predicts that a majority (>50%) of students will indicate at least an average proficiency. As a result of the one-tailed z statistic test (see Table 3), 81.50% of students indicated at least an average skill level proficiency in presentation application skills with a statistically significant p-value at <.0001. Therefore, the null hypothesis that a mi-nority (<=50%) of students would indicate an average or high proficiency in presentation applica-tion skills was rejected.
High school students are assigned projects in Science, English, and sometimes Business. Often they are asked to present their findings and research. Previous generations had limited options to present their work. Most often presentations were made on the chalkboard, pressboard, or, less often, overhead projectors. Today, many schools are equipped with computer labs and multi-media classrooms, therefore students have the option of using some type of presentation graphics to present their work. As a result, even if students have not had specific training, presentation graphics applications are easy enough to learn to allow a novice user to create a basic presenta-tion. This exposure will likely lead to at least a basic understanding of how presentation applica-tions can be utilized, and students may interpret this understanding as providing at least average skill proficiency.
Hypothesis 3 predicts that a majority (>50%) of students will indicate at least an average profi-ciency using spreadsheet applications. As shown in the results of the one-tailed z statistic test, 68.79% of the participants’ were categorized as having average or high spreadsheet skills profi-
Grant, Malloy, & Murphy
151
ciency with a p-value at <.0001 . Therefore, the null hypothesis that a minority (<=50%) of stu-dents would indicate an average or high proficiency in spreadsheet application skills was rejected. Based on the K-12 Computer/Technology Skills stated in the NC Standard Course of Study (2004), NC students use spreadsheet applications to access, analyze, interpret, synthesize, apply, and communicate information. To assess their spreadsheet proficiency, 22-25% of the questions on the North Carolina Online Test of Computer Skills (2007) focus on these skills. Since 75% of the students in this study are from NC, and would have passed the assessment, it is reasonable for them to perceive themselves as having an average or higher proficiency in spreadsheets skills.
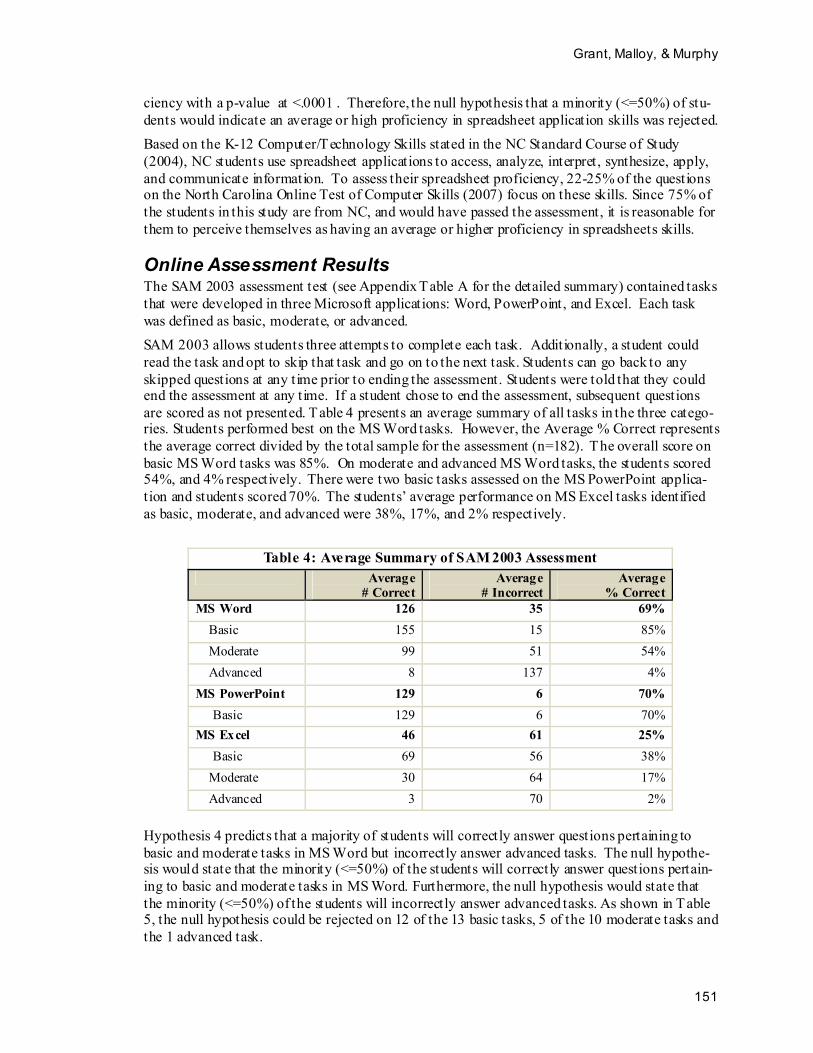
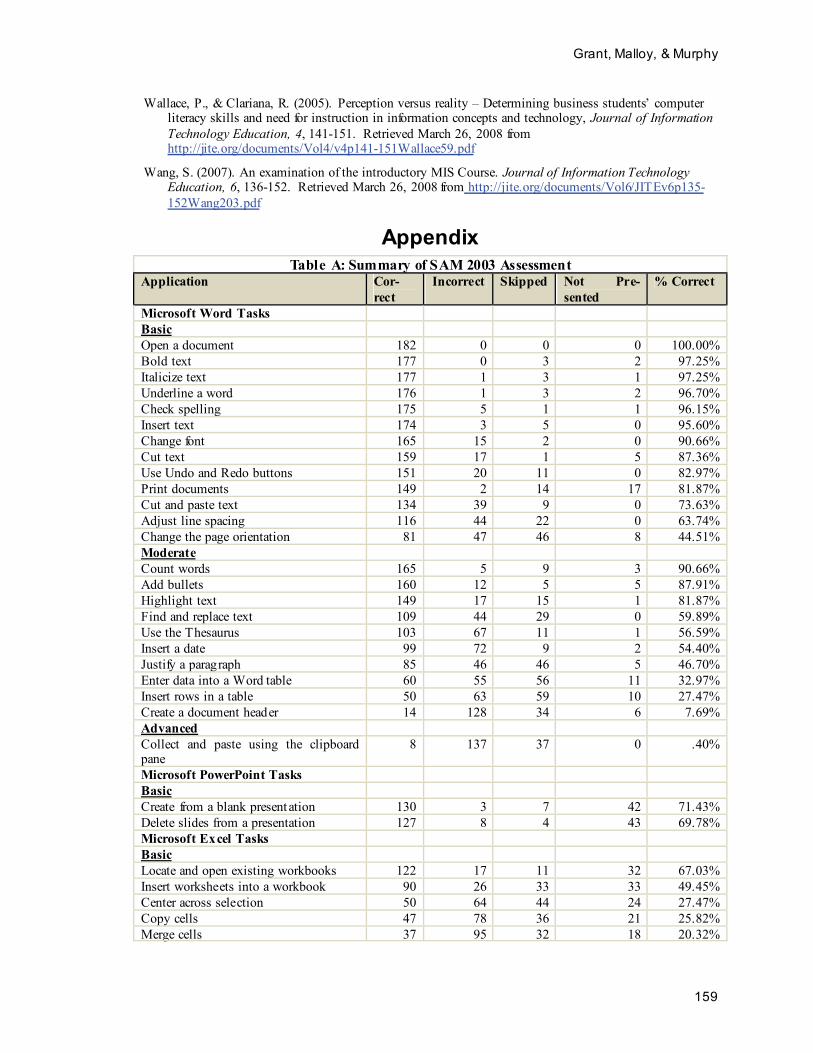
Online Assessment Results The SAM 2003 assessment test (see Appendix Table A for the detailed summary) contained tasks that were developed in three Microsoft applications: Word, PowerPoint, and Excel. Each task was defined as basic, moderate, or advanced. SAM 2003 allows students three attempts to complete each task. Additionally, a student could read the task and opt to skip that task and go on to the next task. Students can go back to any skipped questions at any time prior to ending the assessment. Students were told that they could end the assessment at any time. If a student chose to end the assessment, subsequent questions are scored as not presented. Table 4 presents an average summary of all tasks in the three catego-ries. Students performed best on the MS Word tasks. However, the Average % Correct represents the average correct divided by the total sample for the assessment (n=182). The overall score on basic MS Word tasks was 85%. On moderate and advanced MS Word tasks, the students scored 54%, and 4% respectively. There were two basic tasks assessed on the MS PowerPoint applica-tion and students scored 70%. The students’ average performance on MS Excel tasks identified as basic, moderate, and advanced were 38%, 17%, and 2% respectively.
Table 4: Average Summary of SAM 2003 Assessment Average
Hypothesis 4 predicts that a majority of students will correctly answer questions pertaining to basic and moderate tasks in MS Word but incorrectly answer advanced tasks. The null hypothe-sis would state that the minority (<=50%) of the students will correctly answer questions pertain-ing to basic and moderate tasks in MS Word. Furthermore, the null hypothesis would state that the minority (<=50%) of the students will incorrectly answer advanced tasks. As shown in Table 5, the null hypothesis could be rejected on 12 of the 13 basic tasks, 5 of the 10 moderate tasks and the 1 advanced task.
Comparison of Student Perceptions
152
Clearly, students have more experience with word processing than other business computer appli-cations. This conclusion is probably linked to the use of other technologies as well as students using word processing for high school research. Therefore, not only have students had courses to support the learning of this technology but they also have many opportunities to gain additional experience. Therefore, it is reasonable to expect that students will at least be able to successfully perform basic MS Word tasks. As shown in Table 5, this assertion is supported in all but one of the basic tasks in this assessment. It is further asserted that students will be able to successfully perform moderate tasks. However, the null hypothesis could be rejected in only 5 out of the 10 moderate tasks. It could be that these tasks were incorrectly identified as moderate when in fact these tasks should be categorized as advanced MS Word skills. Advancing technologies have led to more powerful word processing technologies. Modern appli-cations provide users with the ability to organize data in tables and charts, integrate with other applications, use shortcut methods, and vary the style and content of the document. These ad-vanced tasks require a more experienced user. Although the assessment in this study supports the assertion that students would incorrectly perform advanced tasks, due to time limits only one ad-vanced task was presented. An assessment with more advanced tasks would be required to make a stronger claim.
Table 5: Microsoft Word Tasks SAM 2003 Assessment Hypothesis Proportion
n=182 p-value
H4: When evaluated, most students (>50%) will correctly answer questions pertaining to basic and moderate tasks in MS Word. However, most students (>50%) will incor-rectly answer questions pertaining to advanced tasks.
Microsoft Word Tasks Basic Open a document 100.00% <.0001 Bold Text 97.25% <.0001 Italicize text 97.25% <.0001 Underline a word 96.70% <.0001 Check Spelling 96.15% <.0001 Insert Text 95.60% <.0001 Change Font 90.66% <.0001 Cut text 87.36% <.0001 Use Undo and Redo buttons 82.97% <.0001 Print documents 81.87% <.0001 Cut and paste text 73.63% <.0001 Adjust line spacing 63.74% <.0001 Change page orientation 44.51% 0.9309 Moderate Count words 90.66% <.0001 Add bullets 87.91% <.0001 Highlight text 81.87% <.0001 Find and replace text 59.89% 0.0038 Use the Thesaurus 56.59% 0.0376 Insert a date 54.40% 0.1178 Justify a paragraph 46.70% 0.8131 Enter data in a Word table 32.97% 1.0000 Insert rows in a table 27.47% 1.0000 Create a document header 7.69% 1.0000 Advanced Collect and paste using the clipboard pane 95.60%
(incorrect) <.0001
Grant, Malloy, & Murphy
153
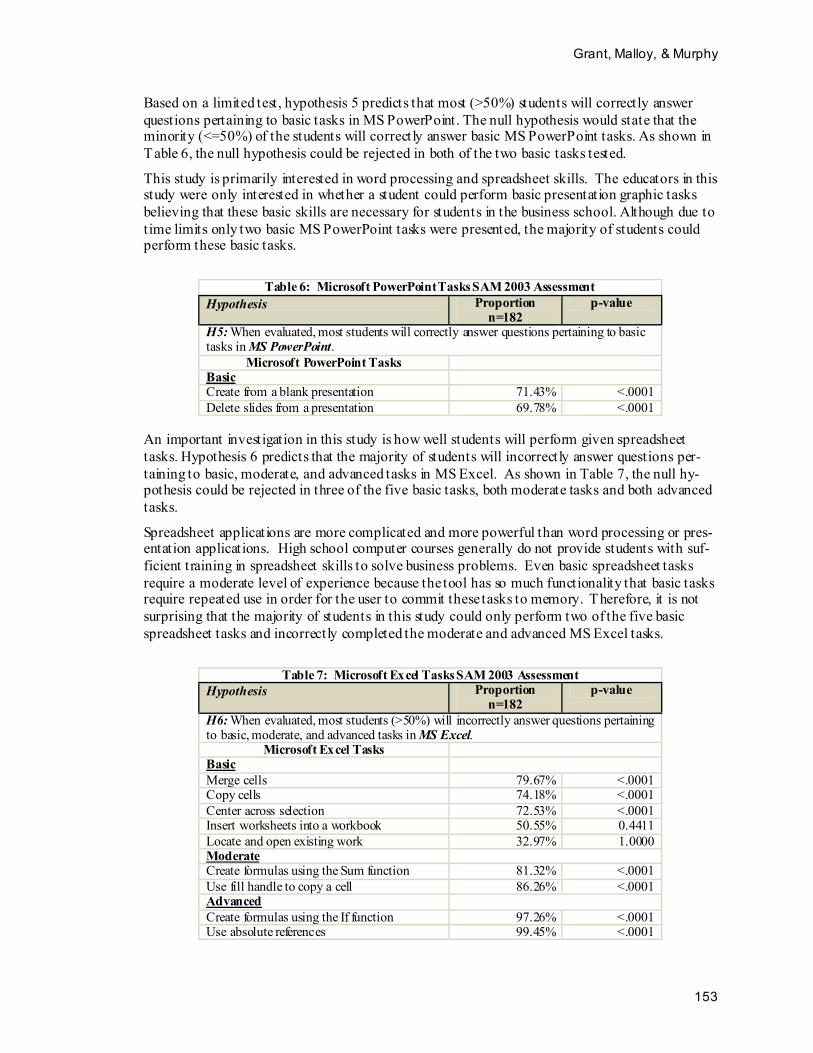
Based on a limited test, hypothesis 5 predicts that most (>50%) students will correctly answer questions pertaining to basic tasks in MS PowerPoint. The null hypothesis would state that the minority (<=50%) of the students will correctly answer basic MS PowerPoint tasks. As shown in Table 6, the null hypothesis could be rejected in both of the two basic tasks tested.
This study is primarily interested in word processing and spreadsheet skills. The educators in this study were only interested in whether a student could perform basic presentation graphic tasks believing that these basic skills are necessary for students in the business school. Although due to time limits only two basic MS PowerPoint tasks were presented, the majority of students could perform these basic tasks.
Table 6: Microsoft PowerPoint Tasks SAM 2003 Assessment Hypothesis Proportion
n=182 p-value
H5: When evaluated, most students will correctly answer questions pertaining to basic tasks in MS PowerPoint.
Microsoft PowerPoint Tasks Basic Create from a blank presentation 71.43% <.0001 Delete slides from a presentation 69.78% <.0001
An important investigation in this study is how well students will perform given spreadsheet tasks. Hypothesis 6 predicts that the majority of students will incorrectly answer questions per-taining to basic, moderate, and advanced tasks in MS Excel. As shown in Table 7, the null hy-pothesis could be rejected in three of the five basic tasks, both moderate tasks and both advanced tasks.
Spreadsheet applications are more complicated and more powerful than word processing or pres-entation applications. High school computer courses generally do not provide students with suf-ficient training in spreadsheet skills to solve business problems. Even basic spreadsheet tasks require a moderate level of experience because the tool has so much functionality that basic tasks require repeated use in order for the user to commit these tasks to memory. Therefore, it is not surprising that the majority of students in this study could only perform two of the five basic spreadsheet tasks and incorrectly completed the moderate and advanced MS Excel tasks.
Table 7: Microsoft Excel Tasks SAM 2003 Assessment Hypothesis Proportion
n=182 p-value
H6: When evaluated, most students (>50%) will incorrectly answer questions pertaining to basic, moderate, and advanced tasks in MS Excel.
Microsoft Excel Tasks Basic Merge cells 79.67% <.0001 Copy cells 74.18% <.0001 Center across selection 72.53% <.0001 Insert worksheets into a workbook 50.55% 0.4411 Locate and open existing work 32.97% 1.0000 Moderate Create formulas using the Sum function 81.32% <.0001 Use fill handle to copy a cell 86.26% <.0001 Advanced Create formulas using the If function 97.26% <.0001 Use absolute references 99.45% <.0001
Comparison of Student Perceptions
154
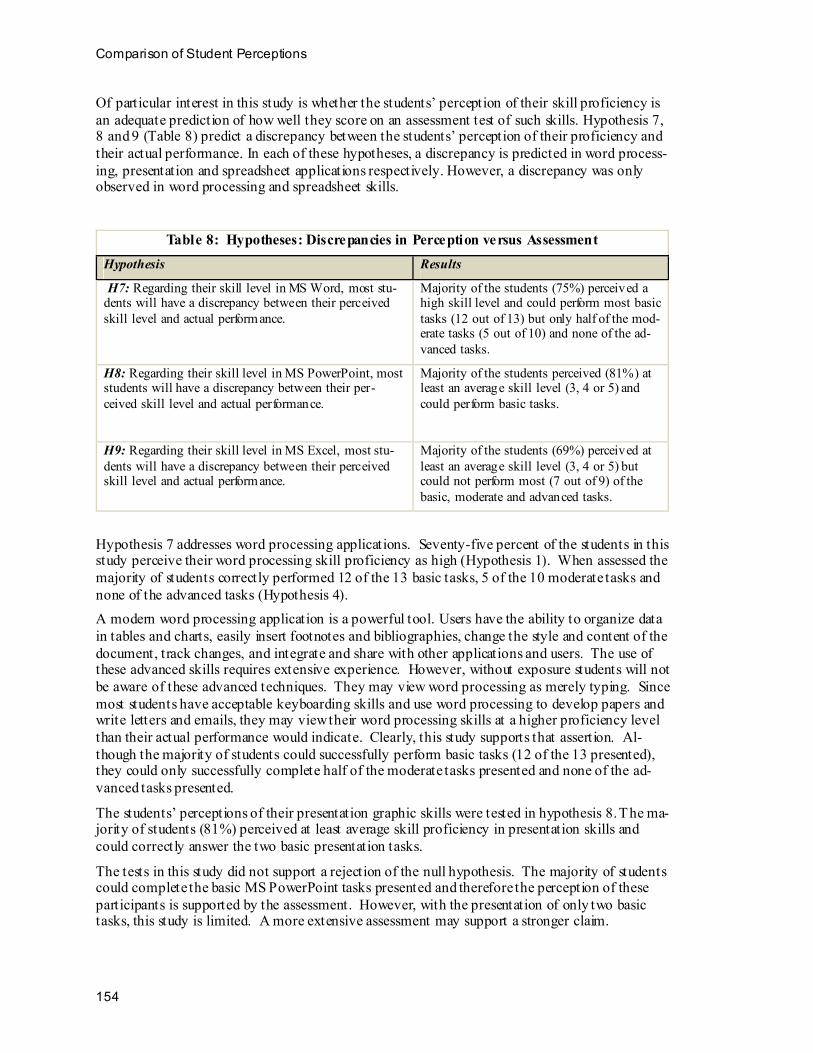
Of particular interest in this study is whether the students’ perception of their skill proficiency is an adequate prediction of how well they score on an assessment test of such skills. Hypothesis 7, 8 and 9 (Table 8) predict a discrepancy between the students’ perception of their proficiency and their actual performance. In each of these hypotheses, a discrepancy is predicted in word process-ing, presentation and spreadsheet applications respectively. However, a discrepancy was only observed in word processing and spreadsheet skills.
Table 8: Hypotheses: Discrepancies in Perception versus Assessment Hypothesis Results
H7: Regarding their skill level in MS Word, most stu-dents will have a discrepancy between their perceived skill level and actual performance.
Majority of the students (75%) perceived a high skill level and could perform most basic tasks (12 out of 13) but only half of the mod-erate tasks (5 out of 10) and none of the ad-vanced tasks.
H8: Regarding their skill level in MS PowerPoint, most students will have a discrepancy between their per-ceived skill level and actual performance.
Majority of the students perceived (81%) at least an average skill level (3, 4 or 5) and could perform basic tasks.
H9: Regarding their skill level in MS Excel, most stu-dents will have a discrepancy between their perceived skill level and actual performance.
Majority of the students (69%) perceived at least an average skill level (3, 4 or 5) but could not perform most (7 out of 9) of the basic, moderate and advanced tasks.
Hypothesis 7 addresses word processing applications. Seventy-five percent of the students in this study perceive their word processing skill proficiency as high (Hypothesis 1). When assessed the majority of students correctly performed 12 of the 13 basic tasks, 5 of the 10 moderate tasks and none of the advanced tasks (Hypothesis 4). A modern word processing application is a powerful tool. Users have the ability to organize data in tables and charts, easily insert footnotes and bibliographies, change the style and content of the document, track changes, and integrate and share with other applications and users. The use of these advanced skills requires extensive experience. However, without exposure students will not be aware of these advanced techniques. They may view word processing as merely typing. Since most students have acceptable keyboarding skills and use word processing to develop papers and write letters and emails, they may view their word processing skills at a higher proficiency level than their actual performance would indicate. Clearly, this study supports that assertion. Al-though the majority of students could successfully perform basic tasks (12 of the 13 presented), they could only successfully complete half of the moderate tasks presented and none of the ad-vanced tasks presented.
The students’ perceptions of their presentation graphic skills were tested in hypothesis 8. The ma-jority of students (81%) perceived at least average skill proficiency in presentation skills and could correctly answer the two basic presentation tasks.
The tests in this study did not support a rejection of the null hypothesis. The majority of students could complete the basic MS PowerPoint tasks presented and therefore the perception of these participants is supported by the assessment. However, with the presentation of only two basic tasks, this study is limited. A more extensive assessment may support a stronger claim.
Grant, Malloy, & Murphy
155
This study is particularly interested in how a student’s perception of his or her skill level in spreadsheet application matches the assessment performance (hypothesis 9). As predicted in hy-pothesis 3, 69% of the students in this study perceived their spreadsheet application proficiency level as average or above. Hypothesis 6 predicted that the majority of students would incorrectly perform basic, moderate, and advanced tasks. The null hypothesis 6 could be rejected in 3 of the 5 basic tasks, both of the moderate tasks and both of the advanced tasks.
Clearly, the majority of students have a higher perception of the proficiency level in spreadsheet applications than the assessment performance would indicate. Various factors could account for this discrepancy.
The majority of students have taken a required computer applications course (109) in high school (Table 1). Additionally, 129 of the 173 students who submitted the survey graduated from a North Carolina high school where a computer applications assessment is required for graduation. Presumably, the required course and the assessment present spreadsheet tasks. Therefore, stu-dents may come to believe that this exposure leads to at least an average proficiency level. How-ever, what the majority of students may not consider is that spreadsheet applications can perform many powerful tasks that require users to not only be familiar with the tool but also be familiar with some basic business, mathematical, and financial problems. Users generally need to repeat even basic tasks in order to acquire an average proficiency. Passing a required course and com-puter applications assessment may lead to a false perception.
Implications With the exception of presentation graphics, this study demonstrates a discrepancy between what the students perceive as their computing skills and their actual assessed computing skills. There may also be a discrepancy between what higher education and secondary education view as nec-essary computer application skills for students entering college or there is an expectation that business schools will teach what is necessary. Further, it is quite possible that secondary educa-tors are teaching to the assessment test rather than training students to perform the necessary ap-plication skills.
This discrepancy is important for two reasons. The obvious reason is that college educators must understand the skills entering students possess in order to adjust the curriculum. In the fall of 2007 the mandatory 15-week computer applications course included three weeks of word proc-essing, two weeks of presentation skills and ten weeks of spreadsheet skills. As a result of this study, the course was changed to focus almost exclusively on spreadsheet skills and require stu-dents to submit a paper and presentation to demonstrate word processing and presentation skills. The course will be further enhanced in 2008. Students will submit all of their work using a com-puter based training and assessment tool. Students will further be required to participate in the online assessment. Any student who cannot demonstrate basic skills in word processing and presentation graphics will be assigned additional training to supplement their skills. An equally important issue is the effect that a student’s perception may have on his or her future training. Self-efficacy literature asserts that the level of any given individual’s belief needs to be sufficient so that he or she will choose to take advantage of opportunities to enhance their skills (Stephens, 2006). Therefore, if the student believes he/she is proficient in computer skills and the assessment indicates that a student lacks sufficient computer application skills, then there may be a negative effect on his or her computer self-efficacy that could interfere with his or her progress through college and beyond. In order to provide an effective and worthwhile course, an assess-ment is necessary because students have diverse and changing skill levels. However, each instruc-tor must be aware of possible negative effects and address the additional training in the course,
Comparison of Student Perceptions
156
rather than making it incumbent upon the student to acquire such skills because they may not have the confidence to do so. Clearly, in this study, the students had a level of perception that did not match their performance on the assessment for spreadsheet skills and some word processing skills. However, if college educators are to be effective providing sufficient computer applications training, then a determi-nation of how best to identify students in need of training cannot interfere with the ability to train such students. A student with a perception that is higher than his or her performance may become discouraged. Therefore, it is not only necessary to identify these students but also help them to understand the discrepancies and address a remedy as soon as possible. Since assessment may have a negative impact on computer self-efficacy and training has a positive effect, then it would seem that educators must walk a fine line. Further, college educators are faced with an additional problem if the passing of a secondary education computer assessment is giving a student a false perception of his or her abilit ies. Assuming a high computer self-efficacy will lead students with low skills to obtain these skills on their own can be dangerous. Therefore, assessments are neces-sary but it cannot end at the assessment. Educators must address low skill performance at the time that it occurs.
Limitations and Future Research All of the North Carolina graduates, who represent seventy-five percent of the study participants, are presumed to be familiar with online assessments, since a requirement of their high school graduation was passing the online computer application assessment. However, many of the stu-dents were not familiar with the SAM 2003 assessment tool. Although the tool is user friendly and students seem to adapt, this unfamiliarity may affect the resulting scores. Consequently, in future studies, students will be given extra time to accommodate this possible limitation.
This study was primarily interested in word processing and spreadsheet applications and therefore in an effort to limit the length of the assessment, only two presentation tasks were assessed. A more extensive assessment may have varying results, therefore, additional presentation tasks will be considered in subsequent research studies. An assumption was made that students would perform better on basic and moderate tasks in word processing applications. This study focused on validating this assumption and, therefore, in an effort to limit the length of the assessment, only a few advanced tasks were chosen. Results may vary on a more extensive assessment; therefore, additional advanced word tasks will be consid-ered in subsequent research studies.
The tasks used in the online assessment were identified as basic, moderate, and advanced accord-ing to their presentation in the Course Technology New Perspective MS Office textbook series and using the judgment of the researchers. However, the researchers recognize that this identifi-cation may have errors. Consequently, future research studies will develop validation processes for basic, moderate, and advance tasks for each business computer application assessed in the study. The purpose of this study was to analyze and compare students’ perception and performance be-fore the introductory computer course was taken. To obtain a comprehensive evaluation of what student learning objectives were achieved during the course and the students’ subsequent percep-tion of self-efficacy, a second survey and assessment will be administered after completion of the course.
The assessment in this study was presented using the Microsoft Office suite. Although Microsoft may have a majority market, students may have experience with other products and no experience with Microsoft. As a result, some variability in performance may exist.
Grant, Malloy, & Murphy
157
Conclusion The importance of achieving a degree of proficiency in computer business applications as well as overall computer literacy have been recognized as essential factors in today’s competitive job market. The ubiquitous use of computers in homes and schools has aided the perception that more students are computer literate than past generations. There is a potential “perfect storm” manifest-ing between students’ perceived proficiency of computer application skills and the actual assess-ment of those skills. Furthermore, since many schools only offer one required information tech-nology course for their business majors, IS faculty must be vigilant in the development of this course. The goal is to create a course that is not only sufficient to adequately prepare (i.e., as-sessment and computer proficiency) but will also be amenable to the students so as to enhance their skills (i.e., perception and computer self-efficacy).
The purpose of this study is to analyze and compare students’ overall perception of their com-puter skill proficiency (i.e., low, average, high) and actual task performance on three different levels (i.e., basic, moderate, advanced) utilizing three different computer business applications (i.e., word processing, presentation graphics, spreadsheets). Three separate task performance categories are used in order to analyze and differentiate various proficiency levels for each of the business computer applications studied. Furthermore, to accomplish the objectives of this re-search two instruments are utilized: a survey to capture students’ perceptions of their computer self-efficacy and a computer skills assessment tool to measure their proficiency. In this study, nine hypotheses are developed to test students’ perceptions, actual performance, and the potential discrepancies in perceptions and performance. The findings of this study indicate some differ-ences in the student’s perception of their word processing skills and actual performance, no dif-ference in perception and performance for presentation skills, and a significant difference in per-ception and performance in spreadsheet skills. As a result of this study, the curriculum for this introductory business computer applications course was modified to address the students’ per-formance deficiency in spreadsheet skills. Additionally, the discrepancy in perception and per-formance in spreadsheets skills allowed the faculty to develop pedagogical strategies to address the potential false perception of the students’ current level of spreadsheet skills versus what is required in the business job market.
Many universities are faced with similar issues in trying to build strong curriculum and effective pedagogies. As a result , some have implemented initial assessments. This study can be particu-larly useful to those universities who may also be interested how their students’ perceptions com-pare to their performance on these assessments and determine how to address the gaps that exist. Requirements of the business job market and students’ knowledge, experience, and self-efficacy of business computer applications is continually changing. Therefore, the continuous evaluation of students’ perception and performance in word processing, presentation graphics, and spread-sheet skills is required in order to evaluate the introductory computer applications course. The enhancement and realignment of this course is essential for educators to prepare students for to-day’s global economy.
References Agarawl, R., Sambamurthy, V., & Stair, R. (2000). Research report: The evolving relationship between
general and speci fic computer sel f-effi cacy – An empirical assessment. Information Systems Research, 11(4), 418-430.
Association to Advance Collegiate School of Business. (2002). Sustain scholarship and business schools. Retrieved March 26, 2008 from http://www.aacsb.edu/publications/dfc/default.asp
Bandura, A. (1977). Social learning theory. Englewood Cliffs, NJ: Prentice-Hall.
Carter, J., & Boyle, R. (2002). Teaching delivery issues: Lessons from computer science. Journal of Infor-mation Technology Education, 1(2), 77-89. Retrieved March 26, 2008 from http://jite.org/documents/Vol1/v1n2p077-089.pdf
Center for Applied Research in Educational Technology. (2005). Retrieved March 26, 2008 from http://caret.iste.org
Compeau, D., & Higgins, C. (1995). Computer self-effi cacy: Development of a measure and initial test, MIS Quarterly, 19(2), 189-211.
Hasan, B. (2003). The influence of speci fic computer experiences on computer sel f-efficacy beliefs. Com-puters in Human Behaviors, 19, 443-450.
Hindi, N., Miller, D. & Wenger, C. (2002). Computer literacy: Implications for teaching a college-level course. Journal of Information Systems Education, 13(2), 143-151.
Hunt, C., & Perreault, H. (1999). Organizational & end-user information systems: A compendium of re-sources and materials. Office Systems Research Journal, 17(1), 37-49.
Johnson, D., Bartholomew, K., & Miller, D. (2006). Improving computer literacy of business management majors: A case study. Journal of Information Technology Education, 5, 77-94. Retrieved March 26, 2008 from http://jite.org/documents/Vol5/v5p077-094Johnson100.pdf
Keengwe, J. (2007). Faculty integration of technology into instruction and students’ perceptions of com-puter technology to improve student learning. Journal of Information Technology Education, 6, 169-180. Retrieved March 26, 2008 from http://jite.org/documents/Vol6/JITEv6p169-180Keengwe218.pdf
Marakas, G., Yi, M., & Johnson, R. (1998). The multilevel and multifaceted character of computer sel f-efficacy: Toward clari fication of the construct and an integrative framework for research. Information System Research, 9(2), 126-163.
Martin, F., & Dunsworth, Q. (2007). A methodical formative evaluation of computer literacy course: What and how to teach. Journal of Information Technology Education, 6, 123-134. Retrieved from http://jite.org/documents/Vol6/JITEv6p123-134Martin217.pdf
McCoy, R. (2001). Computer competencies for the 21st century information systems educator. Information Technology, Learning, and Performance Journal, 19(2), 21-35.
NC Standard Course of Study – Computer skills. (2004). The K-12 Computer/technology skills standard course of study. Retrieved September 14, 2007 from http://www.ncpublicschools.org/curriculum/computerskills/scos/
No Child Left Behind Act of 2001, 20 U.S.C. § 6319. (2008). Retrieved April 2, 2008 from http://www.ed.gov/policy/elsec/leg/esea02/index.html
North Carolina online test of computer skills (2007) Retrieved October 1, 2007 from http://cuacs8.mck.ncsu.edu/nccs/background.asp
Simonson, M., Mauer, M., Toradi, M., & Whitaker, M. (1987). Development of a standardized test of com-puter literacy and a computer anxiety index. Journal of Educational Computing Research, 3(2), 231-247.
Stephens, Paul (2006). Validation of the business computer self-efficacy scale: Assessment of the computer literacy of incoming business students. Journal of Educational Computing Research, 34(1), 29-46.
Stratham, D., & Torell, C. (1996). Computers in the classroom: The impact of technology on student learn-ing. LSS Spotlight on Student Success Digest No. 206.
Stover, S. (2003). Remapping the digital divide. The Information Society, 19, 175-277.
Tesch, D., Crable, E., & Braun, G. (2003). Evaluating IS curriculum issues through an ongoing alumni as-sessment mechanism. Journal of Computer Information Systems, Winter, 40-48.
Tesch, D., Murphy, M., & Crable, E. (2006). Implementation of a basic computer skills assessment mecha-nism for incoming freshmen. Information Systems Education Journal, 4(13), 3-11.
Wallace, P., & Clariana, R. (2005). Perception versus reality – Determining business students’ computer literacy skills and need for instruction in information concepts and technology, Journal of Information Technology Education, 4, 141-151. Retrieved March 26, 2008 from http://jite.org/documents/Vol4/v4p141-151Wallace59.pdf
Wang, S. (2007). An examination of the introductory MIS Course. Journal of Information Technology Education, 6, 136-152. Retrieved March 26, 2008 from http://jite.org/documents/Vol6/JITEv6p135-152Wang203.pdf
Appendix Table A: Summary of SAM 2003 Assessment
Application Cor-rect
Incorrect Skipped Not Pre-sented
% Correct
Microsoft Word Tasks Basic Open a document 182 0 0 0 100.00% Bold text 177 0 3 2 97.25% Italicize text 177 1 3 1 97.25% Underline a word 176 1 3 2 96.70% Check spelling 175 5 1 1 96.15% Insert text 174 3 5 0 95.60% Change font 165 15 2 0 90.66% Cut text 159 17 1 5 87.36% Use Undo and Redo buttons 151 20 11 0 82.97% Print documents 149 2 14 17 81.87% Cut and paste text 134 39 9 0 73.63% Adjust line spacing 116 44 22 0 63.74% Change the page orientation 81 47 46 8 44.51% Moderate Count words 165 5 9 3 90.66% Add bullets 160 12 5 5 87.91% Highlight text 149 17 15 1 81.87% Find and replace text 109 44 29 0 59.89% Use the Thesaurus 103 67 11 1 56.59% Insert a date 99 72 9 2 54.40% Justify a paragraph 85 46 46 5 46.70% Enter data into a Word table 60 55 56 11 32.97% Insert rows in a table 50 63 59 10 27.47% Create a document header 14 128 34 6 7.69% Advanced Collect and paste using the clipboard pane
8 137 37 0 .40%
Microsoft PowerPoint Tasks Basic Create from a blank presentation 130 3 7 42 71.43% Delete slides from a presentation 127 8 4 43 69.78% Microsoft Excel Tasks Basic Locate and open existing workbooks 122 17 11 32 67.03% Insert worksheets into a workbook 90 26 33 33 49.45% Center across selection 50 64 44 24 27.47% Copy cells 47 78 36 21 25.82% Merge cells 37 95 32 18 20.32%
Moderate Create formulas using the SUM function 34 58 55 35 18.68% Use the fill handle to copy a cell 25 69 63 25 13.74% Advanced Create formulas using the IF function 5 70 67 40 2.74% Use absolute references 1 69 78 34 0.55%
Biographies Donna M. Grant is an Assistant Professor of Computer Information Systems at North Carolina Central University. Dr. Grant received her Ph.D. in Computer Science from DePaul University in 2007, where she also earned a M.S. in Information Systems and a M.B.A. in Finance. Additionally, she earned a B.S. in Mathematics at Northwestern Uni-versity. To date, Dr. Grant has published her work in ten conferences, the Encyclopedia of Gender and Information Technology, and the In-forming Science Journal. Prior to receiving her doctorate, Dr. Grant spent 22 years in the IT industry where she worked as a Director of Information Technology at Ameritech.
Alisha D. Malloy is an Assistant Professor of Computer Information Systems at North Carolina Central University. She holds a PhD in Computer Information Systems from Georgia State University. She also holds a Masters in Engineering Management from Old Dominion University and a Bachelor of Science in Engineering from the United States Naval Academy. Dr. Malloy has published in ACM/Kluwer Journal on Mobile Networks and Applications (MONET), Computers, Encyclopedia of Information Systems, and several others. Dr. Malloy is a member of the PhD Project, Association of Computing Machinery, Association for Information Systems, and Institute of Electrical and Electronics Engineers.
Marianne C. Murphy is an Associate Professor of Computer Infor-mation Systems at North Carolina Central University. She earned her PhD at Arizona State University in 1997 and an MBA from Kent Uni-versity in 1994. Her primary teaching interests are computer applica-tions, data management, and mainframe systems. In addition to her teaching experience, her industry experience includes audit, account-ing, bank mergers/acquisitions, and network consulting. Her primary research interests include teaching methodologies, system security and database management.


![The [Mis] Perceptions of Graduate Student Research Skills ......MENTOR PERCEPTIONS AND STUDENT RESEARCH SKILLS 1 Abstract The mismatch between the academic preparation and realistic](https://static.documents.pub/doc/80x56/5e5fb64dbced5e760a5780d8/the-mis-perceptions-of-graduate-student-research-skills-mentor-perceptions.jpg)
