1 A comparison of techniques used to simulate the scattering of electromagnetic radiation by metallic nanostructures J. Parsons, C. P. Burrows, J. R. Sambles and W. L. Barnes School of Physics, University of Exeter, Stocker Road, Exeter, EX4 4QL, United Kingdom ABSTRACT A comparison is presented of a number of simulation techniques which are used to compute the scattering of electromagnetic radiation by metallic nanostructures. The simulation techniques considered here are Mie theory, the T-Matrix null-field method, the discrete- dipole approximation, the finite-element method and the finite-difference time-domain method. The suitability of each technique is compared in terms of the accuracy, computation time and the range of geometries to which it can be applied. Using each technique, we perform example calculations by simulating the optical response of a 80 nm diameter Au sphere in vacuum. Our main conclusions are summarised in tabulated form, so that the findings presented in this article may serve as a useful reference guide to those looking for suitable numerical tools to model the optical response of metallic nanostructures. Journal of Modern Optics, 57, 1362 (2010)
Transcript
1
A comparison of techniques used to simulate the scattering of
electromagnetic radiation by metallic nanostructures
J. Parsons, C. P. Burrows, J. R. Sambles and W. L. Barnes
School of Physics, University of Exeter, Stocker Road, Exeter, EX4 4QL, United Kingdom
ABSTRACT
A comparison is presented of a number of simulation techniques which are used to compute
the scattering of electromagnetic radiation by metallic nanostructures. The simulation
techniques considered here are Mie theory, the T-Matrix null-field method, the discrete-
dipole approximation, the finite-element method and the finite-difference time-domain
method. The suitability of each technique is compared in terms of the accuracy, computation
time and the range of geometries to which it can be applied. Using each technique, we
perform example calculations by simulating the optical response of a 80 nm diameter Au
sphere in vacuum. Our main conclusions are summarised in tabulated form, so that the
findings presented in this article may serve as a useful reference guide to those looking for
suitable numerical tools to model the optical response of metallic nanostructures.
Journal of Modern Optics, 57, 1362 (2010)
2
I. INTRODUCTION
Controlling and manipulating light at the nanoscale is a rapidly expanding field of research,
enabled by advances in both fabrication techniques and improved capabilities in numerical
simulation. Good simulations are valuable in developing a better understanding, in guiding
experiments, and in exploring realms not easily accessed by experiment. For those entering
this area and wishing to carry out their own simulations, or better appreciate the simulations
of others, there appears to be a wide and rather confusing array of techniques on offer. It is
the purpose of the present contribution to give an introduction to the numerical simulation
techniques, particularly with reference to the scattering of light by a simple metallic
nanostructure, a gold nanosphere in vacuum.
A comprehensive review is beyond the scope of the present contribution. Instead, we focus
our attention on five common techniques, these being Mie Theory, the Transition Matrix
‘null-field’ method (T-Matrix), the discrete-dipole approximation (DDA), the finite-element
method (FEM) and the finite-difference time-domain (FDTD) method. Our simulations
were conducted using a Dell Vostro 200 computer, with a dual-core processor (each having a
clock speed of 2.19 GHz) and 2 Gb of RAM.
II. SIMULATION TECHNIQUES
Here we give a very brief outline of the different techniques. References are provided which
contain a more detailed description of each approach, and a good comparison is set out by
Kahnert [1].
a) Mie Theory
Mie Theory (Mie) is a solution of the Maxwell equations applicable to the scattering of an
incident plane wave by a spherical, isotropic and non-magnetic particle in a non-absorbing
isotropic medium [2,3]. Assuming that in the region of interest there are no sources (charges
or currents) then the Maxwell equations can be written as,
3
(1)
(2)
(3)
(4)
From the Maxwell equations one can in turn show that a time-varying electromagnetic-field
(E, H) in an isotropic medium must satisfy the Helmholtz wave equations (equations 5 and
6).
(5)
(6)
where
(7)
The essence of Mie theory is to consider the scattering of light by a spherical object. Taking
advantage of the symmetry of the sphere, the scattered fields are expressed in terms of vector
spherical harmonics. In this approach the field vectors E and H are replaced by the vectors
Mn and Nn. The subscript n indicates that different vector spherical harmonics are used to
describe dipolar (n = 1), quadrupolar (n = 2) etc. contributions to the scattered field. The
scattered fields are related to these vector spherical harmonics through,
In equations 8 and 9, , E0 being the incident field. In the subscripts of M
and N, ‘o’ and ‘e’ represent the odd and even branches of the azimuthal solution to the vector
form of the Helmholtz wave-equation, 1 denotes the m = 1 terms of the Legendre and Bessel
(9)
(8)
4
series. The an, and bn terms are referred to as the Mie coefficients, which determine the
relative amplitudes of the vector spherical harmonics when excited with a particular
wavelength of light, these are given by:
where n1 / n2 is the relative refractive index (n1 is the complex refractive index of the
particle, n2 is the refractive index of the surrounding medium), = µ1 / µ2 (µ1 is the complex
relative magnetic permeability of the particle, µ2 is the complex relative magnetic
permeability of the surrounding medium), is the size parameter (a is the radius
of the sphere and λ is the wavelength in vacuum), and are the spherical Bessel functions
and spherical Hankel functions of order n respectively. The primed terms in equations 10 and
11 indicate differentiation of the functions with respect to their argument. It is thus in the an,
and bn terms that the size and relative permittivity and permeability of the sphere are
included.
When evaluating the electromagnetic scattering response of metallic nanoparticles, the
magnitudes of the scattering cross-section, σsca, and scattering efficiency, Qsca, are often used.
The scattering cross-section is defined as the integral of the modulus of the scattered electric-
field squared across a spherical surface in the far-field, which is subsequently normalised by
the incident irradiance (equation 12). The scattering efficiency is equal to the scattering
cross-section normalised by the geometrical cross-sectional area of the scatterer (equation
13).
(12)
(10)
(11)
5
One can easily calculate the an and bn coefficients using computer codes, from which the
scattered field can be derived using equations 8 and 9. Mie Theory can also be extended to
simulate other spherically symmetric geometries such as dielectric particles with metallic
coatings [2,3].
b) The ‘T-Matrix’ null-field method
As we have previously seen in discussing Mie Theory, the linearity of the Maxwell equations
ensures a direct relationship between the coefficients of the vector spherical harmonics of the
incident and scattered electric- and magnetic-fields. In the matrix representation (equation
14), the operator which relates the coefficients is termed the Transition Matrix (the T-
Matrix).
The ‘T’ terms in equation 14 correspond to elements of the T-Matrix, (anscattered, bn
scattered) and
(anincident, bn
incident) are the coefficients of the scattered- and incident-field respectively. The
elements of the T-Matrix depend only on the relative refractive index of the particle m = n1 /
n2 (n1 is the complex refractive index of the particle, n2 is the refractive index of the
surrounding medium), the size parameter (a is the radius of the sphere and λ is
the wavelength in vacuum), and the orientation of the particle with respect to the coordinate
system] [4-8].
For a spherical scatterer, the an and bn terms in equation 14 are equal to the weighting
coefficients of the vector spherical harmonics in equations 10 and 11. A number of
techniques may be used to compute the T-Matrix, very often the ‘null-field’ method is used.
Here the incident plane wave is expanded into a series of spherical harmonics, and the
coefficients of the incident- and internal-fields are matched at the particle boundary. To
simplify the mathematical analysis, the internal polarization currents are described by an
equivalent distribution of electric and magnetic currents across the surface of the particle [9].
(14)
(13)
6
The surface of the scatterer is discretised into a finite number of point sources, at which both
the internal field and surface current density are determined. Each point source radiates a
spherical electromagnetic wave which arises from the tangential components of the electric
and magnetic currents at the surface of the particle. The scattered-field is the wave-front
which is obtained by summing the partial waves from all sources over the particle surface.
There are several T-Matrix codes which are available as open-source applications for use on
Unix and Windows operating systems (http://www.t-matrix.de). A rigorous derivation of the
T-Matrix ‘null field’ method can be found in the literature [4]. The key advantage of the T-
Matrix technique is that the T-Matrix is the property of a particle. Once it has been
determined the scattered fields may be computed for any particle orientation without having
to solve the problem from scratch. The T-Matrix method can also be used to model the
optical response of arrays of symmetric particles.
c) The discrete-dipole approximation (DDA)
In the discrete-dipole approximation (DDA) each particle is modeled as an assembly of finite
cubic elements. Each of these elements is considered sufficiently small that only dipole
interactions with the incident electric-field and the induced-fields in neighboring elements
need to be considered. This reduces the solution of the Maxwell equations to an algebraic
problem of many coupled dipoles [10]. Each of the dipoles within a continuous assembly
acquires a dipole moment in response to both the external electric-field, and the electric-fields
from neighbouring dipoles. The radiated electric-field of an individual dipole may be
approximated as [11,12]:
Here is a unit vector associated with a vector r which is taken from the dipole to the
location at which the electric-field is sampled, d is the distance to the sampling point, p is the
vector associated with the induced dipole moment, ω is the angular frequency of the scattered
radiation and ε0 is the permittivity of free space. In solving for the scattering characteristics
of the continuous assembly, each dipole in the cubic array has an induced dipole moment Pi =
αiElocal. Here αi is the polarizability of the material associated with the dipole element – it is
(15)
7
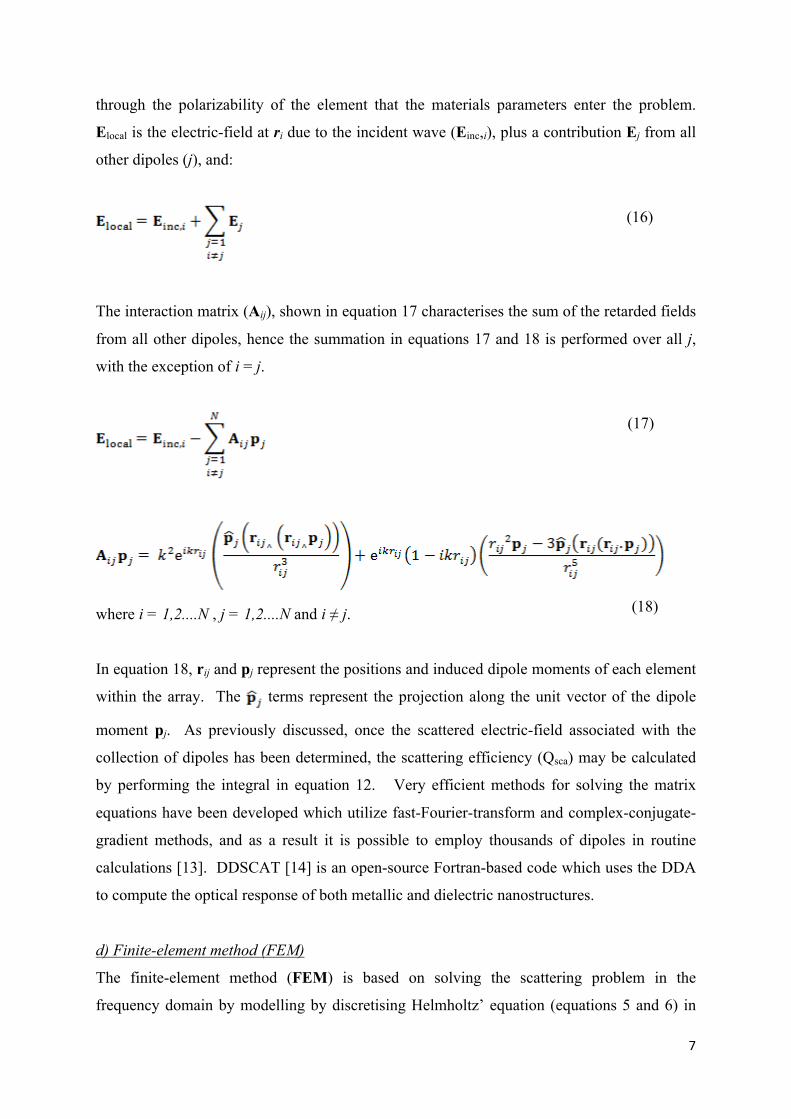
through the polarizability of the element that the materials parameters enter the problem.
Elocal is the electric-field at ri due to the incident wave (Einc,i), plus a contribution Ej from all
other dipoles (j), and:
The interaction matrix (Aij), shown in equation 17 characterises the sum of the retarded fields
from all other dipoles, hence the summation in equations 17 and 18 is performed over all j,
with the exception of i = j.
where i = 1,2....N , j = 1,2....N and i ≠ j.
In equation 18, rij and pj represent the positions and induced dipole moments of each element
within the array. The terms represent the projection along the unit vector of the dipole
moment pj. As previously discussed, once the scattered electric-field associated with the
collection of dipoles has been determined, the scattering efficiency (Qsca) may be calculated
by performing the integral in equation 12. Very efficient methods for solving the matrix
equations have been developed which utilize fast-Fourier-transform and complex-conjugate-
gradient methods, and as a result it is possible to employ thousands of dipoles in routine
calculations [13]. DDSCAT [14] is an open-source Fortran-based code which uses the DDA
to compute the optical response of both metallic and dielectric nanostructures.
d) Finite-element method (FEM)
The finite-element method (FEM) is based on solving the scattering problem in the
frequency domain by modelling by discretising Helmholtz’ equation (equations 5 and 6) in
(17)
(18)
(16)
8
space and then solving numerically to find fields that satisfy the boundary conditions: these
are (i) that the tangential field components are continuous across the surface of the particle,
and (ii) (the radiation condition) that fields decay into the far-field no slower than 1/r for
large r). Material parameters enter through the wavevector (equation 7). The overall
problem space is discretised into many smaller regions, the grid mesh, which very often are
tetrahedral. The electric- and magnetic-fields inside each region are described by a local
function. Since the tetrahedra have flat faces they cannot exactly represent the surface of a
sphere, but by using enough of them a sufficiently accurate polyhedral approximation is
possible [15]. A key point in the FEM approach is that one has to avoid the scattered fields
being reflected at the boundary of the computational domain (for the case of an isolated
particle anyway) – such reflections would provide spurious artefacts in the computation.
It is possible to assess the accuracy of the numerical solution by comparing results from a
sequence of successively refined meshes. The solutions often have geometric features such
as localized regions of high field-gradient. In this case it is more economical to refine the
mesh selectively, (i.e., only where these high gradients occur). Such adaptive refinement
procedures generate a sequence of solutions on successively finer meshes, at each stage
selecting and refining those elements at which the gradient of E or H is largest between
adjacent elements. In practice, the process is terminated when the gradient of the fields
between adjacent tetrahedra falls below a preset limit, or if the total number of elements are
such that the computation time for the simulation exceeds a specified duration (both of these
constraints are chosen by the user). Ansoft’s High Frequency Structure Simulator (HFSS)TM,
and ComsolTM are examples of commercial FEM modelling software. The Free Finite-
element Package (http://www.ffep.sourceforge.net) is an example of an open-source
application.
e) Finite-difference time-domain method (FDTD)
Finite-difference time-domain (FDTD) computations involve discretisation of time and
space, i.e. all spatial and temporal derivatives in the Maxwell curl equations (equations 1 and
2) are replaced by finite difference quotients. Typically a Cartesian volume element of sides
Δx, Δy, Δz, is used for the space discretisation (there are several methods used for
discretisation, the most common being the Yee scheme [18-19]), and a time step Δt for the
time discretisation [20]. The essence of the FDTD approach is to inject a plane wave at
9
some initial time and compute new field components from differences calculated using the
field components that applied during the previous time interval. In fact the electric field
vector components in the volume element are solved at a given instant in time, then the
magnetic field vector components in the same volume element are solved at the next instant
in time and so on. This process is continued iteratively until the transient solution for the
fields has converged to a steady-state solution. The near-field solution that one obtains for
the fields inside the computational domain is then Fourier transformed into the frequency
domain and subsequently propagated into the far-field, using either a surface integration
technique or a volume integration technique. As discussed with the FEM approach, when
simulating individual particles using the FDTD method one has to avoid the scattered fields
being reflected at the boundary of the computational domain..
Since the FDTD method is solved in the time-domain, dispersion information must be
specified over a much wider range of frequencies than simply the range of interest. It is
therefore necessary for the permittivity of metallic structures to be approximated using a
frequency-dependent permittivity model, as opposed to using experimental values, which
may not necessarily cover the required range. FDTD simulations conventionally use a
Drude-Lorentz model (equation 19) to represent permittivity values, ω is the angular
frequency of the incident radiation and the parameters ε∞, ωd, γd, Γl, Ωl and ∆ are constants
which are fitted against experimental relative permittivity values [21-22].
The optical response in the frequency domain is determined by taking a Fourier transform of
the time-domain signal associated with the scattered electric- and magnetic-field
distributions. Commerical FDTD software packages include Lumerical FDTD SolutionsTM
and Remcom XfdtdTM. The MIT Electromagnetic Equation Propagation (http://ab-
initio.mit.edu/wiki/index.php/Meep) package is an example of an open-source FDTD
application.
(19)
10
III. SUITABILITY OF EACH TECHNIQUE
Mie theory is the preferred option for simulating the optical response of metallic nanospheres
since in principle it offers an exact solution for the scattering of electromagnetic radiation by
spherical geometries which is limited only by the truncation order of the solution [3]. In
contrast to DDA, FEM modeling or the FDTD method, the accuracy of the Mie Theory
solution does not depend on resolution-limited parameters such as the inter-dipole spacing or
element length. It was previously shown that the scattered-field can be represented as a sum
of vector spherical harmonics. If this sum is performed over an infinite number of harmonics
(equations 8 and 9) the result would constitute an exact solution for the case of the interaction
between an incident plane wave and a spherical scatterer. In practice, however, the sum is
truncated at a finite number of terms, and the accuracy of the solution will therefore depend
on the truncation order. The T-Matrix method can also be used to simulate spherical particles
since for a spherical particle the scattered electric- and magnetic-fields simplify to those
obtained using Mie Theory. Both Mie Theory and T-Matrix methods can be used to compute
the scattered-field more rapidly in comparison to the other approaches (the DDA, FEM and
FDTD methods), with the computation time being proportional to (r / λ), where r is the
sphere radius and λ is the incident wavelength [6]. However, for spheres with radii less than
1µm which are simulated at visible frequencies, the computation time is extremely rapid and
the dependence on the size of the sphere often goes unnoticed. To evaluate the scattering
efficiency (Qsca) for a 80 nm diameter Au sphere at one particular frequency takes
approximately 1.0 × 10⁻³ seconds using both Mie Theory and T-Matrix methods. A
comparison between the measured and simulated optical response of a metallic nanosphere is
discussed elsewhere [23,24].
If the particle under consideration is non-spherical, but has planar symmetry, or is axially
symmetric, it is possible to use the T-Matrix method to compute the scattering characteristics.
The majority of T-Matrix codes contain embedded routines which are specifically adapted to
match the boundary conditions relating the internal-, incident- and scattered-fields for various
geometries such as spheres, cylinders, cones and stratified particles. As with Mie Theory, the
computation time also scales according to the ratio between the particle size and the incident
wavelength. The truncation of the field expansions can introduce rounding errors, which for
the T-Matrix method may be significant for sufficiently elongated or flattened objects.
11
Mischenko has conducted an extensive study into the effects of particle size on the
convergence of the solutions which are derived from the T-Matrix method [4].
The DDA can also be utilised to evaluate the scattering properties of isotropic non-spherical
particles which are axially-symmetric or posses other planes of symmetry. The fundamental
concept of this approach is that a solid particle is replaced by an array of N point dipoles on a
cubic lattice which has a period that is significantly smaller than the wavelength of the
incident radiation. The computation time of the simulation is therefore heavily dependent on
the inter-dipole spacing and the total number of dipoles which are used to replicate the
original scattering object. For example, the time to evaluate the scattering efficiency of a 80
nm diameter Au sphere using an inter-dipole spacing of 3 nm is approximately 48 seconds for
one particular frequency of light. This is significantly longer than the Mie Theory solution,
which takes only 10−3 seconds per frequency. If the inter-dipole spacing is increased to 4 nm
the computation time using the DDA is halved to 24 seconds. The limiting factors which
affect the computation time of the DDA are the CPU speed and RAM of the workstation
used. The RAM requirement, as specified by the program, is given by equation 20 where Nx,
Ny, and Nz are the number of dipoles which are distributed across the scattering particle in the
Ωl_=_4.10_×_1015_Hz and ∆ = 1.09 [21,22] (used for the FDTD simulation). In Figure 2
the simulated Qsca values are plotted as a function of wavelength for a 80 nm diameter Au
sphere in vacuum using Mie Theory (www.iap.unibe.ch/publications/download/201/en/), the
T-Matrix method (http://www.t-matrix.de), the DDA (DDSCAT [14] version 6.1), FEM
modelling (Ansoft HFSSTM version 11.0) and FDTD (Lumerical FDTD SolutionsTM version
5.0). The DDA and FDTD methods use a 3.00 nm inter-dipole spacing and element length
respectively, whilst the minimum element length for the FEM simulation is 3.11 nm. For
each of the simulation techniques considered, the scattering efficiency curves exhibit maxima
at a wavelength of 525 nm. These maxima are associated with the excitation of the localized
surface-plasmon resonance of the structure [3,9,28].
The Mie Theory and T-Matrix methods both show good agreement across the frequency
range studied. These methods in principle offer an exact solution for the scattering of
electromagnetic radiation from spherical geometries and are limited only by the truncation
order used to obtain the solution. For the structure considered here, the maximum
recommended truncation order (nmax) is 8 for both Mie Theory and T-Matrix methods [2].
15
The relative error of the truncated solution is less than 0.001% when compared to the exact
solution. It is impractical to continue the summation beyond n = 8 as the magnitudes of the
field quantities become extremely small, such that they are comparable to the numerical
rounding errors which are introduced by the mathematical modelling software. Unlike the
other techniques, the errors associated with Mie Theory and the T-Matrix method arise from
numerical rounding, and not the level of discretisation used for the calculation.
The scattering efficiency curves in Figure 2 for the DDA, FEM and FDTD methods are for
comparable levels of discretisation. Figures 3 and 4 show simulated Qsca obtained using an
exact Mie Theory solution compared with those obtained using DDA and FEM approaches
respectively. The element length and inter-dipole spacing have been varied so as to
determine the relative error in the scattering efficiency when compared to the Mie Theory
solution, shown in the inset of each figure. In the limit that either the mesh element length or
inter-dipole spacing approach zero, the scattering efficiencies from the DDA, FEM and
FDTD are found to approach the Mie theory solution. As has already been discussed, the
numerical accuracy of the techniques depends on the resolution of these parameters.
However, a compromise has to be made which takes into account the computation time of the
simulation and the specification of the available hardware. Simulations were conducted
using a Dell Vostro 200 computer, with a dual-core processor (each having a clock speed of
2.19 GHz) and 2 Gb of RAM. The curves shown for each of the techniques in Figure 2
represent the minimum element-length or inter-dipole separation which may be used in order
to achieve a computation time which does not exceed 4.5 hours.
From figures 3 and 4 it can be seen that the sources of maximum error when using the DDA
and FEM methods occur close to the wavelength associated with excitation of the localized
surface-plasmon resonance (LSPR). The scattering behavior at the LSPR wavelength is
dominated by the resonant field enhancement that occurs at the surface of the metallic
particle. Any resolution-limited factors therefore lead to errors in the field matching
conditions at the surface, and to discrepancies when the simulated scattering response is
compared against that of the Mie Theory solution. For the DDA there is also a discrepancy at
longer wavelengths, away from the resonant frequency. This residual error in the long-
wavelength limit has also been observed elsewhere [14], and can be explained through local-
field effects which lead to the dipoles near the surface of the sphere having a different
effective polarizability from those away from the surface [29]. The error is a lattice effect
16
which arises as a consequence of using a discrete collection of volume elements with
identical polarisabilities to represent a continuous medium. The magnitude of this error
decreases significantly as a function of inter-dipole separation, see the inset of figure 3.
The discrepancy between the FDTD method and the other techniques occurs through the use
of permittivity values based on a Drude-Lorentz model. In order to investigate just the role
of FDTD mesh element size, a different comparison is considered in Figure 5 in which
permittivity values based on the Drude-Lorentz model parameters are used for both FDTD
and Mie Theory calculations. In Figure 5, simulated scattering efficiency values Qsca for an
80 nm diameter Au sphere in vacuum obtained using the FDTD technique are directly
compared against Mie Theory using permittivity values calculated using a Drude-Lorentz
model for Au (ε∞ = 5.9673, ωd_=_1.32_×_1016 Hz, γd_=_1.00 × 1014 Hz, Γl = 6.60 × 10¹⁴ Hz,
Ωl = 4.10 × 10¹⁵ Hz and ∆ _=_1.09) [21,22]. As the element-length of the mesh is reduced,
the simulated values of Qsca from the FDTD method are also shown to approach the
equivalent Mie Theory solution. For simulations which use comparable discretisation (~3
nm), it can be seen that the relative error between Mie Theory and the FDTD method at the
frequency of the localized surface-plasmon resonance (4.1%) is significantly greater than that
which is observed when using FEM modelling (0.4%) and the DDA (1.6%). This is in
agreement with previous work [30] and arises from the use of a regular Cartesian mesh for
the FDTD simulation, which is not an accurate representation for the surface curvature of the
sphere. A sufficient mesh size refinement is required in order to ensure convergence of the
solution, particularly in regions close to the surface of the sphere where there is strong
confinement of the electric- and magnetic-field. Other studies have also shown that when a
cubic mesh is used to simulate spherical geometries, a minimum element length of 0.25 nm is
required in order to achieve a relative error of less than 1.0% [30]. Conversely, the use of a
non-regular tetrahedral adaptive mesh for the FEM simulation allows for a more accurate
approximation of curved surfaces, and a smaller relative error is observed.
V. CONCLUSION
In conclusion, we have compared five techniques used to simulate the scattering of
electromagnetic radiation by metallic nanoparticle structures. Using the example of an 80 nm
diameter Au sphere in vacuum, the simulated scattering efficiency obtained using a Mie
17
theory solution has been compared with those obtained using other numerical techniques (the
T-Matrix method, DDA, FEM and FDTD methods). We have shown that when parameters
which govern the resolution of these alternative methods (such as inter-dipole spacing for the
DDA, or element length for FEM and FDTD methods) approach zero, the results of the
simulations approach those of the Mie Theory solution. It has also been shown that the use of
a non-regular tetrahedral adaptive mesh for the FEM simulation allows for a more accurate
approximation of curved surfaces, leading to a smaller relative error between Mie Theory and
FEM than the equivalent comparison for the cubic-mesh-based FDTD method.
There are many factors which should be considered when choosing an appropriate simulation
technique, and the significant advantages and disadvantages of each approach are
summarised in Table 1. It is hoped that the findings presented here may serve as a useful
reference guide for future calculations.
VI. ACKNOWLEDGEMENTS
This work was supported through funding from Hewlett Packard (Bristol) in association with
Great Western Research (http://www.gwr.ac.uk). WLB is a Royal Society Wolfson Merit
Award holder. The authors acknowledge many useful discussions with Dr. C. Newton of
Hewlett Packard (Bristol) and Dr. A. P. Hibbins of the University of Exeter.
18
References:
[1] Kahnert, F. M. J. Quant. Spec. & Rad. Trans. 2003, 79-80, 775−824. [2] Mie, G. Ann. Phys. 1908, 25, 377−445. [3] Bohren, C. F.; Huffman, D. R. Absorption and scattering of light by small particles;
Wiley: New York, 1983. [4] Mishchenko, M. I. Published thesis: Electromagnetic Scattering in Discrete Random
media: Fundamental Theory and Applications; Cambridge University Press: Cambridge, 2002.
[5] Doicu, A.; Wriedt, T. J. Opt. Soc. Am. A 1999, 16, 2539−2544. [6] Nieminen, T.; Rubinsztein-Dunlop, H.; Heckenberg, N. R. J. Quant. Spec. & Rad.
Trans. 2002, 79, 1019−1029. [7] Quirantes, A. J. Quant. Spec. & Rad. Trans. 2005, 92, 373−381. [8] Mischenko, M. I.; Travis, L. D.; Mackowski, D. W. J. Quant. Spec. & Rad. Trans.
1996, 55, 535−575. [9] Nilsson, A. M. K.; Alsholm, P.; Karlsson, A.; Anderson-Engels, S. App. Opt. 1998,
37, 2735−2748. [10] Draine, B. T.; Flatau, P. J. Opt. Soc. Am A 1994, 11, 1491−1499. [11] Jackson, J. Classical Electrodynamics; Wiley: New York, 1999. [12] Bottcher, C. J. F. Theory of Electric Polarisation; Elsevier: Amsterdam, 1973. [13] Yang, W.; Schatz, G. C.; Van Duyne, R. P. J. Chem. Phys. 1995, 103, 869−875. [14] Draine, B. T.; Flatau, P. Arxiv 2008, 0809.0337v5. [15] Webb, J. P. Rep. Prog. Phys. 1995, 58, 1673−1712. [16] Nedelec, J. C. Num. Mat. 1980, 35, 315−341. [17] Donderici, B.; Teixeira, F. L. IEEE Trans. Microwave Theory Tech. 2008, 56,
113−120. [18] Yee, K. S. IEEE Tran. Antennas Propag. 1966, AP-14, 302−307. [19] Yang, P.; Kattawar, G. W.; Liou, K.; Lu, J. Q. App. Opt. 2004, 43, 4611−4624. [20] Taflove A.; Hagness, S. Computation Electrodynamics: The Finite Difference Time
Domain Method; Artech House: Boston, 2005. [21] Vial, A.; Grimault, A-S.; Marcias, D.; Barchiesi, D.; de la Chapelle, M. L. Phys. Rev.
B 2005, 71, 085416. [22] Johnson, P. B.; Christy, R. W. Phys. Rev. B 1972, 6, 4370−4379. [23] Myroshnychenko, V.; Rodrıguez-Fernandez, J.; Pastoriza-Santos, I.; Funston, A. M.;
Novo, C.; Mulvaney, P.; Liz-Marzan, L. M.; Garcıa de Abajo, F. J. Chem. Soc. Rev. 2008, 37, 1792−1805.
[24] Barnes, W. L. J. of Opt. A 2009, 11, 114002. [25] Curry, A.; Nusz, G.; Chilkoti, A.; Wax, A. Opt. Express 2005, 13, 2668−2677. [26] Bobbert, P. A.; Vlieger, J. Physica A 1986, 137, 209−242. [27] Nebeker, B. M.; de la Pena, D. L.; Hirleman, E. D. J. Quant. Spec. & Rad. Trans.
2001, 7, 749−159. [28] Kreibig, U.; Vollmer, M. Optical properties of metal clusters; Springer: Berlin, 1995. [29] Chaumet, P. C.; Rahmani, A. J. Quant. Spec. & Rad. Trans. 2009, 1-2, 22−29.[30] Grosges, T.; Vial, A. Barchiesi, D. Opt. Express 2005, 13, 8483−8497.
19
Method Computation Time for
Au sphere with radius << λ
Advantages Disadvantages
Mie Theory Rapid – a few milliseconds per individual frequency
• Rapid computation time. • Can also be used to
compute the optical response of coated spheres.
• Applicable only to spherically symmetric particles.
• Not possible to include a substrate interaction, therefore difficult to replicate many experiments.
T-Matrix Rapid – a few milliseconds - per individual frequency.
• Rapid computation time. • Wide range of geometries
supported. • Also possible to include a
substrate interaction
• Computations are numerically unstable for elongated or flattened objects. (the matrices are truncated during computation– rounding errors become significant and accumulate rapidly)
DDA Moderate – depends on number of dipoles, and separation. Typically 50s per individual frequency.
• Can be used to evaluate any arbitrary shaped particle by specifying a tabulated list of dipole locations
• Convergence criterion: n kd < 1 n = complex refractive index k = wavevector d = inter-dipole separation (Not possible to solve for high aspect ratio / elongated particles or those having a large refractive index)
FEM Lengthy – typically 150s per individual frequency when using an element length of 3nm. A compromise is made between the computation time and element length.
• Can be used to evaluate the scattered field-distribution of any arbitrary shaped particle.
• The use of a non-regular tetrahedral adaptive mesh for the FEM simulation allows for a more accurate approximation of curved surfaces.
• Computation time is lengthy.
FDTD Lengthy – a broadband response is computed across a wide frequency range, typically taking ≈ 3 hours to cover visible frequencies. A compromise is made between the computation time and element length.
• Can be used to evaluate scattering parameters from any arbitrary shaped particle.
• Computation time is lengthy. • Permittivity values have to
be specified over much wider frequency range than just the range of interest. The Drude-Lorentz model may not be an accurate representation of experimental data.
Table 1: Comparison of computation time, advantages and disadvantages computational
techniques (Mie Theory, the T-Matrix method, the DDA, FEM modelling and the FDTD
method) used to simulate the scattering of electromagnetic radiation from metallic
20
nanostructures. Computations were performed on a Dell Vostro 200 personal computer,
having a dual-core processor (each with a clock speed of 2.19 GHz) and 2 Gb of RAM.
21
List of Figures:
Figure 1: The real and imaginary components of the permittivity values of Au for
wavelengths in the range 450 – 750 nm. Curves (a,b) show the real and imaginary
components of the experimental permittivity values published by Johnson and Christy [22]
(used for the Mie Theory, T-Matrix, DDA and FEM simulations) and (c,d) show those
obtained using a Drude-Lorentz model with fitted parameters ε∞ = 5.9673, ωd = 1.32 × 10¹⁶


![Here we report experimental studies of the orientational ...newton.ex.ac.uk/research/emag/pubs/pdf/Sirotkin_ieee_2010.pdf[6]. In such applications the control of the “vortex” chirality](https://static.documents.pub/doc/80x56/6130e5791ecc5158694463ca/here-we-report-experimental-studies-of-the-orientational-6-in-such-applications.jpg)


