TRANSPORTATION RESEARCH RECORD 1144 87 A Comparison of Telephone and Door-to- Door Survey Results for Transit Market Research ROBERT A. HITLIN, FRANK SPIELBERG, EDWARD BARBER, AND STEPHEN J. ANDRLE Any sample survey design Involves a trade-off between funds available, sample size desired, and degree of precision re- quired. Early in 1986, the Northern Virginia Transportation Commission sponsored a research project in Northern Virginia conducted by Robert Hitlln Research Associates, Inc., and SG Associates, Inc., to estimate demand for two proposed transit services. The two companies developed an estimation tech- nique based on door-to-door sample surveys and small-scale telephone surveys. In this paper, the costs, findings, and advan- tages and disadvantages of the two types of data collection are compared. The telephone survey was approximately three and one-half times as expensive per interview as the door-to-door survey, but the results of the two surveys were virtually Identi- cal In each location. There were major differences In ease of administration, speed, required personnel, and other factors that may determine which approach to use In the future. A self-administered, door-to-door survey with a large enough sample size to allow analysis at the subarea level and therefore In narrow confidence intervals, which costs considerably less than a telephone survey, is a cost-effective and viable option. Early in 1986, the Northern Virginia Transportation Commis- sion sponsored a market research project to estimate potential patronage on transit feeder services for several soon-to-be- opened stations on the Washington, D.C., area Metrorail sys- tem. One of the proposed services is a neighborhood feeder minibus system to two Metrorail stations. This service would operate in the city of Falls Church, which is an established, close-in, Washington, D.C., suburban area. The other new service is a Metrobus route connecting Metrorail and Cen- treville, a newer and rapidly growing suburban community further out from Washington, D.C. A major constraint in designing this transit market research project was the trade-off between available funds and the need for large sample sizes. These large sample sizes were desirable because patronage estimates were needed for subareas within each jurisdiction. The available funds were not adequate to consider an in-depth door-to-door survey. The project budget would have allowed the use of telephone surveys in the two areas. However, the sample sizes possible for the funds would have been too small to provide reliable estimates with accept- able confidence intervals, especially when the data were divided into subareas or subgroups within Falls Church or Centreville. R. A. Hillin, Robert Hillin Research Associates, Inc., 1682 Westwind Way, McLean, Va. 22102. F. Spielberg and S. J. Andrle, SG Associ- ates, Inc., 4200 Daniels Ave., Annandale, Va. 22003. E. Barber, North- ern Vrrginia Transportation Commission, 2009 N. 14th St, Arlington, Va. 22201. The approach taken by Robert Hitlin Research Associates, Inc., and SO Associates, Inc., was to conduct a self-admin- istered, door-to-door survey of every household in the tatget areas, followed by a small (200-household) telephone survey of nonrespondents to check for possible response bias in the first survey. This approach presented a number of challenges and problems but resulted in large enough sample sizes to produce ridership estimates that proved highly accurate in Centreville and have been accepted as reasonable by Falls Church. A companion paper in this Record has described in detail the _,,.,,-- statistical screening and estimation process used to estimate potential demand in these two locations. In this paper, the results, costs, and advantages and disadvantages of these two data gathering techniques in transit market research are com- pared, and some of the criteria that can be used to decide whether this approach will work in other locations are outlined. Other studies designed to test alternative data collection techniques are found in the literature (1-4). METHODOLOGY A self-administered, door-to-door household survey was con- ducted to collect data from as many potential riders as possible. Questionnaires were placed on doorknobs in clear plastic hanger bags with the instruction that all workers in the house- hold fill them out and replace them on the doorknob for collec- tion 2 days later. The goal was to obtain a larger sample size for less money than could have been achieved with a telephone survey. Falls Church has approximately 4,500 households, Centreville has approximately 4,000 households. However, there was a potential for self-selection bias in the survey responses. Such bias would have meant that people who favored the new transit services would be more likely to return the surveys. Therefore, to serve as a check on nonresponding households, small-scale telephone surveys were conducted. The households that did not return the door-to-door survey constituted the universe for the telephone survey. The pro- cedure permitted comparison of results from the two surveys to bear on the question of whether the two independent, non- overlapping samples drawn from the different universe would differ. In other words, did the transit needs of the self-selected respondents to the door-to-door survey differ from those of the nonrespondents? Some general works on survey techniques are found in the literature (5-11).
Transcript
TRANSPORTATION RESEARCH RECORD 1144 87
A Comparison of Telephone and Door-toDoor Survey Results for Transit Market Research
ROBERT A. HITLIN, FRANK SPIELBERG, EDWARD BARBER, AND STEPHEN J. ANDRLE
Any sample survey design Involves a trade-off between funds available, sample size desired, and degree of precision required. Early in 1986, the Northern Virginia Transportation Commission sponsored a research project in Northern Virginia conducted by Robert Hitlln Research Associates, Inc., and SG Associates, Inc., to estimate demand for two proposed transit services. The two companies developed an estimation technique based on door-to-door sample surveys and small-scale telephone surveys. In this paper, the costs, findings, and advantages and disadvantages of the two types of data collection are compared. The telephone survey was approximately three and one-half times as expensive per interview as the door-to-door survey, but the results of the two surveys were virtually Identical In each location. There were major differences In ease of administration, speed, required personnel, and other factors that may determine which approach to use In the future. A self-administered, door-to-door survey with a large enough sample size to allow analysis at the subarea level and therefore In narrow confidence intervals, which costs considerably less than a telephone survey, is a cost-effective and viable option.
Early in 1986, the Northern Virginia Transportation Commission sponsored a market research project to estimate potential patronage on transit feeder services for several soon-to-beopened stations on the Washington, D.C., area Metrorail system. One of the proposed services is a neighborhood feeder minibus system to two Metrorail stations. This service would operate in the city of Falls Church, which is an established, close-in, Washington, D.C., suburban area. The other new service is a Metrobus route connecting Metrorail and Centreville, a newer and rapidly growing suburban community further out from Washington, D.C.
A major constraint in designing this transit market research project was the trade-off between available funds and the need for large sample sizes. These large sample sizes were desirable because patronage estimates were needed for subareas within each jurisdiction. The available funds were not adequate to consider an in-depth door-to-door survey. The project budget would have allowed the use of telephone surveys in the two areas. However, the sample sizes possible for the funds would have been too small to provide reliable estimates with acceptable confidence intervals, especially when the data were divided into subareas or subgroups within Falls Church or Centreville.
R. A. Hillin, Robert Hillin Research Associates, Inc., 1682 Westwind Way, McLean, Va. 22102. F. Spielberg and S. J. Andrle, SG Associates, Inc., 4200 Daniels Ave., Annandale, Va. 22003. E. Barber, Northern Vrrginia Transportation Commission, 2009 N. 14th St, Arlington, Va. 22201.
The approach taken by Robert Hitlin Research Associates, Inc., and SO Associates, Inc., was to conduct a self-administered, door-to-door survey of every household in the tatget areas, followed by a small (200-household) telephone survey of nonrespondents to check for possible response bias in the first survey. This approach presented a number of challenges and problems but resulted in large enough sample sizes to produce ridership estimates that proved highly accurate in Centreville and have been accepted as reasonable by Falls Church.
A companion paper in this Record has described in detail the _,,.,,-statistical screening and estimation process used to estimate potential demand in these two locations. In this paper, the results, costs, and advantages and disadvantages of these two data gathering techniques in transit market research are com-pared, and some of the criteria that can be used to decide whether this approach will work in other locations are outlined.
Other studies designed to test alternative data collection techniques are found in the literature (1-4).
METHODOLOGY
A self-administered, door-to-door household survey was conducted to collect data from as many potential riders as possible. Questionnaires were placed on doorknobs in clear plastic hanger bags with the instruction that all workers in the household fill them out and replace them on the doorknob for collection 2 days later. The goal was to obtain a larger sample size for less money than could have been achieved with a telephone survey. Falls Church has approximately 4,500 households, Centreville has approximately 4,000 households.
However, there was a potential for self-selection bias in the survey responses. Such bias would have meant that people who favored the new transit services would be more likely to return the surveys. Therefore, to serve as a check on nonresponding households, small-scale telephone surveys were conducted. The households that did not return the door-to-door survey constituted the universe for the telephone survey. The procedure permitted comparison of results from the two surveys to bear on the question of whether the two independent, nonoverlapping samples drawn from the different universe would differ. In other words, did the transit needs of the self-selected respondents to the door-to-door survey differ from those of the nonrespondents?
Some general works on survey techniques are found in the literature (5-11).
88
RESULTS
Tne return rates for self-administered househoid surveys were 22.8 percent in Falls Church, 24.4 percent in Centreville. The questionnaire allowed for responses on one form from all workers employed outside the home; 1,162 workers in Falls Church and 1,733 workers in Centreville responded. These sample sizes were large enough that detailed statistical analysis could be performed. The smaller number of responses from a comparably priced telephone survey would have limited the ability to analyze subsets within the sample with an acceptable level of statistical confidence.
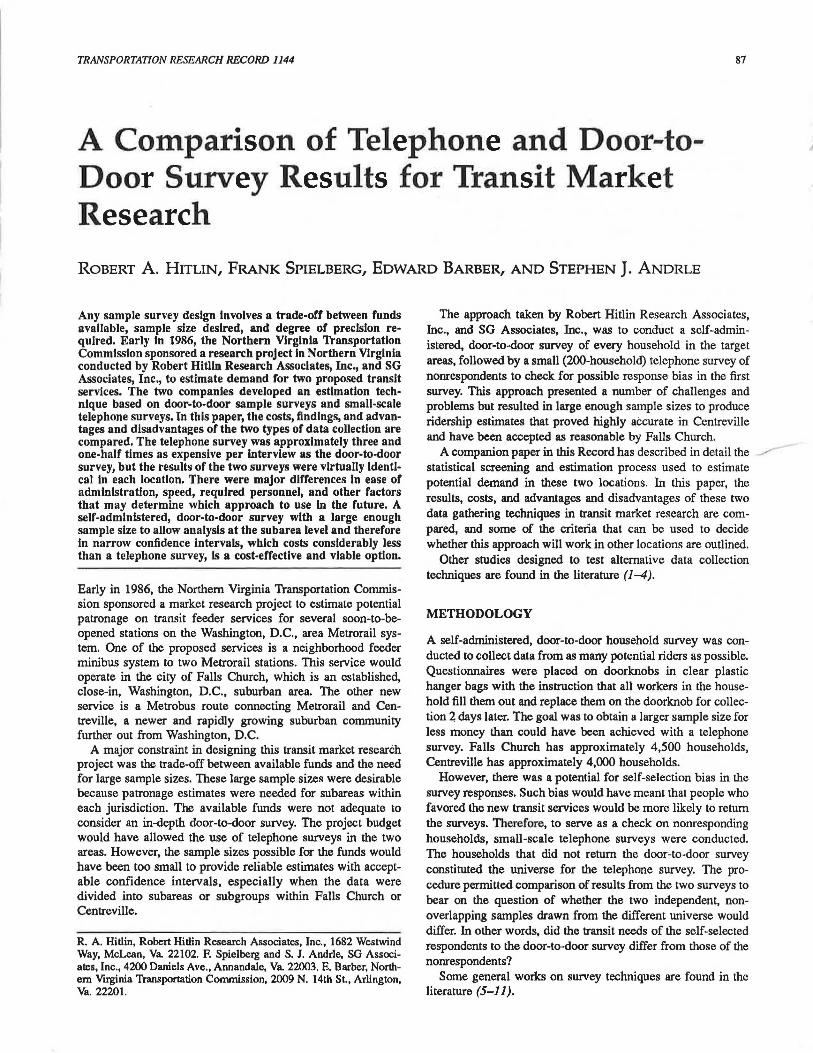
The greatest danger in this type of self-selected survey is the potential for response bias in the sample of respondent households. If the survey showed strong demand for the new services, would that finding be reliable? The findings of the telephone survey, however, completely confirmed the findings of the door-to-door self-selected samples. Figures 1 and 2 compare the response data for the two research sites and the two techniques. Self-selection bias did not materialize. For every question, the results for the two modes of data collection were almost identical.
+--------------- ----- -~ -+-----~--------------- -+ I I HOUSEHOLD I TELEPHONE I
+- ----------------- -- --- -+-----------+-----------+ I PEOPLE IN HOUSEHOLD ..... I 2.7 I 2.8 I
+------------------------+-----------+-----------+ !ADULTS IN HOUSEHOLD .... . I 2.1 I 2.1 I
DISTANCE OF SUBWAY?... . 48\ 48\ +---------- --------------+-----------+------- -- --+ IE~~~R~~~~~~.:~~:: .... I 50\ I 48\ I +------------------------+-----------+----- -- -- --+ !WILL YOU USE NEW I I I I METRORAIL TO COMMUTE? .. I 51\ 53\ I +-- --- - - ------- -~----- --+- -------- -- +-- ------ ---+ INEED CAR AT WORK? ...... . 1 21\ I 29\ I +-- ---------------- ------+-----------+--------- --+
MINUTE FREQUENCY?... .. . 40\ 46\ +- -----------------------+-----------+- ----------+ I USE MINIBUS IF FREE? .... I 62\ I 64\ I
+------------------------+-----------+-----------+ l u~~~~~:~~~.:~.~~.~~~: .. I 61\ I 62\ I +------------------------+-----------+-----------+ l u~~~~~~~~.:~.~~.~~r:: .. I 35\ I 43\ I
+------------------------+-----------+-----------+ FIGURE 1 Comparison of in-home and telephone surveys, Fall Church, Va.
TRANSPORTATION RESEARCH RECORD 1144
+------------- ----------+------- ~ -------------+ I I HOUSEHOLD I TELEPHONE I
+-------- --------------+----------+---------+ !PEOPLE IN HOUSEHOLD .. ... I 3.0 I 3.2 ! +-------------- - -- -------+------ -----+----------+ I ADU LTS IN HOUSEHOLD ... .. I 2 .1 I 2. l I +--- -------------- ---~--+----------- +-----------+
!~~~~~~~.~~:~:~~.:~~·· · . I 2.0 I 1.9 I +- ----------------------+- ----------+-----------+
!VEHICLES AVAILABLE FOR I I I
COMMUTING...... .. ..... . 2. l 2. l +------------------------+---------+---------- -+
!REPORT TO WORKPLACE MOSTI I I OF THE TIME?........... 97\ 96\
+----------------------+-------- ---+-----------+ ISEX (MALE) .............. 1 55\ I 49\ I +-----------------------+----------+--- --------+
IWORK WITHIN WALKING I I I DISTANCE OF SUBWAY?.. .. 25\ 21\
+-----------------------+- ----------+-----------+ IE~~~R~~~~~~.:~~:: .... I 27\ I 25\ I +------------------------+- ---------+-----------+
I WILL YOU USE NEW I I ·1 METRORAIL TO COMMUTE? . . 34\ 30\
+- -----------------------+----- --- - -+-----------+ INEED CAR AT WORK? ..... .. I 32\ I 46\ I +l~-;;;;-~;;;-;;;-~1~5---- 1--------~+l----- ----- -+I
l w~i~vig~?~~~.:~~.~~~ .~~~I 32\ I 29\ I +------------------------+-----------+ ---~-----+
!w~~?~.~~:~~.~~~~:~~- I 8\ l 2\ I +-----------------------+-----------+----------+
l w~~?~.~~:~~.~~~~:~~ .... I 15\ I 6\ I +------------------------+-----------+----------+ lw~?~.~~~~~.~~~~:~~. I 16\ I 6\ I +------------------------+-----------+-----------+
IWAN'i' A LATER EVENING I I I BUS?,,. ................ 12\ 4\
+------------------------+-----------+-----------+ FIGURE 2 Comparison of In-home and telephone surveys, Centreville, Va.
COST
The following discussion is from the perspective 0f the contractor, not the sponsoring agency. It assumes that the telephone survey is subcontracted to a commercial telephone interviewing company, and that the door-to-door survey is organized and supervised by in-house personnel of the prime contractor.
Because the data obtained using the two techniques were so similar, the cost of data collection becomes an important factor in distinguishing the techniques. Telephone survey costs vary significantly according to length of questionnaire, ratio of long distance to local tolls, amount of screening required to qualify respondents, type of sampling done within households, ratio of random digit dialing to other sampling methods, and specific interviewing company.
Temporary labor rates for door-to-door surveys, housing density, and the existence of high-rise apartments also vary from area to area. The speed with which the temporary workers cover an area and efficiency of the plan for distribution and collection of survey materials also influence costs.
Obviously, data on comparative costs from previous projects can only be used to indicate general guidelines, not firm estimates, for other projects. As a rule of thumb, however, each
Hillin et al.
telephone interview cost three and one-half times as much as each door-to-door response; that is, costs on the Northern Virginia projects were approximately $7 per respondent for the household survey and $25 per respondent for the telephone survey.
These figures included all project costs: questionnaire development, sampling, editing, data entry, extensive computer analysis, and written reports. Costs of door-to-door surveys included labor costs for distribution and collection of the surveys, art work, layout, and typesetting charges, supervisory costs, and mileage charges. The interviewing for the telephone interviews entailed a fixed price per respondent.
In comparison, the FHWA Office of Planning estimates total project costs for door-to-door, random (in-person) interviews at $100 per respondent and $50 per respondent when the housing units are highly clustered. Telephone interview total project costs are estimated to run as high as $50 per respondent. When the comparative cost and the similarity of the results are considered, the household door-to-door approach becomes a very attractive data collection option.
OTHER FACTORS
Cost is not the only consideration when designing a research project. The survey approaches have other significant factors associated with them.
Advantages of Telephone Surveys
Discussion of telephone survey techniques is found in the literature (12-14).
1. Ease of administration. Once bids have been solicited from several commercial telephone interviewing companies and the contractor has been selected, the researcher need only wait for the completed surveys to be delivered It is advisable for the researcher to take an active role in the interviewing process by conducting part of the training for the interviewers, by monitoring some of the calls, and by keeping in daily contact to assess progress and any problems with the sampling techniques or with the questionnaire. These tasks are comparatively simple however. They should remain simple because the contractor is being paid to do most of the work.
2. Schedule easier to control. Telephone survey companies should be able to estimate how long it will take, depending on their workload, to complete the job. If a company is overloaded and can't meet the schedule, a different company should be used If firm deadlines are insisted upon, they can be met.
3. Less planning. The facilities, recruitment of personnel, training, paperwork, supervision, and so forth, of a door-todoor survey need not be planned. Door-to-door surveys are cost-effective for a prime contractor only if in-house personnel take on these tasks.
4. Fewer personnel. Subcontracting a telephone survey requires dealing with few people, whereas organizing a door-todoor survey requires dealing with many people, which takes time, patience, and understanding.
89
Disadvantages of Telephone Surveys
1. Cost. The telephone survey costs approximately four times per respondent what the door-to-door survey costs, and possibly more.
2. Sample size limitations. Increased cost results in smaller sample sizes and larger confidence intervals for given probabilities. This can be especially critical in the case of transit research because it focuses on a statistical rare event (i.e., transit usage). Any attempt at further analysis (for example, geographical breakdowns) will be especially hindered by sample size problems.
3. Number of respondents per household. The telephone approach actually allows the collection of data for only one respondent per household, because asking a respondent to provide data for others in the household may result in inaccurate information.
Advantages of Door-to-Door Self-Administered Survey
Discussion of in-home interview surveys is found in the literature (15-17).
1. Number of respondents per household. Door-to-door questionnaires can be designed to allow several people to respond on the same form. If the goal is to collect information about the commuting habits of all workers in a household, for example, this can be a real advantage.
2. Cost. Many variables can affect comparative pricing, but the experience in two suburban areas was that door-to-door surveys were approximately one-fourth the cost of telephone surveys per respondent.
3. Sample size. The lower unit cost and ability of several people per household to respond lead to increased sample size, which reduces confidence intervals. The larger sample may also be divided into subgroups for further analysis.
4. Use of maps and graphics. Questionnaires can include maps, potential routes, proposed schedules, and other forms of presentation that cannot be used over the phone. These advantages may contribute to more reliable responses.
5. More considered responses. Because people can answer the questionnaire whenever they have time (not just when the telephone rings), the responses may be more thoughtful and reliable.
6. Advertising value. During the introduction of a new or potential service, the door-to-door survey technique has great value in the advertising of the service. For example, a community can be informed of a new bus route in a direct and inexpensive way while research is conducted at the same time. Information collected in the survey can be used to adjust the bus service to improve its effectiveness.
7. Political value. In some situations, government officials may react favorably to the idea of direct community involvement in a research project. The cover letter signed by some local officials, media coverage stimulated by the research project, and informational telephone calls in response to the survey can all be of political value to officials involved.
90
Disadvantages of Door-to-Door Household Surveys
1. Potential self-selection bias. In the two projects described, self-selection bias was not a problem. In other circumstances, however, this possibility must still be included in design considerations. Circumstances in a particular community or subarea may lead people who have a great deal to gain from the new services to return the surveys at a greater rate than people who have less to gain.
2. Difficulty in organization and administration. Door-todoor surveying is a labor-intensive approach to data collection that requires 15 to 40 people, depending on geography and sample size. Recruiting so many people (through colleges, high schools, temporary agencies, the Boy Scouts, etc.) is a major effort Many people who say that they will work do not come or are late. In general, designing routes, recruiting people, supervising efforts, and handling paper are big tasks.
3. Weather. This type of data collection should not be done during the winter or hottest part of the summer. Weather problems can disrupt the schedule; heat or ice can make the work dangerous.
The following list summarizes these advantages and disadvantages:
Advantages
Telephone
Easier to administer Schedule easier to control Less planning Fewer personnel
Household self-administered
Multiple respondents per household possible
Larger sample likely Low per unit cost Use of maps, graphics More considered responses Adverlising value Political value
Disadvantages
More expensive Smaller samples because of
cost Only 1 respondent per
household
Potential self-selection bias Difficult to organize and
administer Weather problems
The best approach for a given project depends on a combination of several factors. If money is no object, a telephone survey can certainly be conducted more easily. In most cases, when money is a trade-off with sample size, the door-to-door approach is a viable alternative that yields reliable results.
FINAL ESTIMATES BASED ON SCREENING PROCESS
Final estimates were based on a computerized screening process described in detail in a companion paper in this Record. The screening process removed any respondent from the final estimate who failed any one of a number of screens designed to identify people who, although they indicated that they would use a new transit service, would really be unable to do so. Some of the reasons for screening out potential riders included (a) having a work start time that was not included in the hours of service, (b) needing a car to drop children at schoo! or day care,
TRANSPOKIAT/ON RESEARCH RECORD 1144
(c) working in an area not served by Metrorail, and (d) needing an automobile at work.
When the data from the two types of survey were run through the screening process, the resulting estimates differed only slightly between the two techniques in each location. However, the patterns of those screened out in the two locations were noi totally consistent. Tabie 1 presents the impact of the screening process on the data collected using the two different types of survey.
Several conclusions can be drawn from the comparison of the impact of the screening process on data from these lwo types of survey.
1. The percentages of people responding to the two types of survey in each location who indicated an initial interest in using the new services were within the overlapping confidence intervals (not shown in Table 1) of the two surveys at the 95 percent confidence level. However, the rates at which people were screened out show no clear pattern between the two locations and the two types of surveys.
One initial expectation was that self-selected respondents to the door-to-door survey would respond out of clearly understood self-interest in the new transit service. Therefore they would be unlikely to be screened out by such factors as use of automobiles to drop off children at day care, needing an automobile at work, and so forth. On the other hand, the telephone respondents who indicated an interest in the new service (who had not taken the trouble to respond to the first survey) were expected to be less certain in their indicated needs. Therefore it was assumed that they would be more likely to be screened out as potential transit users through the factors identified as disqualifying characteristics. As Table 1 shows, this expected difference occurred in Falls Church but not in Centreville.
More research and experience are needed to understand the comparative reliability of the two types of survey. It may be possible eventually to demonstrate that this kind of screening process can be applied to only one type of survey without conducting the other type as confirmation. Whether a tendency of some people to give socially acceptable responses (and then be screened out because they really cannot use the new service) differs from one transit survey to another is a question is a question not answered by these data.
2. In both locations, relying on the screened data from the telephone survey would yield a slightly lower estimate of patronage than the door-to-door survey results. Transit research often cannot be validated by observation of actual usage, but in this case such validation is possible because service on the new Centreville bus route has begun. Initial data from the early weeks of the Centreville bus route indicate that estimates based on postscreen respondents to the door-to-door survey would be more accurate than telephone survey estimates.
3. At the outset of the project, it was expected that respondents to the door-to-door survey (who were self-selected would be much more likely to want to use transit than people in the telephone survey would. The expectation was that self-interest would prevail in most decisions on whether or not to return the form. However, with the results in both locations having been so similar, it appears that propensity to return the form was unrelated to desire for new transit service. ·
Hit/in et al. 91
TABLE 1 THE EFFECT OF THE SCREENING PROCESS ON DOOR-TO-DOOR AND TELEPHONE SURVEY DATA
FALLS Household
Percentage of Workers Expressing Interest in Public Transit 55.3\ Percent Screened Out -33.1\
Percentage of Workers Passing All Screens 22.2\
Confidence Interval of Screened Estimate +/-2.4\
It appears that there were simply two kinds of people in these two Northern Virginia areas: those who fill out questionnaires and those who do not. There were few if any differences between the travel characteristics of the respondents and those of the nonrespondents to the door-to-door surveys. This sameness suggests that the door-to-door survey technique is a costeffective and reliable approach to gathering information from larger nwnbers of residents in a small area. It allows data to be collected at a comparatively low cost per interview and results in estimates based on large enough sample sizes that the confidence intervals around the estimates are relatively small.
CONCLUSION
Without further testing of the methodology, it cannot be concluded that these two techniques will always yield similar results. However, in both of the test locations the results are strikingly close. These techniques will continue to be tested and refined in the future; eventually, the similarities (and differences) between the results of these two types of data collection may become fully documented.
Each type has some major advantages and disadvantages. The appropriateness of each approach must be decided on a case-by-case basis. However, the self-administered door-todoor approach will work as well as a telephone survey in most cases and will cost less while yielding a much larger sample size. Although the door-to-door survey requires more work to design and implement than does a telephone survey, it has a nwnber of advantages that make it a viable alternative to consider for transit market research.
REFERENCES
1. I. M. Sheskin and P.R. Stopher. Pilot Testing of Alternative Administrative Procedures and Survey Instruments. In Transpor-
CHURCH CENTREVILLE Telephone Household Telephone
58.8\ 32.2\ 28.6\
-42.0\ -25.6\ -26. 7\
16.8\ 6.6\ 1.9\
+/-5.2\ +/-1. 2\ +/-1. 8\
talion Research Record 886, TRB, National Research Council, Washington, D.C., 1982, pp. 8-22.
2 P. R. Stopher. Small-Sample Home Interview Travel Surveys: Application and Suggested Modifications. In Transportation Research Record 886, TRB, National Research Council, Washington, D.C., 1982, pp. 41-47.
3. P. R. Stopher and I. M. Sheskin. Toward Improved Collection of 24-hr Travel Records. In Transportation Research Record 891, TRB, National Research Council, Washington, D.C., 1982, pp. 1()-17.
4. E. G. Ohstrom, J. B. Ohstrom, and P. R. Stopher. Successful Administration of a Mailed 24-hr Travel Diary: A Case Study. In Transportation Research Record 987, TRB, National Research Council, Washington, D.C., 1984, pp. 14-20.
5. E. R. Babbie. Survey Research Methods. Wadsworth, Belmont, Calif., 1973.
6. C. H. Backstrom and G. Hursh-Cesar. Survey Research (2nd ed.). John Wiley, New York, 1981.
7. D. P. Warwick and C. A. Lininger. The Sample Survey: Theory and Practice. McGraw-Hill, New York, 1975.
8. F. F. Stephan and P. J. McCarthy. Sampling Opinions. John Wiley, New York, 1958.
9. K. Webb and H. P. Hatry. Obtaining Citizen Feedback: The Application of Citizen Surveys lo Local Governments. Urban Institute, Washington, D.C., 1973.
10. G. Kalton. Introduction lo Survey Sampling. Sage Publications, Beverly Hills, Calif., 1983.
11. S. Sudman and N. M. Bradburn. Response Effects in Surveys: A Review and Synthesis. Aldine, Chicago, 1974.
12. A. B. Blankenship. Professional Telephone Surveys. McGrawHill, New York. 1977.
13. D. A. Dillman. Mail and Telephone Surveys: The Total Design Method. John Wiley, New York, 1978.
14. J. H. Frey. Survey Research by Telephone. Sage Publications, Beverly Hills, Calif., 1983.
15. F. W. Memmott, III. Home Interview Survey and Data Collection Procedures. In Highway Research Record 41, HRB, National Research Council, Washington, D.C, 1963, pp. 7-12.
16. D. A. Aaker and G. S. Day. Marketing Research. John Wiley, New York, 1983, p. 159ff.
17. C. H. Lovelock, R. Stiff, D. Kullwick, and I. M. Kaufman. Evaluation of the Effectiveness of Drop-Off Questionnaire Delivery. Journal of Market Research, Vol. 13, Nov. 1976, pp. 358- 364.
Publication of this paper sponsored by Committee on Public Transportation Marketing and Fare Policy.