43
A comparison of various governance and tax models Jørgen Klev 23 September, 2015 Presentation to INTOSAI Working Group on Audit of Extractive Industries 2nd meeting
A comparison of various governance and tax models
Jørgen Klev
23 September, 2015
Presentation to INTOSAI Working Group on Audit of Extractive Industries
2nd meeting
Who am I?
Jørgen Klev
Consultant,
M.Sc. (Tech.) in Industrial Economics from Norwegian University of Technology and Science
Academic and working
experience
• 5 years of experience with petroleum economics from Econ and Pöyry
• Master of Science, 2010, Norwegian University of Technology and Science
• Petroleum economics and taxation
• Valuation, finance, financial modelling
• Quantitative assessments
• 2011-2012: Assisting African Union High-Level Implementation Panel
Was the advisor on petroleum economics during the negotiations between the governments of
Sudan and South Sudan after the secession in 2011.
• 2013-2015: Oil advisor to the South Sudanese Ministry of Finance
Economic modeling and government assistance to the South Sudanese Ministry of Finance on
petroleum revenues related matters
• Petroleum economic course and model to Ministry of Energy, São Tomé & Principe
• Financial / tax modelling of all petroleum tax systems in North Western Europe
Academic and working
experience
Areas of expertise
An extract of recent
relevant experience
3
1. Petroleum taxation – Some theory and challenges
2. Concessionary vs Contractual system – The two main families of petroleum tax systems
3. Resource tax administration and collection
4. Appendix
Agenda
4
1. Petroleum taxation – Some theory and challenges
2. Concessionary vs Contractual system – The two main families of petroleum tax systems
3. Resource tax administration and collection
4. Appendix
Agenda
5
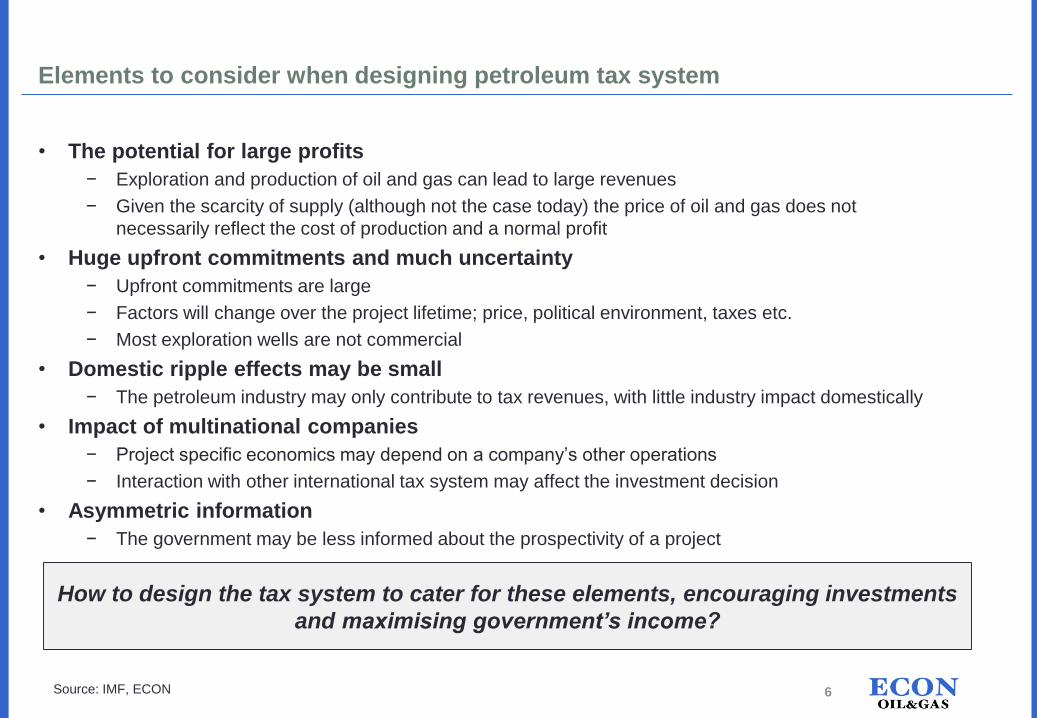
Elements to consider when designing petroleum tax system
• The potential for large profits
− Exploration and production of oil and gas can lead to large revenues
− Given the scarcity of supply (although not the case today) the price of oil and gas does not
necessarily reflect the cost of production and a normal profit
• Huge upfront commitments and much uncertainty
− Upfront commitments are large
− Factors will change over the project lifetime; price, political environment, taxes etc.
− Most exploration wells are not commercial
• Domestic ripple effects may be small
− The petroleum industry may only contribute to tax revenues, with little industry impact domestically
• Impact of multinational companies
− Project specific economics may depend on a company’s other operations
− Interaction with other international tax system may affect the investment decision
• Asymmetric information
− The government may be less informed about the prospectivity of a project
How to design the tax system to cater for these elements, encouraging investments
and maximising government’s income?
Source: IMF, ECON 6
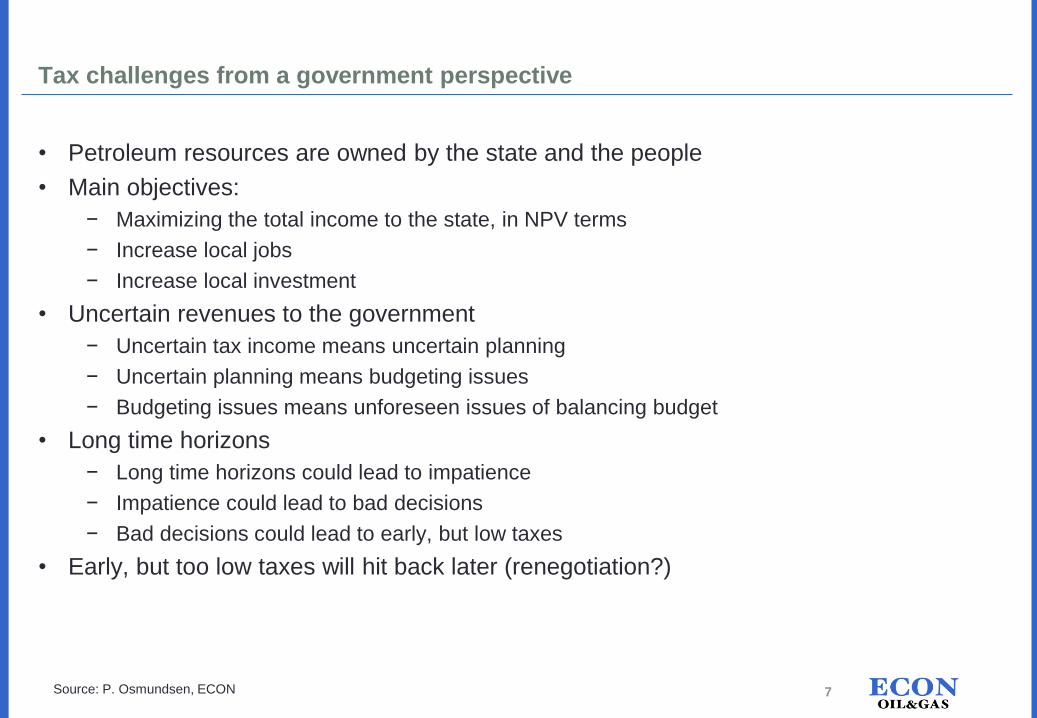
Tax challenges from a government perspective
• Petroleum resources are owned by the state and the people
• Main objectives:
− Maximizing the total income to the state, in NPV terms
− Increase local jobs
− Increase local investment
• Uncertain revenues to the government
− Uncertain tax income means uncertain planning
− Uncertain planning means budgeting issues
− Budgeting issues means unforeseen issues of balancing budget
• Long time horizons
− Long time horizons could lead to impatience
− Impatience could lead to bad decisions
− Bad decisions could lead to early, but low taxes
• Early, but too low taxes will hit back later (renegotiation?)
7Source: P. Osmundsen, ECON
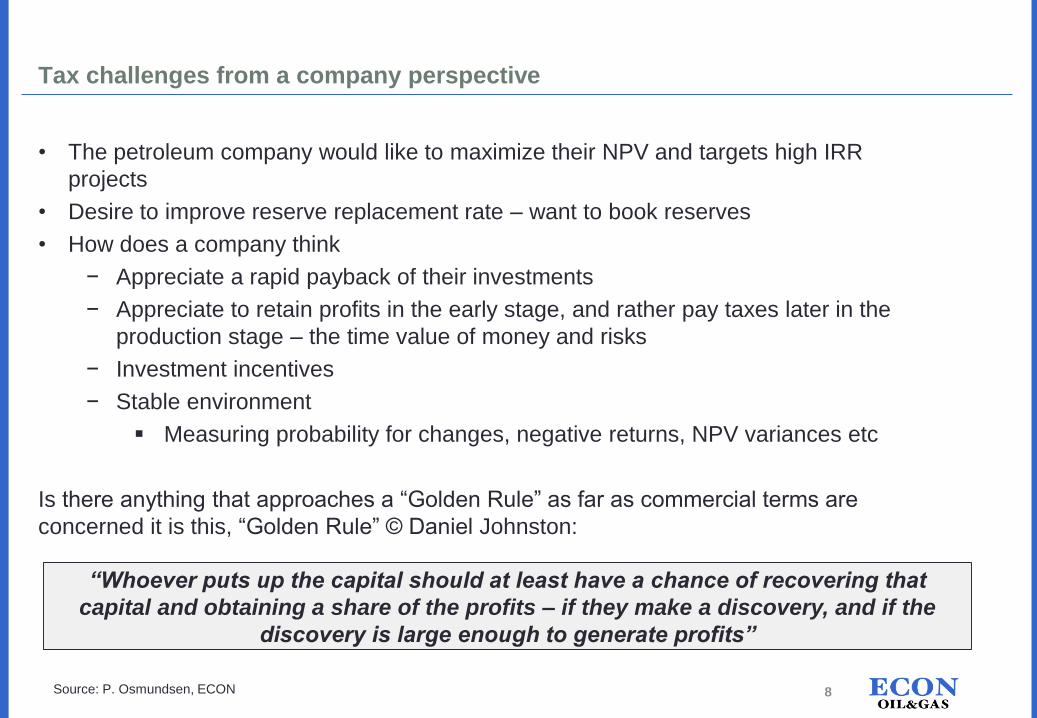
Tax challenges from a company perspective
• The petroleum company would like to maximize their NPV and targets high IRR
projects
• Desire to improve reserve replacement rate – want to book reserves
• How does a company think
− Appreciate a rapid payback of their investments
− Appreciate to retain profits in the early stage, and rather pay taxes later in the
production stage – the time value of money and risks
− Investment incentives
− Stable environment
Measuring probability for changes, negative returns, NPV variances etc
Is there anything that approaches a “Golden Rule” as far as commercial terms are
concerned it is this, “Golden Rule” © Daniel Johnston:
“Whoever puts up the capital should at least have a chance of recovering that
capital and obtaining a share of the profits – if they make a discovery, and if the
discovery is large enough to generate profits”
8Source: P. Osmundsen, ECON
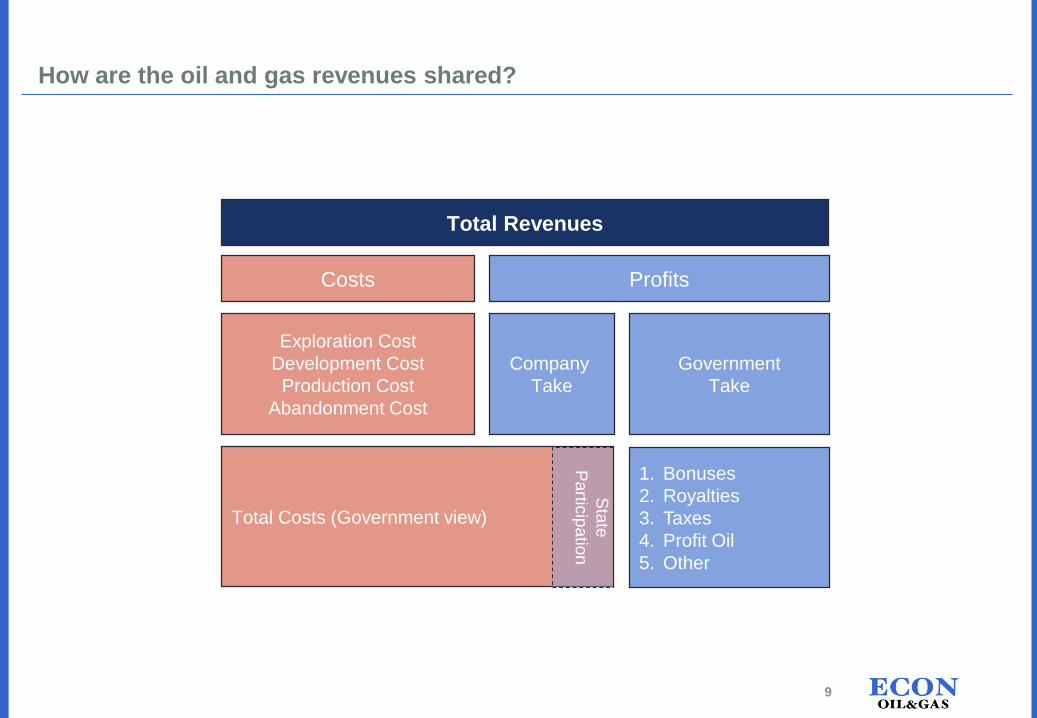
How are the oil and gas revenues shared?
Total Revenues
ProfitsCosts
Exploration Cost
Development Cost
Production Cost
Abandonment Cost
Company
Take
Government
Take
1. Bonuses
2. Royalties
3. Taxes
4. Profit Oil
5. Other
Total Costs (Government view)
Sta
te
Partic
ipatio
n
9
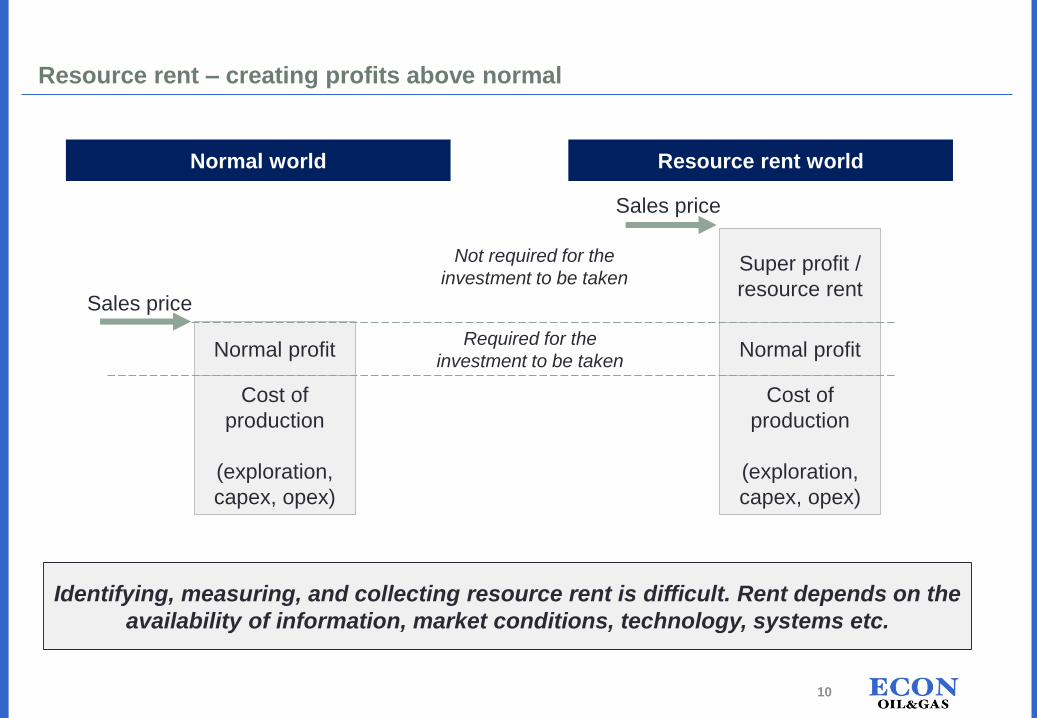
Resource rent – creating profits above normal
Cost of
production
(exploration,
capex, opex)
Cost of
production
(exploration,
capex, opex)
Normal profitNormal profit
Sales price
Sales price
Super profit /
resource rent
Resource rent worldNormal world
Required for the
investment to be taken
Not required for the
investment to be taken
Identifying, measuring, and collecting resource rent is difficult. Rent depends on the
availability of information, market conditions, technology, systems etc.
10
Government Contractor
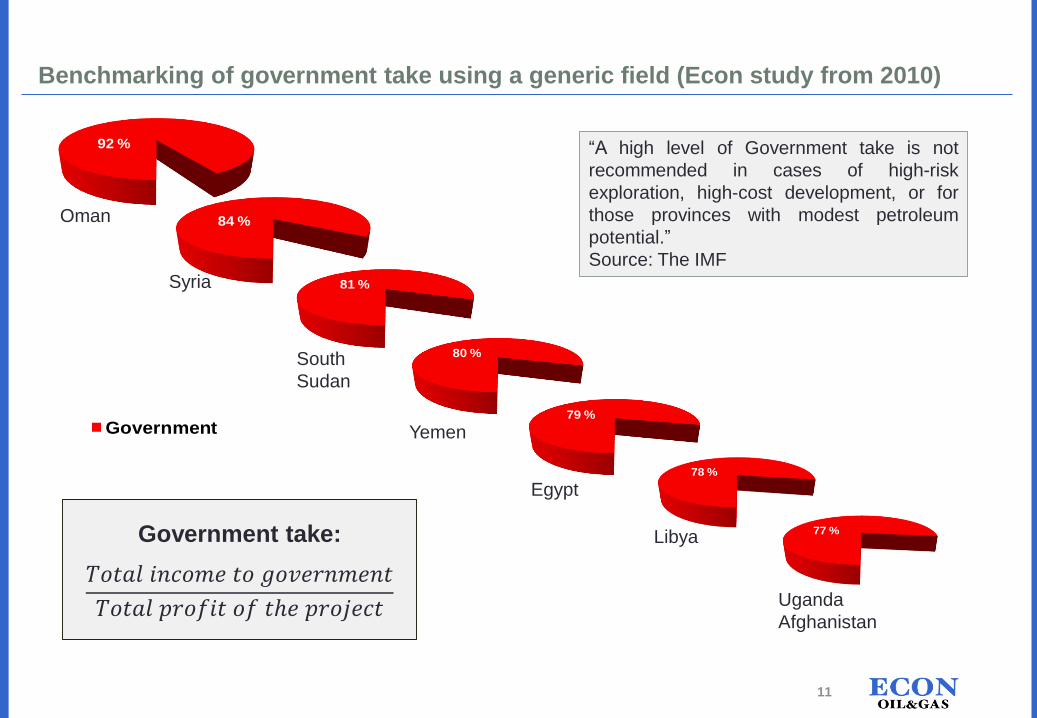
81 %
South
Sudan
78 %
Libya
92 %
Oman 84 %
Syria
77 %
Uganda
Afghanistan
79 %
Egypt
80 %
Yemen
Benchmarking of government take using a generic field (Econ study from 2010)
Government take:
𝑇𝑜𝑡𝑎𝑙 𝑖𝑛𝑐𝑜𝑚𝑒 𝑡𝑜 𝑔𝑜𝑣𝑒𝑟𝑛𝑚𝑒𝑛𝑡
𝑇𝑜𝑡𝑎𝑙 𝑝𝑟𝑜𝑓𝑖𝑡 𝑜𝑓 𝑡ℎ𝑒 𝑝𝑟𝑜𝑗𝑒𝑐𝑡
“A high level of Government take is not
recommended in cases of high-risk
exploration, high-cost development, or for
those provinces with modest petroleum
potential.”
Source: The IMF
11
Benchmarking
Benchmarking needs to take into account:
• Countries in the same phase (also back in time)
• Geological prospectivity (size and number of prospects)
• Same type of resources (oil versus gas)
• Offshore vs onshore
• Cost to invest and proximity to market
• Whether there is a withholding tax on dividends or not
• Country risk
Benchmarking is for
• information gathering
• government take comparisons
Benchmarking is NOT for finding the right fiscal mechanisms -> use the fiscal priorities (what does the country have to tackle)
12
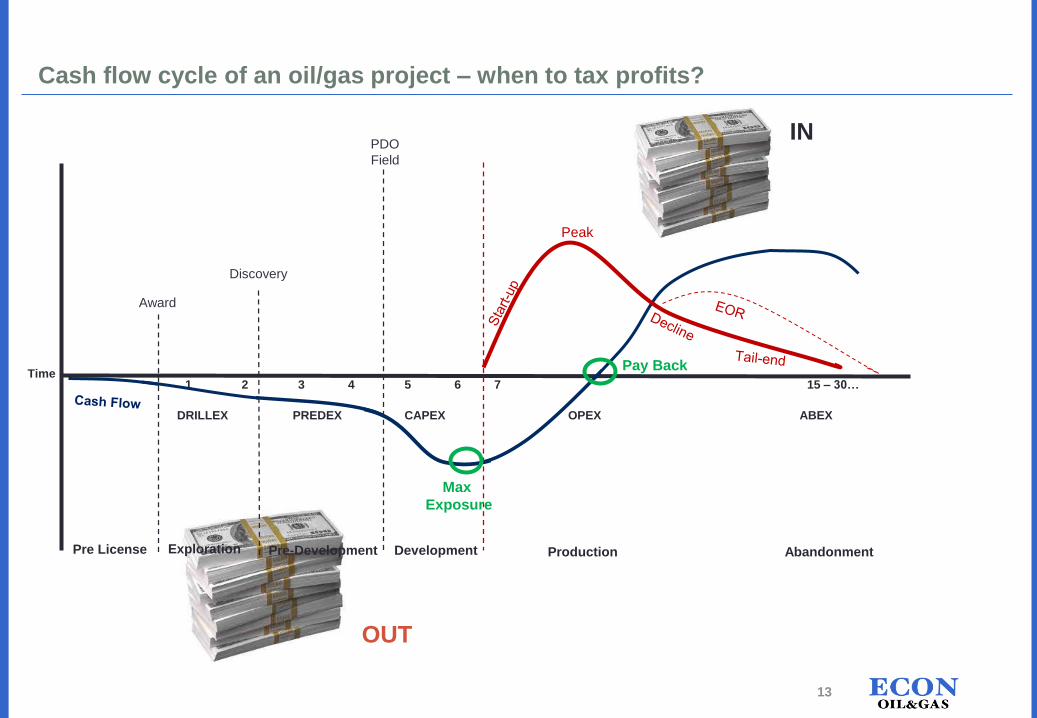
Cash flow cycle of an oil/gas project – when to tax profits?
OUT
IN
Peak
1 2 3 4 5 6 7 15 – 30…Time
Award
Discovery
PDO
Field
Pre-DevelopmentPre License Exploration Development Production Abandonment
DRILLEX PREDEX CAPEX OPEX ABEX
Pay Back
Max
Exposure
13
1. Petroleum taxation – Some theory and challenges
2. Concessionary vs Contractual system – The two main families of petroleum tax systems
3. Resource tax administration and collection
4. Appendix
Agenda
14
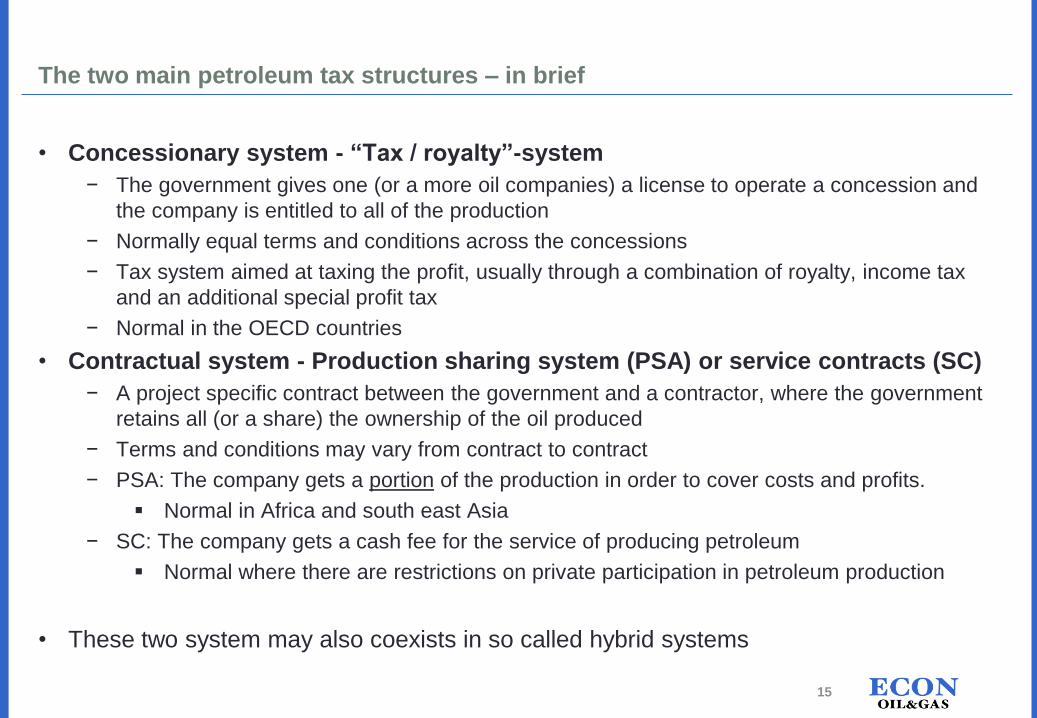
The two main petroleum tax structures – in brief
• Concessionary system - “Tax / royalty”-system
− The government gives one (or a more oil companies) a license to operate a concession and
the company is entitled to all of the production
− Normally equal terms and conditions across the concessions
− Tax system aimed at taxing the profit, usually through a combination of royalty, income tax
and an additional special profit tax
− Normal in the OECD countries
• Contractual system - Production sharing system (PSA) or service contracts (SC)
− A project specific contract between the government and a contractor, where the government
retains all (or a share) the ownership of the oil produced
− Terms and conditions may vary from contract to contract
− PSA: The company gets a portion of the production in order to cover costs and profits.
Normal in Africa and south east Asia
− SC: The company gets a cash fee for the service of producing petroleum
Normal where there are restrictions on private participation in petroleum production
• These two system may also coexists in so called hybrid systems
15
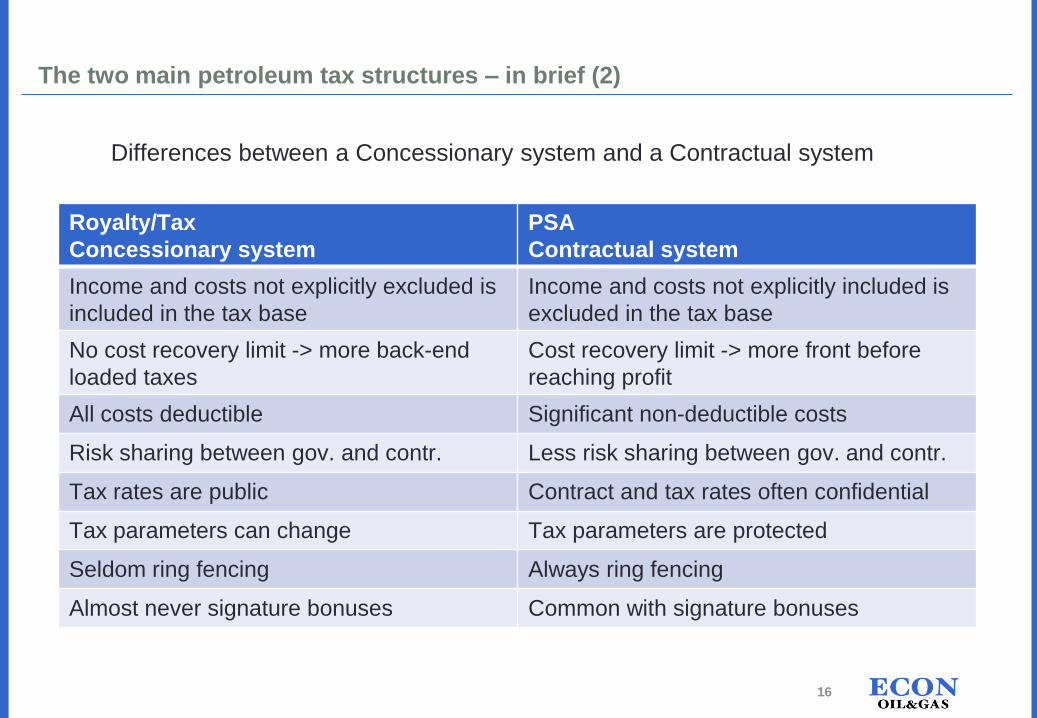
The two main petroleum tax structures – in brief (2)
Differences between a Concessionary system and a Contractual system
Royalty/Tax
Concessionary system
PSA
Contractual system
Income and costs not explicitly excluded is
included in the tax base
Income and costs not explicitly included is
excluded in the tax base
No cost recovery limit -> more back-end
loaded taxes
Cost recovery limit -> more front before
reaching profit
All costs deductible Significant non-deductible costs
Risk sharing between gov. and contr. Less risk sharing between gov. and contr.
Tax rates are public Contract and tax rates often confidential
Tax parameters can change Tax parameters are protected
Seldom ring fencing Always ring fencing
Almost never signature bonuses Common with signature bonuses
16
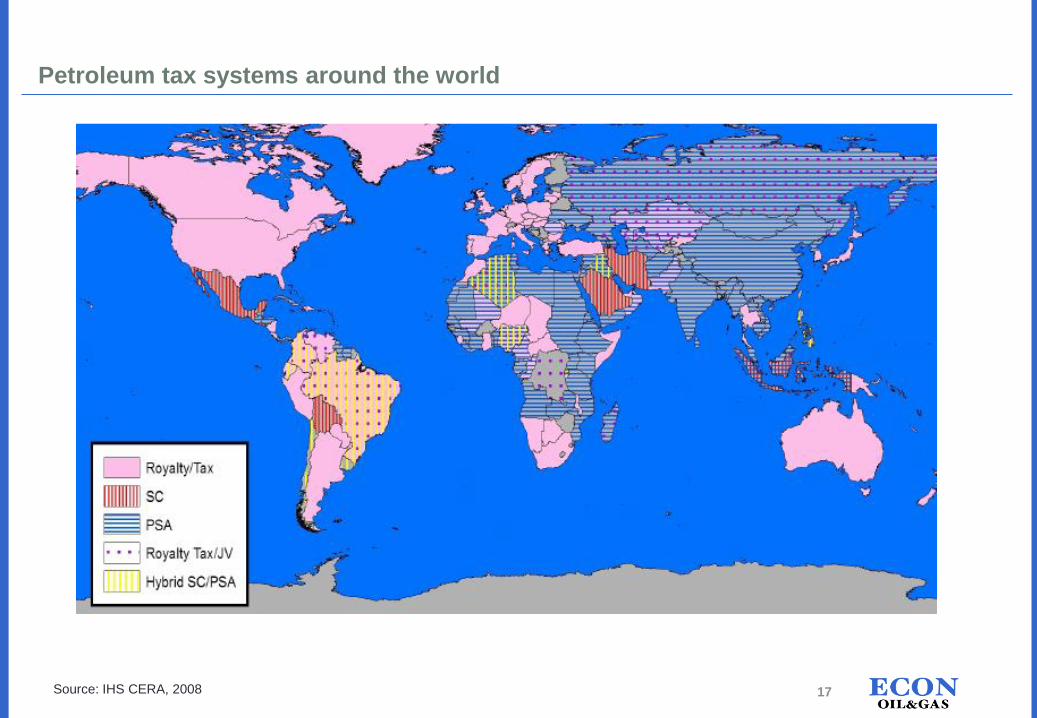
Petroleum tax systems around the world
Source: IHS CERA, 2008 17
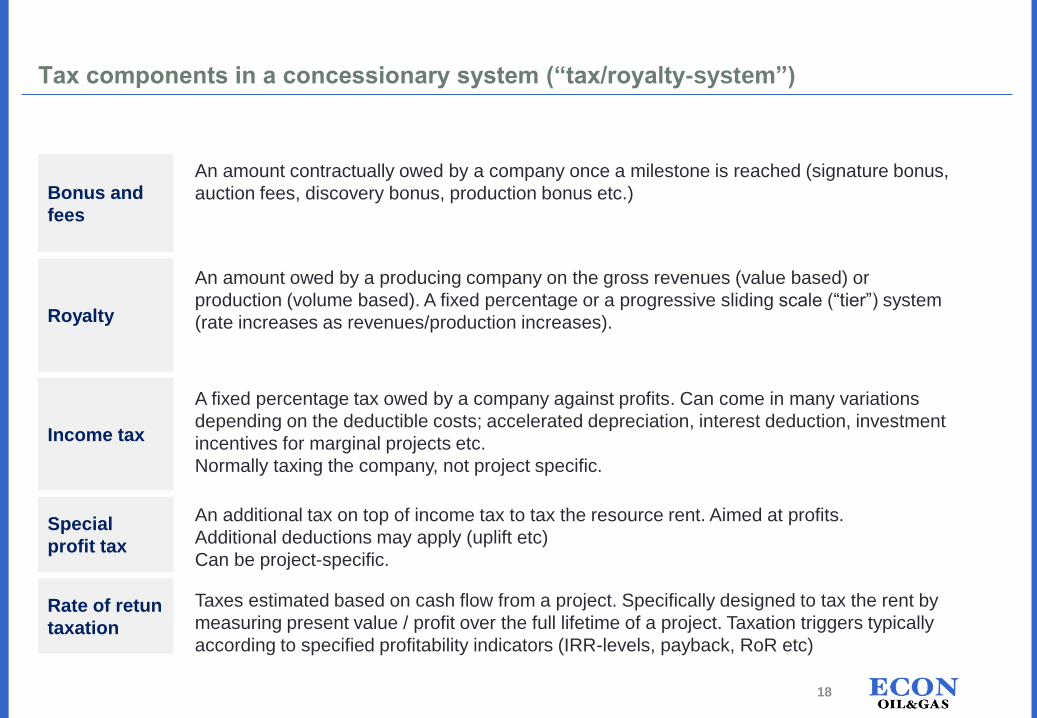
Tax components in a concessionary system (“tax/royalty-system”)
An amount contractually owed by a company once a milestone is reached (signature bonus,
auction fees, discovery bonus, production bonus etc.)
An amount owed by a producing company on the gross revenues (value based) or
production (volume based). A fixed percentage or a progressive sliding scale (“tier”) system
(rate increases as revenues/production increases).
A fixed percentage tax owed by a company against profits. Can come in many variations
depending on the deductible costs; accelerated depreciation, interest deduction, investment
incentives for marginal projects etc.
Normally taxing the company, not project specific.
An additional tax on top of income tax to tax the resource rent. Aimed at profits.
Additional deductions may apply (uplift etc)
Can be project-specific.
Taxes estimated based on cash flow from a project. Specifically designed to tax the rent by
measuring present value / profit over the full lifetime of a project. Taxation triggers typically
according to specified profitability indicators (IRR-levels, payback, RoR etc)
Special
profit tax
Bonus and
fees
Royalty
Income tax
Rate of retun
taxation
18
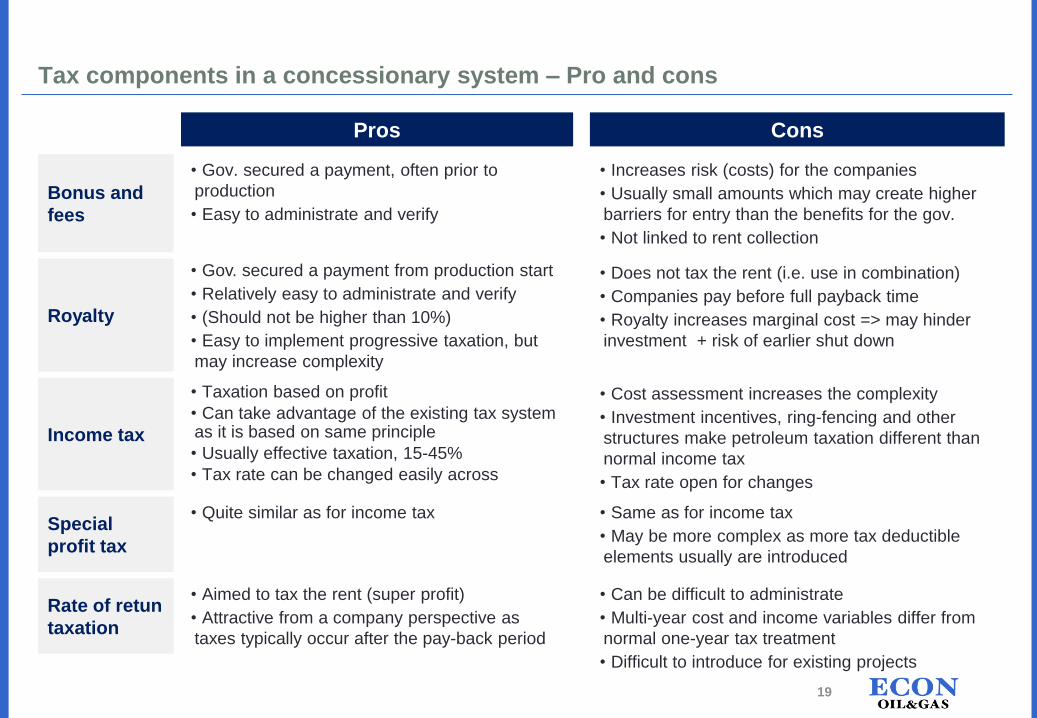
ConsPros
Tax components in a concessionary system – Pro and cons
Special
profit tax
Bonus and
fees
Royalty
Income tax
• Does not tax the rent (i.e. use in combination)
• Companies pay before full payback time
• Royalty increases marginal cost => may hinder
investment + risk of earlier shut down
• Gov. secured a payment, often prior to
production
• Easy to administrate and verify
• Increases risk (costs) for the companies
• Usually small amounts which may create higher
barriers for entry than the benefits for the gov.
• Not linked to rent collection
• Taxation based on profit
• Can take advantage of the existing tax system as it is based on same principle
• Usually effective taxation, 15-45%
• Tax rate can be changed easily across
• Cost assessment increases the complexity
• Investment incentives, ring-fencing and other
structures make petroleum taxation different than
normal income tax
• Tax rate open for changes
• Quite similar as for income tax • Same as for income tax
• May be more complex as more tax deductible
elements usually are introduced
Rate of retun
taxation
• Aimed to tax the rent (super profit)
• Attractive from a company perspective as
taxes typically occur after the pay-back period
• Can be difficult to administrate
• Multi-year cost and income variables differ from
normal one-year tax treatment
• Difficult to introduce for existing projects
• Gov. secured a payment from production start
• Relatively easy to administrate and verify
• (Should not be higher than 10%)
• Easy to implement progressive taxation, but
may increase complexity
19
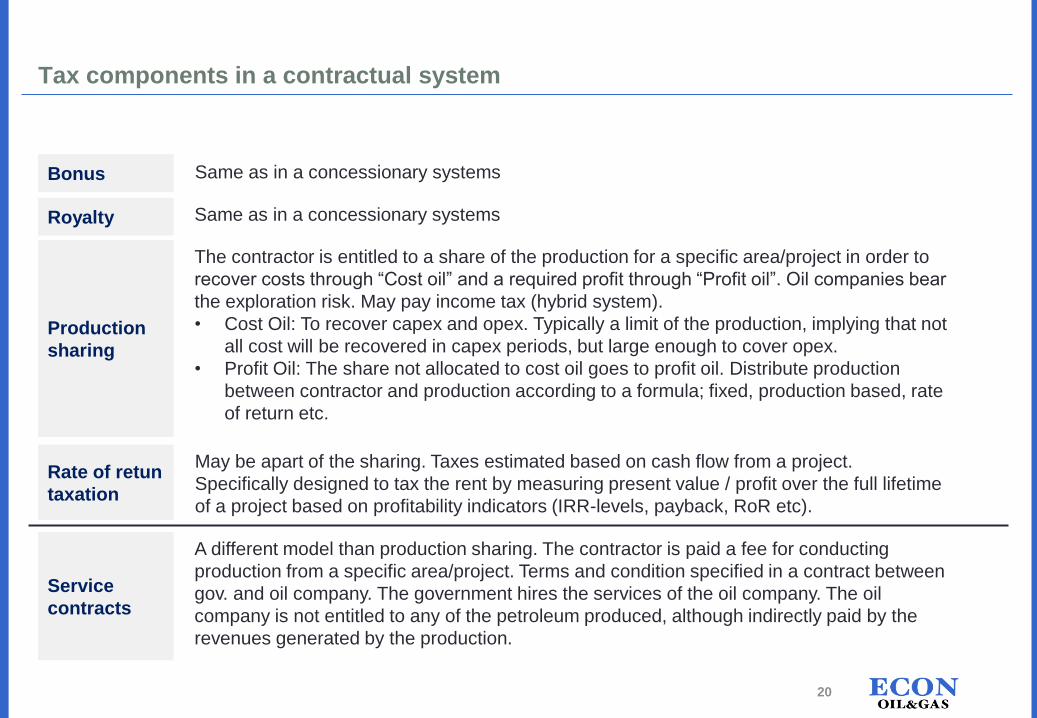
Tax components in a contractual system
Service
contracts
Bonus
Royalty
Production
sharing
Rate of retun
taxation
Same as in a concessionary systems
Same as in a concessionary systems
The contractor is entitled to a share of the production for a specific area/project in order to
recover costs through “Cost oil” and a required profit through “Profit oil”. Oil companies bear
the exploration risk. May pay income tax (hybrid system).
• Cost Oil: To recover capex and opex. Typically a limit of the production, implying that not
all cost will be recovered in capex periods, but large enough to cover opex.
• Profit Oil: The share not allocated to cost oil goes to profit oil. Distribute production
between contractor and production according to a formula; fixed, production based, rate
of return etc.
A different model than production sharing. The contractor is paid a fee for conducting
production from a specific area/project. Terms and condition specified in a contract between
gov. and oil company. The government hires the services of the oil company. The oil
company is not entitled to any of the petroleum produced, although indirectly paid by the
revenues generated by the production.
May be apart of the sharing. Taxes estimated based on cash flow from a project.
Specifically designed to tax the rent by measuring present value / profit over the full lifetime
of a project based on profitability indicators (IRR-levels, payback, RoR etc).
20
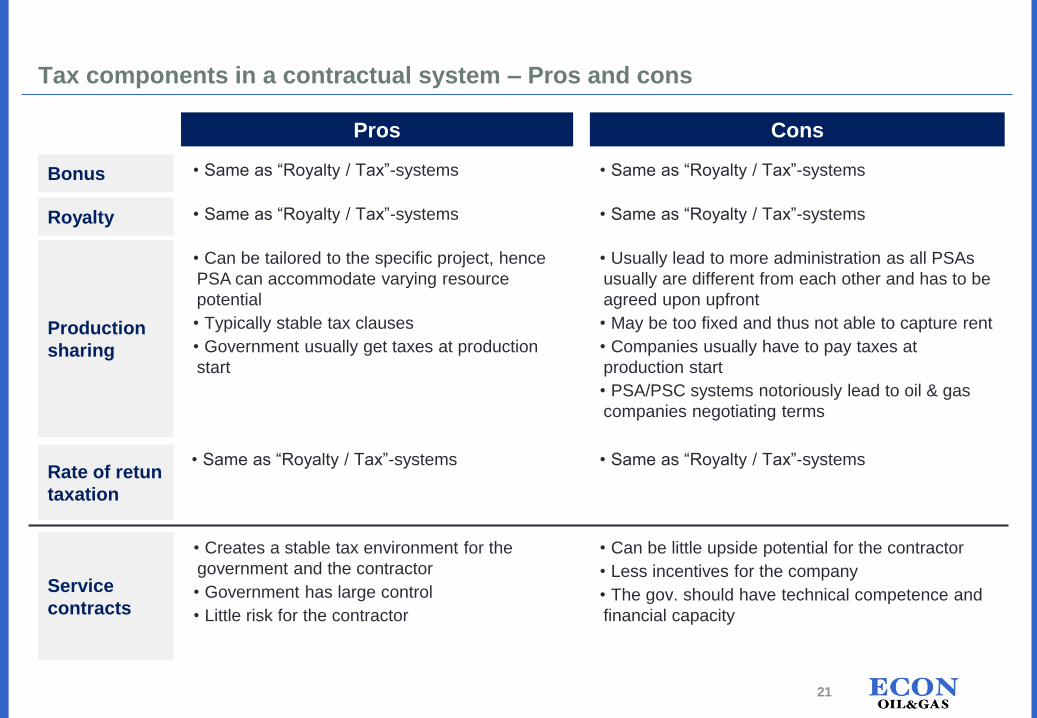
Tax components in a contractual system – Pros and cons
Service
contracts
Bonus
Royalty
Production
sharing
Rate of retun
taxation
• Same as “Royalty / Tax”-systems • Same as “Royalty / Tax”-systems
• Same as “Royalty / Tax”-systems • Same as “Royalty / Tax”-systems
• Can be tailored to the specific project, hence
PSA can accommodate varying resource
potential
• Typically stable tax clauses
• Government usually get taxes at production
start
• Usually lead to more administration as all PSAs
usually are different from each other and has to be
agreed upon upfront
• May be too fixed and thus not able to capture rent
• Companies usually have to pay taxes at
production start
• PSA/PSC systems notoriously lead to oil & gas
companies negotiating terms
• Same as “Royalty / Tax”-systems • Same as “Royalty / Tax”-systems
• Creates a stable tax environment for the
government and the contractor
• Government has large control
• Little risk for the contractor
• Can be little upside potential for the contractor
• Less incentives for the company
• The gov. should have technical competence and
financial capacity
ConsPros
21
Direct state participation – National oil companies (NOC)
• A state-owned company joins as an interest holding company to the block / license
• Gets a share of the contractor’s profit
• Their involvement can come in many varieties
− Full carried interest to normal equity interest (as the other contractors)
• NOC controls more than 90% of the world’s proved reserves
• Pros: Direct involvement can improve cost and operational overview, countercyclical to
stricter/looser taxes imposed by the gov.
• Cons: Has to be funded over the budget (competing with other budget priorities), inefficiency,
may be forced to operate on non-commercial terms (sell subsidized petrol)
− NOCs often less transparent than petroleum companies. In weak states it may be attractive to keep
these companies less public as they can provide money to political priorities
• Important with clear roles between ministries, government agencies and NOC
• Will the industry be more efficient without any direct state participation and that all the profit
was shared through taxation? UK and the US vs. Saudi Arabia and Mexico
Source: IMF, ECON 22
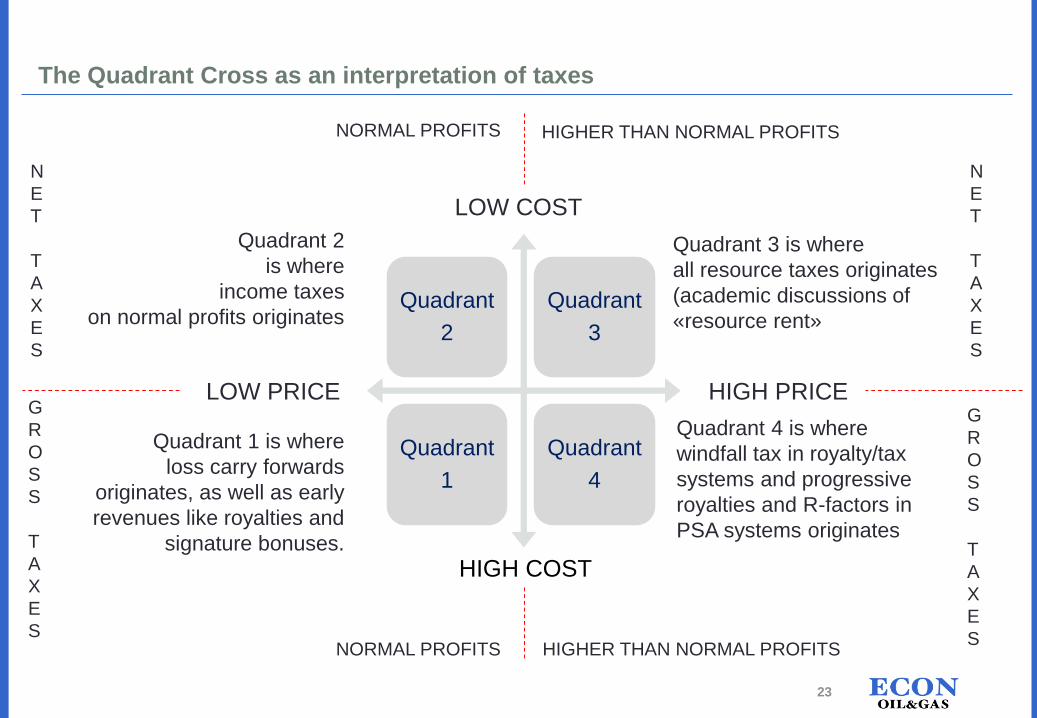
The Quadrant Cross as an interpretation of taxes
Quadrant
2
Quadrant
3
Quadrant
1
Quadrant
4
HIGH COST
LOW COST
HIGH PRICELOW PRICE
Quadrant 1 is where
loss carry forwards
originates, as well as early
revenues like royalties and
signature bonuses.
Quadrant 2
is where
income taxes
on normal profits originates
G
R
O
S
S
T
A
X
E
S
G
R
O
S
S
T
A
X
E
S
N
E
T
T
A
X
E
S
N
E
T
T
A
X
E
S
NORMAL PROFITS
NORMAL PROFITS
HIGHER THAN NORMAL PROFITS
HIGHER THAN NORMAL PROFITS
Quadrant 3 is where
all resource taxes originates
(academic discussions of
«resource rent»
Quadrant 4 is where
windfall tax in royalty/tax
systems and progressive
royalties and R-factors in
PSA systems originates
23
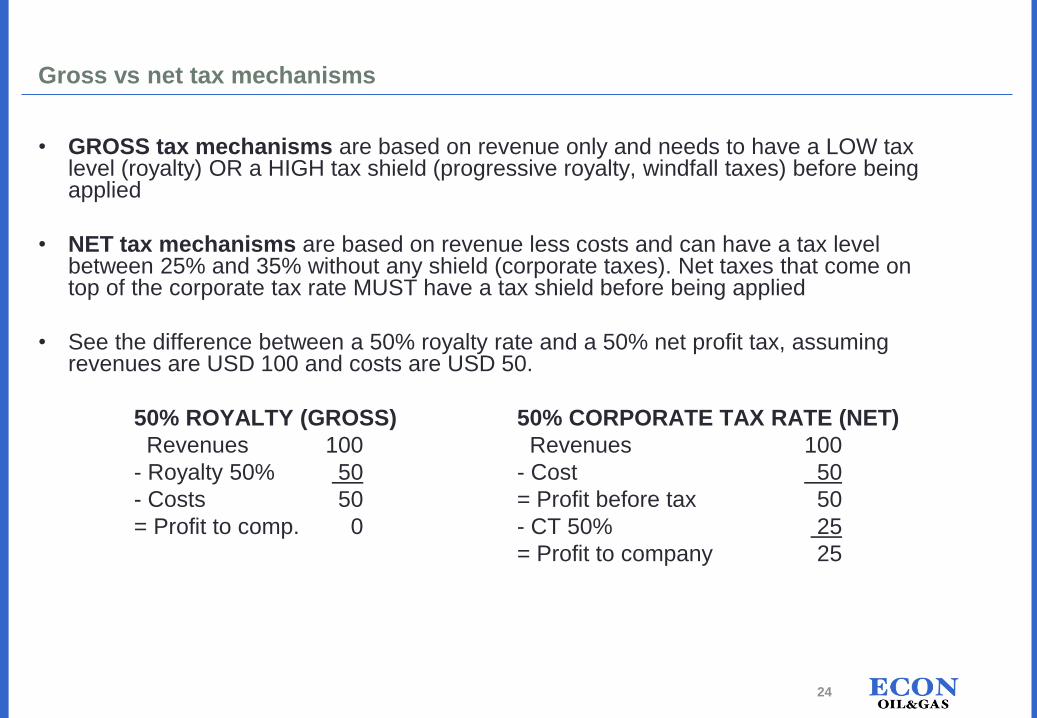
• GROSS tax mechanisms are based on revenue only and needs to have a LOW tax level (royalty) OR a HIGH tax shield (progressive royalty, windfall taxes) before being applied
• NET tax mechanisms are based on revenue less costs and can have a tax level between 25% and 35% without any shield (corporate taxes). Net taxes that come on top of the corporate tax rate MUST have a tax shield before being applied
• See the difference between a 50% royalty rate and a 50% net profit tax, assuming revenues are USD 100 and costs are USD 50.
50% ROYALTY (GROSS) 50% CORPORATE TAX RATE (NET)
Revenues 100 Revenues 100
- Royalty 50% 50 - Cost 50
- Costs 50 = Profit before tax 50
= Profit to comp. 0 - CT 50% 25
= Profit to company 25
Gross vs net tax mechanisms
24
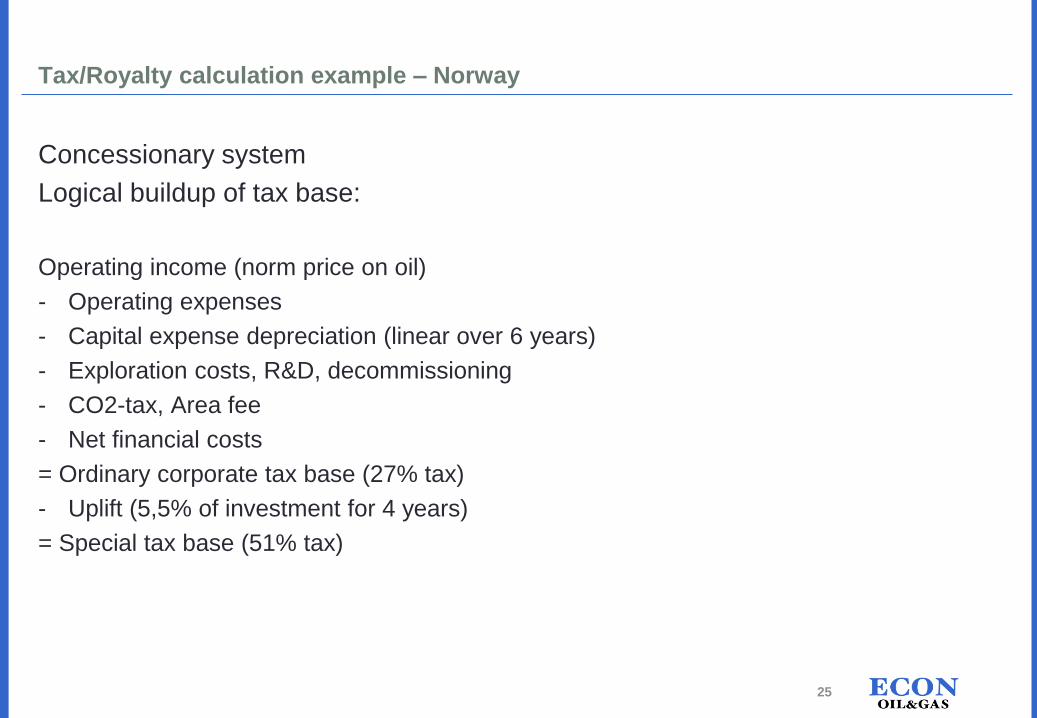
Tax/Royalty calculation example – Norway
Concessionary system
Logical buildup of tax base:
Operating income (norm price on oil)
- Operating expenses
- Capital expense depreciation (linear over 6 years)
- Exploration costs, R&D, decommissioning
- CO2-tax, Area fee
- Net financial costs
= Ordinary corporate tax base (27% tax)
- Uplift (5,5% of investment for 4 years)
= Special tax base (51% tax)
25
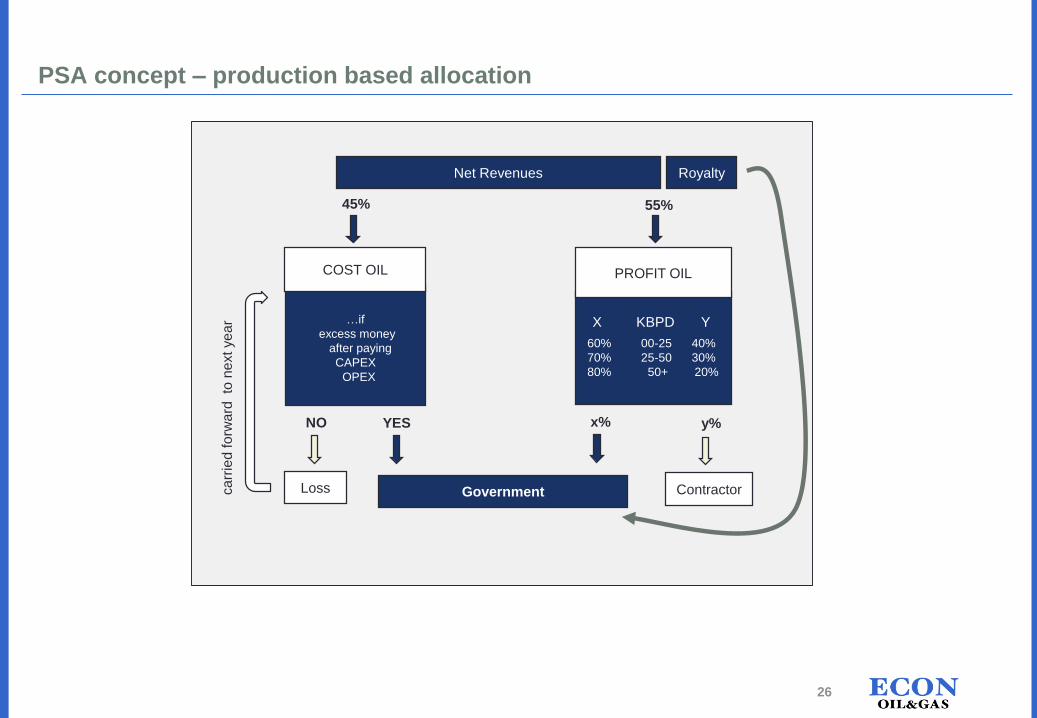
PSA concept – production based allocation
Net Revenues
y%
Government Contractorca
rrie
d f
orw
ard
to
ne
xt ye
ar X KBPD Y
60% 00-25 40%
70% 25-50 30%
80% 50+ 20%
…if
excess money
after paying
CAPEX
OPEX
x%YESNO
Loss
PROFIT OIL
55%45%
COST OIL
Royalty
26
1. Petroleum taxation – Some theory and challenges
2. Concessionary vs Contractual system – The two main families of petroleum tax systems
3. Resource tax administration and collection
4. Appendix
Agenda
27
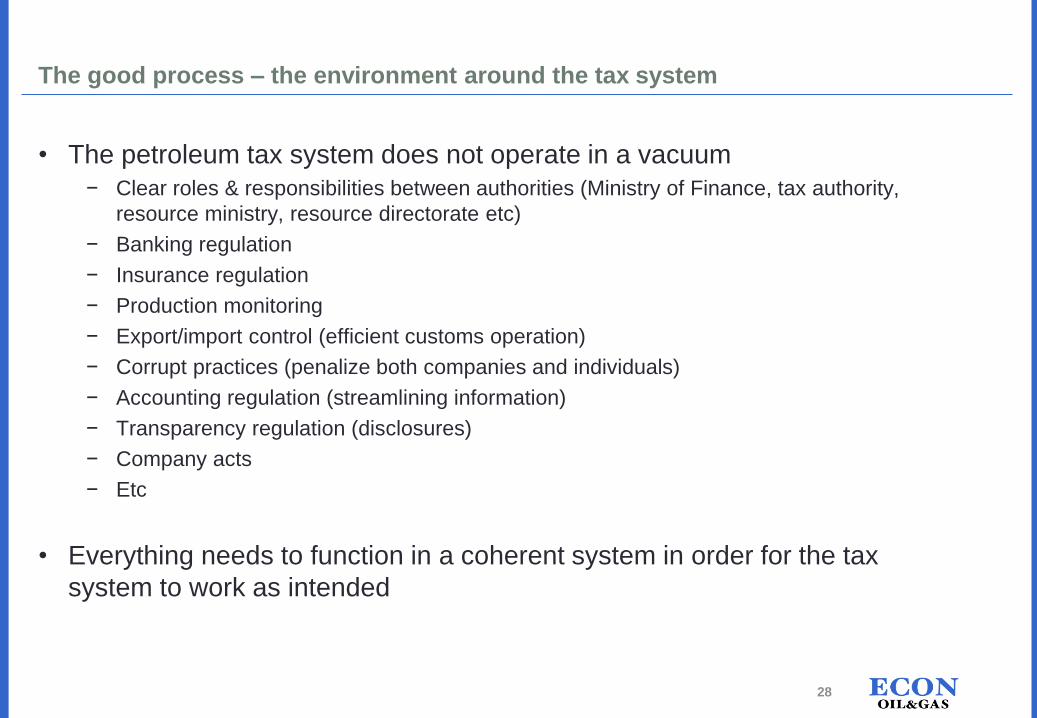
The good process – the environment around the tax system
• The petroleum tax system does not operate in a vacuum
− Clear roles & responsibilities between authorities (Ministry of Finance, tax authority,
resource ministry, resource directorate etc)
− Banking regulation
− Insurance regulation
− Production monitoring
− Export/import control (efficient customs operation)
− Corrupt practices (penalize both companies and individuals)
− Accounting regulation (streamlining information)
− Transparency regulation (disclosures)
− Company acts
− Etc
• Everything needs to function in a coherent system in order for the tax
system to work as intended
28
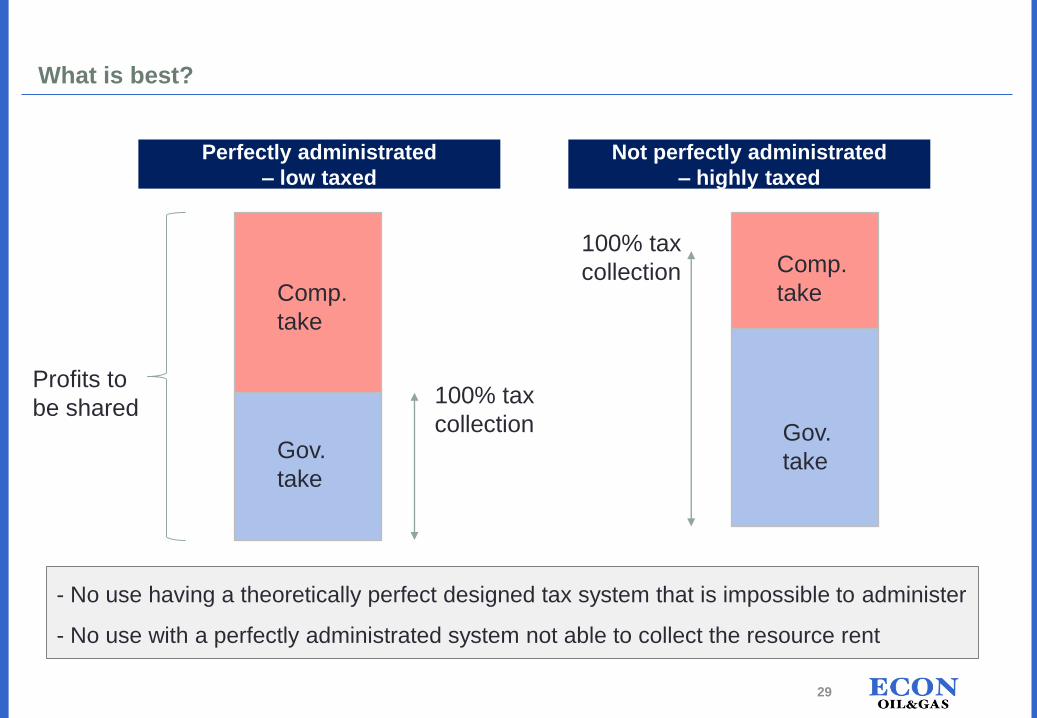
What is best?
Not perfectly administrated
– highly taxed
Perfectly administrated
– low taxed
Gov.
take
Gov.
take
Profits to
be shared
100% tax
collectionComp.
take
Comp.
take
100% tax
collection
- No use having a theoretically perfect designed tax system that is impossible to administer
- No use with a perfectly administrated system not able to collect the resource rent
29
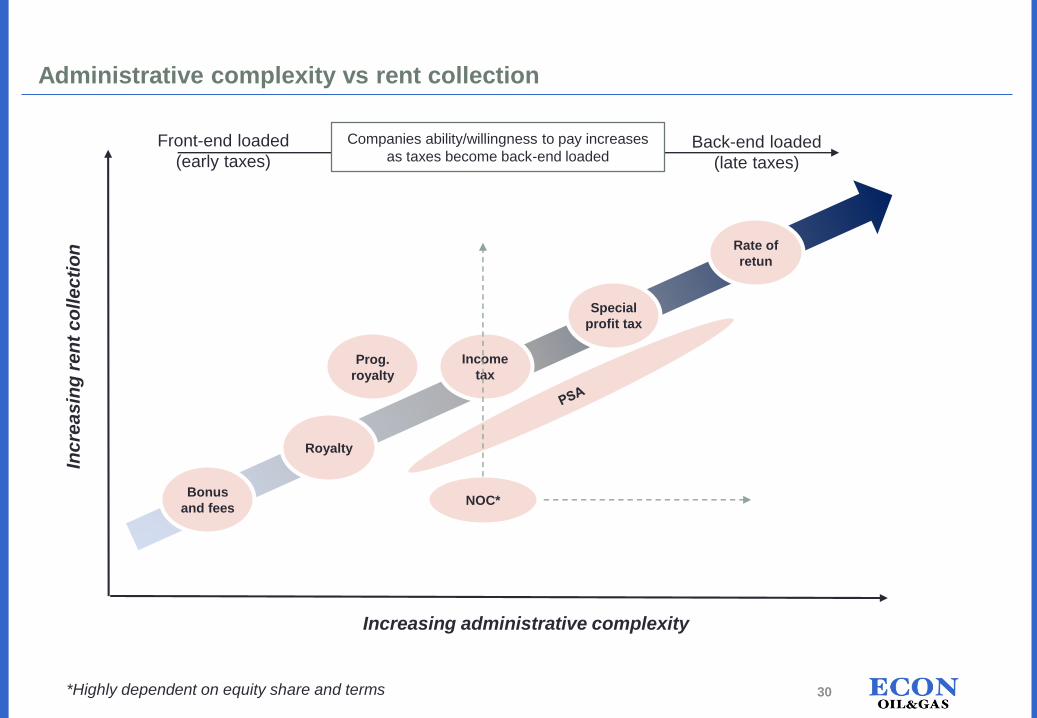
Administrative complexity vs rent collection
Increasing administrative complexity
Inc
rea
sin
g r
en
t c
oll
ec
tio
n
Bonus
and fees
Royalty
Income
tax
Special
profit tax
Rate of
retun
Front-end loaded
(early taxes)Back-end loaded
(late taxes)
Prog.
royalty
NOC*
Companies ability/willingness to pay increases
as taxes become back-end loaded
30*Highly dependent on equity share and terms
Ease the administration by simplify the tax system
• One tax regime
− It is easier to understand and control one system than two systems
− Reduces transparency
• Standardise contracts
− Standardise and limit the number of variable parameters across contracts
− Use common building blocks
• Use familiar and internationally established industry concepts
− Accounting rules, deductible costs
− In general easier to audit
• Reduce the number of taxes
− Resource rent collection, right incentives, risk sharing can be obtained through a few instruments
− The introduction of many tax elements (which may be minor) increases complexity (educational tax, area fees, local society tax, production bonuses etc.).
• Possible to simplify any provisions?
− Using a benchmark price instead obtained market price
− Make transparent and simple structures that can be verified
Source: IMF, ECON 31
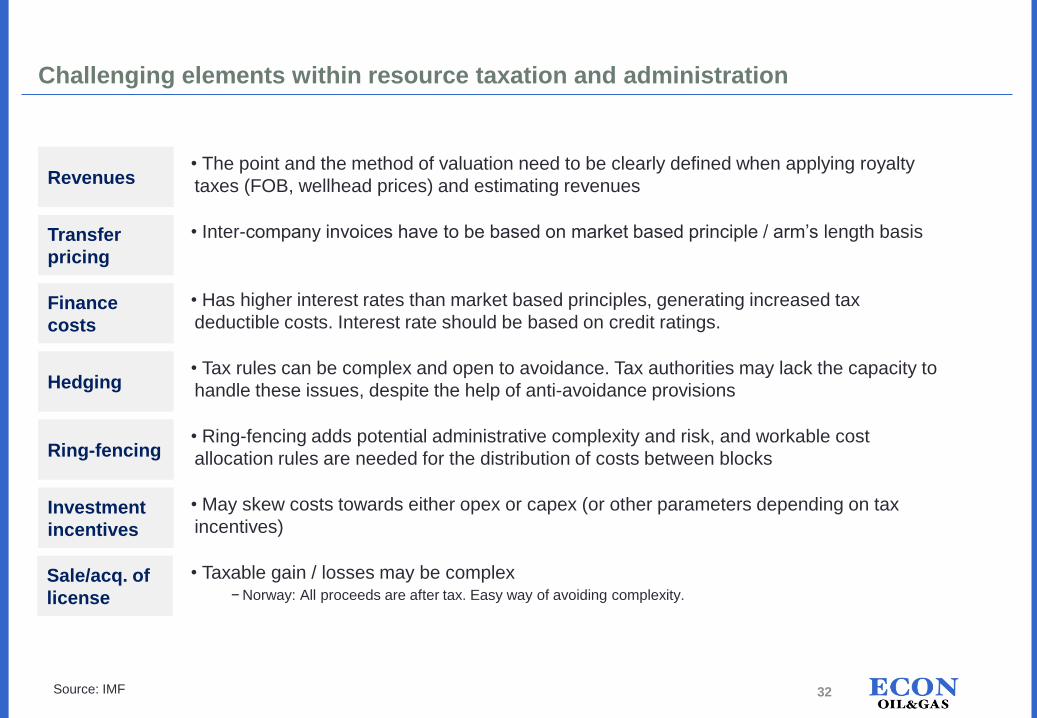
Challenging elements within resource taxation and administration
32
Hedging
Revenues
Transfer
pricing
Finance
costs
Ring-fencing
Investment
incentives
Sale/acq. of
license
• The point and the method of valuation need to be clearly defined when applying royalty
taxes (FOB, wellhead prices) and estimating revenues
• Inter-company invoices have to be based on market based principle / arm’s length basis
• Has higher interest rates than market based principles, generating increased tax
deductible costs. Interest rate should be based on credit ratings.
• Tax rules can be complex and open to avoidance. Tax authorities may lack the capacity to
handle these issues, despite the help of anti-avoidance provisions
• Ring-fencing adds potential administrative complexity and risk, and workable cost
allocation rules are needed for the distribution of costs between blocks
• May skew costs towards either opex or capex (or other parameters depending on tax
incentives)
• Taxable gain / losses may be complex− Norway: All proceeds are after tax. Easy way of avoiding complexity.
Source: IMF
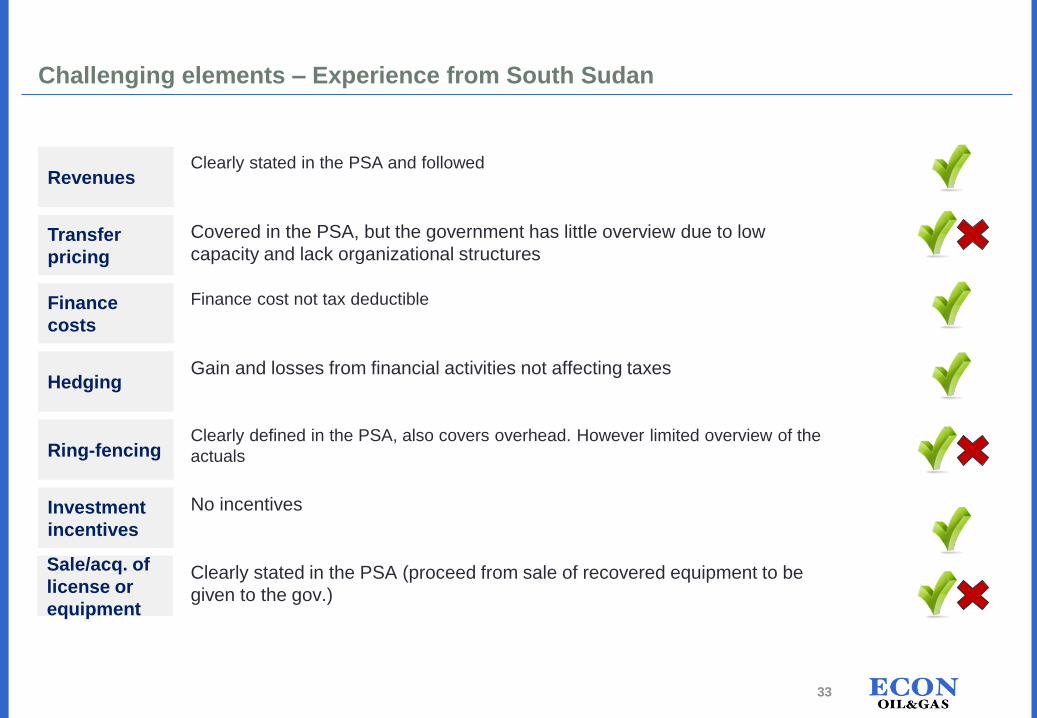
Challenging elements – Experience from South Sudan
33
Hedging
Revenues
Transfer
pricing
Finance
costs
Ring-fencing
Investment
incentives
Sale/acq. of
license or
equipment
Clearly stated in the PSA and followed
Covered in the PSA, but the government has little overview due to low
capacity and lack organizational structures
Finance cost not tax deductible
Gain and losses from financial activities not affecting taxes
Clearly defined in the PSA, also covers overhead. However limited overview of the
actuals
No incentives
Clearly stated in the PSA (proceed from sale of recovered equipment to be
given to the gov.)
Oil & gas companies do audit each other
• Oil & gas companies who are together in a joint venture (several companies
owning and operating the same assets) will have the right to carry out audits on
costs that are entering the joint venture usually it is the partner companies that
audits the operator
• Any costs that comes from the joint venture through a billing is thus usually quite
reliable and it is possible to put a higher reliability on the joint venture costs
entering a company’s financial statements than their 100% costs.
• A tax administration should therefore have particular attention to the oil & gas
company’s own cost (not joint venture), non-transactional costs that they receive
from the parent company (or other companies in the group) or R&D and overhead
cost that is invoiced directly from the operator (does not go through the joint
venture accounts).
34
Main differences between the audits
• The FINANCIAL AUDIT is mainly concerned with items not being materially wrong
in the financial statement. Main focus on revenues and costs. The financial audit is
very systems oriented, but do not have in mind discovering tax.
• The JOINT VENTURE AUDIT is the other partners auditing the operators cost
accounting prior to billing costs to partners. This audit is good at validating certain
cost categories, particularly those in-country, but fail to consider procurement
rebates and kickbacks.
• The TAX AUDIT is focused on tax evasion as tax avoidance is legal. Tax
avoidance is hard to catch though, because of the burden of evidence that a
transaction was done only for tax purposes and do not have any commercial
purposes. Transfer mispricing and derivatives abuse fall into this category – two
themes that are notoriously difficult to audit (the tax auditor needs help from the
legislator).
35

Audit experiences from South Sudan
• The government fears that the Joint Operating Companies’ (JOCs) costs are
unreasonably high for operating the producing fields. For example through having
non-operating rigs (or other equipment) located on the fields where the daily rents
are being paid to subsidiaries in their home country, while the operating costs can
be deducted from the “cost oil”.
Lower government revenues, and more income to the JOCs (or associated companies)
Taken directly from the cost oil share
• GoRSS need a closer collaboration with the JOCs
• Lack of structure and capacity within the government makes it difficult to conduct
audits
• One of the big goals for the government is to be able to do a full audit of the
petroleum sector
36
1. Petroleum taxation – Some theory and challenges
2. Concessionary vs Contractual system – The two main families of petroleum tax systems
3. Resource tax administration and collection
4. Appendix
Agenda
37
Other tax examples
• Zambia, mining
− Introduced windfall royalty tax that was not deductible and ended up with a marginal tax
rate close to 100%
• Denmark, petroleum
− Had uplift at 250% for investments, leading to very low effective tax rate relative to the
marginal tax rate
− Few years where companies had to pay the special tax
• Australia, mining
− Introduced controversial resource rent tax in 2012
− Repealed in 2014
38
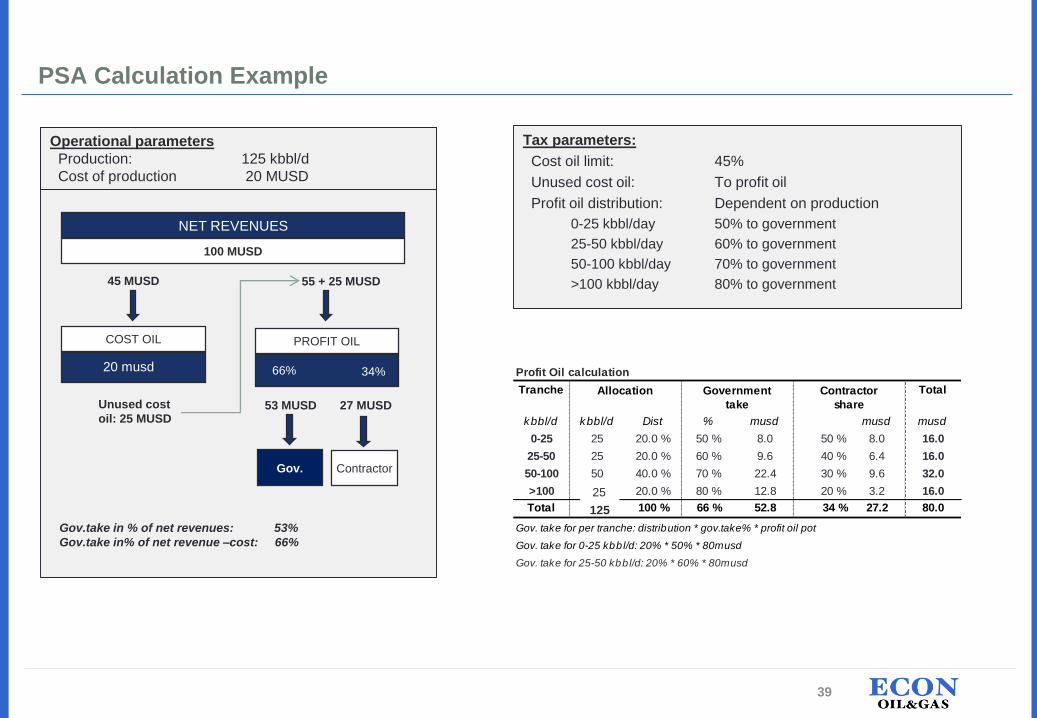
PSA Calculation Example
Tax parameters:
Cost oil limit: 45%
Unused cost oil: To profit oil
Profit oil distribution: Dependent on production
0-25 kbbl/day 50% to government
25-50 kbbl/day 60% to government
50-100 kbbl/day 70% to government
>100 kbbl/day 80% to government55 + 25 MUSD
PROFIT OIL
66% 34%
53 MUSD 27 MUSDUnused cost
oil: 25 MUSD
Gov. Contractor
NET REVENUES
100 MUSD
45 MUSD
COST OIL
20 musd
Operational parameters
Production: 125 kbbl/d
Cost of production 20 MUSD
Profit Oil calculation
Tranche Total
kbbl/d kbbl/d Dist % musd musd musd
0-25 25 20.0 % 50 % 8.0 50 % 8.0 16.0
25-50 25 20.0 % 60 % 9.6 40 % 6.4 16.0
50-100 50 40.0 % 70 % 22.4 30 % 9.6 32.0
>100 50 20.0 % 80 % 12.8 20 % 3.2 16.0
Total 150 100 % 66 % 52.8 34 % 27.2 80.0
Gov. take for per tranche: distribution * gov.take% * profit oil pot
Gov. take for 0-25 kbbl/d: 20% * 50% * 80musd
Gov. take for 25-50 kbbl/d: 20% * 60% * 80musd
Government Contractor
take share
Allocation
Gov.take in % of net revenues: 53%
Gov.take in% of net revenue –cost: 66%
25
125
39
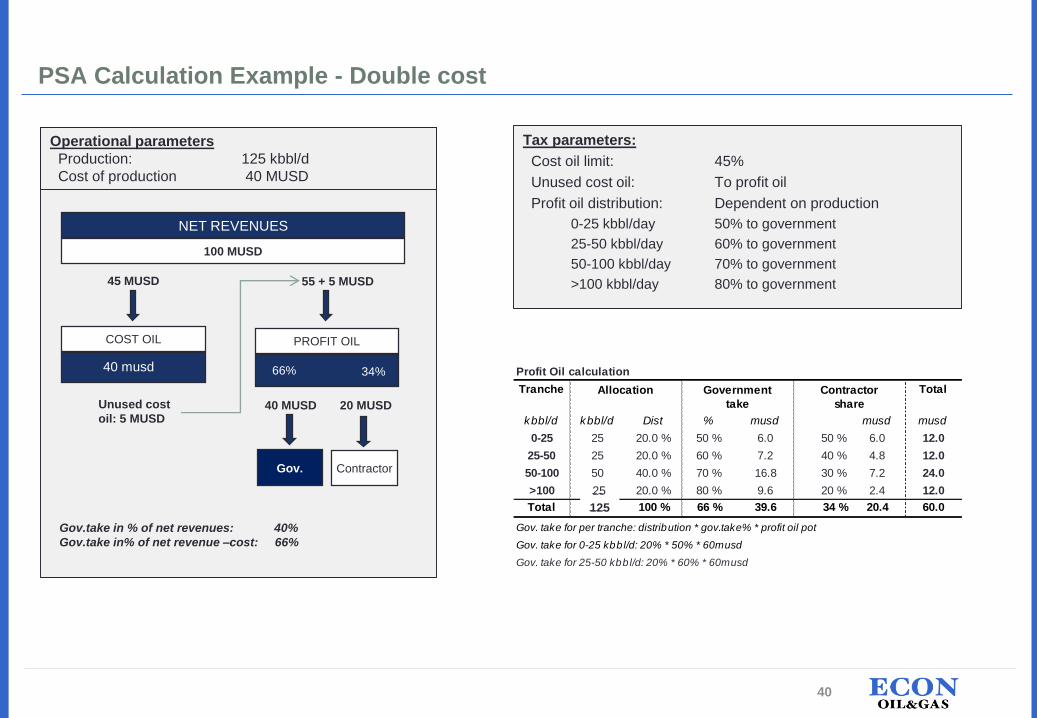
Profit Oil calculation
Tranche Total
kbbl/d kbbl/d Dist % musd musd musd
0-25 25 20.0 % 50 % 6.0 50 % 6.0 12.0
25-50 25 20.0 % 60 % 7.2 40 % 4.8 12.0
50-100 50 40.0 % 70 % 16.8 30 % 7.2 24.0
>100 50 20.0 % 80 % 9.6 20 % 2.4 12.0
Total 150 100 % 66 % 39.6 34 % 20.4 60.0
Gov. take for per tranche: distribution * gov.take% * profit oil pot
Gov. take for 0-25 kbbl/d: 20% * 50% * 60musd
Gov. take for 25-50 kbbl/d: 20% * 60% * 60musd
Government Contractor
take share
Allocation
PSA Calculation Example - Double cost
Tax parameters:
Cost oil limit: 45%
Unused cost oil: To profit oil
Profit oil distribution: Dependent on production
0-25 kbbl/day 50% to government
25-50 kbbl/day 60% to government
50-100 kbbl/day 70% to government
>100 kbbl/day 80% to government55 + 5 MUSD
PROFIT OIL
66% 34%
40 MUSD 20 MUSDUnused cost
oil: 5 MUSD
Gov. Contractor
NET REVENUES
100 MUSD
45 MUSD
COST OIL
40 musd
Operational parameters
Production: 125 kbbl/d
Cost of production 40 MUSD
Gov.take in % of net revenues: 40%
Gov.take in% of net revenue –cost: 66%
25
125
40

Profit Oil calculation
Tranche Total
kbbl/d kbbl/d Dist % musd musd musd
0-25 25 10.0 % 50 % 8.0 50 % 8.0 16.0
25-50 25 10.0 % 60 % 9.6 40 % 6.4 16.0
50-100 50 20.0 % 70 % 22.4 30 % 9.6 32.0
>100 50 60.0 % 80 % 76.8 20 % 19.2 96.0
Total 150 100 % 73 % 116.8 27 % 43.2 160.0
Gov. take for per tranche: distribution * gov.take% * profit oil pot
Gov. take for 0-25 kbbl/d: 20% * 50% * 160musd
Gov. take for 25-50 kbbl/d: 20% * 60% * 160musd
Government Contractor
take share
Allocation
PSA Calculation Example - Double production
Tax parameters:
Cost oil limit: 45%
Unused cost oil: To profit oil
Profit oil distribution: Dependent on production
0-25 kbbl/day 50% to government
25-50 kbbl/day 60% to government
50-100 kbbl/day 70% to government
>100 kbbl/day 80% to government110 + 70 MUSD
PROFIT OIL
73% 27%
117 MUSD 43 MUSDUnused cost
oil: 70 MUSD
Gov. Contractor
NET REVENUES
200 MUSD
90 MUSD
COST OIL
40 musd
Operational parameters
Production: 250 kbbl/d
Cost of production 40 MUSD
Gov.take in % of net revenues: 58%
Gov.take in% of net revenue –cost: 73%
150
250
41
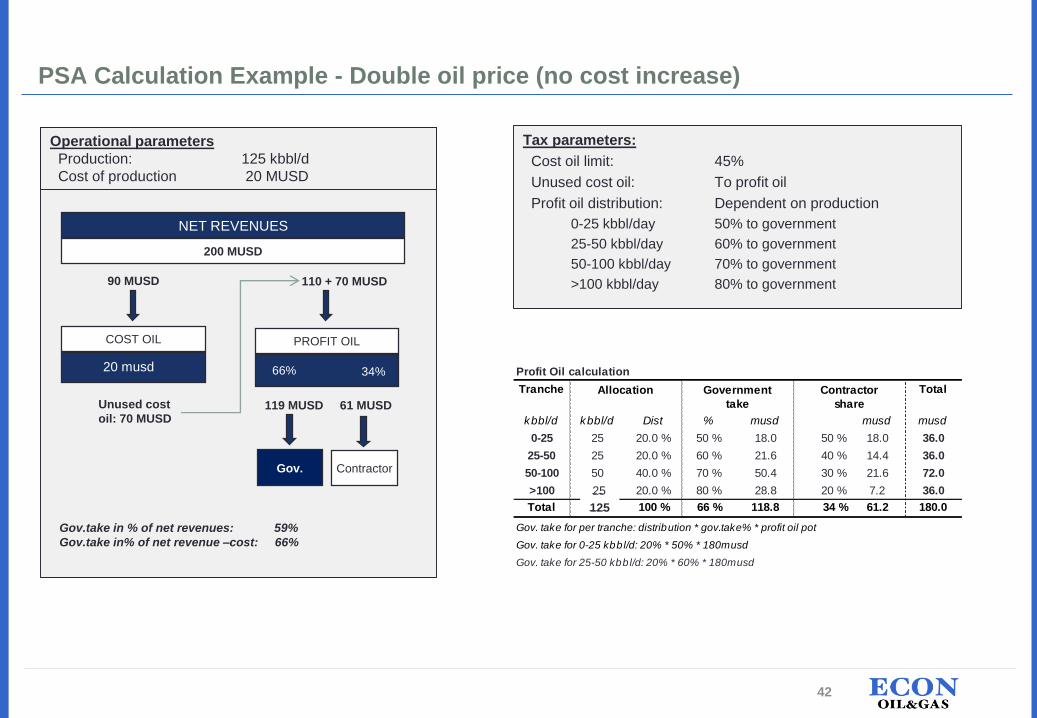
Profit Oil calculation
Tranche Total
kbbl/d kbbl/d Dist % musd musd musd
0-25 25 20.0 % 50 % 18.0 50 % 18.0 36.0
25-50 25 20.0 % 60 % 21.6 40 % 14.4 36.0
50-100 50 40.0 % 70 % 50.4 30 % 21.6 72.0
>100 50 20.0 % 80 % 28.8 20 % 7.2 36.0
Total 150 100 % 66 % 118.8 34 % 61.2 180.0
Gov. take for per tranche: distribution * gov.take% * profit oil pot
Gov. take for 0-25 kbbl/d: 20% * 50% * 180musd
Gov. take for 25-50 kbbl/d: 20% * 60% * 180musd
Government Contractor
take share
Allocation
PSA Calculation Example - Double oil price (no cost increase)
Tax parameters:
Cost oil limit: 45%
Unused cost oil: To profit oil
Profit oil distribution: Dependent on production
0-25 kbbl/day 50% to government
25-50 kbbl/day 60% to government
50-100 kbbl/day 70% to government
>100 kbbl/day 80% to government110 + 70 MUSD
PROFIT OIL
66% 34%
119 MUSD 61 MUSDUnused cost
oil: 70 MUSD
Gov. Contractor
NET REVENUES
200 MUSD
90 MUSD
COST OIL
20 musd
Operational parameters
Production: 125 kbbl/d
Cost of production 20 MUSD
Gov.take in % of net revenues: 59%
Gov.take in% of net revenue –cost: 66%
25
125
42
PSA Calculation Example – Some learning points
• An increased cost base does not affect the government share in %, but since there
are less profits to share among the contractors and the government, both parties
eventually loose in monetary terms
• Increased production increases the government share (relatively more production
in high-taxed tranche) in conjunction with increased the revenue. This creates a
proportional higher profit relative to “base” case.
• Increased price seems to be the most attractive for both parties as costs are not
affected => more profit to share.
• The challenge is to create a fiscal system that provides the contractor a
reasonable IRR under many macro economic environments, and at the other hand
generates sufficient taxes to the government.
43

Name: Jørgen KlevPhone: +48 04 39 28Email: [email protected]: www.econoilandgas.com
Thank you for listening


