A Comparison of Wood Density between Classical Cremonese and Modern Violins Berend C. Stoel 1 *, Terry M. Borman 2 1 Department of Radiology, Division of Image Processing, Leiden University Medical Center, Leiden, The Netherlands, 2 Borman Violins, Fayetteville, Arkansas, United States of America Abstract Classical violins created by Cremonese masters, such as Antonio Stradivari and Giuseppe Guarneri Del Gesu, have become the benchmark to which the sound of all violins are compared in terms of their abilities of expressiveness and projection. By general consensus, no luthier since that time has been able to replicate the sound quality of these classical instruments. The vibration and sound radiation characteristics of a violin are determined by an instrument’s geometry and the material properties of the wood. New test methods allow the non-destructive examination of one of the key material properties, the wood density, at the growth ring level of detail. The densities of five classical and eight modern violins were compared, using computed tomography and specially developed image-processing software. No significant differences were found between the median densities of the modern and the antique violins, however the density difference between wood grains of early and late growth was significantly smaller in the classical Cremonese violins compared with modern violins, in both the top (Spruce) and back (Maple) plates (p = 0.028 and 0.008, respectively). The mean density differential (SE) of the top plates of the modern and classical violins was 274 (26.6) and 183 (11.7) gram/liter. For the back plates, the values were 128 (2.6) and 115 (2.0) gram/liter. These differences in density differentials may reflect similar changes in stiffness distributions, which could directly impact vibrational efficacy or indirectly modify sound radiation via altered damping characteristics. Either of these mechanisms may help explain the acoustical differences between the classical and modern violins. Citation: Stoel BC, Borman TM (2008) A Comparison of Wood Density between Classical Cremonese and Modern Violins. PLoS ONE 3(7): e2554. doi:10.1371/ journal.pone.0002554 Editor: Ananth Grama, Purdue University, United States of America Received March 18, 2008; Accepted May 30, 2008; Published July 2, 2008 Copyright: ß 2008 Stoel, Borman. This is an open-access article distributed under the terms of the Creative Commons Attribution License, which permits unrestricted use, distribution, and reproduction in any medium, provided the original author and source are credited. Funding: The authors have no support or funding to report. Competing Interests: The authors have declared that no competing interests exist. * E-mail: [email protected]Introduction For the past 300 years, the violins of Antonio Stradivari (1634– 1737) and Giuseppe Guarneri del Gesu (1698–1744) have excelled in molding a many-nuanced sound that seems to better express the intent of composers and musicians. These classical Cremonese violins have become the benchmark to which all violins are compared. Presently, many believe that violin craftsmanship is at its most advanced point since the days of the Cremonese luthiers, and yet instruments produced today do not match the classical instruments in their abilities of expressiveness and projection. It remains unclear what has kept them, for such a long time and through such changing musical needs, as the most sought after. Research into the production of high quality sound has focused on a wide range of variables, such as the arching design and contours [1], plate thickness [2], the impact of varnish layers [3,4], as well as the various elements of set-up, such as the angle of the neck, the impact of the fingerboard and the angle of the strings passing over the bridge. Extensive work has been done searching for the ideal wood properties [5–9], although none corresponding exactly to known Cremonese wood properties as most tested samples have been of significantly higher median density than those found to be the case in this study. Tracheid clusters, produced during annual growth cycles of the tree, create the prominent light/dark grain lines in wood. Early growth wood, created during spring, is primarily responsible for water transport and thus is more porous and less dense than late growth wood, which plays more of a structural support role [10], of much more closely packed tracheids. Wood is an orthotropic material, having differing mechanical properties in three direc- tions: along the grain, across the grain, and slabwise (circumfer- entially) [11]. The differences in density between early and late growth wood may impact the detailed vibrational behavior, either directly or through altered stiffness or damping characteristics due to these variations. The complex three-dimensional shape of the violin body means that vibration within the audio range involves extensional, bending and shear deformations of the wooden plates involving all three directions. Researchers have commented on wood selection preferences based on these differentials [9], although detailed data are lacking on fine instruments. Wood density is difficult and invasive to measure directly, as an isolated part of the instrument, wrapped in a waterproof container, must be immersed in water to estimate its volume, and the density is calculated by dividing its weight by this volume [12]. Furthermore, this technique does not provide data on density differentials. Computed Tomography (CT) has been used by other researchers [13–15] primarily for visual analysis, without fully employing its ability to quantify density or density differentials. Here we examine the wood density of five classical Cremonese violins; three by Giuseppe Guarneri del Gesu and two by Antonio Stradivari, using quantitative CT densitometry, a rapid and non- invasive technique usually applied in a medical setting [16]. The PLoS ONE | www.plosone.org 1 July 2008 | Volume 3 | Issue 7 | e2554
Transcript
A Comparison of Wood Density between ClassicalCremonese and Modern ViolinsBerend C. Stoel1*, Terry M. Borman2
1 Department of Radiology, Division of Image Processing, Leiden University Medical Center, Leiden, The Netherlands, 2 Borman Violins, Fayetteville, Arkansas, United
States of America
Abstract
Classical violins created by Cremonese masters, such as Antonio Stradivari and Giuseppe Guarneri Del Gesu, have becomethe benchmark to which the sound of all violins are compared in terms of their abilities of expressiveness and projection. Bygeneral consensus, no luthier since that time has been able to replicate the sound quality of these classical instruments. Thevibration and sound radiation characteristics of a violin are determined by an instrument’s geometry and the materialproperties of the wood. New test methods allow the non-destructive examination of one of the key material properties, thewood density, at the growth ring level of detail. The densities of five classical and eight modern violins were compared,using computed tomography and specially developed image-processing software. No significant differences were foundbetween the median densities of the modern and the antique violins, however the density difference between wood grainsof early and late growth was significantly smaller in the classical Cremonese violins compared with modern violins, in boththe top (Spruce) and back (Maple) plates (p = 0.028 and 0.008, respectively). The mean density differential (SE) of the topplates of the modern and classical violins was 274 (26.6) and 183 (11.7) gram/liter. For the back plates, the values were 128(2.6) and 115 (2.0) gram/liter. These differences in density differentials may reflect similar changes in stiffness distributions,which could directly impact vibrational efficacy or indirectly modify sound radiation via altered damping characteristics.Either of these mechanisms may help explain the acoustical differences between the classical and modern violins.
Citation: Stoel BC, Borman TM (2008) A Comparison of Wood Density between Classical Cremonese and Modern Violins. PLoS ONE 3(7): e2554. doi:10.1371/journal.pone.0002554
Editor: Ananth Grama, Purdue University, United States of America
Received March 18, 2008; Accepted May 30, 2008; Published July 2, 2008
Copyright: � 2008 Stoel, Borman. This is an open-access article distributed under the terms of the Creative Commons Attribution License, which permitsunrestricted use, distribution, and reproduction in any medium, provided the original author and source are credited.
Funding: The authors have no support or funding to report.
Competing Interests: The authors have declared that no competing interests exist.
For the past 300 years, the violins of Antonio Stradivari (1634–
1737) and Giuseppe Guarneri del Gesu (1698–1744) have excelled
in molding a many-nuanced sound that seems to better express the
intent of composers and musicians. These classical Cremonese
violins have become the benchmark to which all violins are
compared. Presently, many believe that violin craftsmanship is at
its most advanced point since the days of the Cremonese luthiers,
and yet instruments produced today do not match the classical
instruments in their abilities of expressiveness and projection. It
remains unclear what has kept them, for such a long time and
through such changing musical needs, as the most sought after.
Research into the production of high quality sound has focused
on a wide range of variables, such as the arching design and
contours [1], plate thickness [2], the impact of varnish layers [3,4],
as well as the various elements of set-up, such as the angle of the
neck, the impact of the fingerboard and the angle of the strings
passing over the bridge. Extensive work has been done searching
for the ideal wood properties [5–9], although none corresponding
exactly to known Cremonese wood properties as most tested
samples have been of significantly higher median density than
those found to be the case in this study.
Tracheid clusters, produced during annual growth cycles of the
tree, create the prominent light/dark grain lines in wood. Early
growth wood, created during spring, is primarily responsible for
water transport and thus is more porous and less dense than late
growth wood, which plays more of a structural support role [10],
of much more closely packed tracheids. Wood is an orthotropic
material, having differing mechanical properties in three direc-
tions: along the grain, across the grain, and slabwise (circumfer-
entially) [11]. The differences in density between early and late
growth wood may impact the detailed vibrational behavior, either
directly or through altered stiffness or damping characteristics due
to these variations. The complex three-dimensional shape of the
violin body means that vibration within the audio range involves
extensional, bending and shear deformations of the wooden plates
involving all three directions. Researchers have commented on
wood selection preferences based on these differentials [9],
although detailed data are lacking on fine instruments. Wood
density is difficult and invasive to measure directly, as an isolated
part of the instrument, wrapped in a waterproof container, must
be immersed in water to estimate its volume, and the density is
calculated by dividing its weight by this volume [12]. Furthermore,
this technique does not provide data on density differentials.
Computed Tomography (CT) has been used by other researchers
[13–15] primarily for visual analysis, without fully employing its
ability to quantify density or density differentials.
Here we examine the wood density of five classical Cremonese
violins; three by Giuseppe Guarneri del Gesu and two by Antonio
Stradivari, using quantitative CT densitometry, a rapid and non-
invasive technique usually applied in a medical setting [16]. The
PLoS ONE | www.plosone.org 1 July 2008 | Volume 3 | Issue 7 | e2554
results from these classical violins were compared to those of eight
contemporary violins, made by T. Borman, A.T. King and G.
Rabut (Table 1), in order to determine whether objective
measurements of material properties can explain the historical
consensus on the differences in quality of sound between classical
Cremonese and modern violins. At the end of this article we will
outline in detail our methodology.
Results and Discussion
The violins were scanned at Mount Sinai Hospital in New York
City, USA, using a multi-detector row CT scanner (Sensation
Cardiac 64, Siemens, Germany). These scans produced 3-
dimensional data sets of approximately 120065126512 voxels
for each violin.
A dedicated computer program was developed to automatically
detect the superior and inferior surface of the top and back plates.
From these surfaces, the local plate thickness, median wood
density and density differential were calculated, as discussed
below. Additionally, the volume of the sound box (luminal volume)
was calculated (Table 1).
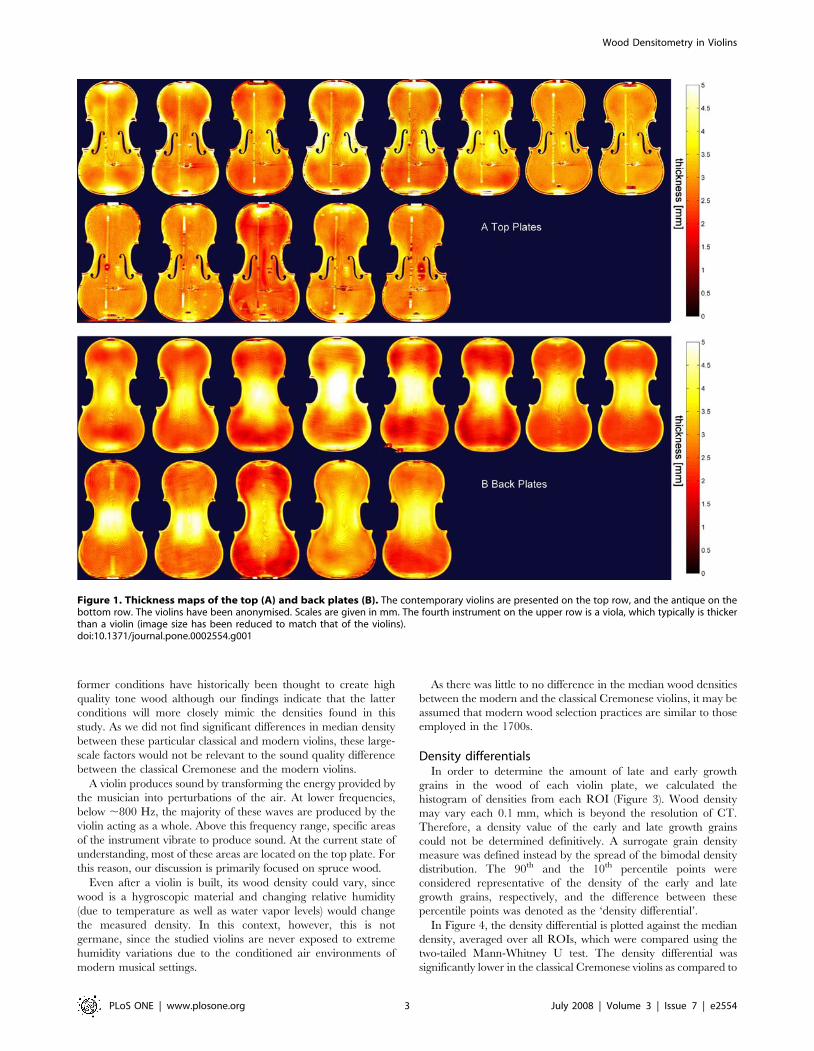
Plate thicknessFrom the vertical distance between the superior and inferior
surface, a thickness map (0–5 mm) was constructed, which
represents the plate thickness at each location. Figures 1A and
1B show the thickness maps of the top and back plates,
respectively, with the classical violins displayed on the bottom
and the modern violins on the top row of the figures. We have
adopted the medical model of anonymity. These thickness maps
clearly show differences between the violins as well as various
repairs. The bass bar could be discerned as a slight thickening in
the top plate, since the computer program could not perfectly
separate the two wood pieces. The antique plates, with the
exception of #3, had very little repair, while resolution was such
that even the paper labels with the makers’ name could be
discriminated (see the rectangular thickening in the back plates,
near the left c-bout in Figure 1B). Note that the high X-ray
absorption by the metal in the fine tuner on the e-string causes
image reconstruction artifacts. The Moire-like pattern is caused by
the somewhat limited resolution of the scanner. Loen [17] has
done extensive thickness mapping of violins although a compar-
ative analysis of findings is beyond the purview of this article and
our maps are included solely on the basis of the intrinsic link
between density and thickness.
Median densityThe computer program defined an intermediate layer of the
violin plates, which was centered exactly between the superior and
inferior surfaces. From this intermediate layer, a density map was
created, in which the physical density was calculated at each
location within the plates. Figures 2A and 2B show the detailed
density maps of the top and back plates, respectively. The top and
back plates differ in density, as top plates are made from spruce
(Picea abies) and the rest of the instrument, including the back plate,
is made from maple (Acer Platanoides). Repair work was clearly
visible in the top plates, as indicated by the regions of increased
density. Hide glue, used exclusively for violin repair, has a higher
density than wood and saturates into the adjacent, undamaged
material, thus increasing localized density readings. From this
density map, the median density was calculated at five standard-
ized regions of interest (ROI); on the left and right side of the
upper and lower bout, and one at the centre (see Figure 3); care
was taken to avoid regions of repair work. No significant
differences were found between the median densities of the
modern and the antique violins (two-tailed Mann-Whitney U test:
p = 0.884 and 0.143, for the top and back plate, respectively).
Apart from genetic factors, the overall density of wood is
influenced most significantly by the microclimate at the tree’s
location. A tree growing in a cool area with limited direct solar
exposure and little access to water supplies or quality soil will grow
slowly and have relatively high overall densities. On the other
hand, a tree of the same genetic makeup would grow faster with
lower overall densities, if it were located in a more hospitable
microclimate, i.e. with adequate solar access, a nutrient laden soil,
sufficient quantities of water, a relatively flat local, and without
traumatic events causing formation of very dense wood. The
Table 1. Table of instruments studied.
Classical violins
Maker Date Location Instrument name Luminal volume (Liter)
Giuseppe Guarneri del Gesu 1734 Cremona, Italy ‘‘ex Rode’’ 1.87
Giuseppe Guarneri del Gesu 1735 Cremona, Italy ‘‘ex Kubelik’’ 1.78
Giuseppe Guarneri del Gesu 1735 Cremona, Italy ‘‘ex Plowden’’ 1.83
Antonio Stradivari 1715 Cremona, Italy ‘‘ex Titian’’ 1.87
Antonio Stradivari 1734 Cremona, Italy ‘‘ex Wilmotte’’ 2.04
Modern instruments
Terry M. Borman 1995 Salt Lake City, UT, USA Viola 2.91
Terry M. Borman 2005 Salt Lake City, UT, USA Violin 1.93
Terry M. Borman 2005 Salt Lake City, UT, USA Violin 1.92
Terry M. Borman 2006 Fayetteville, AR, USA Violin 1.81
A. Thomas King 1995 Potomac, MD, USA Violin 2.04
A. Thomas King 2006 Potomac, MD, USA Violin 2.03
Guy Rabut 2003 New York, NY, USA Violin 1.96
Guy Rabut 2003 New York, NY, USA Violin 1.98
doi:10.1371/journal.pone.0002554.t001
Wood Densitometry in Violins
PLoS ONE | www.plosone.org 2 July 2008 | Volume 3 | Issue 7 | e2554
former conditions have historically been thought to create high
quality tone wood although our findings indicate that the latter
conditions will more closely mimic the densities found in this
study. As we did not find significant differences in median density
between these particular classical and modern violins, these large-
scale factors would not be relevant to the sound quality difference
between the classical Cremonese and the modern violins.
A violin produces sound by transforming the energy provided by
the musician into perturbations of the air. At lower frequencies,
below ,800 Hz, the majority of these waves are produced by the
violin acting as a whole. Above this frequency range, specific areas
of the instrument vibrate to produce sound. At the current state of
understanding, most of these areas are located on the top plate. For
this reason, our discussion is primarily focused on spruce wood.
Even after a violin is built, its wood density could vary, since
wood is a hygroscopic material and changing relative humidity
(due to temperature as well as water vapor levels) would change
the measured density. In this context, however, this is not
germane, since the studied violins are never exposed to extreme
humidity variations due to the conditioned air environments of
modern musical settings.
As there was little to no difference in the median wood densities
between the modern and the classical Cremonese violins, it may be
assumed that modern wood selection practices are similar to those
employed in the 1700s.
Density differentialsIn order to determine the amount of late and early growth
grains in the wood of each violin plate, we calculated the
histogram of densities from each ROI (Figure 3). Wood density
may vary each 0.1 mm, which is beyond the resolution of CT.
Therefore, a density value of the early and late growth grains
could not be determined definitively. A surrogate grain density
measure was defined instead by the spread of the bimodal density
distribution. The 90th and the 10th percentile points were
considered representative of the density of the early and late
growth grains, respectively, and the difference between these
percentile points was denoted as the ‘density differential’.
In Figure 4, the density differential is plotted against the median
density, averaged over all ROIs, which were compared using the
two-tailed Mann-Whitney U test. The density differential was
significantly lower in the classical Cremonese violins as compared to
Figure 1. Thickness maps of the top (A) and back plates (B). The contemporary violins are presented on the top row, and the antique on thebottom row. The violins have been anonymised. Scales are given in mm. The fourth instrument on the upper row is a viola, which typically is thickerthan a violin (image size has been reduced to match that of the violins).doi:10.1371/journal.pone.0002554.g001
Wood Densitometry in Violins
PLoS ONE | www.plosone.org 3 July 2008 | Volume 3 | Issue 7 | e2554
the modern violins both in the top and back plate (p = 0.028 and
0.008, respectively), meaning that the densities of early and late
growth wood were closer together, in the classical violins. The mean
density differential (SE) of the top plates of the modern and classical
violins were 274 (26.6) and 183 (11.7) gram/liter, respectively. For
the back plates, the values were 128 (2.6) and 115 (2.0) gram/liter,
respectively. Figure 4 shows four clear ‘‘clusters’’ whereby the wood
of the instruments is delineated into two groups: the old and new top
plates and the old and new back plates.
Due to the increased repair work on one of the classical
instruments, it was necessary to choose the ROI’s carefully so as to
reflect the true wood density, not that of the repair. In order to
realistically compare wood densities, the inclusion criteria for a
modern instrument was that the woods were of known European
provenance and that they were in a ‘‘natural state’’, i.e. not treated
in any way to alter its material properties. When we noticed the
one modern top and back plate of extremely low differential, we
contacted the maker who reviewed his records and found that he
had acquired these pieces of wood from a supplier who
occasionally treated his wood prior to sale. When questioned,
the supplier could not be certain if these particular pieces were
treated or not. If these plates of unknown origin were removed
from the analysis, the differences of the density differential of the
top plates between the old and new would be even more striking.
In our test pool of spruce tone wood samples we found a similar
pattern i.e. new wood having median densities in the same general
range and density differentials much higher than that of the
Cremonese violins tested.
Spruce density may vary within a tree by as much at 5–8% due to
its vertical location within the trunk. Within same tree specimens
density is typically lowest between 3 and 6 meters of height. Below
3 meters to ground level there is a slight increase and above
6 meters of tree height density increases in a fairly linear continuum
to the apical bud [18]. Since the classical median densities are at the
very low end of those found in spruce, this region would provide the
closest approximation within individual samples. Additionally, the
distance from the pith (centre of the tree) to the perimeter is a well-
identified source of density variations within the same tree
specimens and in most species, including Picea abies, density typically
decreases with distance outwards from the pith. This decrease in
density has been found to be due to a reduction in early wood
density as well as a reduction in late wood proportion and may
amount to 15–20% density variations from pith to perimeter [19].
Taken together the north/south (sample height) and east/west (pith
Figure 2. Density maps of the top (A) and back plates (B). The contemporary violins are presented on the top row, and the classicalCremonese on the bottom row. The violins have been anonymised. Scales are given in kg/m3. The central violin in the lower row has had more repairwork than the other antique violins as evinced by reduced thickness (Figure 1.) and increased densities. The dark areas at the centre of the lower thirdof all violin tops are metal artifacts from the string ends. The dependency of the measured density on plate thickness was eliminated in thequantitative analysis.doi:10.1371/journal.pone.0002554.g002
Wood Densitometry in Violins
PLoS ONE | www.plosone.org 4 July 2008 | Volume 3 | Issue 7 | e2554
to perimeter) localized impacts can amount to an almost 25%
density variation within the same tree.
Widths of the individual growth rings are yet another factor
influencing wood density that has been well documented to date,
although disagreement exists on the quality of this relationship.
Growth Ring Width (GRW) in Norway spruce has been shown to
have a negative correlation with average density [20] and
therefore a non-linear relationship with greater reductions in
basic density when the ring widths decrease to 2–3 mm and lesser
overall reductions with increasingly wider ring widths. Giordano
[21] on the other hand, found a relatively linear relationship for
these same parameters. Another study, specifically targeted at
violin tone wood [22], did not find a linear relationship and their
experimental data pool of 300 samples showed no apparent
pattern in density distributions vs. GRW. Their sample ring
spacing was however relatively limited, varying only from 0.5 mm
to 2 mm, whereas Giordano extended this range to 4 mm (the
maximum ring spacing usually found in violins is 2.5 mm to
3 mm; in violas 3 mm to possibly 4 mm and in cellos this can
reach 5 mm). Saranpaa and Giordano concur that GRW can
account for min/max density variability of ,40%, although
arriving at their respective results in different manners [18,21].
The current state of wood biology delves very little into density
differential with the exception of Koubaa [19] using x-ray
densitometry to redefine Mork’s index (the transition from early
wood to late wood).
ConclusionsThe density differentials found in this study may contribute to
the generally recognized superior sound production of classical
Cremonese violins. Within the violin making tradition there have
been many reported ‘secrets’ of the Cremonese makers although
usually with little or no supporting documentation. Sporadically,
reference is made to the wood treatment referred to as ‘ponding’,
whereby wood submerged in stream water (to facilitate transpor-
tation or to alter the properties of the wood intentionally) is
responsible for the classical Cremonese sound. It has been
documented [23] that ponding does alter wood properties
significantly, by causing decomposition of various wood elements
depending on the particular bacteria or fungus introduced into the
wood. Although data on density alteration are not currently
available, it is reasonable to assume that this degradation would
result in lowered densities; how this impacts density differential
would be dependant on the specific treatment. It has been shown
that the wood of the classical Cremonese instruments was likely
not ponded [24]. However, this does not rule out bacterial or
fungal attack as a means of altering new wood to more closely
match the material properties of the Cremonese wood. As
mentioned earlier, one back and one top plate of the new
instruments may have been treated and if this were indeed the
case, the treatment used by the supplier would have been ponding.
Another technique, referred to as ‘‘stewing’’ wood has been
mentioned whereby wood is boiled in different solutions to achieve
alterations of density although there is no published data on what
this process is actually doing to the wood. Bucur has shown that
time plays a role in altering wood properties by decomposition and
loss of hemicellulose, thereby resulting in lower density [9] and a
priori an alteration of differential, which may also explain our
results. Fuming with nitric acid or ammonia are treatments that
have been used throughout the years by instrument makers and it
is a reasonable assumption that the destructive properties of these
agents would lower the density and change the differential
depending on which grains, early or late, are most affected. Many
other possibilities have been proposed over time, but these are the
only ones directly related to density that we are aware of.
In summary, our results clearly document basic material property
differences between the woods used by the classical Cremonese and
contemporary makers. Although at this point we can do no more
than speculate as to the cause, these findings may facilitate
replicating the tonal qualities of these ancient instruments.
Materials and Methods
As CT densitometry depends on a wide range of variables,
settings were optimized for the highest sensitivity in distinguishing
different wood densities. We analyzed the histograms from four test
plates (two top plates and two back plates) and selected the settings,
which produced bimodal histograms with the highest separation.
The final image acquisition protocol was defined for a multi-
detector row CT scanner: 80 kVp, effective mAs of 53, collimation
3260.6 mm, 1 sec. rotation time, 5126512 matrix, 0.6 mm slice
thickness, 0.3 mm increment with a reconstruction filter B50s.
Volumetric analysis was performed with PulmoCMS (Medis
Specials BV, Leiden, the Netherlands) and a separate computer
program was developed for wood densitometry on a Matlab
Figure 3. Regions of interest (ROI’s) on violin plates. Fivedifferent ROI’s of 1006100 pixels were defined, carefully avoiding repairwork. The same areas were taken from the top and back plates.doi:10.1371/journal.pone.0002554.g003
Wood Densitometry in Violins
PLoS ONE | www.plosone.org 5 July 2008 | Volume 3 | Issue 7 | e2554
platform (Matlab, version R2007a, The Mathworks, USA), with its
image processing toolbox. The superior and inferior contours were
detected in each axial slice by a minimal costs algorithm, using a
Sobel edge detector. By stacking all contours, a curved multi-
planar reformatted (MPR) image was constructed. No user
interaction was needed in the analyses of the violins.
ValidationConstancy of the CT scanner was monitored using nine test
pieces of maple and spruce. The standard deviation of the
differences was 7.5 kg/m3 (1.8%) and 10.9 kg/m3 (4.8%) for the
median density and density differential, respectively.
Due to edge enhancement during CT image reconstruction,
density values were found to be dependent on plate thickness (as
illustrated by comparing Figure 1 and 2 in the main text).
Therefore, the presented density values were corrected for
thickness, based on measurements from a different sample set of
10 wood samples with thicknesses, ranging from 2 to 6 mm. The
measurements were corrected based on a mathematical model, in
which the dependency of the median density on plate thickness
Figure 4. Density differential versus median density of all top and back plates.doi:10.1371/journal.pone.0002554.g004
Figure 5. Relation between thickness of the plate and median density. (A) The relation was obtained from the central layer within fivespruce and five maple test plates. The curved lines show the mathematical models fitted to this data. (B) The thickness-density relation from theindividual ROIs in the violins. (C) The thickness-density relation after correction.doi:10.1371/journal.pone.0002554.g005
Wood Densitometry in Violins
PLoS ONE | www.plosone.org 6 July 2008 | Volume 3 | Issue 7 | e2554
was estimated (see Figure 5A). The correction was effective, since
subsequently no correlation was found between the final density
values and the thickness of the plates from all regions of interest
(Figure 5B and 5C). As there was no significant difference in plate
thickness between the classical and modern violins (Mann-
Whitney U test: p = 0.770 an 0.188, for the top and back plate,
respectively), plate thickness was not a confounding factor in
studying the differences in wood density.
To test the accuracy of the thickness measurements of the plates,
the same wood samples were used as in the correction for the
thickness dependency. The measured values from CT were
compared to the actual thickness measurements using a micro-
meter on the actual pieces. A small systematic difference was
observed of 0.1 mm, which is a fraction of the dimension of one
pixel (0.460.660.6 mm), meaning that plate thicknesses were
slightly over-estimated with a constant magnitude, independent of
plate thickness.
Acknowledgments
We thank the owners of the classical and modern violins for making their
instruments available for this study, Mount Sinai Hospital in New York
City, Maynard High Ph.D and Jeffrey Doy for their radiological support,
Aracelis Perez, CT technician at Mount Sinai Hospital, for her patience
and dedication, Jeff Loen and Nora Cooper for their editorial assistance,
and Prof. J.H.C. Reiber, Prof I. Watt, Evan Davis Ph.D and Prof Jim
Woodhouse for their critical discussions and reviewing of the manuscript.
Author Contributions
Conceived and designed the experiments: BS TB. Performed the
experiments: BS TB. Analyzed the data: BS TB. Contributed reagents/
materials/analysis tools: BS TB. Wrote the paper: BS TB.
References
1. Sacconi SF (1979) The ‘‘Secrets’’ of Stradivari. Cremona, Italy: Libreria DelConvegno.
2. Loen JS, Borman T, King AT (2005) A path through the woods; thickness and
density of Guarneri del Gesu’s violins. The Strad 116: 68–75.3. Schelling JC (2007) On the physical effects of violin varnish, III Estimation of
acoustical effects. CAS Journal 8: 17–24.4. Schleske M (1998) On the acoustical properties of violin varnish. CAS Journal 3:
27–43.
5. Wegst UGK (2006) Wood for Sound. American Journal of Botany 93:1439–1448.
6. McIntyre ME, Woodhouse J (1988) On measuring the elastic and dampingconstants of orthotropic sheet materials. Acta Metallurgica 36: 1397–1416.
7. Haines D (1979) On Musical Instrument Wood Part l. CAS Newletter 31:23–32.
8. Haines D (1980) On Musical Instrument Wood Part II. Surface finishes,
plywood, light and water exposure. CAS Newletter 33: 19–23.9. Bucur V (2006) Acoustics of Wood. CRC Press.
10. Butterfield BG (2003) Wood anatomy in relation to wood quality. In: Barnett JR,Jeronimidis G, eds (2003) Wood quality and its biological basis. Oxford, UK:
Blackwell. pp 30–52.
11. Zink-Sharp A (2003) Mechanical Properties of Wood. In: Barnett JR,Jeronimidis G, eds (2003) Wood Quality and Its Biological Basis. Oxfordshire,
UK: Blackwell Publishing. pp 197–209.12. Schleske M (2002) Empirical Tools in Contemporary Violin Making: Part II.
Psychoacoustic Analysis and Use of Acoustical Tools. CAS Journal 4: 50–64.13. Gattoni F, Melgara C, Sicola C, Uslenghi CM (1999) [Unusual application of
computerized tomography: the study of musical instruments]. Radiol Med
(Torino) 97: 170–173.
14. Sirr SA, Waddle JR (1997) CT analysis of bowed stringed instruments.
Radiology 203: 801–805.
15. Skolnick AA (1997) CT scans probe secrets of Italian masters’ violins. JAMA
278: 2128–2130.
16. Stoel BC, Stolk J (2004) Optimization and Standardization of Lung
Densitometry in the Assessment of Pulmonary Emphysema. Invest Radiol 39: