A comparison of zooplankton communities in saline lakewater withvariable anion composition
A.M. Derry1,2, E.E. Prepas3 & P.D.N. Hebert41Department of Biological Sciences, University of Alberta, Edmonton, Alberta, T6G 2E9, Canada2Present address: Department of Biology, Queens University, Kingston, Ontario, K7L 3N6, CanadaE-mail for correspondence: [email protected] of Forestry and Forest Environments, Lakehead University, Thunder Bay, Ontario, P7B 5E1, Canada4Department of Zoology, University of Guelph, Guelph, Ontario, N1G 2W1, Canada
Although salinity and aquatic biodiversity are inversely related in lake water, the relationship between typesof salts and zooplankton communities is poorly understood. In this study, zooplankton species were related toenvironmental variables from 12 lakes: three saline lakes with water where the dominant anions were SO4 andCO3, four saline lakes with Cl-dominated water, and five dilute, subsaline (0.5–3 gl−1 total dissolved solids) lakesof variable anion composition. Although this study comprised only 12 lakes, distinct differences in zooplanktoncommunities were observed among the two groups of chemically defined saline lakes. Canonical correspondenceanalysis identified total alkalinity, sulphate, chloride, calcium, sodium, potassium, and total phosphorus as allcontributing to the first two ordination axes (λ1 = 0.97 and λ2 = 0.62, P < 0.05). The rotifer Brachionus plicatilisand the harpactacoid copepod Cletocamptus sp. prevailed lakes with Cl-dominated water. In contrast, the calanoidcopepods Leptodiaptomus sicilis and Diaptomus nevadensis were dominant in the SO4/CO3-dominated lake waterwith elevated potassium (79–128 mg l−1) and total phosphorus concentrations (1322-2915 µg l−1). The contrastingzooplankton species distribution among these two saline lake types is likely explained by variable selective pressureon zooplankton and their predators from differing physiological tolerances to salt stress and specific ions. Whileinland saline lakes with Cl as the dominant anion are relatively rare in Canada and SO4/CO3 are the commonfeatures, our study provided an opportunity to compare zooplankton communities across the two groups of lakes.
Introduction
Saline lakes comprise a small proportion of the totalvolume of inland water in Canada, but are of scientificinterest because they are systems with naturally lowbiodiversity (Hammer, 1986). Brine composition canbe variable among saline lake water and is relatedto geologic setting and lake position in the drain-age basin relative to local and regional groundwaterflow (Last, 1992). Most Canadian lakes that containwater with elevated salinities are located in the prair-ies and aspen parklands of the western provinces ofSaskatchewan and Alberta, and in the dry interior of
the Province of British Columbia. Sulphate or bicar-bonate/carbonate are usually the lead anions and thepredominant cations can vary in these inland waters(Last, 1992). With the exception of similarities sharedwith Siberian saline systems, sulphate-rich saline wa-ters in North American are considered to have rarewater chemistry globally. In contrast, sodium chlorideis the most common form of salt in saline lakes glob-ally and is most frequently encountered in Australiaand South Africa (Hammer, 1986). North Americanlakes containing water with high concentrations ofsodium chloride tend to be found in arid regions ofthe western United States (Blinn, 1993). There are
200
isolated examples of sodium chloride-dominated lakewater in Canada (Hammer, 1993), and several of theseare located on the predominantly freshwater borealplain (Camsell, 1917).
The diversity of aquatic species decline as osmotictolerances are exceeded with increasing salinity (e.g.,Hammer, 1993). In addition to salt concentration,other factors such as habitat permanence, predation,and ion composition can alter the structure of aquaticcommunities in saline lakes (Williams, 1998; Herbst,2001). However, the role of salt ion compositionrelative to salt concentration in determining zooplank-ton communities is not understood (e.g., Hammer,1986; Bos et al., 1996; Williams, 1998). Past studieshave indicated distinct anion preferences within theostracod genus Limnocythere among carbonate, sulph-ate, and chloride-dominated waters (Forester, 1986).Bos et al. (1996) identified calcium and magnesiumas key determinant cations for the relative abundanceof Artemia franciscana, Moina hutchinsoni, Daphniapulex, Ceriodaphnia laticaudata, Simocephalus spp.,and calanoid copepods among carbonate/bicarbonateand sulphate-dominated waters in the interior of Brit-ish Columbia. Little work has addressed contrasts inzooplankton community composition among chloride-and sulphate-dominated saline lakes. Our study soughtto test the hypothesis that differences in zooplanktoncommunities among chloride- and sulphate-dominatedsaline lake water were largely a result of contrastingion dominance rather than overall salinity. We clas-sified the study lakes according to salinity categoriesdescribed by Hammer (1986): subsaline (0.5–3 g l−1
total dissolved solids (TDS), hyposaline (3–20 g l−1
TDS), mesosaline (20–50 g l−1 TDS), and hypersaline(>50 g l−1 TDS). Much of the emphasis was placedon subsaline and saline (>3 g l−1 TDS) lakes con-taining water dominated by sodium chloride as theselakes have received little scientific attention in Canada.Differences in ion composition of lake water were re-lated to the relative abundance of both crustaceans androtifers to understand biogeographic patterns of salinehabitat utilization in zooplankton.
Materials and methods
Description of study lakes
Our study was conducted primarily on four salinelakes with water dominated by chloride anions, twosaline lakes with sulphate-dominated waters, one sa-
line lake with carbonate anion dominance, and sixsubsaline lakes with varying anion chemistry (chlor-ide or sulphate dominance) (Fig. 1). Data collectedon the lakes with sulphate-dominated water were aug-mented with information from Bierhuizen & Prepas(1985), Campbell & Prepas (1986), and Evans & Pre-pas (1996). At the end of abbreviations for the studylakes, -SO4 identifies the sulphate-dominated salinelakes, –CO3 refers to the carbonate-dominated lake,–Cl indicates the chloride-dominated saline lakes, and– D represents the more dilute subsaline lakes.
The study lakes are found in a 800 km band stretch-ing from the northern tip of the Province of Alberta tosoutheast of the city of Edmonton. Eight of the studylakes (Grosbeak Lake (GB-Cl), HC-Cl, Salt Pan Lake(SP-Cl), GL-D, GW-D, BP-D, FP-D, and WR-D) arefound on the boreal plain in Wood Buffalo NationalPark (Park) where boreal mixed-wood forest is inter-dispersed with wetlands, prairies, and salt flats (Moseret al., 1998). Also on the boreal plain is Saline Lake(SL-Cl), which is located 330 km south of the Parksites near the city of Fort McMurray. In contrast, thethree saline study lakes in central Alberta (Olivia Lake(OL-CO3), Peninsula Lake (PN-SO4), and FluevogLake (FL-SO4)) are located 150 km southeast of thecity of Edmonton in aspen prairie-parkland, and aresurrounded by farmland (Campbell & Prepas, 1986).
The bedrock geology of the Park study lakes (pre-dominantly chloride-dominated waters) is character-ized by Middle Devonian limestone (CaCO3), gypsum(CaSO4·2H2O), and dolostone (CaMg(CO3)2) shale,covered with a thin layer of glacial, glacial-lacustrine,lacustrine and aeolian deposits (Moser et al., 1998).Surface waters are influenced to varying degrees bydeep, groundwater springs that discharge sodiumchloride salt (Camsell, 1917) from along the dissol-ution edge of the Cold Lake Formation of marineevaporitic halite (NaCl) (Mejer Drees, 1986). SL-Cl is located near the boundary where limestone,gypsum and dolomite deposits meet Lower Creta-ceous sandstone and minor shale (Government & Uni-versity of Alberta, 1969). The discharge of sodiumchloride springs into SL-Cl is periodically dilutedwhen the nearby (0.2 km) Athabasca River floods (M.MacKinnon, Syncrude Canada Ltd., pers. comm.).In contrast, the sulphate/carbonate-dominated watersof the study lakes in central Alberta have a bedrockgeology comprised of Upper Cretaceous deposits ofsandstone, shale, coal and bentonite (Government &University of Alberta, 1969). Dominant SO4-basedminerals in the prairies and aspen parklands include
201
Fig
ure
1.T
helo
catio
nof
stud
yla
kes
inW
ood
Buf
falo
Nat
iona
lPa
rkan
dA
lber
ta,
Can
ada
inre
latio
nto
the
dist
ribu
tion
ofth
edi
ffer
ence
betw
een
prec
ipita
tion
and
open
wat
erev
apor
atio
nin
Nor
thA
mer
ica.
202
gypsum, mirabilite (Na2SO4·10H20) and thenardite(Na2SO4), and common CO3
2−-based minerals arearagonite (CaCO3), calcite (CaCO3), and dolomite(CaMg(CO3)2. Feldspars containing K+ are alsoabundant.
All of the study lakes are found in regions in whichlake evaporation exceeds precipitation (Fig. 1). Thedifference between precipitation and open water evap-oration ranges from negative 15 cm for the nine lakesin northern Alberta to negative 35 cm for the threelakes located in central Alberta (Winter, 1989). Withthe exception of GB-Cl and SP-Cl that have surfaceoutflows but not inflows, all of the saline and subsalinestudy lakes in the Park have inflowing and outflowingstreams. In contrast, the lakes with SO4
2−/CO3−-
dominated water in central Alberta do not have anypermanent hydrographic connections.
Field collection and laboratory analysis
During the summer of 1999, the Park lakes weresampled monthly from June to September and SL-Cl was sampled once in June and August. The threestudy lakes in central Alberta (OL-CO3, PN-SO4, FL-SO4) were sampled once in June 1999. All samplingwas conducted at the point of maximum lake depth.Lake surface area was determined from 1:50 000 topo-graphic maps with a Bioquant HPI digitizer with Sys-tem IV image analysis software. BP-D was too smallto be found on a map, and since this pond was ap-proximately circular, surface area was estimated basedon measurements of length and width. Water transpar-ency was estimated with a Secchi disk. Temperatureand conductivity of surface lake water were measuredin the field with a YSI 30 conductivity meter and pHwas measured with a hand-held Fisher pH/temperaturemeter 119 Model 3D. In September, vertical profilesof temperature and conductivity were measured at thedeepest location in saline and subsaline lakes in thePark.
Water samples were collected from a depth of0.5 m below the lake surface in acid-washed andpre-rinsed polyethylene bottles, and then refridgeratedfrom 1 to 10 d before being shipped on ice for filtra-tion and analysis by the limnology laboratory at theUniversity of Alberta. Samples for nitrite and nitrateanalyses were collected in July from lakes in the Park,and in August from SL-Cl; samples were frozen < 2h of collection and analyzed within 5 d. For chloro-phyll a (chl a) analysis, water was filtered throughGelman GF/C (0.7 µm pore) filters, and the filters
were wrapped in foil and frozen on desiccant beadsin light resistant containers until analysis.
Water samples were analyzed for total dissolvedsolids (TDS), total phosphorus (TP), total nitrogen(TN), nitrite (NO2
−) and nitrate (NO3−), major
cations (Na2+, Ca2+, K+, Mg2+, Mn3+, and Fe2+),major anions (Cl− and SO4
2−), alkalinity, dissolvedorganic carbon (DOC), turbidity and colour. TDSwas determined according to Stainton et al. (1977).TP was measured with the potassium persulfate di-gestion procedures of Menzel & Corwin (1965), asmodified by Prepas & Rigler (1982). TN, NO2
−, andNO3
− were analyzed with a Technicon autoanalyzer(Stainton et al., 1977), with modifications based onU.S. EPA Method 353.2. As a result of logisticalconstraints, NO2
−, and NO3− were not measured
for lakes with SO42−/CO3
−-dominated water in cent-ral Alberta (OL-CO3, PN-SO4, FL-SO4). Cationswere measured with a Perkin Elmer 3300 AtomicAbsorption Spectrometer (Stainton et al., 1977) andanion concentrations were determined with a Dionex2000i/SP Ion Chromatograph (Pfaff, 1993). Alkalinitywas analyzed with a Mettler DL21 Titrator (Greenberget al., 1992). Turbidity was measured with a Hach Tur-bidimeter Model 2100A and colour was measured at440 nm with a Milton Roy 1001 spectrometer (Cuth-bert & del Giorgio, 1992). Chl a was measured byOstrofsky’s ethanol extraction technique (Bergmann& Peters, 1980).
Zooplankton were sampled with a conical 20-cmdiameter, 50-cm long, 64-µm mesh size Nitex townet from near the bottom to the surface of each lakeduring daylight. While three vertical tows per samplewere taken in lakes with maximum depths ≥ 1 m, ho-rizontal drift tows were taken in lakes with maximumdepths < 1 m and distances were estimated based onshoreline measurements. Zooplankton were preservedin a chilled 4% buffered formalin-sucrose solution.Taxonomic identifications and counting were conduc-ted on 5–10 ml subsamples with a counting wheelon a dissecting microscope at 50× and 100× mag-nifications. Zooplankton were identified according tothe following taxonomic keys: rotifers (Edmondson,1959; Chengalath et al., 1971; Stemberger, 1979),adult copepods (Smith & Fernando, 1978), and clado-cerans (Brooks, 1957; Edmondson, 1959; Devey &Devey, 1971; Brandlova et al., 1972). Densities ofzooplankton were expressed in number of individu-als/l based on an assumed net filtration efficiencyof 100%. Nauplii and other unidentifiable juveniles(mostly copepods) were excluded from statistical ana-
203
lyses. Nelson & Paetz (1992) was employed to identifyfish that were caught with minnow traps and thenreleased.
Statistical analysis
Multivariate analyses were performed with CANOCO4.0 (ter Braak & Smilauer, 1998) to investigatespecies-environment relations among the study lakes.Comparisons were drawn to determine key determin-ants of zooplankton community structure among thesubsaline study lakes (n = 18), among the Cl−-dominated saline lakes (n = 13) with different saltconcentrations, and among all of the saline study lakesdominated by Cl− or SO4
2− (n = 25 samples collec-ted in 1984 and 1999). Relationships among speciesabundance and environmental variables (n = 35)among the 1999 samples were evaluated with Spear-man Rank Correlations in Sigmastat 2.0 for Windows(SPSS Inc. 1997) to collapse the data set to meetsample size restrictions imposed by multivariate ana-lyses. Detrended correspondence analysis (DCA) wasemployed to determine whether unimodal (canonicalcorrespondence analysis) or linear (redundancy ana-lysis) models of species response to environmentalvariables best fit the data. Canonical correspondenceanalysis (CCA) and redundancy analysis (RDA) areordination techniques that are employed to infer howenvironmental variables collectively influence com-munity composition, in which the ordination axesare constained to be a linear combination of environ-mental variables. Where CCA was applied to the data,we employed downweighting of rare species.
The minimum number of measured environmentalvariables that could account for the major directionsof variance in the species data was determined byforward-selected CCA or RDA with 999 iterations inMonte Carlo permutation tests at P < 0.05. Envir-onmental variables that were identified as significantby forward selection but that were strongly correl-ated with other variables in the minimum set (P <
0.001), such that variance inflation factors >20, wereexcluded to avoid collinearity. Time of sampling inJulian days was a covariate for time-series restrictedpermutations in all multivariate analyses.
Subtle differences in species distribution amongthe 13–170 times more dilute subsaline lakes couldnot be resolved by the ordination axes when sub-saline lakes were analyzed with saline lakes, and thusthey were analyzed separately. Crustaceans and roti-fers were analyzed together in ordinations of saline
lakes. These taxa were were analyzed separately inordinations for subsaline lakes because the number ofsubsaline crustacean and rotifer species combined ina CCA would have exceeded the difference betweennumber of samples and number of environmentalvariables (ter Braak & Smilauer, 1998).
Results
Water chemistry
All of the lakes had small surface areas (≤150 ha)and were shallow (<3.4 m mean depth) (Table 1).With the exception of hypersaline OL-CO3 (∼100 gl−1 TDS), the study lakes ranged from subsaline (0.5–1 g l−1 TDS) to hyposaline (7–14 g l−1 TDS) tomesosaline (37–40 g l−1 TDS) (Table 2). Over thesummer, lakewater salinity fluctuated at all sites. Thegreatest salinity variation occurred in FP-D, which washyposaline in mid-June (4900 µS/cm) but became sub-saline by the end of the month (789 µS/cm) after amajor storm (86 mm precipitation over 2 d, Wood Buf-falo National Park 1999 data from Benchmark Creekweather station). Although FP-D remained subsalinefor most of the summer, the bottom stratum of wateroverlying the sediments was hyposaline by Septem-ber (8100 µS/cm). With the exception of chemicalstratification observed in FP-D and HC-Cl (maximumconductivity of 56 000 µS/cm on the bottom), all otherstudy lakes in northern Alberta remained isothermalthroughout the summer. The three study lakes contain-ing SO4
2−/CO32−-dominated water in central Alberta
were isothermal in June of 1999, but the water columnof OL-CO3 was inversely chemically stratified by mid-summer in other years (Campbell & Prepas, 1986).Water chemistry from 1983 to 1992 (Bierhuizen &Prepas, 1985; Evans & Prepas, 1996) used to augmentour data for the saline study lakes located in centralAlberta are summarized in Table 3.
Ion composition varied among the study lakes(Table 2). With the exception of one subsaline lakewith water dominated by SO4
2− (GL-D), the fourother subsaline lakes in the Park had water dominatedby Cl−. The four saline study lakes in northern Albertawith water dominated by Cl− (4–17 g l−1 Cl−) alsohad relatively high concentrations of SO4
2− (0.3–2 gl−1). In contrast, the three SO4
2−/CO3−-dominated
lakes in central Alberta had comparatively low Cl−concentrations (2–21 times lower than SO4
2− and 12–37 times lower than HCO3
−/CO32− anions). Lakes
204
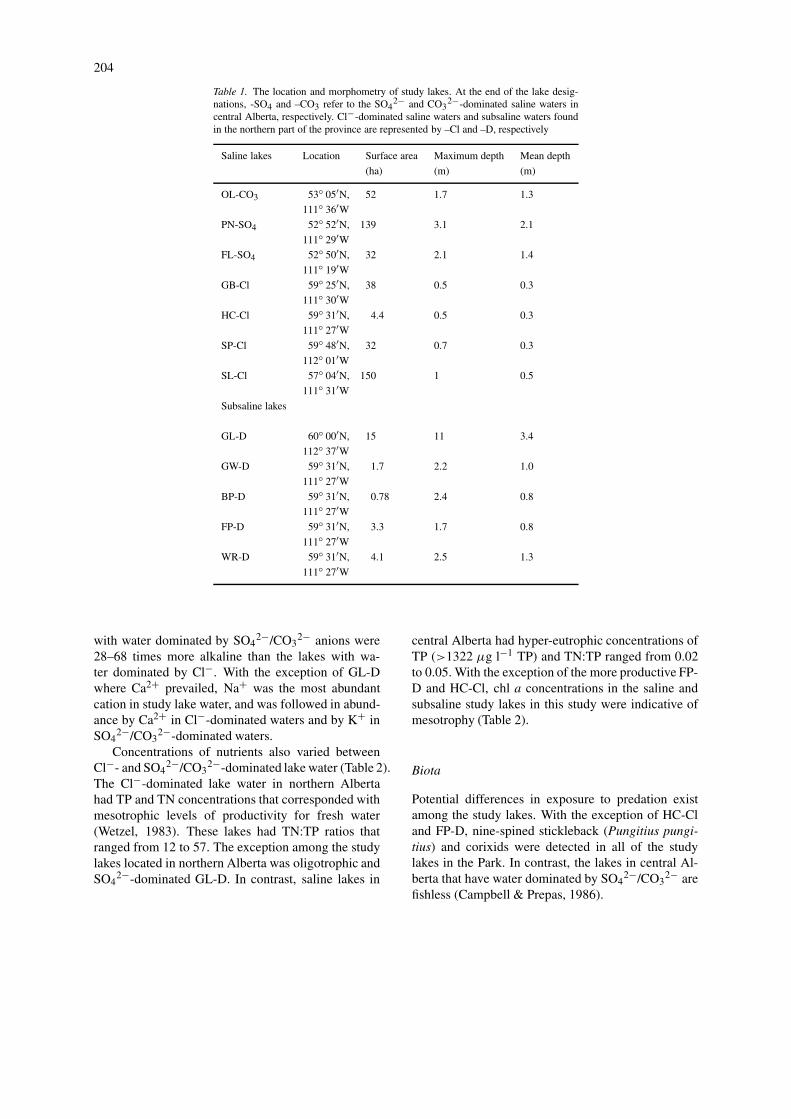
Table 1. The location and morphometry of study lakes. At the end of the lake desig-nations, -SO4 and –CO3 refer to the SO4
2− and CO32−-dominated saline waters in
central Alberta, respectively. Cl−-dominated saline waters and subsaline waters foundin the northern part of the province are represented by –Cl and –D, respectively
Saline lakes Location Surface area Maximum depth Mean depth
(ha) (m) (m)
OL-CO3 53◦ 05′N, 52 1.7 1.3
111◦ 36′WPN-SO4 52◦ 52′N, 139 3.1 2.1
111◦ 29′WFL-SO4 52◦ 50′N, 32 2.1 1.4
111◦ 19′WGB-Cl 59◦ 25′N, 38 0.5 0.3
111◦ 30′WHC-Cl 59◦ 31′N, 4.4 0.5 0.3
111◦ 27′WSP-Cl 59◦ 48′N, 32 0.7 0.3
112◦ 01′WSL-Cl 57◦ 04′N, 150 1 0.5
111◦ 31′WSubsaline lakes
GL-D 60◦ 00′N, 15 11 3.4
112◦ 37′WGW-D 59◦ 31′N, 1.7 2.2 1.0
111◦ 27′WBP-D 59◦ 31′N, 0.78 2.4 0.8
111◦ 27′WFP-D 59◦ 31′N, 3.3 1.7 0.8
111◦ 27′WWR-D 59◦ 31′N, 4.1 2.5 1.3
111◦ 27′W
with water dominated by SO42−/CO3
2− anions were28–68 times more alkaline than the lakes with wa-ter dominated by Cl−. With the exception of GL-Dwhere Ca2+ prevailed, Na+ was the most abundantcation in study lake water, and was followed in abund-ance by Ca2+ in Cl−-dominated waters and by K+ inSO4
2−/CO32−-dominated waters.
Concentrations of nutrients also varied betweenCl−- and SO4
2−/CO32−-dominated lake water (Table 2).
The Cl−-dominated lake water in northern Albertahad TP and TN concentrations that corresponded withmesotrophic levels of productivity for fresh water(Wetzel, 1983). These lakes had TN:TP ratios thatranged from 12 to 57. The exception among the studylakes located in northern Alberta was oligotrophic andSO4
2−-dominated GL-D. In contrast, saline lakes in
central Alberta had hyper-eutrophic concentrations ofTP (>1322 µg l−1 TP) and TN:TP ranged from 0.02to 0.05. With the exception of the more productive FP-D and HC-Cl, chl a concentrations in the saline andsubsaline study lakes in this study were indicative ofmesotrophy (Table 2).
Biota
Potential differences in exposure to predation existamong the study lakes. With the exception of HC-Cland FP-D, nine-spined stickleback (Pungitius pungi-tius) and corixids were detected in all of the studylakes in the Park. In contrast, the lakes in central Al-berta that have water dominated by SO4
2−/CO32− are
fishless (Campbell & Prepas, 1986).
205
Table 2. Average measurements of TDS (mg l−1), conductivity (µS/cm), major nutrient (µg l−1)and ion (mg l−1) concentrations for the study lakes over summer of 1999. pH, DOC (mg l−1),turbidity (NTU), colour (mg l−1 Pt), chl a (µg l−1), and Secchi depth (m) are also presented.SO4
2−-dominated saline waters in central Alberta (-SO4) were measured in only June. N.D.indicates where no data was available and B represents ‘bottom’ for Secchi depths
Figure 2. Ordination biplots of (A) species and environmental variables, and (B) sites and environmental variables from partial RDA of rotiferspecies in the subsaline study lakes. In (A), species ordination positions are represented by numbers: Testudinella patina, 2. Colurella obtusa, 3.Lecane luna, 4. Monostyla quadridentus, 5. Notommata sp., 6. Notholca acuminata, 7. Keratella quadrata and Trichotria tetractis. Lepadellapatella, 9. Lophocharis salpina, 10. Anuraeopsis fissa, 11. Asplanchna brightwelli and Ascomorpha ecaudis, 12. M. closterocerca and M.lunaris, Asplanchna priodonta, Collotheca pelagica, Encentrum sp., K. valga, K. hiemalis, and Trichocerca multicrinis, 14. K. ticinensis andTrichotria pocillum, 15. Brachionus plicatilis, Filinia longiseta, Hexarthra sp., 16. K. testudo and Pompholyx sp., 17. Lepadella acuminata, 18.K. cochlearis, 19. Gastropus stylifer, Trichocerca lophoessa, 20. Vanoyella globosa, 21. T. rattus, 22. Ascomorpha ovalis, 23. Mytilina ventralisvar. brevispina, 24. Platyias platyias, 25. Polyarthra vulgaris, 26. Lecane ohioensis, 27. B. quadridentatus, 28. Synchaeta sp., 29. Polyarthradolichoptera, 30. K. serrulata, 31. Colurella uncinata, T. longiseta, 32. Monostyla bulla. In (B), the symbols represent samples from each ofthe lakes: squares = BP-D, diamonds = FP-D, upward triangles = GW-D, upside-down triangles = GL-D, and stars = WR-D.
Species-environment relations
Subsaline lakes
Environmental gradients between subsaline lakes wereless extreme than between saline lakes, and con-sequently, species-environment relationships were lessclearly defined for rotifers and crustaceans than inthe saline lakes. The minimum set of environmentalvariables that described the greatest variation in ro-tifer species distribution in the subsaline lakes wasdetermined by forward-selected redundancy analysis(RDA), and included Cl−, Mg2+, and pH. Na+ wasalso identified as a significant variable but was posit-ively correlated with Cl− (r = 0.99), and thereforewas not included in the analysis. Axis one (λ1 = 0.25)and axis two (λ2 = 0.11) explained 26% and 12%,respectively, of the variation in species data. Axisone was most strongly influenced by Cl− (inter-setcorrelation = 0.74) and Mg2+ (inter-set correlation =0.51), and axis two was determined primarily by pH(inter-set correlation = 0.84) (Fig. 2).
Rotifer species that ordinated to the right of theorigin (0, 0) along the Cl− and Mg2+ vectors were
strongly correlated with these elements (Table 4 forspecies densities; Fig. 2). Species such as Colurellaobtusa, Monostyla quadridentus, Notommata sp.,Notholca acuminata, Keratella quadrata, Trichotriatetractis and Lepadella patella were strongly asso-ciated with Cl−. Lecane luna was the only speciesthat was closely affiliated with elevated Mg2+ con-centrations, but pH influenced many species. Rotiferssuch as Lecane ohioensis, Brachionus quadridentatus,Synchaeta sp., Mytilina ventralis var. brevispina, Pol-yarthra vulgaris were most strongly correlated withelevated pH, and reached peak densities at a pH of9.2 in BP-D. Although trends were detected for roti-fers, ordination axes did not explain any variation incrustacean species distribution in the subsaline lakes.
Salt lakes with chloride-dominated waterEnvironmental variables that described variation inspecies data among lakes containing water dominatedby Cl− anions were determined by forward-selectedRDA and included: Cl−, Na+, conductivity, and TDS.Since the latter three variables were strongly correl-ated with Cl− (r = 0.94, 0.92, and 0.91, respectively),they were excluded from the analysis. Only axis 1 was
207
Figure 3. Ordination biplots of (A) species and environmental vari-ables, and (B) sites and environmental variables from partial RDAof rotifer and crustacean zooplankton species within the saline lakeswith Cl−-dominated water. In (B), the filled symbols representsamples from the mesosaline lakes and empty symbols represent thehyposaline lakes. In (A), filled symbols indicate species found onlyin the mesosaline lakes, empty symbols are species found only inthe hyposaline lakes, and black-and-white symbols are species thatappeared in both mesosaline and hyposaline study lakes.
significant for the RDA (λ1 = 0.28, 29% of varianceexplained in species data). Cl− was the sole environ-mental influence in the analysis and had an inter-setcorrelation of −0.70 to axis one (Fig. 3).
Species found to the left of the origin were morestrongly correlated with Cl− than species located tothe right of the origin (Tables 4 and 5 for speciesdensities; Fig. 3A). The halophilic rotifer Brachionusplicatilis occurred across the entire range of conduct-ivity measured for saline lake water dominated by Cl−(10–52 mS/cm), but was most abundant in mesosalinewaters. The harpacticoid copepod Cletocamptus sp.was found in some samples of only the mesosalinelakes (HC-Cl and GB-Cl) at amounts ranging fromto 5 to 16 g l−1 Cl−. Daphnia parvula, Keratellacochlearis and Bosmina sp. were present in low densit-ies (25 individuals/ml) on one occasion in mesosalineHC-Cl. In contrast, species found to the right of theorigin were most abundant in the hyposaline NaCllakes (SP-Cl and SL-Cl). Many of these species were
found in SL-Cl, the least saline of the salt lakes(Table 4). The highest density of any one species wasHexarthra sp. (752 individuals/l), which occurred inthe August sample of hyposaline SP-Cl (6 g l−1 Cl−).Mesosaline (10–21 g l−1 Cl−) and hyposaline (3–6 gl−1 Cl−) lake samples are shown in Figure 3B. Al-though contrasts in zooplankton communities did oc-cur at different salt concentrations, the most abundanttaxa were present across the salinity range studied.
Salt lakes with chloride- versussulphate/carbonate-dominated water
The set of environmental variables that described thegreatest variation in the species data from our studywas determined by forward-selected canonical corres-pondence analysis (CCA). This set was comprised oftotal alkalinity (HCO3 +CO3), SO4
2−, Cl−, Ca2+, sur-face area, Na+, K+, conductivity, and TP. Within theset of variables identified by forward selection, strongcorrelations (P > 0.001) that raised variance infla-tion factors >20 occurred between Cl− and Na+ (r =0.97), Cl− and conductivity (r = 0.97), total alkalinityand K+ (r = 0.91), and between total alkalinity andTP (r = 0.93). Consequently, Na+, conductivity, K+and TP were removed from the analysis to minimizethe number of environmental factors tested. CCA withthe minimum set of five variables yielded two signific-ant axes (λ1 = 0.97 and λ2 = 0.62) (Fig. 4). Axis onewas most strongly influenced by total alkalinity (inter-set correlation = 0.99), SO4
2− (inter-set correlation =0.79), and surface area (inter-set correlation = 0.66).This axis explained 35% of the species variance. Axistwo was most strongly defined by Cl− (inter-set cor-relation = 0.79) along with Ca2+ (inter-set correlation= -0.57), and explained 22% of species variance.
Contrasting trends were observed in the waterchemistry of OL-CO3 in 1983/84 and 1999. OL-SO3samples from 1983/84 ordinated beside the SO4
2−vector when included in the CCA, and reflected thehigh concentrations of SO4
2− anions (29 g l−1) thatyear (Table 3). In June 1999, however, CO3
2− wasthe dominant anion and Cl− concentrations were elev-ated (Table 2). OL-CO3 was the only lake studied thatcontained water with hypersaline concentrations ofsalt, and differences among the other less saline lakeswere difficult to discern when samples from OL-CO3were active in defining ordination axes. Consequently,OL-CO3 was excluded from the CCA. Artemia fran-ciscana was the predominant crustacean and rotiferswere rare in hypersaline OL-CO3 (Tables 4 and 5).
208
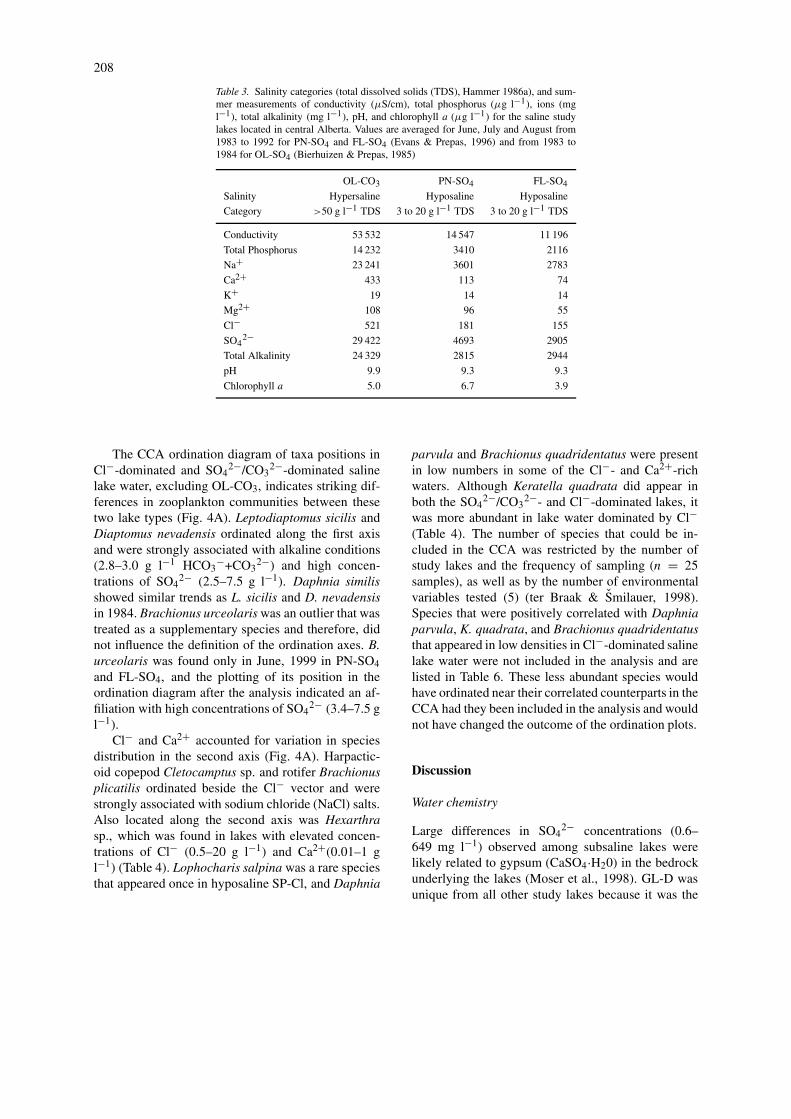
Table 3. Salinity categories (total dissolved solids (TDS), Hammer 1986a), and sum-mer measurements of conductivity (µS/cm), total phosphorus (µg l−1), ions (mgl−1), total alkalinity (mg l−1), pH, and chlorophyll a (µg l−1) for the saline studylakes located in central Alberta. Values are averaged for June, July and August from1983 to 1992 for PN-SO4 and FL-SO4 (Evans & Prepas, 1996) and from 1983 to1984 for OL-SO4 (Bierhuizen & Prepas, 1985)
OL-CO3 PN-SO4 FL-SO4
Salinity Hypersaline Hyposaline Hyposaline
Category >50 g l−1 TDS 3 to 20 g l−1 TDS 3 to 20 g l−1 TDS
Conductivity 53 532 14 547 11 196
Total Phosphorus 14 232 3410 2116
Na+ 23 241 3601 2783
Ca2+ 433 113 74
K+ 19 14 14
Mg2+ 108 96 55
Cl− 521 181 155
SO42− 29 422 4693 2905
Total Alkalinity 24 329 2815 2944
pH 9.9 9.3 9.3
Chlorophyll a 5.0 6.7 3.9
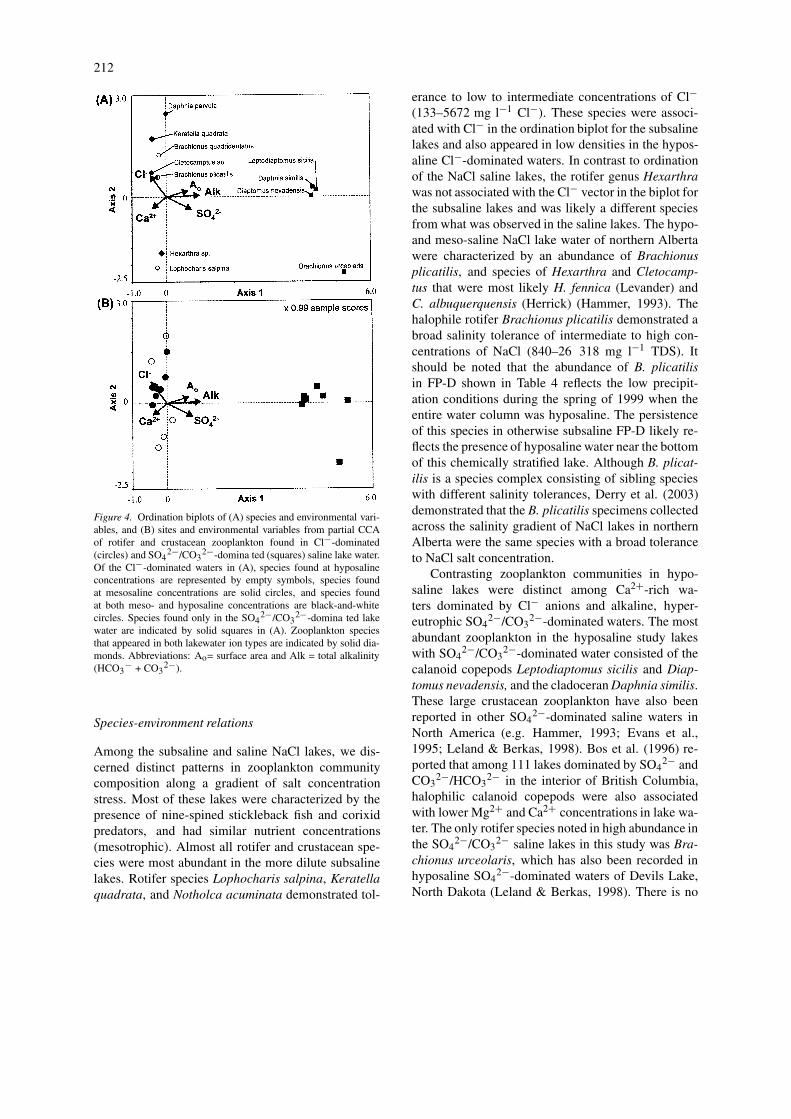
The CCA ordination diagram of taxa positions inCl−-dominated and SO4
2−/CO32−-dominated saline
lake water, excluding OL-CO3, indicates striking dif-ferences in zooplankton communities between thesetwo lake types (Fig. 4A). Leptodiaptomus sicilis andDiaptomus nevadensis ordinated along the first axisand were strongly associated with alkaline conditions(2.8–3.0 g l−1 HCO3
−+CO32−) and high concen-
trations of SO42− (2.5–7.5 g l−1). Daphnia similis
showed similar trends as L. sicilis and D. nevadensisin 1984. Brachionus urceolaris was an outlier that wastreated as a supplementary species and therefore, didnot influence the definition of the ordination axes. B.urceolaris was found only in June, 1999 in PN-SO4and FL-SO4, and the plotting of its position in theordination diagram after the analysis indicated an af-filiation with high concentrations of SO4
2− (3.4–7.5 gl−1).
Cl− and Ca2+ accounted for variation in speciesdistribution in the second axis (Fig. 4A). Harpactic-oid copepod Cletocamptus sp. and rotifer Brachionusplicatilis ordinated beside the Cl− vector and werestrongly associated with sodium chloride (NaCl) salts.Also located along the second axis was Hexarthrasp., which was found in lakes with elevated concen-trations of Cl− (0.5–20 g l−1) and Ca2+(0.01–1 gl−1) (Table 4). Lophocharis salpina was a rare speciesthat appeared once in hyposaline SP-Cl, and Daphnia
parvula and Brachionus quadridentatus were presentin low numbers in some of the Cl−- and Ca2+-richwaters. Although Keratella quadrata did appear inboth the SO4
2−/CO32−- and Cl−-dominated lakes, it
was more abundant in lake water dominated by Cl−(Table 4). The number of species that could be in-cluded in the CCA was restricted by the number ofstudy lakes and the frequency of sampling (n = 25samples), as well as by the number of environmentalvariables tested (5) (ter Braak & Smilauer, 1998).Species that were positively correlated with Daphniaparvula, K. quadrata, and Brachionus quadridentatusthat appeared in low densities in Cl−-dominated salinelake water were not included in the analysis and arelisted in Table 6. These less abundant species wouldhave ordinated near their correlated counterparts in theCCA had they been included in the analysis and wouldnot have changed the outcome of the ordination plots.
Discussion
Water chemistry
Large differences in SO42− concentrations (0.6–
649 mg l−1) observed among subsaline lakes werelikely related to gypsum (CaSO4·H20) in the bedrockunderlying the lakes (Moser et al., 1998). GL-D wasunique from all other study lakes because it was the
209
Table 4. Peak density observed for rotifer species (# individuals/l lake water) in each cat-egory of lakewater salinity over the summer of 1999. Dominant anions for each lake categoryare indicated in brackets
Table 5. Peak density observed for crustacean species (# individuals/l lake water) ineach category of lake-water salinity over the summer of 1999. Dominant anions for eachlake category are indicated in brackets
deepest and the only oligotrophic lake studied, as wellas being the only subsaline lake that was dominatedby SO4
2− anions. Although phosphorus released fromlake sediments can be greater at higher SO4
2− concen-trations (Caraco et al., 1989), TP concentrations werelow (15 µg l−1). In this lake, phosphorus was likelyprecipitated as calcium phosphate (CaPO4) (Wetzel,1983) since Ca2+ is in abundance in the limestonebedrock. FP-D also differed from other study lakesbecause it shared chemical characteristics with boththe subsaline and the Cl−-dominated saline lake wa-
ter. Although FP-D had surface waters that remainedsubsaline for most of the sampling period, the watercolumn of this lake was inversely stratified by the endof the summer when the bottom stratum was saline.The dilute salts present in the subsaline study lakescontrasted with the concentrated conditions found inthe saline lakes.
The Cl−-dominated saline study lakes in northernAlberta are not representative of lake water in thispredominantly freshwater boreal region (Pienitz et al.,1997; Moser et al., 1998; Rühland & Smol, 1998).
211
Table 6. List of zooplankton species present in saline lakes containingCl−-dominated waters that were positively correlated with Brachionusquadridentatus, Keratella quadrata, and Daphnia parvula. Species listedbelow were not included in the CCA of all saline study lakes because of therestricted number of species that could be included in the analysis. Speciesdensities are given in Tables 4 and 5
Zooplankton Species in CCA Correlated Zooplankton Taxa r
Brachionus quadridentatus Brachionus rubens 0.60
Keratella hiemalis 0.50
Notholca acuminata 0.55
Leptodiaptomus nudus 0.80
Acanthocyclops carolinianus 0.55
Diacyclops navus 0.80
Daphnia pulicaria/pulex 0.50
Keratella quadrata Keratella hiemalis 0.43
Keratella testudo 0.44
Notholca acuminata 0.42
Polyarthra vulgaris 0.44
Daphnia pulicaria/pulex 0.43
Daphnia parvula Bosmina sp. 1.0
The salinity of the study lakes in northern Albertais a result of groundwater discharging high concen-trations of NaCl salt (Camsell, 1917). Other isolatedexamples of saline lakes derived from NaCl springsare found in the Saskatchewan River delta (Hammer,1993) and on the interior plateau of British Columbia(e.g., Bos et al., 1996). The chloride-dominated wa-ters that we studied had relatively low total alkalinities(<305 mg l−1), and the reduced ratio of sulphate tochloride at higher salinities may have been a resultof CaSO4·H20 precipitation (Evans & Prepas, 1996).However, SO4
2− was elevated in SP-Cl relative to theother lakes with Cl−-dominated water and this may berelated to spatial variation in the amount of gypsumin bedrock underlying the lakes. Similar to GL-D, therelatively low TP concentrations in all of the salinelakes with Cl−-dominated water (18–85 µg l−1) likelyresulted from precipitation of phosphorus as CaPO4(Wetzel, 1983). Although TN was high in these lakes(741–1673 µg l−1), amounts of biologically availableNO2
− and NO3− were low (2–39 µg l−1); nitrogen
deficiencies are reportedly common among freshwa-ter lakes in the Park (Moser et al., 1998). However,nitrogen fixation in benthic algal mats, such as thosefound in GB-Cl and SP-Cl, may contribute to TN insaline lakes (e.g., Jellison et al., 1993). The presenceof halite deposits in combination with local and re-gional groundwater flow regimes were likely dominant
forces in determining NaCl salinity of surface water(Camsell, 1917; Toth, 1999).
In contrast to Cl−-dominated saline lake waterthat is infrequently encountered in Canada, the threestudy lakes sampled in central Alberta are similar tomany of the saline lakes on the northern Great Plainsof North America (e.g. Bierhuizen & Prepas, 1985;Last, 1992; Blinn, 1993). The high concentrationsof SO4
2− and HCO3−/CO3
2− in these lakes (>3 gl−1) have been attributed to weathering of Cretaceousblack shale bedrock in combination with evaporativeprocesses (e.g., Blinn, 1993). Many saline lakes incentral Alberta have concentrations >1 mg l−1 TPas a result of evaporative concentration (Campbell &Prepas, 1986) and phosphorus release from bottomsediments at high SO4
2−concentrations (Caraco et al.,1989). Unlike the SO4
2−/CO32−-dominated lake wa-
ter that we studied, low phosphorus availability hasbeen reported for Saskatchewan lakes and appears tobe influenced by the interaction of high DOC, pH andionic composition (Waiser & Robarts, 1995). Climate,topographic position within the drainage system, andgroundwater flow regimes govern salt concentrationand ionic composition of lake water on the northernGreat Plains (Last, 1992).
212
Figure 4. Ordination biplots of (A) species and environmental vari-ables, and (B) sites and environmental variables from partial CCAof rotifer and crustacean zooplankton found in Cl−-dominated(circles) and SO4
2−/CO32−-domina ted (squares) saline lake water.
Of the Cl−-dominated waters in (A), species found at hyposalineconcentrations are represented by empty symbols, species foundat mesosaline concentrations are solid circles, and species foundat both meso- and hyposaline concentrations are black-and-whitecircles. Species found only in the SO4
2−/CO32−-domina ted lake
water are indicated by solid squares in (A). Zooplankton speciesthat appeared in both lakewater ion types are indicated by solid dia-monds. Abbreviations: Ao= surface area and Alk = total alkalinity(HCO3
− + CO32−).
Species-environment relations
Among the subsaline and saline NaCl lakes, we dis-cerned distinct patterns in zooplankton communitycomposition along a gradient of salt concentrationstress. Most of these lakes were characterized by thepresence of nine-spined stickleback fish and corixidpredators, and had similar nutrient concentrations(mesotrophic). Almost all rotifer and crustacean spe-cies were most abundant in the more dilute subsalinelakes. Rotifer species Lophocharis salpina, Keratellaquadrata, and Notholca acuminata demonstrated tol-
erance to low to intermediate concentrations of Cl−(133–5672 mg l−1 Cl−). These species were associ-ated with Cl− in the ordination biplot for the subsalinelakes and also appeared in low densities in the hypos-aline Cl−-dominated waters. In contrast to ordinationof the NaCl saline lakes, the rotifer genus Hexarthrawas not associated with the Cl− vector in the biplot forthe subsaline lakes and was likely a different speciesfrom what was observed in the saline lakes. The hypo-and meso-saline NaCl lake water of northern Albertawere characterized by an abundance of Brachionusplicatilis, and species of Hexarthra and Cletocamp-tus that were most likely H. fennica (Levander) andC. albuquerquensis (Herrick) (Hammer, 1993). Thehalophile rotifer Brachionus plicatilis demonstrated abroad salinity tolerance of intermediate to high con-centrations of NaCl (840–26 318 mg l−1 TDS). Itshould be noted that the abundance of B. plicatilisin FP-D shown in Table 4 reflects the low precipit-ation conditions during the spring of 1999 when theentire water column was hyposaline. The persistenceof this species in otherwise subsaline FP-D likely re-flects the presence of hyposaline water near the bottomof this chemically stratified lake. Although B. plicat-ilis is a species complex consisting of sibling specieswith different salinity tolerances, Derry et al. (2003)demonstrated that the B. plicatilis specimens collectedacross the salinity gradient of NaCl lakes in northernAlberta were the same species with a broad toleranceto NaCl salt concentration.
Contrasting zooplankton communities in hypo-saline lakes were distinct among Ca2+-rich wa-ters dominated by Cl− anions and alkaline, hyper-eutrophic SO4
2−/CO32−-dominated waters. The most
abundant zooplankton in the hyposaline study lakeswith SO4
2−/CO32−-dominated water consisted of the
calanoid copepods Leptodiaptomus sicilis and Diap-tomus nevadensis, and the cladoceran Daphnia similis.These large crustacean zooplankton have also beenreported in other SO4
2−-dominated saline waters inNorth America (e.g. Hammer, 1993; Evans et al.,1995; Leland & Berkas, 1998). Bos et al. (1996) re-ported that among 111 lakes dominated by SO4
2− andCO3
2−/HCO32− in the interior of British Columbia,
halophilic calanoid copepods were also associatedwith lower Mg2+ and Ca2+ concentrations in lake wa-ter. The only rotifer species noted in high abundance inthe SO4
2−/CO32− saline lakes in this study was Bra-
chionus urceolaris, which has also been recorded inhyposaline SO4
2−-dominated waters of Devils Lake,North Dakota (Leland & Berkas, 1998). There is no
213
record of L. sicilis, D. nevadensis, and D. similis inCl−-dominated waters in North America (e.g., Wurts-baugh & Berry, 1990). Hammer (1993) indicated thatL. sicilis, D. nevadensis, and D. similis belonged toentirely different lake categories from B. plicatilis andA. franciscana based on salinity gradient, pH, Secchidepth, and mean depth. However, Hammer (1993)sampled across lakes with variable ion compositionand the role of different ions on zooplankton com-munities was unclear. Further, differences in predationregimes among lakes were not addressed.
The substantial differences in zooplankton com-munities observed among lakes with contrasting ioncomposition are confounded by covariation in nutrientconcentration and predation pressure, as well as bythe small sample size (n = 4 hyposaline lakes). Fur-ther, lake surface area, mean depth, and the presenceof associated streams were variable among the studylakes and likely affected the composition of zooplank-ton species. Deeper, larger lakes tend to be charac-terized by greater zooplankton species richness andabundance than smaller, shallower lakes were thereis higher predation pressure by fish and invertebrates(Keller & Conlin, 1994). With the exception of deepestGL-D, the saline lakes with SO4
2−/CO32−-dominated
water had the largest surface areas and the deepestmean depths (Table 1), but an absence of inflowingor outflowing streams likely restricted opportunitiesfor fish to enter these lakes (Campbell & Prepas,1986). In contrast, the saline lakes containing Cl−-dominated water were smaller and shallower (Table 1),but had surface connections to other rivers and lakes.Nine-spined stickleback fish were abundant in theseshallow but well connected systems. Predation of zo-oplankton by both nine-spined stickleback (Nelson &Paetz, 1992) and corixids (Tones & Hammer, 1975)was likely strong in the saline lakes containing Cl−-dominated water compared to the lakes with isolatedbasins containing water dominated by SO4
2−/CO32−.
An alternative explanation to restricted hydro-graphic connections for contrasting zooplankton com-munities among these saline lakes are gradients ofsalinity stress, specific ion tolerance, and environ-mental stability. Herbst (2001) argued that physiolo-gical adaptation to extreme physico-chemical condi-tions provided an avenue of escape from intense pred-ation and competition in more diverse communities ofmoderate environments. Our findings support Herbst’s(2001) model of how physiology of ion tolerance in-teracts with zooplankton distribution and biography. Inour study, large crustacean zooplankton occurred only
in lakes with SO42−/CO3
−-dominated water, whichalso lacked fish predators. Large calanoid copepodsand cladocerans were absent from the lakes with Cl−-dominated waters that had high densities of predatorycorixids and nine-spined stickleback fish. Salt concen-tration in hypersaline OL-CO3 and solute compositionin the SO4
2−dominated saline lakes, in combinationwith restricted hydrographic connections, likely actedas a barrier for planktonic predators. Wurtsbaugh &Berry (1990) presented an example of how reducedsalinity (50 g l−1 compared to 250 g l−1 TDS in themixolimnion) of hypersaline NaCl-dominated GreatSalt Lake allowed the penetration of the predatorycorixid, Trichocorixa verticalis, that depleted Artemiafranciscana populations from 1985 to 1987. Similarto the lakes with Cl−-dominated water from our study,B. plicatilis was the most abundant zooplankter undermesosaline conditions in Great Salt Lake during thattime. SO4
2−-dominated waters have been found to bemore stressful for osmoregulation in fish larvae thanCl−-dominated waters (Koel & Peterka, 1995), andthese differences in ion strength may also reflect vari-ation in selective pressure on zooplankton that inhabitsalt lakes.
In conclusion, large crustacean zooplankton suchas Artemia franciscana may have adapted to os-moregulate in hypersaline waters and species suchas Leptodiaptomus sicilis, Diaptomus nevadensis,and Daphnia similis may have evolved tolerance toSO4
2−-dominated salinity to escape predation pres-sure present in less extreme environments. Selectivephysiological tests of ion tolerance in different specieswould provide useful ecological insight to biogeo-graphic patterns of habitat utilization in zooplankton.
Acknowledgements
We would like to express our appreciation to ShannonCorrigan and Lucille Kowalchuk for field assistance;Dr Chantal Ouimet for analytical assistance; BrianRolseth, Patricia Burgess, and Roselyn Rudy for wa-ter chemistry analyses; and Emma Mangas and DrPinel Alloul, Université de Montréal, for zooplanktonsample analyses. D.B. Herbst provided an insight-ful review of the manuscript. Funding for researchincluded: Biodiversity Challenge Grants through theAlberta Conservation Association, Syncrude CanadaLtd., Alberta Sport, Recreation, Parks and WildlifeFoundation, Northern Scientific Training Grants, andan NSERC operating grant to E.E. Prepas. Wood Buf-
214
falo National Park and Aurora College, Fort Smith,N.W.T. provided in-kind support.
References
Bergmann, M. & R. H. Peters, 1980. A simple reflectance methodfor the measurement of particulate pigment in lake water and itsapplication to phosphorus-chlorophyll-seston relationships. Can.J. Fish. aquat. Sci. 37: 111–114.
Bierhuizen, J. F. H. & E. E. Prepas, 1985. Relationship betweennutrients, dominant ions, and phytoplankton standing crop inprairie saline lakes. Can. J. Fish. aquat. Sci. 42: 1588–1594.
Blinn, D. W., 1993, Diatom community structure along physico-chemical gradients in saline lakes. Ecology 74: 1246–1263.
Bos, D. G., B. F. Cumming, C. E. Watters & J. P. Smol, 1996.The relationship between zooplankton, conductivity and lake-water ionic composition in 111 lakes from the Interior Plateauof British Columbia, Canada. Int. J. Salt Lake Res. 5: 1–15.
Brandlova, J. Z. & C. H. Fernando, 1972. The Cladocera of Ontariowith remarks on some species and distribution. Can. J. Zool. 50:1373–1403.
Brooks, J. L., 1957. The Systematics of North American Daphnia.Memoirs of the Connecticut Academy of Arts and Sciences 13:1–180.
Campbell, C. E. & E. E. Prepas, 1986. Evaluation of factors relatedto the unusually low chlorophyll levels in prairie saline lakes.Can. J. Fish. aquat. Sci. 43: 846–854.
Camsell, C., 1917. Salt and gypsum deposits in district betweenPeace and Slave rivers, northern Alberta. Geological survey ofCanada summary report no. 1916: 134–145.
Caraco, N. F., J. J. Cole & G. E. Likens, 1989. Evidencefor sulphate-controlled phosphorus release from sediments ofaquatic systems. Nature 341: 316–318.
Chengalath, R., C. H. Fernando & M. G. George, 1971. PlanktonicRotifera of Ontario. Dept. of Biology, University of Waterloo,Ont. Biology series. 40 pp.
Cuthbert, I. D. & P. del Giorgio, 1992. Toward a standard methodof measuring color in freshwater. Limnol. Oceanogr. 37: 1319–1326.
Derry, A. M., P. D. N. Hebert & E. E. Prepas, 2003. Evolution ofrotifers in saline and subsaline lakes: a molecular phylogeneticapproach. Limnol. Oceanogr. 48: 675–685.
Devey, Jr. E. S. & G. B. Devey, 1971. The American species of Eu-bosmina seligo (Crustacea, Cladocera). Limnol. Oceanogr. 16:201–218.
Birge, E. A., 1959. The water fleas (Cladocera). In Edmondson, W.T. (ed.), Ward and Whipple’s Freshwater Biology. John Wileyand Sons Inc. (NY): 677–740.
Evans, J. C. & E. E. Prepas, 1996. Potential effects of climatechange on ion chemistry and phytoplankton communities inprairie saline lakes. Limnol. Oceanogr. 41: 1063–1076.
Evans, M. S., R. D. Robarts & M. T. Arts, 1995. Predicted versusactual determinations of algal production, algal biomass, and zo-oplankton biomass in a hypereutrophic, hyposaline prairie lake.Can. J. aquat. Sci. 52: 1037–1049.
Forester, R. M., 1986. Determination of dissolved anion com-position of ancient lakes from fossil ostracods. Geology 14:796–798.
Government & University of Alberta, 1969. Atlas of Alberta. Uni-versity of Alberta Press in association with University of TorontoPress, Edmonton (AB): 7–8.
Greenberg, A. E., L. S. Clesceri & A. D. Eaton, 1992. StandardMethods for the Examination of Water and Wastewater, 18thed. American Public Health Association, American Water WorksAssociation and Water Environment Federation, Washington,D.C. 193 pp.
Hammer, U. T., 1986. Saline Ecosystems of the World. Dr. W. JunkPublishers, Dordrecht. 616 pp.
Hammer, U. T., 1993. Zooplankton distribution and abundance insaline lakes of Alberta and Saskatchewan, Canada. Int. J. SaltLake Res. 2: 111–132.
Herbst, D. B., 2001. Gradients of salinity stress, environmental sta-bility and water chemistry as a templet for defining habitat typesand physiological strategies in inland salt waters. Hydrobiologia466: 209–219.
Jellison, R., L. G. Miller, J. M. Melack & G. L. Dana, 1993. Mero-mixis in hypersaline Mono Lake, California. 2. Nitrogen fluxes.Limnol. Oceanogr. 38: 1020–1039.
Keller, W. & M. Conlin, 1994. Crustacean zooplankton communit-ies and lake morphometry in Precambrian Shield lakes. Can. J.Fish. aquat. Sci. 51: 2424–2434.
Koel, T. M. & J. J. Peterka, 1995. Survival to hatching of fishes insulfate-saline waters, Devils Lake, North Dakota. Can. J. Fish.aquat. Sci. 52: 464–469.
Last, W. M., 1992. Chemical composition of saline and subsalinelakes of the northern Great Plains, western Canada. Int. J. SaltLake Res. 1: 47–76.
Leland, H. V. & W. R. Berkas, 1998. Temporal variation in plank-ton assemblages and physicochemistry of Devils Lake, NorthDakota. Hydrobiologia 377: 57–71.
Meijer Drees, N.C., 1986. Evaporitic deposits of Western Canada.Geological survey of Canada. paper 85–20: 45, 51.
Menzel, D. W. & N. Corwin, 1965. The measurement of totalphosphorus in seawater based on the liberation of organicallybound fractions by persulfate oxidation. Limnol. Oceanogr. 10:280–282.
Moser, K. A., J. P. Smol, D. R. S. Lean & G. M. MacDonald, 1998.Physical and chemical limnology of northern boreal lakes, WoodBuffalo National Park, northern Alberta, and the NorthwestTerritories, Canada. Hydrobiologia 377: 25–43.
Nelson, J. S. & M. J. Paetz, 1992. The Fishes of Alberta. Universityof Alberta Press, Edmonton (AB). 437 pp.
Pienitz, R., J. P. Smol & D. R. S. Lean, 1997. Physical and chemicallimnology of 24 lakes located between Yellowknife and Cont-woyto Lake, Northwest Territories (Canada). Can. J. Fish. aquatSci. 54: 347–358.
Prepas, E. E. & F. H. Rigler, 1982. Improvements in quantifying thephosphorus concentration in lake water. Can. J. Fish. aquat. Sci.39: 822–829.
Pfaff, J. D., 1993. Determination of inorganic anions by ion chroma-tography, revision 2.1, EPA method 300.0. United States Envir-onmental Protection Agency Environmental Monitoring SystemsLaboratory, Office of Research and Development, Cincinnati(OH) 45268.
Rühland, K. & J. P. Smol, 1998. Limnological characteristics of70 lakes spanning arctic treeline from Coronation Gulf to GreatSlave Lake in the Central Northwest Territories, Canada. Int.Rev. Hydrobiol. 83: 183–203.
Smith, K. & C. H. Fernando, 1978. A Guide to the FreshwaterCalanoid and Cyclopoid Copepod Crustacea of Ontario. Dept.of Biology, University of Waterloo (ON), Biology series. 74 pp.
Stainton, M. P., M. J. Capel & F. A. J. Armstrong, 1977. The chem-ical analysis of freshwater, 2nd ed. Fish. Environ. Can. Misc.Spec. Publ. 25: 180. Available on request from the FreshwaterInstitute, Winnipeg (MN).
215
Stemberger, R. S., 1979. A Guide to Rotifers of the Laurentian GreatLakes. U.S. Environmental Protection Agency Rep. No. EPA-600-14-79-021. 185 pp.
ter Braak, C. J. F. & P. Smilauer, 1998. CANOCO 4.0 ReferenceManual and User’s Guide to Canoco for Windows: software forcanonical community ordination (version 4.0). MicrocomputerPower, Ithaca (NY). 351 pp.
Tones, P. I. & U. T. Hammer, 1975. Osmoregulation in Trichocorixaverticalis interiores Sailer (Hemiptera, Corixidae) – an inhabitantof Saskatchewan saline lakes, Canada. Can. J. Zool. 53: 1207–1212.
Toth, J., 1999. Groundwater as a geologic event: an overview of thecauses, processes, and manifestations. Hydrogeol. J. 7: 1–14.
Waiser, M. J. & R. D. Robarts, 1995. Microbial nutrient limitationin prairie saline lakes with high sulfate concentration. Limnol.Oceanogr. 40: 566–574.
Wetzel, R. G., 1983. Limnology, 3rd ed. Saunders College Publish-ing, Toronto (ON). 767 pp.
Williams, W. D., 1998. Salinity as a determinant of the structure ofbiological communities in salt lakes. Hydrobiologia 381: 191–201.
Winter, T. C., 1989. Distribution of the difference between precip-itation and open-water evaporation in North America, SurfaceWater Hydrology. In U.S. Geological Survey (ed.), The Geologyof North America V. 0-1. The Geological Society of AmericaInc., Boulder (CO), plate 2.
Wurtsbaugh, W. A. & T. S. Berry, 1990. Cascading effects of de-creased salinity on the plankton, chemistry, and physics of theGreat Salt Lake (Utah). Can. J. Fish. aquat. Sci. 47: 100–109.