A Comprehensive Introduction to Water Footprints Arjen Hoekstra Professor in Water Management – University of Twente – the Netherlands Scientific Director – Water Footprint Network www.waterfootprint.org
Transcript
A Comprehensive Introduction
to Water Footprints
Arjen Hoekstra
Professor in Water Management – University of Twente – the Netherlands
Scientific Director – Water Footprint Network
www.waterfootprint.org
1. The water footprint of products
2. The relation between consumption,
trade and water
3. The water footprint of a business
4. From concept to practice
Water footprint impact assessment
Reducing and offsetting water footprints
5. Conclusion
6. The way forward
Overview Presentation
The water footprint
of products
1
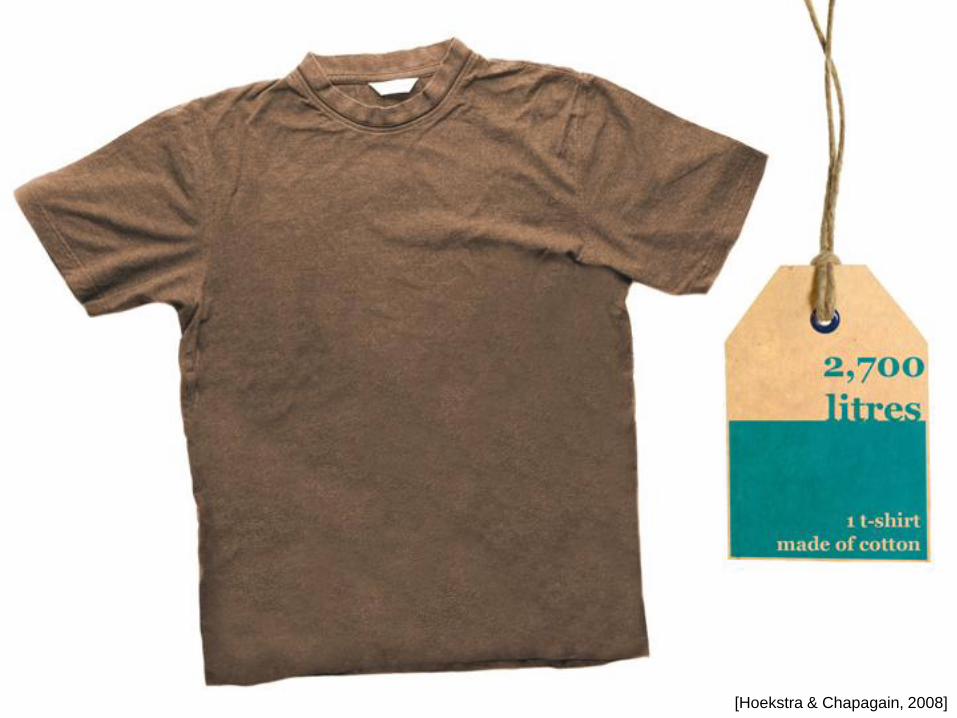
Water footprint of a product
► the volume of fresh water used to produce the product,
summed over the various steps of the production chain.
► when and where the water was used:
a water footprint includes a temporal and spatial dimension.
► type of water use:
green, blue, grey water footprint.
Water footprint of a product
Green water footprint
► volume of rainwater evaporated.
Blue water footprint
► volume of surface or groundwater evaporated.
Grey water footprint
► volume of polluted water.
HarvestingCotton plant Seed-cotton
Cotton seed
Cotton lint
Cotton seed
cake
Cotton seed oil
Grey fabric
Fabric
Final textile
Cotton linters
Cotton, not
carded or combed
Cotton, carded or
combed (yarn)
Hulling/
extraction
Garnetted stock
Carding/
Spinning
Yarn waste
Knitting/
weaving
Wet processing
Finishing
Cotton seed oil,
refined
Ginning
18.0
63.0
82.0
35.0
47.0
16.0
33.0
51.0
20.0
10.0
00.1
07.1
00.1
00.1
99.0
95.0
10.0
05.0
00.1
00.1
00.1
00.1
99.0
95.0
10.0
05.0
82.0
35.0
Legend
Value fraction
Product fraction
Production chain
cotton
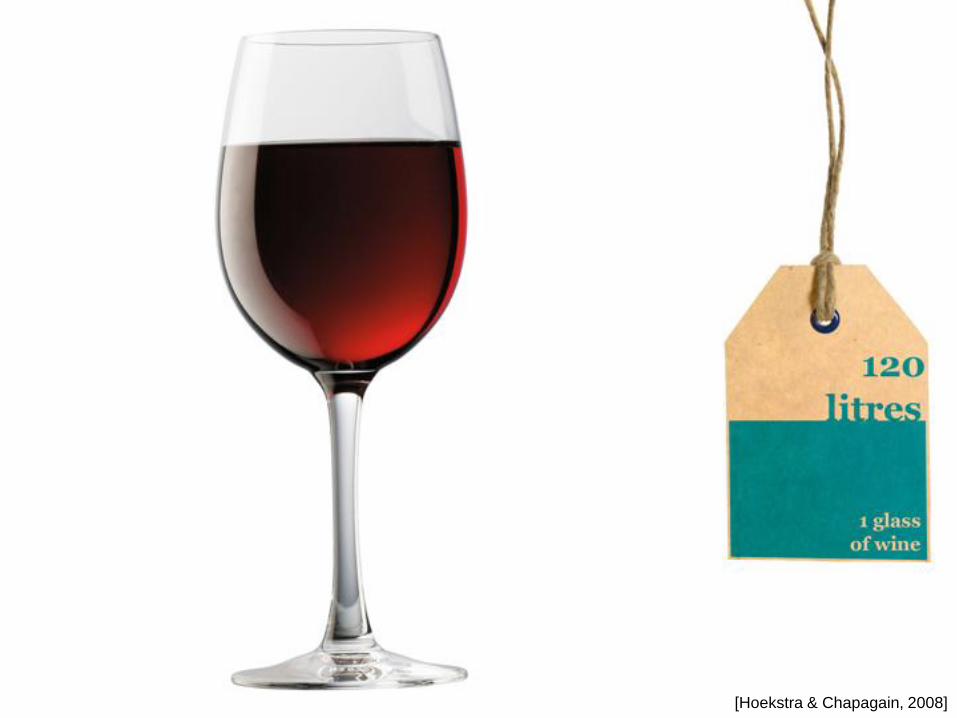
[Hoekstra & Chapagain, 2008]
Blue water footprint
Million m3/yr
2959M
m3/yr
690
Mm3/yr
421
Mm3/yr
2459
Mm3/yr
803
Mm3/yr
581
Mm3/yr
533
Mm3/yr
450
Mm3/yr
EU25's impact on blue water resources
[Hoekstra & Chapagain, 2008]
Water footprint of EU’s cotton consumption (blue water)
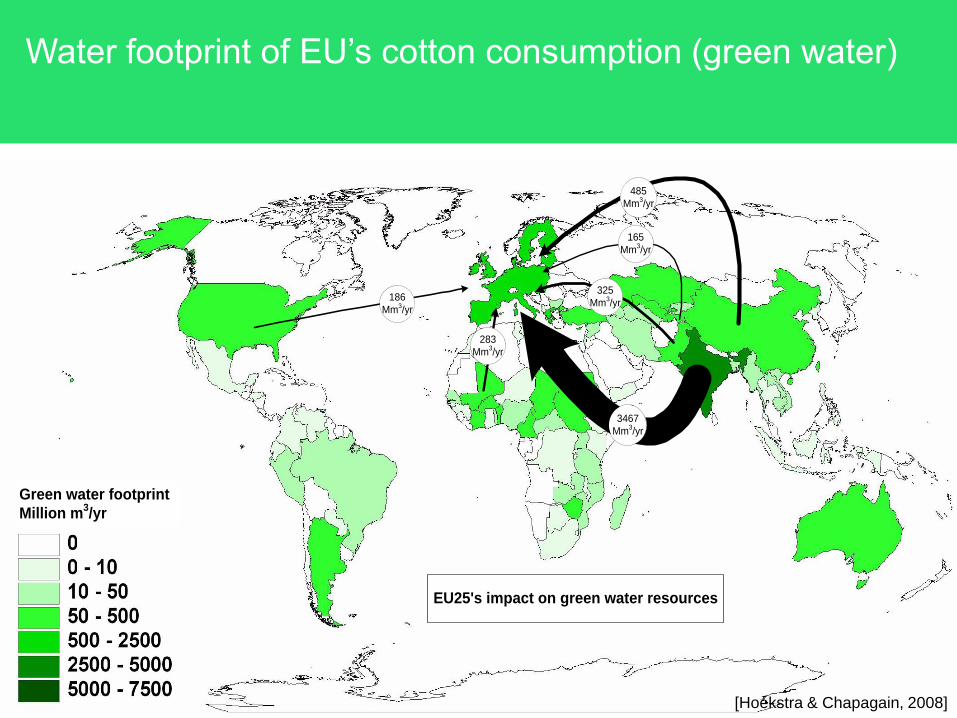
283
Mm3/yr
485
Mm3/yr
3467
Mm3/yr
165
Mm3/yr
Green water footprint
Million m3/yr
186
Mm3/yr
325
Mm3/yr
EU25's impact on green water resources
Water footprint of EU’s cotton consumption (green water)
[Hoekstra & Chapagain, 2008]
Dilution water footprint
Million m3/yr
409
Mm3/yr
310
Mm3/yr
92
Mm3/yr
102
Mm3/yr
635
Mm3/yr
83
Mm3/yr
398
Mm3/yr
697
Mm3/yr
EU25's impact on global water resources due to pollution
Water footprint of EU’s cotton consumption (grey water)
[Hoekstra & Chapagain, 2008]
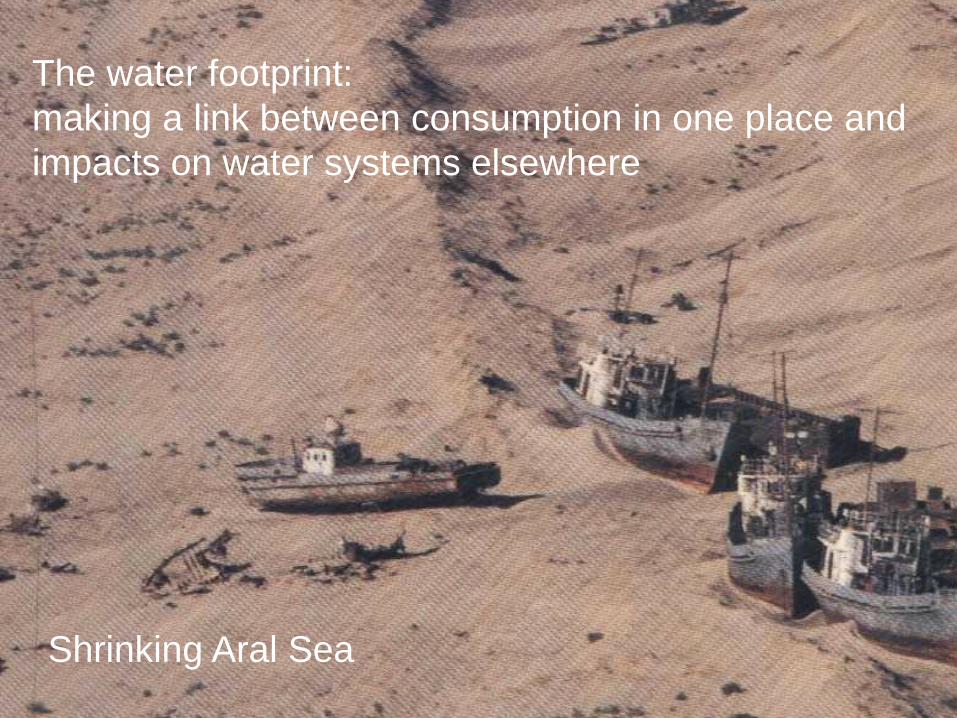
The water footprint:
making a link between consumption in one place and
impacts on water systems elsewhere
Shrinking Aral Sea
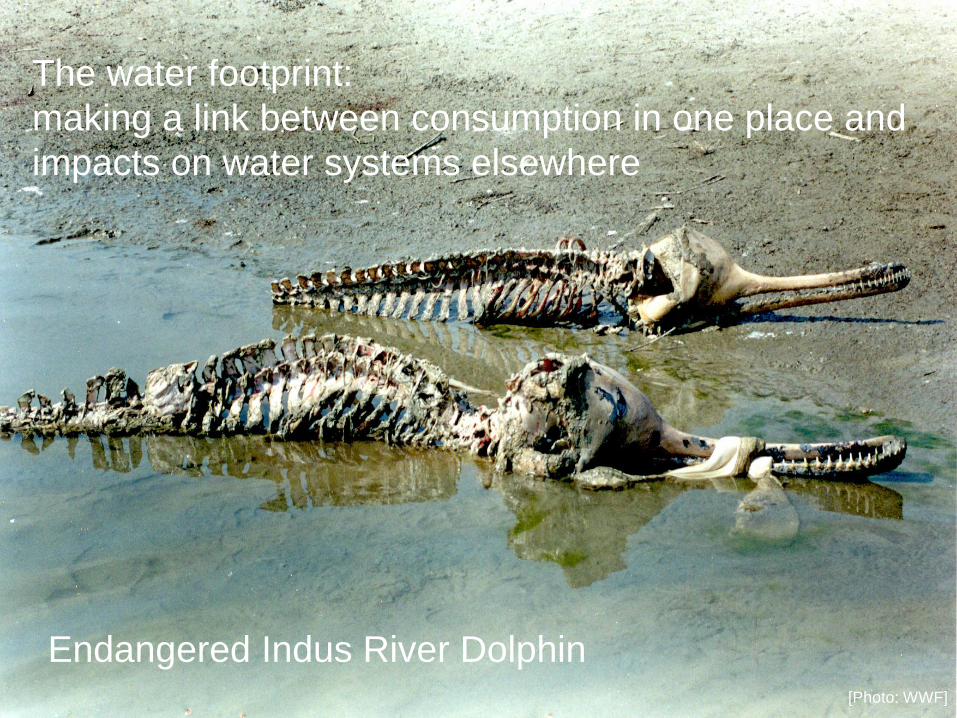
The water footprint:
making a link between consumption in one place and
impacts on water systems elsewhere
[Photo: WWF]
Endangered Indus River Dolphin
[Hoekstra & Chapagain, 2008]
[Hoekstra & Chapagain, 2008]
[Aldaya & Hoekstra, 2009]
[Hoekstra & Chapagain, 2008]
[Hoekstra & Chapagain, 2008]
[Hoekstra & Chapagain, 2008]
[Hoekstra & Chapagain, 2008]
[Hoekstra & Chapagain, 2008]
[Hoekstra & Chapagain, 2008]
[Hoekstra & Chapagain, 2008]
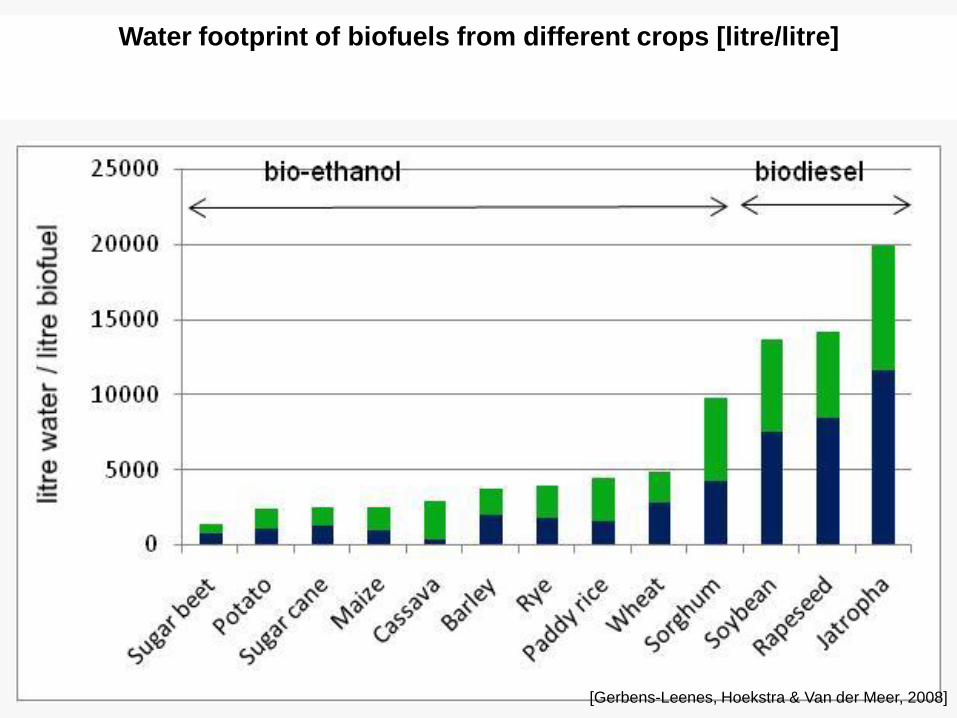
Water footprint of biofuels from different crops [litre/litre]
[Gerbens-Leenes, Hoekstra & Van der Meer, 2008]
The relation between
consumption, trade and water
2
Water footprint of a nation
► total amount of water that is used to produce the goods and
services consumed by the inhabitants of the nation.
► two components:
• internal water footprint – inside the country.
• external water footprint – in other countries.
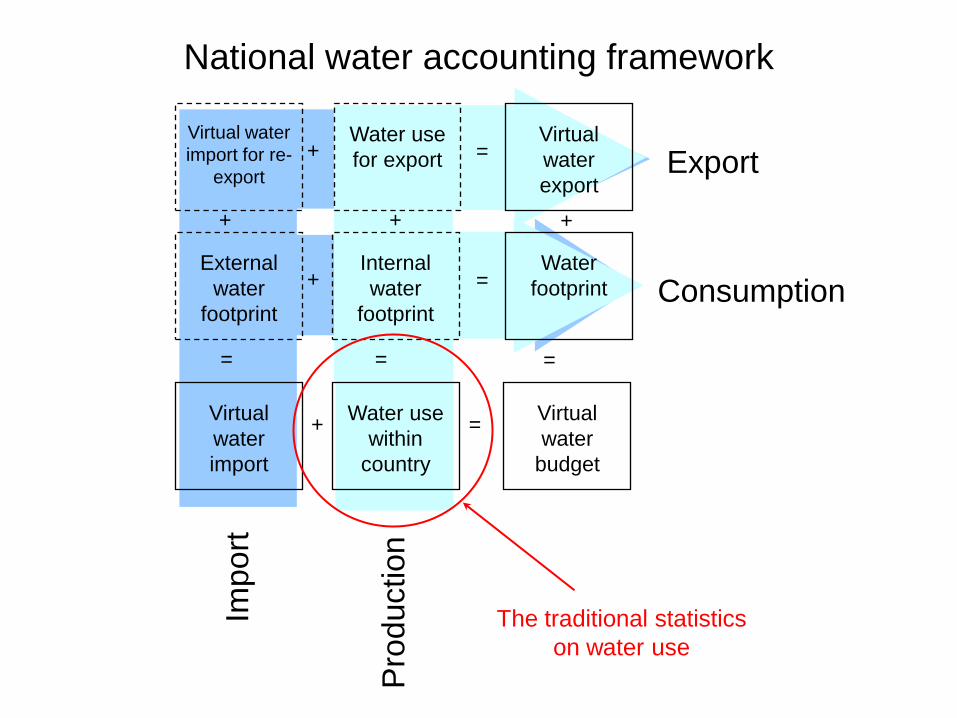
Water footprint of a nation
► National water footprint =
national water use
+ virtual water import
– virtual water export
Export
Consumption
Imp
ort
Pro
ductio
n
Virtual water
import for re-
export
Water use
for export
Virtual
water
export
External
water
footprint
Internal
water
footprint
Water
footprint
+
+
=
=
Virtual
water
import
Water use
within
country
++
= =
Virtual
water
budget
+
+ =
=
National water accounting framework
The traditional statistics
on water use
Arrows show trade flows >10 Gm3/yr
Regional virtual water balances(only agricultural trade)
[Hoekstra & Chapagain, 2008]
0
500
1000
1500
2000
2500
3000
Chin
a
India
Japan
Pakis
tan
Indonesia
Bra
zil
Mexic
o
Russia
Nig
eri
a
Thailand
Italy
US
A
Wate
r fo
otp
rint (m
3/c
ap/y
r)
Domestic water consumption Industrial goods Agricultural goods
Water footprint per capita
Global average water footprint
[Hoekstra & Chapagain, 2008]
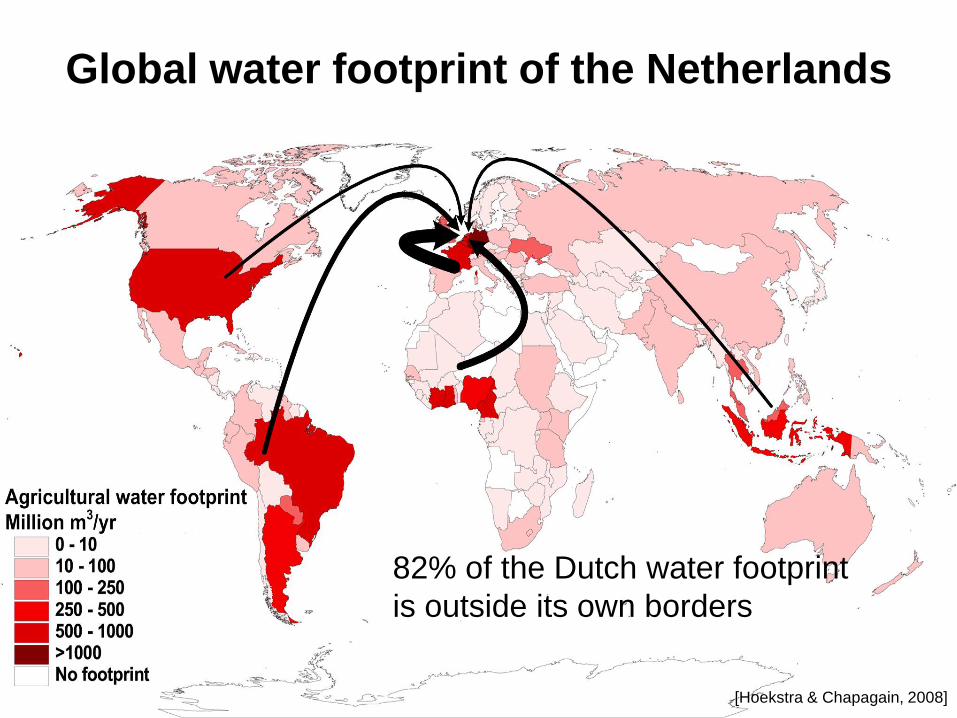
Global water footprint of the Netherlands
82% of the Dutch water footprint
is outside its own borders
[Hoekstra & Chapagain, 2008]
Environmental Water Scarcity Index
[Smakhtin, Revenga & Doll, 2004]
Water stress(withdrawal-to-availability)
< 0.3
0.3 - 0.4
0.4 - 0.5
0.5 - 0.6
0.6 - 0.7
0.7 - 0.8
0.8 - 0.9
0.9 - 1.0
> 1.0
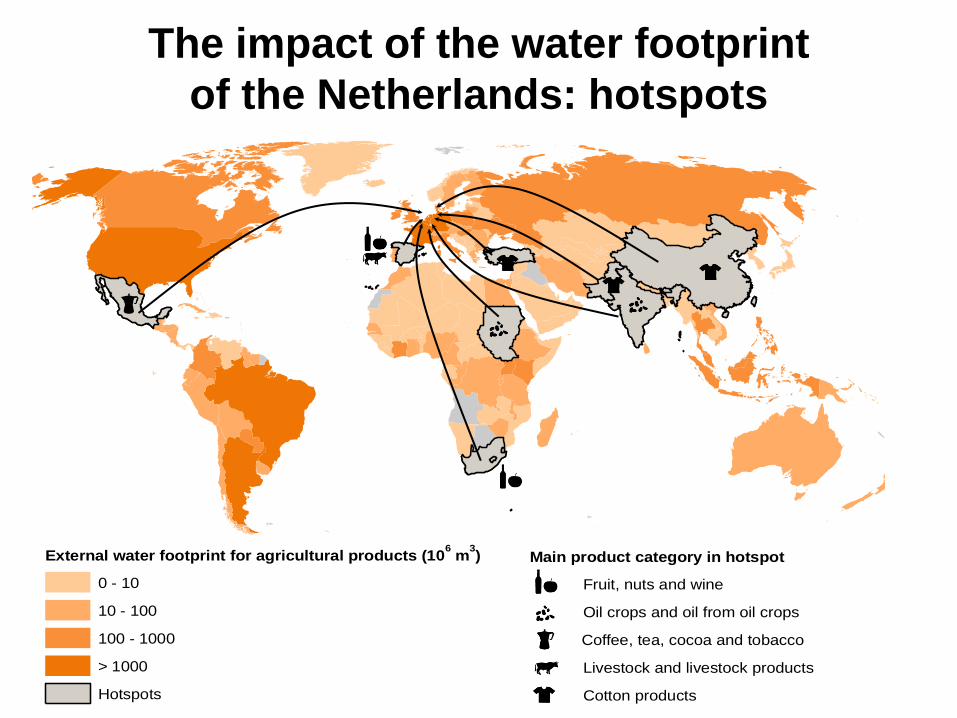
The impact of the water footprint
of the Netherlands: hotspots
External water footprint for agricultural products (106 m
3)
0 - 10
10 - 100
100 - 1000
> 1000
Hotspots
Main product category in hotspot
Fruit, nuts and wine
Oil crops and oil from oil crops
Coffee, tea, cocoa and tobacco
Livestock and livestock products
Cotton products
The water footprint of a
business
3
Operational water footprint
• the direct water use by the producer – for producing,
manufacturing or for supporting activities.
Supply-chain water footprint
• the indirect water use in the producer’s supply chain.
Water footprint of a business
bluewateruse
greywater
Farmer RetailerFood
processer
Virtual
waterflow
Virtual
waterflow
Virtual
waterflow
greenandbluewateruse
bluewateruse
greywater
greywater
Consumer
bluewateruse
greywater
The virtual water chain
[Hoekstra, 2008]
The water footprint of a retailer
bluewateruse
greywater
Farmer RetailerFood
processer
Virtual
waterflow
Virtual
waterflow
Virtual
waterflow
greenandbluewateruse
bluewateruse
greywater
greywater
Supply chain WF Operational WF
Consumer
bluewateruse
greywater
End-use WF of a product
[Hoekstra, 2008]
From concept to practice
4
From water footprint accounting to policy formulation
1
Vulnerability of local water systems
Spatiotemporal-
explicit water
footprint of a
• product
• individual
• community
• business
Current water stress in the places
where the water footprint is localised
Impacts of the
water footprint
• environmental
• social
• economic
Reduce and
offset the
negative impacts
of the water
footprint
2 3
[Hoekstra, 2008]
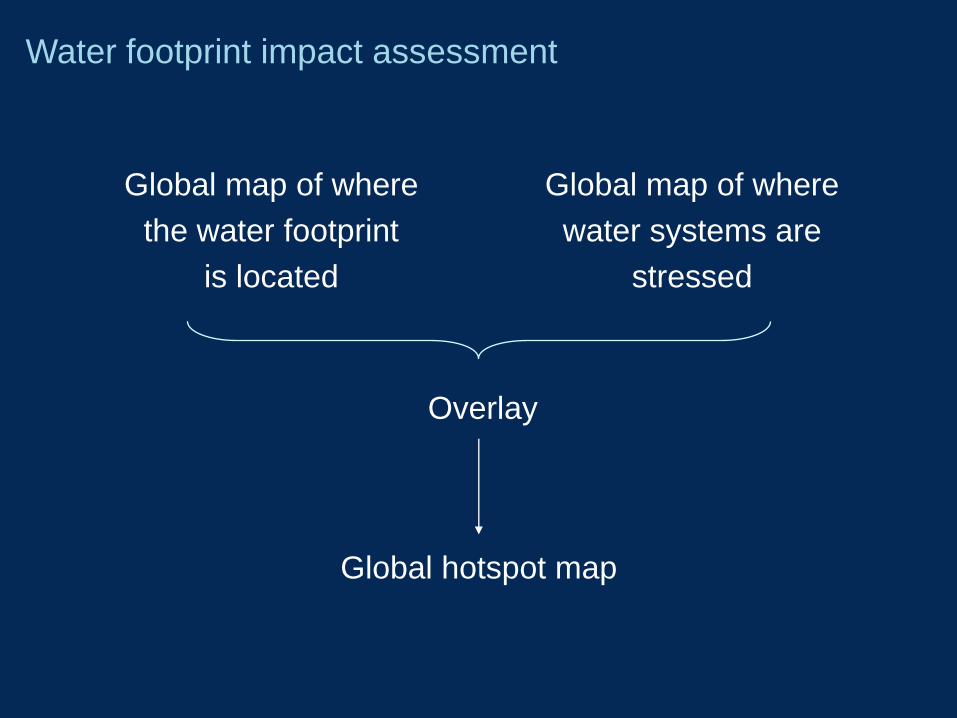
Global map of where
the water footprint
is located
Overlay
Water footprint impact assessment
Global map of where
water systems are
stressed
Global hotspot map
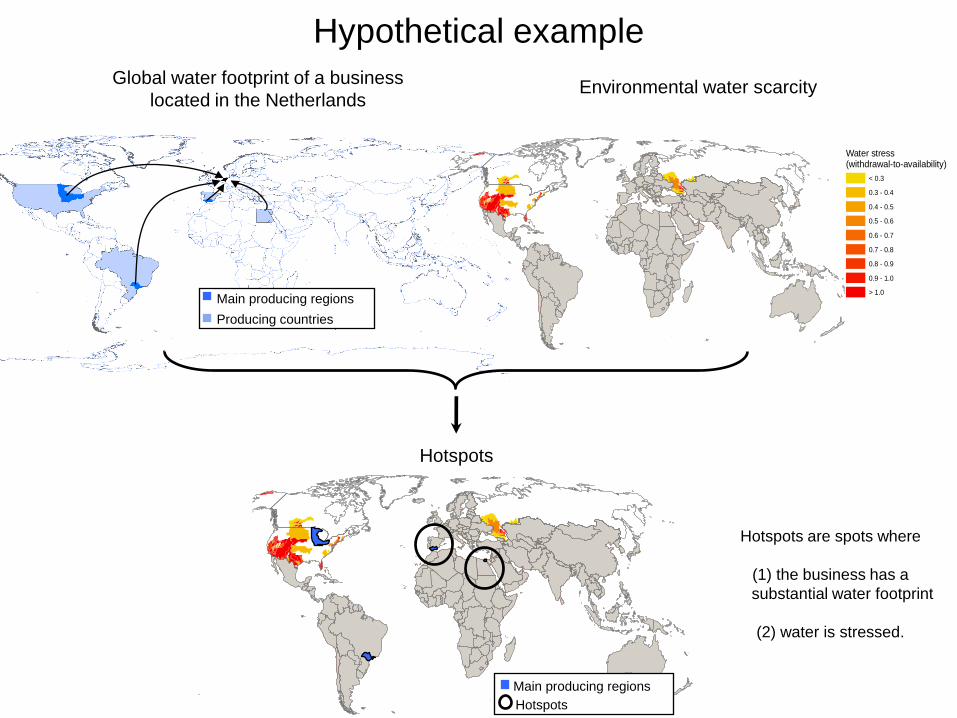
Hypothetical example
Main producing regions
Producing countries
Global water footprint of a business
located in the Netherlands
Water stress(withdrawal-to-availability)
< 0.3
0.3 - 0.4
0.4 - 0.5
0.5 - 0.6
0.6 - 0.7
0.7 - 0.8
0.8 - 0.9
0.9 - 1.0
> 1.0
Environmental water scarcity
Water stress(withdrawal-to-availability)
< 0.3
0.3 - 0.4
0.4 - 0.5
0.5 - 0.6
0.6 - 0.7
0.7 - 0.8
0.8 - 0.9
0.9 - 1.0
> 1.0
Main producing regions
Hotspots
Hotspots
Hotspots are spots where
(1) the business has a
substantial water footprint
(2) water is stressed.
Reduction: all what is ‘reasonably possible’ should have been done to
reduce the existing water footprint; do not undertake water-using
activities if better alternatives are available.
Offsetting: the residual water footprint is offset by making a
‘reasonable investment’ in establishing or supporting projects that
aim at a sustainable, equitable and efficient use of water in the
catchment where the residual water footprint is located.
[Hoekstra, 2008]
Reducing and offsetting the impacts of water footprints
Shared responsibility and an incremental approach
Consumers or consumer or environmental organizations
push businesses and governments to address water
use and impacts along supply chains.
Some businesses act voluntarily in an early stage.
Governments promote businesses in an early phase
and implement regulations in a later phase.
The way forward
6
Mission: Promoting sustainable, equitable and efficient water
use through development of shared standards on water footprint
accounting and guidelines for the reduction and offsetting of
impacts of water footprints.
Network: bringing together expertise from academia,
businesses, civil society, governments and international