Sound Shizuku Composition: a Computer-Aided Composition System for Extended Music Techniques Ivan Eiji Simurra Institute of Mathematics and Statistics – Universidade de São Paulo (USP) Jônatas Manzolli Interdisciplinary Nucleus for Sound Studies – Universidade de Campinas (UNICAMP) Abstract Abstract: We discuss in this paper a new environment for computer aid musical composition which is designed to create works centered on the creative use of instrumental extended techniques. The process is anchored on computational techniques to retrieve musical information via audio descriptors. We developed an analytical process, based on the extraction of spectral characteristics of a Sound DataBase (SDB), and on supporting the compositional planning as follows: relate statistical measures to the spectral behavior of specific execution modes of various instruments contained in the SDB. The result of the process is a palette of possibilities that assists the composer decisions regarding to the desired orchestration to be applied in a musical piece. The paper presents then the motivation and context to develop the environment, describes and characterizes the audio descriptors that have been studied, presents the computer system architecture and discusses the results obtained with Sound Shizuku. Keywords: Composition. Computer-Aided Orchestration. Audio Descriptors. Extended Techniques. Interdisciplinary Music Computation. I. Introduction A mong the contemporary music compositional techniques, some of them can touch upon the control factors related to musical timbre 1 and significantly alter the spectral characteristics of each single note heard. It could be compared to a palette of color where mixed extended instrumental techniques produce new shades and, finally, create new orchestral sounds. In line with the use of timbre as a potential space for composition, there is an increasingly concern with 1 The issues related to the term ‘tone’ as used in this paper, exceeds the definition by ‘exclusion to’ that timbre is an identification of property and distinction, whose sound sources have the same intensity and pitch. We attribute the term ‘timbre’ a spectral morphological identity, as discussed by Smalley [37] . 86
Institute of Mathematics and Statistics – Universidade de São Paulo (USP)[email protected]
Jônatas Manzolli
Interdisciplinary Nucleus for Sound Studies – Universidade de Campinas (UNICAMP)[email protected]
Abstract
Abstract: We discuss in this paper a new environment for computer aid musical composition which isdesigned to create works centered on the creative use of instrumental extended techniques. The process isanchored on computational techniques to retrieve musical information via audio descriptors. We developedan analytical process, based on the extraction of spectral characteristics of a Sound DataBase (SDB), andon supporting the compositional planning as follows: relate statistical measures to the spectral behavior ofspecific execution modes of various instruments contained in the SDB. The result of the process is a paletteof possibilities that assists the composer decisions regarding to the desired orchestration to be applied in amusical piece. The paper presents then the motivation and context to develop the environment, describesand characterizes the audio descriptors that have been studied, presents the computer system architectureand discusses the results obtained with Sound Shizuku.
Keywords: Composition. Computer-Aided Orchestration. Audio Descriptors. Extended Techniques.Interdisciplinary Music Computation.
I. Introduction
Among the contemporary music compositional techniques, some of them can touch upon thecontrol factors related to musical timbre 1 and significantly alter the spectral characteristicsof each single note heard. It could be compared to a palette of color where mixed extended
instrumental techniques produce new shades and, finally, create new orchestral sounds. In linewith the use of timbre as a potential space for composition, there is an increasingly concern with
1The issues related to the term ‘tone’ as used in this paper, exceeds the definition by ‘exclusion to’ that timbre is anidentification of property and distinction, whose sound sources have the same intensity and pitch. We attribute the term‘timbre’ a spectral morphological identity, as discussed by Smalley [37] .
MusMat: Brazilian Journal of Music and Mathematics • December 2016 • Vol. I, No. 1
getting more refined and particular timbre results, both for the compositional planning and forthe instrumental/vocal realization. The idea of timbre as a ‘metadimension’ [14, p. 45] showsthe interest to consider it not as a simple ‘color’ but as a potential space for integration of othermusical features and thus become the central focus of the composition. From the artistic pointof view, the timbre is a concept linked to the modus operandi of musical language, concurrentto aesthetics and musical form. Nevertheless there is still a fundamental issue centered on thedifficulty of relating to a ‘musician qualitative intuition’ on timbre with a ‘quantitative assessment’of possible categories of measures and objective analysis of the musical timbre behavior [5, p. 162].
This paper establishes a dialogue between the study of musical timbre, as poetic and musicalapproach, to a scientific point of view. More specifically, we work with recent studies on musicinformation retrieval based on spectral content that are the inner microstructures of musicaltimbre and therefore might help the development of a more refined and conscious compositionalplanning. This view has its origins in the pioneering research of Hermann von Helmholtz whosetreatise related timbre to the presence and the magnitude of spectral components with respectto its fundamental component [15]. This study provided important subsidies to timbre analysisfocused on the spectral characteristics of the sound [26, 31, 13]. Other researches from Berger[4] and form Wedin and Goude [41] pointed to a correlation between the accuracy of timbrerecognition with the attack and decay time of the sound source. As for Pierre Schaeffer, thetimbre of a sound is perceived by the variation of its spectral behavior and its evolution in time[28]. Schaeffer was the pioneer by separating the physical phenomenon of the sound of his ownperception phenomenological.
Based on these concepts we present a man-machine interaction methodology that connectscomputer aid sound analysis with the symbolic notation of a music score. We conducted a studyon musical information retrieval via low-level audio descriptors that are centered on feature extrac-tion of sound frequency spectrum. In this sense, using audio features as composition architecturaltools, two approaches to aid the compositional planning were developed: a) extract from sound fre-quency spectra specific features b) relate them to modes for the extended instrumental techniques,including transcription to symbolic music information and music orchestration. For this goal wehave developed an virtual analytical environment that recommends orchestral sonorities calledSound Shizuku Composition – SSC. To present this environment and its compositional implications,in Section II we discuss the main stages of the sound analysis and music orchestration assisted bycomputer. On Section III practical results are briefly discussed. Finally, we conclude our article inSection IV discussing forthcoming projects.
II. Architecture of the Methodology
The scope of the computer-assisted music orchestration system presented here is to apply audiodescriptors to provide a pallet of contrasting timbre variations. The goal is to produce a refinedblending of sounds derived from set of extended techniques. Therefore the creative processrelates sounds, described by audio descriptors, and instrumental settings to transcriptions ofthese relations into a music score. Finally, the transcriptions improve the original compositionalplanning in face of the computer aid orchestration. The first step developed here was to build‘Sound Mixtures’ that can be defined as computer simulations to generate audio files that willexpand possibilities of instrumental mixes. Sound Mixtures, are generated by superimposingmodes of playing, articulations and various extended instrumental techniques storage as audiosamples in the Sound DataBase (SDB).
Secondly the mixtures are analyzed with audio descriptors in order to extract their relatedspectral features. Section i presents the audio descriptors used to process that extraction. Figure 1
87
MusMat: Brazilian Journal of Music and Mathematics • December 2016 • Vol. I, No. 1
is the general outline of the proposed methodology in our research into computer-assisted musicorchestration.
i. Audio Descriptors Technical Definitions
In this section i we discuss the use of audio descriptors to provide sound analysis capability to themusic orchestration system. We introduce only audio descriptors that were studied in our research.The scientific knowledge area on this subject is called Music Information Retrieval or simply MIR[6, 7, 29, 38]. Studies on MIR use mathematical functions, supported by statistical measurementsand psychoacoustic models to proceed the so-called audio features extraction. According to [22, p.01] the methodology to describe the characteristics of a sound signal have been proposed by thescientific community to recognize patterns of speech and musical instrument classification. Theseprocedures are also significant tools on the context of musical composition and orchestration.Several methods for analyzing the spectral content of digitized audio signals are performed byShort-Time Fourier Transform or STFT, which is defined as follows by Sheh and Ellis [30, p. 02]:
Audio FeaturesTechnical Study
Composer
Definition ofSound Charac-
teristics from theAudio Features
ReferentialRemarks
Audio Fea-tures Library
Audio Fea-tures Library
- PDescriptors
Sound Mixtures
Definitionof the Music
Instruments thatwill be used
Sound DatabaseAudio SamplesDatabase - SOL
Audio SamplesDatabase - PianoSound Anal-
ysis Space
Sound MixturesSelection
Music Tran-scription
Exporting toAudio File
Exporting toMusic Score
Composition
Stage 1
Stage 2
Stage 3
Stage 4
Stage 5
Figure 1: General scheme of the computer-assisted music orchestration Sound Shizuku Composition - SSC. The grayblocks represent the computational flow data for sound analysis. The white blocks represent user interactionwith the system itself. The dotted and dashed blocks comprise the tasks of each of the five steps of ourmethodology architecture.
STFT[k,n] =N−1
∑m=0
x[n − m]w[m]e−j2πkm/n (1)
88
MusMat: Brazilian Journal of Music and Mathematics • December 2016 • Vol. I, No. 1
Table 1: Summary of the audio features.
Feature Definition Sound Correlative Possible Application
Spectral Centroid Center of the Mass Brightness/Opacity Sound Detection CentroidariationSpectral Standart Deviation Spectral Bandwidth Sound Mass Spectral Bands Equalization
Spectral Skewness Asymmetry or Obliquity Hot and Rounded/Bright and Penetrating Detection of percussion instrumentsSpectral Kurtosis Flattening of the Distribution Noise Transient Detection
Spectral Flux Time Attack Attack Detection of Sound EventsSpectral Flatness Ratio of Geometric Mean with Arithmetic Mean Noise/Tone Noise Removal
Spectral Irregularity Difference Magnitude Spectrum Velvety and Smooth/Rough and Ribbed Spectral Band EqualizationSpectral Roll-Off Spectral Slope Envelope Roughness Mastering Voice and Music
Odd-to Even Ratio Quotient of the Magnitude of the Spectral Components Nasal/Soft Detection of Musical IntensitiesRMS Energy Root Mean Square of the Energy Strong/Weak Detection of Sound Intensities
Loudness Auditory Sensation of Sound Intensity Strong/Weak Sound Intensity PerceptionZero-Crossing Rate Signal Changes in Time Noise Sound Noise DetectionSpectral Decreasing Energy Spectrum Percussion Sounds Detection of Percussive SoundsTemporal Centroid Temporal Center of the Mass Percussion Sounds Detection of Percussive SoundsSpectral Chroma Spectrum Analysis by Musical Pitches Tonality Harmony Identification
where k indexes the frequency axis with 0 ≤ k ≤ N − 1, n is the short-time window center, andw[m] is an N-point Hanning window.
From the widespread view in the area of MIR, audio descriptors are tools for sound analysisand most of them are represent by one-dimensional curves. As pointed out by Rimoldi [27, p. 01],the audio features are useful tools for a taxonomy of features related to the spectral content ofthe analyzed sound signal even though with their reductionist characteristics in relation to theanalyzed object. Such features can be correlated and not necessarily equivalent with subjectiveattributes of the perception of the sound signal, such as ‘brightness’, ‘opacity’, ‘roughness’,‘noisiness’, ‘softness’, among others.
To our research we use a set of fifteen audio features: Spectral Centroid [39, pp. 460-461],Spectral Standard Deviation [9, 27], Spectral Skewness [9], Spectral Kurtosis [1], Spectral Flux[22, 24], Spectral Flatness [8, p. 01], Spectral Irregularity [16], Spectral Roll-Off [19, p. 47], Odd-toEven Ratio [22], RMS Energy [17, p. 113], Loudness [42, 10, 20, 40, 25], Zero-Crossing Rate [24, 21],Spectral Decreasing [18], Temporal Centroid [23] and Spectral Croma [11, 12]. Such statisticalmeasures estimate particular characteristics of a digital audio signal. As already pointed out,audio descriptors are powerful tools for the creation of a taxonomy of spectral characteristics.This taxonomy can be correlated but not necessarily equivalent to the subjective attributes of thehuman perception. Table 1 summarizes the main highlighted points for the audio descriptors. Init, we summarized the presentation of the features with their possible applications.
ii. Sound DataBase - SDB
The audio samples used to generate Sound Mixtures belong to two databases compiled by Balletet. al [2] and Barbancho et. al [3]. Such samples have durations between five to seven seconds in.aiff audio format. In Ballet research called Studio OnLine or SOL the repository of instrumentalsonorities relates to ‘some aspects of the sound of contemporary instrumental music’ [2, p. 124].In total, the SOL database has 16 musical instruments such as accordion, tuba, bassoon, clarinet,trumpet, contrabass, alto saxophone, flute, guitar, harp, horn, oboe, trombone, violin, viola andcello. The collection of samples includes some extended instrumental techniques.
The database belonging to Barbancho [3], focuses on piano sounds. The research covers anextensive study on piano sounds, from a single note to a whole chord with up to ten simultaneousnotes. There are several recordings of the piano in different registrations, intensities in staccato andordinary playing techniques with the presence or absence of the damper pedal. In both databases,there are three different musical dynamics: pianissimo or p, mezzo-forte or mf and fortissimo or ff.In the current version of our research we chose to use the piano audio samples playing only the
89
MusMat: Brazilian Journal of Music and Mathematics • December 2016 • Vol. I, No. 1
one single note. The current version of our database (SDB) has an approximate size of 30 GB2.Following Section iii describes the main steps that established the construction the sound analysisand orchestration environment, named as Sound Shizuku Composition
iii. Sound Analysis Environment - Sound Shizuku Composition - SSC
The Sound Shizuku Composition or SSC 3 was built in modules that provide orchestration cues usingthe SDB, described in Section i. SSC was developed in Pure Data (PD) using a library of audiodescriptors developed by Monteiro [21] at the Interdisciplinary Nucleus for Sound Studies (NICS).Next Subsections discuss each of the modules and all the other computational routines that wasalso implemented in Pure Data. There are seven modules as follows:
• Module 1 - Selection of musical instruments and the desired instrumental techniques• Module 2 - Define orchestration blending to be evaluated by audio features• Module 3 - Calculation of orchestration algorithm of sonorities• Module 4 - Selection of the audio descriptors• Module 5 - Analysis of sonorities via audio descriptors• Module 6 - Interaction and choice of sound mixtures arranged in the GUI visual cues• Module 7 - Selection of output formats of sound mixtures in audio format and musical score
transcription
iii.1 Module 1 - Selection of musical instruments and instrumental techniques
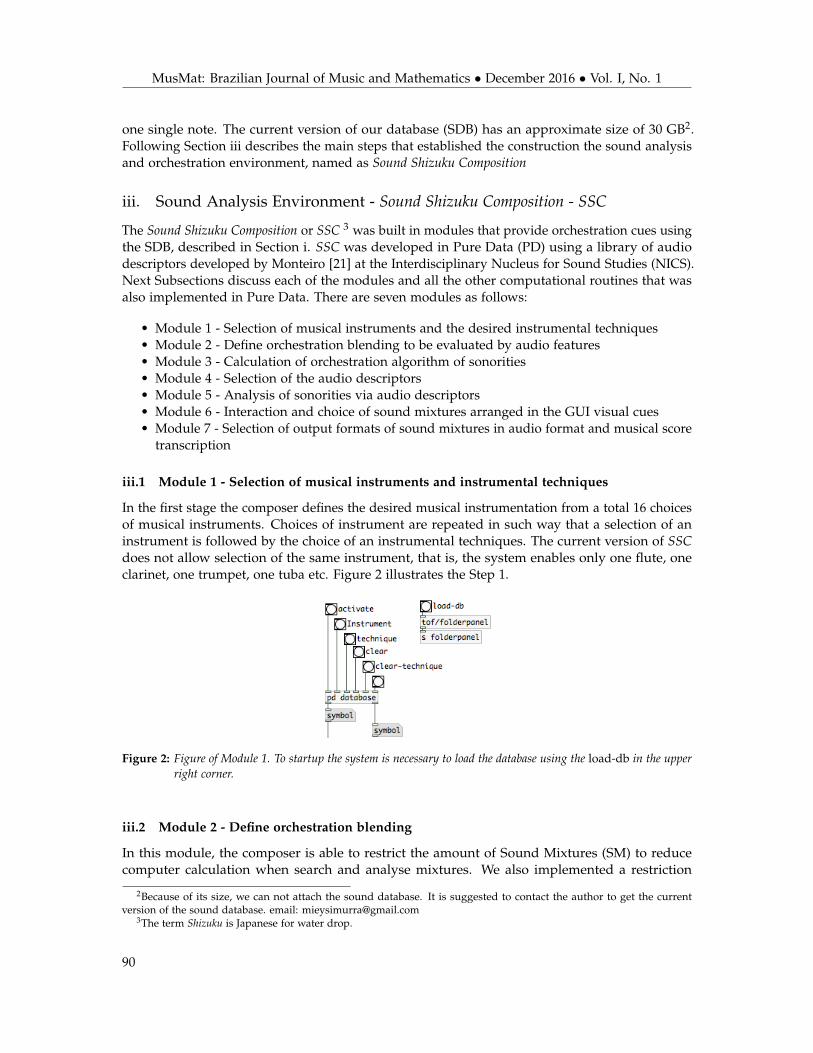
In the first stage the composer defines the desired musical instrumentation from a total 16 choicesof musical instruments. Choices of instrument are repeated in such way that a selection of aninstrument is followed by the choice of an instrumental techniques. The current version of SSCdoes not allow selection of the same instrument, that is, the system enables only one flute, oneclarinet, one trumpet, one tuba etc. Figure 2 illustrates the Step 1.
Figure 2: Figure of Module 1. To startup the system is necessary to load the database using the load-db in the upperright corner.
iii.2 Module 2 - Define orchestration blending
In this module, the composer is able to restrict the amount of Sound Mixtures (SM) to reducecomputer calculation when search and analyse mixtures. We also implemented a restriction
2Because of its size, we can not attach the sound database. It is suggested to contact the author to get the currentversion of the sound database. email: [email protected]
MusMat: Brazilian Journal of Music and Mathematics • December 2016 • Vol. I, No. 1
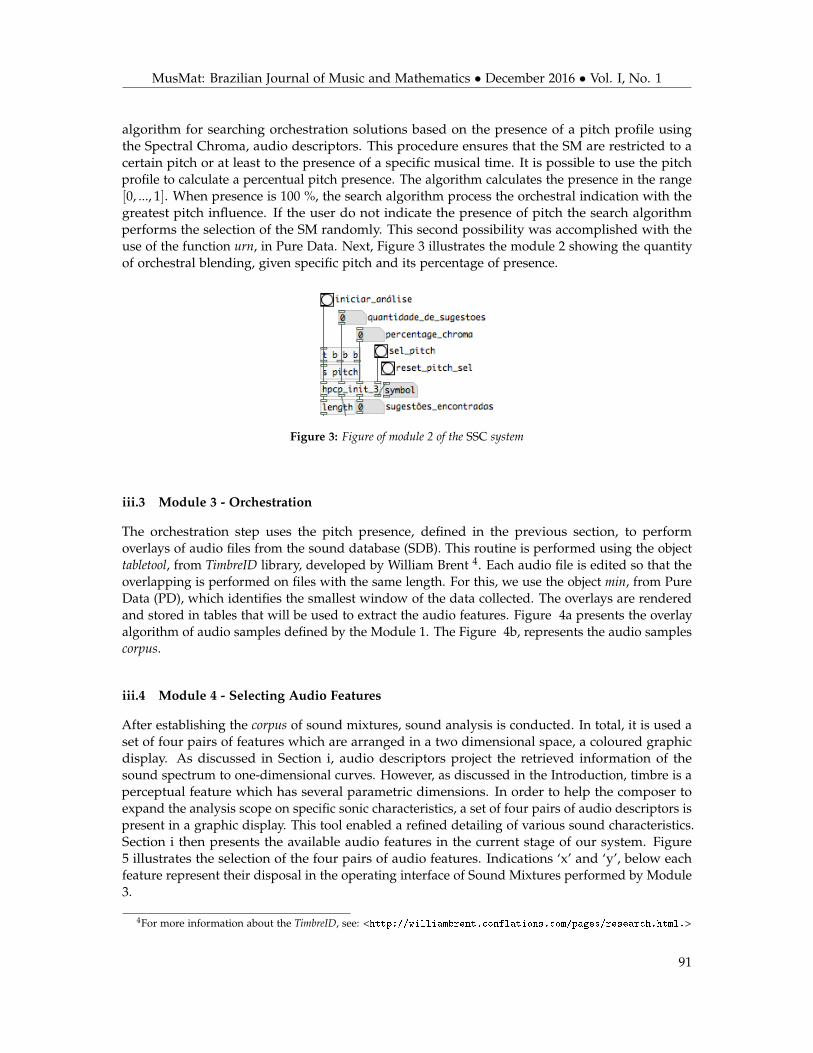
algorithm for searching orchestration solutions based on the presence of a pitch profile usingthe Spectral Chroma, audio descriptors. This procedure ensures that the SM are restricted to acertain pitch or at least to the presence of a specific musical time. It is possible to use the pitchprofile to calculate a percentual pitch presence. The algorithm calculates the presence in the range[0, ..., 1]. When presence is 100 %, the search algorithm process the orchestral indication with thegreatest pitch influence. If the user do not indicate the presence of pitch the search algorithmperforms the selection of the SM randomly. This second possibility was accomplished with theuse of the function urn, in Pure Data. Next, Figure 3 illustrates the module 2 showing the quantityof orchestral blending, given specific pitch and its percentage of presence.
Figure 3: Figure of module 2 of the SSC system
iii.3 Module 3 - Orchestration
The orchestration step uses the pitch presence, defined in the previous section, to performoverlays of audio files from the sound database (SDB). This routine is performed using the objecttabletool, from TimbreID library, developed by William Brent 4. Each audio file is edited so that theoverlapping is performed on files with the same length. For this, we use the object min, from PureData (PD), which identifies the smallest window of the data collected. The overlays are renderedand stored in tables that will be used to extract the audio features. Figure 4a presents the overlayalgorithm of audio samples defined by the Module 1. The Figure 4b, represents the audio samplescorpus.
iii.4 Module 4 - Selecting Audio Features
After establishing the corpus of sound mixtures, sound analysis is conducted. In total, it is used aset of four pairs of features which are arranged in a two dimensional space, a coloured graphicdisplay. As discussed in Section i, audio descriptors project the retrieved information of thesound spectrum to one-dimensional curves. However, as discussed in the Introduction, timbre is aperceptual feature which has several parametric dimensions. In order to help the composer toexpand the analysis scope on specific sonic characteristics, a set of four pairs of audio descriptors ispresent in a graphic display. This tool enabled a refined detailing of various sound characteristics.Section i then presents the available audio features in the current stage of our system. Figure5 illustrates the selection of the four pairs of audio features. Indications ‘x’ and ‘y’, below eachfeature represent their disposal in the operating interface of Sound Mixtures performed by Module3.
4For more information about the TimbreID, see: <http://williambrent.conflations.com/pages/research.html.>
MusMat: Brazilian Journal of Music and Mathematics • December 2016 • Vol. I, No. 1
(a) (b)
Figure 4: Figure for the audio samples overlays. In Figure 4a, the process is performed by the object tabletool, fromthe TimbreID library. Figure 4b, the overlays are stored in the corpus named mixture_II. The corpus willbe analyzed by audio features in Module 4.
92
MusMat: Brazilian Journal of Music and Mathematics • December 2016 • Vol. I, No. 1
Figure 5: Figure of the Module 4 in which the user can select the set of four pairs of audio features that will analyze thesound mixtures.
iii.5 Module 5 - Sound Mixtures Analysis
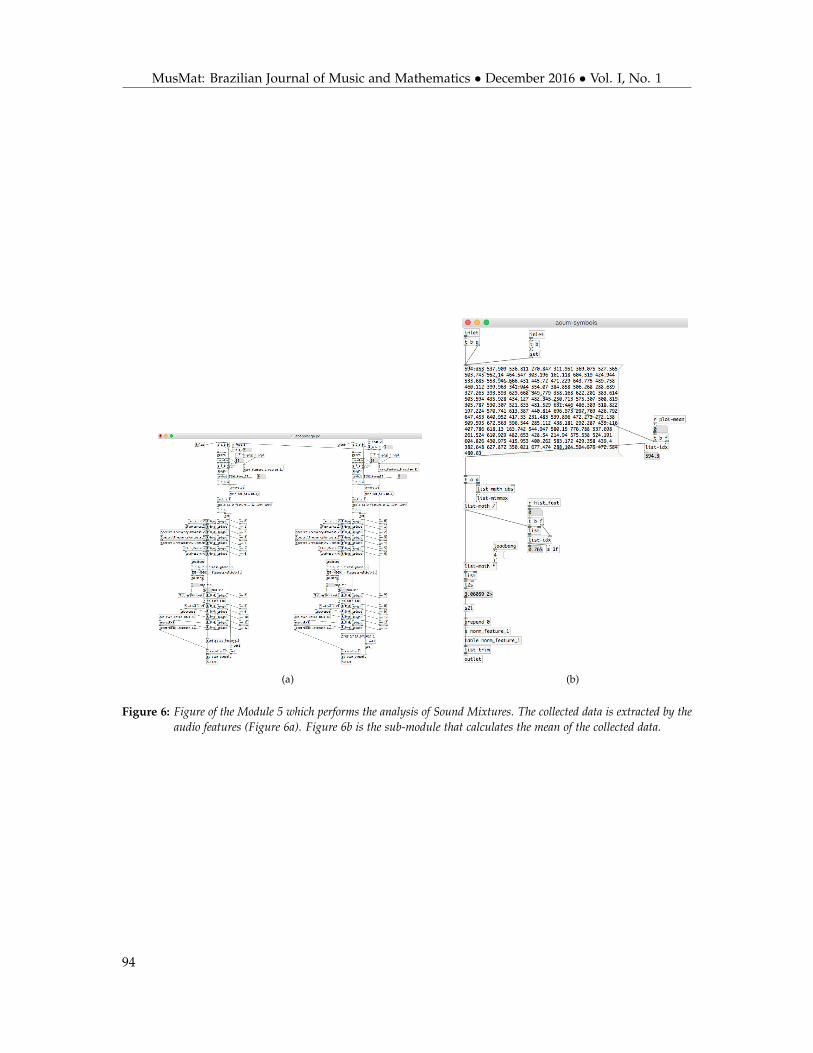
In Module 5, the system performs the sound mixtures analysis via audio descriptors. The featuresare based on the suitable PDescriptors library developed at NICS/UNICAMP [21]. It calculatesthe mean of the extracted values of each audio feature. These means are accumulated in a list ofdata to be arranged in a space for exploration and analysis. Figure 6a represents one of the fourpairs of the features chosen in module 4. In this patch the data analysis are collected. The meanof the data are stored in sub-module pd accum-symbol. These means are arranged in the space ofoperation which will be described in Module 6.
iii.6 Module 6 - Creation of the Sound Mixtures Space Exploration
this module, we have implemented a graphical user interface for the interaction, exploitation andselection of the sound mixtures. It was used sound mixtures using the GEM (Graphics Environmentfor Multimedia) library. The graphical SSC interface enables the visualization of four pairs of audiofeatures and allows up to listening to the sound mixtures arranged on the GUI. Figure 7 presentsthe patch of the sound mixtures search and the four bi-dimensional graphic visualization. Thefirst space is represented by yellow dots. The second space is represented by green dots. The thirdspace is represented by the purple dots. Finally, the fourth space is represented by red dots.
iii.7 Module 7 - Selection of Sound Mixtures and Transcriptions
Module 7 controls the system output formats and there are two specific formats: a) audio file .aifand b) music score that is performed by an external PD object called notes developed by WaverlyLabs, at New York University - NYU5. According to the description of notes the external object forPure Data was conceived as an aid for computer assisted composition (CAC), generative music,
5For more information, visit: http://nyu-waverlylabs.org/notes/.
MusMat: Brazilian Journal of Music and Mathematics • December 2016 • Vol. I, No. 1
(a) (b)
Figure 6: Figure of the Module 5 which performs the analysis of Sound Mixtures. The collected data is extracted by theaudio features (Figure 6a). Figure 6b is the sub-module that calculates the mean of the collected data.
94
MusMat: Brazilian Journal of Music and Mathematics • December 2016 • Vol. I, No. 1
Figure 7: Illustration of the Module 6 in which the user can interact with the sound mixtures in the exploitation space.In this module the user can hear the sound mixtures.
and other places where symbolic music notation might be useful. This object interprets the datacollected from the PD environment and converts them into a musical graphical notation in Lilypondformat. The symbolic data that will be converted into musical notation must be configured inthe particular syntax of the Lilypond. The module that interprets the symbolic data on musicaltranscription is called the score-ssc1.pd. Moreover, this module was not designed to produce finalscores although this is conceivable. The composer often goes to lilypond and edit, copy, combineand modify scores in various ways.
There is the object inst that receives data such as ‘musical instrument’, ‘musical pitch’, ‘dynamic’and ‘instrumental technique’. Each musical instrument has its own object inst. In general, thealgorithm receives a message with musical symbolic data and the object inst sends each informationfor its specific sub-module. The sub-module interprets the specific data and converts it in theLilypond syntax. The next step creates a single message with all the information that will beinterpreted by the notes. The diagram in Figure 8 summarizes all the steps of the musicalinformation.
Musical In-strumental
Pitch
Dynamics
InstrumentalPlaying
Techniques
SymbolicMusical Data
Lilypond formatConvertion
Figure 8: Diagram Blocks for the musical information, convertion in Lilypond format.
95
MusMat: Brazilian Journal of Music and Mathematics • December 2016 • Vol. I, No. 1
(a) (b)
Figure 9: Figure of Module 7, which selects the sound mixture and stores it in audio format and in musical notationformat in lilypond. Figure 9a is the patch interaction with the module 7. Figure 9b illustrates the score of agiven sound mixture.
In the current version of SSC, there is no temporal information for the orchestral sonorities.Each interaction will produce only an orchestral setting with previously established duration.Figure 9a illustrates the patch to store sound mixtures, in .aif format or in music sheet format, inlilypond. Figure 9b, represents an example of the score of a sound mixture.
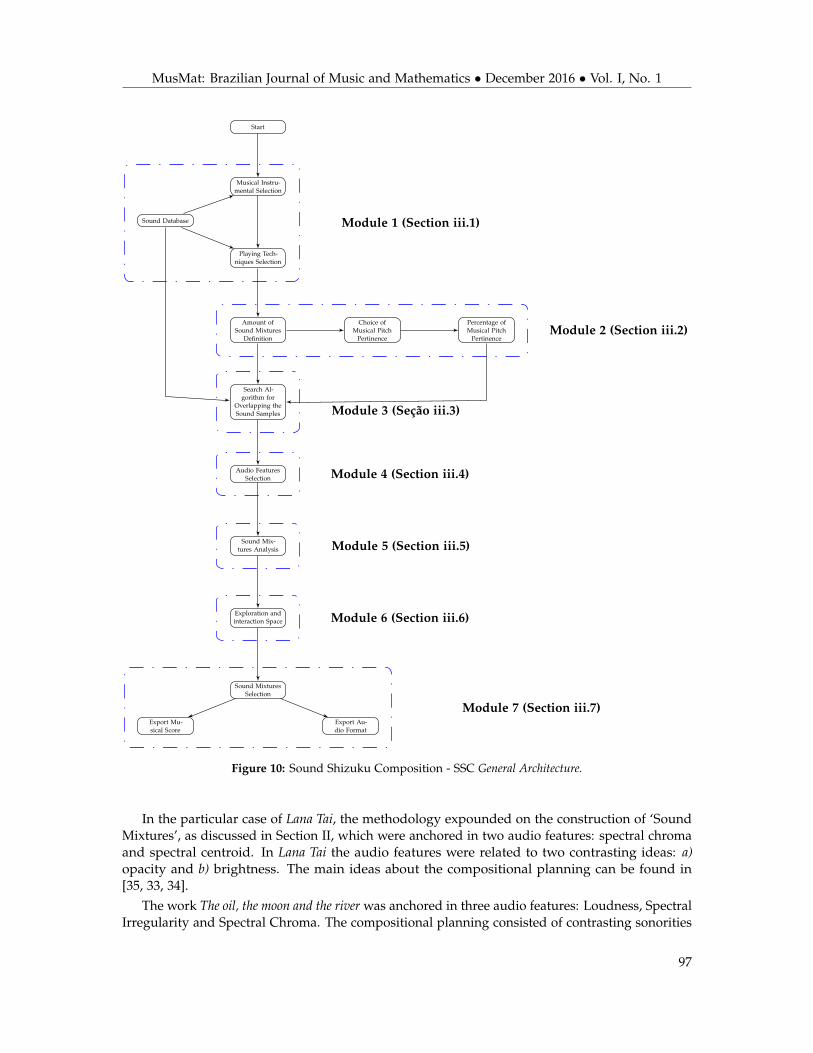
iii.8 Sound Shizuku Compostion - SSC General Architecture
In the SSC system the orchestral possibilities result from the interaction of the analysis of audiodescriptors with their potential semantic correlates. Timbre has several perceptual characteristicsthat may be intrinsically associated or orthogonally different. The sound analysis tools describecertain aspects that can highlight one or more specific characteristics related to the subjectiveattributes of timbre perception. Figure 10 illustrates the general outline for the orchestrationcomputer-aided orchestration architecture.
III. Practical Applications
The system for supporting the compositional planning presented here focus on how musicalorchestration connects two distinct universes a) instrumental extended techniques and b) compu-tational tools to analyze and statistically describe the spectral content of the material generatedby these techniques. Therefore, we developed a method to help the composer to relate: a) thehigh-level descriptions or symbolic data, called ‘sonority’ with b) the specific modes of extendedplaying techniques. Next we present three compositional that was created with the system, briefly.
96
MusMat: Brazilian Journal of Music and Mathematics • December 2016 • Vol. I, No. 1
Musical Instru-mental Selection
Start
Sound Database
Playing Tech-niques Selection
Amount ofSound Mixtures
Definition
Search Al-gorithm for
Overlapping theSound Samples
Choice ofMusical Pitch
Pertinence
Percentage ofMusical Pitch
Pertinence
Audio FeaturesSelection
Sound Mix-tures Analysis
Exploration andinteraction Space
Sound MixturesSelection
Export Mu-sical Score
Export Au-dio Format
Module 1 (Section iii.1)
Module 2 (Section iii.2)
Module 3 (Seção iii.3)
Module 4 (Section iii.4)
Module 5 (Section iii.5)
Module 6 (Section iii.6)
Module 7 (Section iii.7)
Figure 10: Sound Shizuku Composition - SSC General Architecture.
In the particular case of Lana Tai, the methodology expounded on the construction of ‘SoundMixtures’, as discussed in Section II, which were anchored in two audio features: spectral chromaand spectral centroid. In Lana Tai the audio features were related to two contrasting ideas: a)opacity and b) brightness. The main ideas about the compositional planning can be found in[35, 33, 34].
The work The oil, the moon and the river was anchored in three audio features: Loudness, SpectralIrregularity and Spectral Chroma. The compositional planning consisted of contrasting sonorities
97
MusMat: Brazilian Journal of Music and Mathematics • December 2016 • Vol. I, No. 1
called velvety and rough and the variation of their intensity in different dynamic levels. Accordingto the analysis from the spectral irregularity, we find that the different playing techniques alter thetimbre perception of each analyzed sound. Instrumental techniques which are characterized byinstrumental noise insertion tend to relate to rough and ridged sonorities. Conversely, for velvetyand smooth sounds we used certain instrumental techniques to result in clean and clear sound likewhistle tones, on flutes. In the analysis using Spectral Chroma, we find the polarization of musicalpitches in which we have established the basis of the melodic structure of the work. Publishedworks for the analysis of the composition can be found in [36].
Finally in Labori Ruinae we used audio descriptors to produce gradual timbre transformations.Such analysis was anchored in a vector consisting of a set of six audio features. The formalstructure of the work relates to the spectral transformation of five pairs of sonorities. Each sonorityhas been described by a vector with six audio descriptors. We interpolated each pair of soundfrom its degree of dissimilarity, in ascending order. We began to work with the pair of sonoritieswith lower dissimilarity index. Consequently, the work ends with the pair of the higher rate.
IV. Final Considerations
This article discussed a system to work as a new strategy on composition and orchestrationwithin the vast domain of sounds produced by extended playing techniques. The researchenabled the formal dialogue between analysis, audio descriptors with the conceptual, aestheticand subjectiveness providing to the composer a tool to be applied into the process of musicalcomposition. We presented the general architecture of the computer system and how aid toorchestration is done. In this architecture, we introduced five stages concerning to the creativeprocess: a) defines the timbre characteristics to be exploited through the audio features. Thisstep will define the aspects and timbre characteristics which will be worked compositionally; b)establishes the remarks within the space of characteristics, known as ‘Referential Remarks’; c)conducts experiments in instrumental mixtures, known as ‘Sound Mixtures’, via orchestrationof audio samples of several playing techniques. These configurations were built from a sounddatabase of various instrumental playing techniques; d) defines the orchestral settings weightedby the particular preferences of the composer. This procedure ensures the effective participationof the composer in the final result of his own musical compositional; finally e) stores the soundmixture selected by the composer in musical notation and in audio format.
We introduced the audio descriptors used in our analysis with a computer environment. Intotal there are fifteen audio descriptors available and our perspective is associated with SSCfocuses on improving and refining the algorithm analysis and the overlapping audio samplesusing techniques and tools of computer music and other computer models.
Moreover, we intend to publish other results obtained with the current version of SSC and alsofurther advance the stage of the system. One of our goals is to expand the sound database byadding more audio samples. Another issue that we will address is to study correlations betweenorchestral sonorities and text descriptions of timbre characteristics with the affective/emotionalstates that may be induced or evoked by them.
V. Acknowledgments
This paper is a partial compilation of a research developed at the Music Department and theInterdisciplinary Nucleus for Sound Studies during a PhD research studies. Simurra was supportedby FAPESP to develop his doctoral research, project 2011/23972-2 and Manzolli is supported byCNPq, under a Pq fellowship, 305065/2014-9.
98
MusMat: Brazilian Journal of Music and Mathematics • December 2016 • Vol. I, No. 1
References
[1] ANTONI, J. (2006) . The spectral kurtosis: a useful tool for characterising non-stationarysignals. Mechanical Systems and Signal Processing, vol. 20, no. 2: pp. 282–307.
[2] BALLET, G., BORGHESI, R., HOFFMANN, P., and L´EVY, F. (1999). Studio online 3.0: Aninternet ”killer application” for remote access to ircam sounds and processing tools. Journéed’Informatique Musicale (JIM).
[3] BARBANCHO, A. M., BARBANCHO, I., TARDón, L. J., and MOLINA, E. (2013). Databaseof Piano Chords: An Engineering View of Harmony. Springer, pp. 50.
[4] BERGER, K. W. (1964). Some factors in the recognition of timbre. The Journal of theAcoustical Society of America, vol. 36, no. 10.
[5] BOULEZ, P. (1987). Timbre and composition-timbre and language. Contemporary MusicReview, vol. 2, no. 1: pp. 161–171.
[6] BYRD, D., and FINGERHUT, M. (2002). The history of ismir–a short happy tale. D-libMagazine, vol. 8, no. 11.
[7] DOWNIE, J. S., BYRD, D., and CRAWFORD, T. (2009). Ten years of ismir: Reflections onchallenges and opportunities. In ISMIR, pp. 13–18.
[8] DUBNOV, S. (2004). Generalization of spectral flatness measure for non-gaussian linearprocesses. Signal Processing Letters, IEEE, vol. 11, no. 8: pp. 698–701.
[9] ESLING, P. and AGON, C. (2013). Multiobjective time series matching for audio classificationand retrieval. Audio, Speech, and Language Processing, IEEE Transactions on, vol. 21, no.10: pp. 2057–72.
[10] FLORENTINE, M., BONDING, P., et al. (1978). Loudness of complex sounds as a functionof the standard stimulus and the number of components. The Journal of the AcousticalSociety of America, vol. 64, no. 4: pp. 1036–40.
[11] FUJISHIMA, T. (1999). Realtime chord recognition of musical sound: A system using commonlisp music. In Proc. ICMC, vol. 1999, pp. 464–467.
[12] GÓMEZ, E. (2006). Tonal description of polyphonic audio for music content processing.INFORMS Journal on Computing, vol. 18, no. 3: pp. 294–304.
[13] GREY, J. M. (1977). Multidimensional perceptual scaling of musical timbres. The Journal ofthe Acoustical Society of America, vol. 61, no. 5: pp. 1270–7.
[14] GUIGUE, D. (1996). Une étude ”pour les sonorités opposées”: pour une analyse orientéeobjets de l’oeuvre pour piano de Debussy et de la musique du XXe siècle. PhD thesis,Paris EHESS.
[15] HELMHOLTZ, H. L. (1885). On the sensations of tone as a physiological basis for the theoryof music (transl. 1954).
[16] KRIMPHOFF, J., MCADAMS, S., and WINSBERG, S. (1994). Caractérisation du timbre dessons complexes. ii. analyses acoustiques et quantification psychophysique. Le Journal dePhysique IV, vol. 4, no. C5, pp. C5–625.
99
MusMat: Brazilian Journal of Music and Mathematics • December 2016 • Vol. I, No. 1
[17] LOUREIRO, M., MAGALHÃES, T., et al. (2008) Segmentação e extração de descritores deexpressividade em sinais musicais monofônicos. Seminário Música Ciência Tecnologia, vol.1, no. 3.
[18] MALT, M. and JOURDAN, E. (2008) . Zsa. descriptors: a library for real-time descriptorsanalysis. Sound and Music Computing, Berlin, Germany.
[19] MANZOLLI, J. (1988). Um modelo matemático para timbre orquestral. Dissertação deMestrado, IMECC, Unicamp, pp. 136.
[20] MISKIEWICZ, A. and RAKOWSKI, A. (1994). Loudness level versus sound-pressure level: Acomparison of musical instruments. The Journal of the Acoustical Society of America, Vol.96, no. 6: pp. 3375–79.
[21] MONTEIRO, A. C. (2012). Criação e performance musical no contexto de instrumentosmusicais digitais. Dissertação de Mestrado Instituto de Artes, Pós-graduação em Música,Unicamp.
[22] PEETERS, G. (2004). A large set of audio features for sound description (similarity anddescription) in the cuidado project. IRCAM, Paris, France.
[23] PEETERS, G. MCADAMS, S., and HERRERA, P. (2000). Instrument sound description in thecontext of mpeg-7. In Proceedings of the 2000 International Computer Music Conference,pp. 166–169. Citeseer.
[24] PEREIRA, E. (2009). Estudos sobre uma ferramenta de classificação musical. Campinas,Dissertação de Mestrado, Universidade Estadual de Campinas.
[25] PLOMP, R. (2001). The intelligent ear: On the nature of sound perception. PsychologyPress.
[26] PLOMP, R., and LEVELT, W. J. (1965). Tonal consonance and critical bandwidth. The journalof the Acoustical Society of America, vol. 38, no. 4: pp. 548–560.
[27] RIMOLDI, G. (2013). Modelagem interativa aplicada à s´ntese e espacialização no dom´niomicrotemporal. Dissertação de Mestrado Instituto de Artes, Pós-graduação em Música,Unicamp.
[28] SCHAEFFER, P. (1966). Traité des objets musicaux.
[29] SERRA, X., MAGAS, M., BENETOS, E., CHUDY, M., DIXON, S., FLEXER, A., GÓMEZ, E.,GOUYON, F., HERRERA, P., JORDà, S., PAYTUVI, O., PEETERS, G., SCHLÜTER, J., VINET,H., and WIDMER, G. (2013). Roadmap for Music Information ReSearch.
[30] SHEH, A. and ELLIS, D. P. (2003). Chord segmentation and recognition using em-trainedhidden markov models. ISMIR 2003, pp. 185–191.
[31] SHEPARD, R. N. (1962). The analysis of proximities: Multidimensional scaling with anunknown distance function. Psychometrika, vol. 27, no .2: pp. 125–140.
[32] SHIELDS, R., and KENDALL, R. (2004). The relation of timbre to dissonance and spectral fu-sion. 8th International Conference on Music Perception Cognition – ICMPC8, Evanstons,Il.
100
MusMat: Brazilian Journal of Music and Mathematics • December 2016 • Vol. I, No. 1
[33] SIMURRA, I. E. (2014). Lana tai. Revista Música Hodie, vol. 14, no. 2: pp. 249–260.
[34] SIMURRA, I. E., and MANZOLLI, J. (2014). de áudio como suporte à orquestração assistidapor computador: Croma de uma aquarela. NICS Reports, vol. 7: pp. 01–04.
[35] SIMURRA, I. E., and MANZOLLI, J. (2015). Lana tai–no dia em que nasceu uma aquarela:diário de bordo de uma composição a partir de descritores de áudio. Per Musi, vol. 31: pp.1–25.
[36] SIMURRA, I. E., and MANZOLLI, J. (2016). O azeite, a lua e o rio: o segundo diário de bordode uma composição a partir de descritores de áudio. Revista Música Hodie – vol. 16 no. 1.
[37] SMALLEY, D. (1994). Defining timbre—refining timbre. Contemporary Music Review, vol.10, no .2: pp. 35–48.
[38] STURM, B. L. (2014). The state of the art ten years after a state of the art: Future research inmusic information retrieval. Journal of New Music Research, vol. 43, no. 2: pp. 147–172.
[39] THEODORIDIS, S., and KOUTROUMBAS, K. (2008) Pattern Recognition, Fourth Edition.Academic Press.
[40] THIEDE, T. (1999). Perceptual Audio Quality Assessment Using a Non-linear Filter Bank:Gehörbezogene Qualitätsbewertung Von Audiosignalen Unter Verwendung Einer Nicht-linearen Filterbank. Mensch--Buch-Verlag.
[41] WEDIN, L. and GOUDE, G. (1972). Dimension analysis of the perception of instrumentaltimbre. Scandinavian Journal of Psychology, vol. 13, no. 1: pp. 228–240.
[42] ZWICKER, E., and SCHARF, B. (1965). A model of loudness summation. Psychologicalreview, vol. 72, no. 1: pp. 3.


![[Paper] Generalized Multiplicative Extended Kalman Filter for Aided Attitude and Heading Reference System](https://static.documents.pub/doc/80x56/55cf8fa6550346703b9e6c25/paper-generalized-multiplicative-extended-kalman-filter-for-aided-attitude.jpg)


