57
A Computer Science Perspective on Learning and Knowledge Building H. Ulrich Hoppe Universität Duisburg-Essen / COLLIDE http:// www.collide.info

A Computer Science Perspective
on Learning and Knowledge Building
H. Ulrich Hoppe
Universität Duisburg-Essen / COLLIDE
http:// www.collide.info


University of Duisburg-Essen (UDE)
founded by merger in 2013 11 Faculties

Our Department
… of Computer Science and Applied Cognitive Science in the Engineering Faculty (Duisburg)
17 professorships / groups (13 in CompSci)
Focus on Interactive Media and “Human-oriented Computing”
3 B.Sc./M.Sc. Study Programmes with approx. 1500 students
Research Group COLLIDE http://www.collide.info
Learning Analytics

Project History I
• COLDEX ("Collaborative Learning and Distributed
Experimentation", 2002-05, coord. by Collide):
collaborative modelling tools for various areas of science
learning; creation of a globally accessible repository of
learner-created models ("emerging learning objects“).
• SCY ("Science Created by You", 2008-12, U. Twente):
SCY-Lab environment facilitates learner experience
through larger "missions" ; sharing of emerging learning
objects.

Project History II
• Go-Lab (2012-16, U. Twente):
uniform access to a variety of remote laboratories, both
virtual and physical; customisable web-based learning
environments and learning analytics components.
• JuxtaLearn (2012-15, Open Univ. Milton Keynes):
fostering understanding of core science concepts
through video creation on the part of the students;
collaborative production and discussion around videos.

Project COLDEX ("Collaborative Learning and Distributed Experimentation", 2002-05)
BioTube and
Seismo Scenarios

Project COLDEX ("Collaborative Learning and Distributed Experimentation", 2002-05)
Astro and Maze
Scenarios

COLDEX – Results and „Lessons Learned“
• Notion of „emerging learning objects“ (ELOs)
• Provision of a general purpose modelling environment
(CoolModes / FreeStyler) with different „palettes“ for
various modelling languages (e.g., System Dynamics,
Petri Nets) and special applications
• Support for sharing ELOs in larger communities
through similarity based search
• Resistance of teachers against „open production“
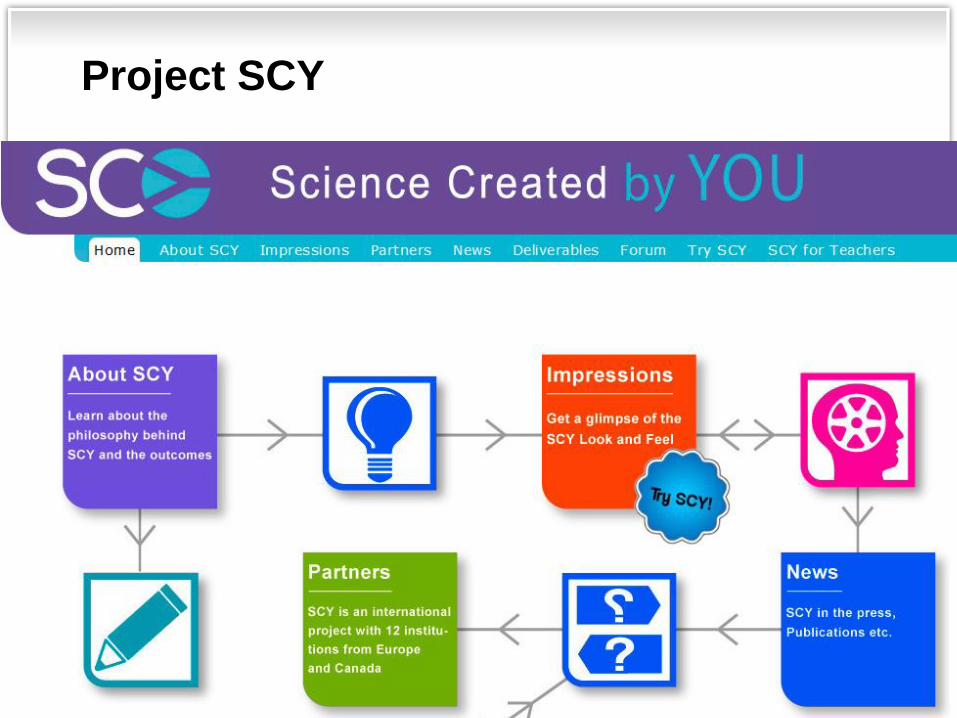
Project SCY

SCY – Tools and Architecture
In the SCY-Lab environment, students
engage in collaborative inquiry learning on
“missions” through sharing learner-
generated objects (ELOs)
Concept mapping is used as a tool for
early conceptualisation activities in a
new domain: students create concept
maps from given resource
documents

Mission “CO2-Friendly House”
Scenarios and Learning Activity Spaces

SCY-Lab Environment

SCY – Results and „Lessons Learned“
• SCY-Lab as a powerful environment (yet – might be better delivered as a web application)
• Integration of feedback/scaffolding facilitated through
multi-agent architecture
• „Mission Maps“ as navigation aids guide learners
through complex inquiry processes
• „Complexity overkill“ with big socially relevant learning
challenges

The Go-Lab Project
• Large scale use of online
labs in education.
• The Go-Lab Portal offers
students the opportunity
to perform personalized
scientific experiments.
• Teachers enhance their
classroom activities with a
personalized web-based
environment.
http://www.go-lab-project.eu/

Experimentation with Remote and Virtual Laboratories
Virtual lab: Simulation of real-
world processes.
Remote lab: Students control
real physical laboratories using a
web-interface.

Inquiry Learning at School
• Mapping of the inquiry cycle to
virtual inquiry learning spaces.
• Open Social Apps support the
activities in different phases.
Hypothesis creation
Investigation
Conclusion
Discussion
Orientation

Federation of Labs and Apps

Intelligent Student Support
• Supporting self-reflection through student dashboards.

Intelligent Student Support
• Intelligent feedback mechanisms.

Learning Analytics
Learning Analytics - a common denominator for
all types of measurement, collection, analysis and
reporting of data about learners and their learning
contexts with the aim of understanding and optimising
learning and learning environments.
big data?
(MOOCs?)
interest in algorithms &
computational methods
relation to educational
data mining?

Spectrum of Learning Analytics Topics and Applications
• Prediction of students at risk from academic
records
• Monitoring of course participation on learning
platforms (e.g. Moodle)
• „Open Learner Modeling“ as a tool for reflection
support
• Discourse and argumentation analysis

Activity analysis:
- process-oriented
- sequence analysis
(e.g. „process mining“)
- action patterns, plans
The Methodological „Trinity“ of LA
Artefact analysis:
- product-oriented
- information / text mining
- „semantic richness“
- tagging / tag analysis Network analysis:
- social or actor-artefact
relations
- network measures
(centrality, cohesion, …)
- no inherent time

Enhancing LMS with analytics: LeMo *
* Beuster/Elkina/Fortenbacher/ Kappe/Merceron/Pursian/ Schwarzrock/Wenzlaff [IDAACS 2013]

Example #1:
Analyzing student created concept maps (from project SCY)

Scaffolding of CM Construction

Agent Architecture

Ontology-based Support / Matching
keyword extraction (LDA)
ontology augmentation

Quality Assessment of CMs
Comparison to expert map(s)
Conlon, T.: 'Please argue, I could be wrong': a reasonable fallible
analyser for student concept maps. Proc. of Ed-Media 2004.
Gouli, E., Gogoulou, A., Papanikolaou, K., Griggoriadou, M.: How to
qualitatively + quantitatively assess concepts maps: the case of
COMPASS. Proc. of AIED 2005.
Generic approach using background knowledge
(a domain ontology) and information extraction
(LDA) + structural (graph-theoretical) measures

Concept Mapping Study
Participants:
37 high school students aged between 16-18
Procedure:
45 min - introduction to concept mapping
(+ tool “SCY Mapper”)
45 min - reading/highlighting of a two page text on
global warming followed by CM construction
experimental group received adaptive suggestions
control group could only access a dictionary
Expert Assessment
Four experts assessed the concept maps
produced by the students …
based on two criteria (inspired by Marra, 2002):
• completeness regarding the concepts used
• connectedness regarding the relations
introduced (adequacy, missing rel’s)

First Results
• No significant differences between scaffolded
and non-scaffolded conditions.
• Predictive power of simple structural measures
cannot be much improved by including of
semantic features (ontology).

Correlations
Correlation of structural measures
with expert judgments
Criterion 1
(completeness)
Criterion 2
(connectedness)
# nodes r = 0.79, p = 0.000 -
# edges r = 0.74, p = 0.000 r = 0.63, p = 0.000
density r = -0.53, p = 0.001 r = -0.26, p = 0.11
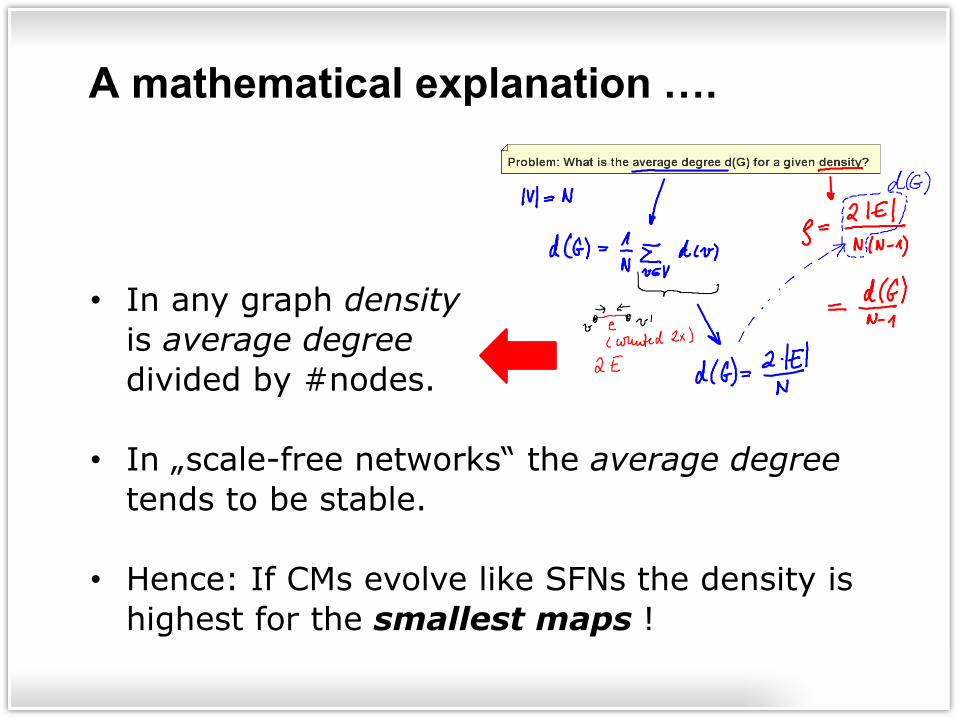
A mathematical explanation ….
• In any graph density
is average degree
divided by #nodes.
• In „scale-free networks“ the average degree
tends to be stable.
• Hence: If CMs evolve like SFNs the density is
highest for the smallest maps !

The Evolution of Scale-free Networks: Preferential Attachment
Barabási, Albert-László, Bonabeau, Eric (May 2003). "Scale-Free Networks". Scientific American 288 (5): 60–9.

A Network Perspective on Concept Maps
M. Jacobson & M. Kapur (2010): “Ontologies as scale free networks – implications for theories of conceptual change” (panel paper at ICLS 2010)
Concept maps are scale-free networks!
=> evolution of concept maps is governed
by “preferential attachment”;
density decreases with growing networks

The Litmus test
Aggregated degree distribution (from 37 maps)
left: number of nodes per degree value,
right: log-log graph
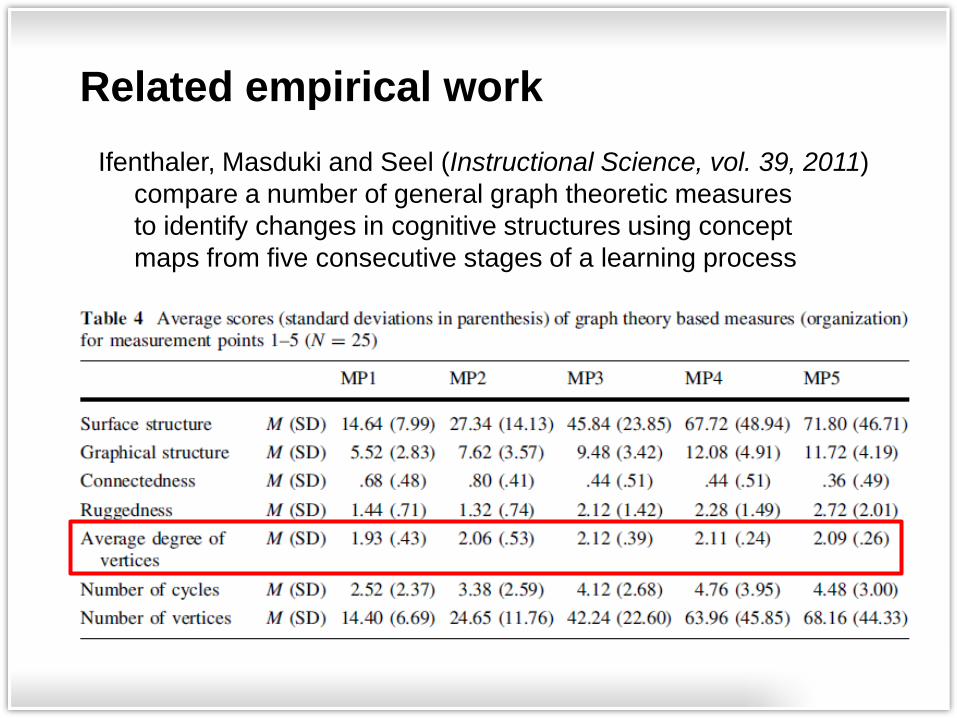
Related empirical work
Ifenthaler, Masduki and Seel (Instructional Science, vol. 39, 2011)
compare a number of general graph theoretic measures
to identify changes in cognitive structures using concept
maps from five consecutive stages of a learning process

Example #2:
Extraction of semantic networks from textual artefacts created by students (from ongoing project JuxtaLearn)

- Provoking student curiosity and understanding in science and technology through creative performance (concretely: film making – editing – sharing activities)
- Teaching and learning support is guided by threshold concepts
- First step: identifying such concepts and their appropriation by conducting face-to-face workshops with teachers and students
→ Learning Analytics techniques are used to extract representations of the underlying conceptual relations
Background: EU Project JuxtaLearn (2012-2015)

- Teacher-student workshop
- Six A-level students
- Role reversal:
students teach the teachers
- Topics: Chemistry - moles, Biology - alleles, Physics - potential energy
→ transcripts and summaries analysed using the AutoMap/ORA toolset for Network Text Analysis
Initial Workshops

- Use of the AutoMap and ORA software tools for
„network text analysis“ developed by the CASOS
group at CMU
- Workflow: • collection of workshop transcripts
(textual artefacts)
• pre-processing and analysing with AutoMap1
• visualization through ORA-Netscenes2
- Result: generation of multi-modal concept maps (with categories: actor, domain concepts, pedag. concepts …)
Network Text Analysis

Network Text Analysis - Process
Analysis Workflow

Concept Generalization -> Generalization Thesaurus
Concept Classification - actor - country - general_concept - (domain) knowledge - pedagogical_concept - role - technical_concept - tools _and_technologies
-> Meta Thesaurus
Concept generalization

Teacher-Student Workshops - Results

Extraction of information from video comments about:
- associations of concepts
(adequate or inadequate from a scientific point of view)
- identification of concepts that are frequently addressed
in questions as indicators of possible origins of
comprehension problems
- associations between concepts often used in answers
as indicators for missing relations in students’ mental
models ( => misconceptions or “stumbling blocks”)
„External“ Learning Analytics in JuxtaLearn

Case study: Khan Academy
Scaffolded questions & answers

Artefact Analysis - the JxL Approach
• Textual annotations of videos as indicators for students’
understanding and potential misconceptions
• In addition to domain concepts “signal concepts”
(difference between X and Y, help on X needed, etc.)
indicate special relations
• Benefits for…
- Researchers: insight into patterns of learning
- Teachers: monitoring learning processes around videos
- Students: system recommends videos or peer helpers

Data Selection / Extraction
• 1.284 comments from educational videos
• Video topics:
- Chemistry: Mole and Avogadro's Number
- Biology: Diffusion and Osmosis
- Physics: Voltage and Electrical Potential

Multimodal networks of
• domain concepts
• signal concepts
Resulting Multi-modal Network
Examples:
• I don’t_understand diffusion, but ….
• What’s the difference_between osmotic_pressure and solution??

Multimodal Analysis - disambiguated
Introduction of combination nodes between
domain concepts and signal concepts

Highlighting Results in Context
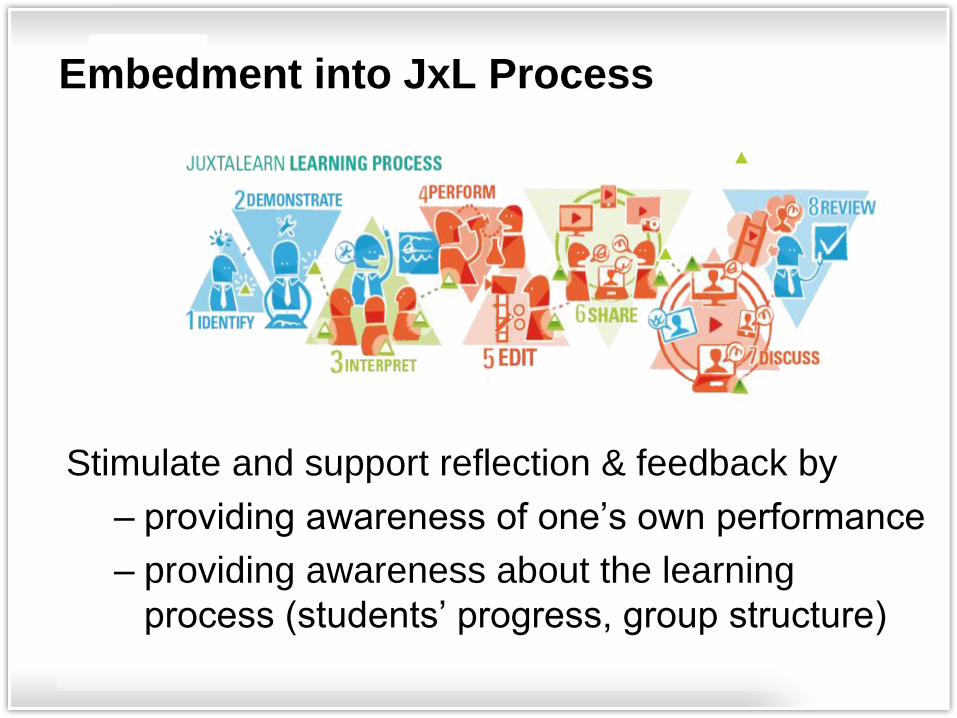
Embedment into JxL Process
Stimulate and support reflection & feedback by
– providing awareness of one’s own performance
– providing awareness about the learning
process (students’ progress, group structure)

Short Summary / Outlook
• Artefact analysis can help to identify problems
of understanding and misconceptions
• Network perspective on knowledge artefacts
facilitates new theoretical approaches
• For learning analytics combinations of the
perspectives (artefact – activity – network)
are needed!

QUESTIONS – COMMENTS ?


![Abenteuer mit Informatik A Conceptual-Modeling Approach to Data Extraction -or- “Oh the Places You [Ontologies] Will Go”](https://static.documents.pub/doc/80x56/56816948550346895de0d8ca/abenteuer-mit-informatik-a-conceptual-modeling-approach-to-data-extraction.jpg)
