A conceptual model of daily water balance following partial clearingfrom forest to pasture
M. A. Bari 1,2 and K. R. J. Smettem3,4
1Department of Environment, 3 Plain Street, East Perth, W.A. 6004, Australia2School of Earth and Geographical Sciences, Hydroscience Discipline Group, The University of Western Australia, 35Stirling Highway, Crawley, W.A. 6009, Australia3School of Environmental Systems Engineering, The University of Western Australia, 35 Stirling Highway, Crawley,W.A. 6009, Australia4Cooperative Research Centre for Plant-Based Management of Dryland Salinity, The University of Western Australia, 35Stirling Highway, Crawley, W.A. 6009, Australia
Received: 8 April 2005 – Published in Hydrol. Earth Syst. Sci. Discuss.: 3 June 2005Revised: 20 September 2005 – Accepted: 24 February 2006 – Published: 10 May 2006
Abstract. A simple conceptual water balance model repre-senting the streamflow generation processes on a daily timestep following land use change is presented. The model con-sists of five stores: (i) Dry, Wet and Subsurface Stores forvertical and lateral water flow, (ii) a transient Stream zoneStore (iii) a saturated Goundwater Store. The soil moisturebalance in the top soil Dry and Wet Stores are the most im-portant components of the model and characterize the dy-namically varying saturated areas responsible for surfacerunoff, interflow and deep percolation. The Subsurface Storedescribes the unsaturated soil moisture balance, extractionof percolated water by vegetation and groundwater recharge.The Groundwater Store controls the baseflow to stream (ifany) and the groundwater contribution to the stream zonesaturated areas. The daily model was developed followinga downward approachby analysing data from Ernies (con-trol) and Lemon (53% cleared) catchments in Western Aus-tralia and elaborating a monthly model. The daily modelperformed very well in simulating daily flow generation pro-cesses for both catchments. Most of the model parameterswere incorporated a priori from catchment attributes suchas surface slope, soil depth, porosity, stream length and ini-tial groundwater depth, and some were calibrated by match-ing the observed and predicted hydrographs. The predictedgroundwater depth, and streamflow volumes across all timesteps from daily to monthly to annual were in close agree-ment with observations for both catchments.
Over the last three decades considerable research had beenundertaken in Western Australia to understand changes instreamflow and salinity generation processes following agri-cultural clearing. Most of the research was devoted to es-tablishment and intense monitoring of a number of experi-mental catchments with different land use options. It is nowwell understood that forest clearing for agriculture has ledto an increase in groundwater recharge and rising water ta-bles. This process mobilises the salt stored in the unsatu-rated zone of the soil profile and eventually discharged it tostreams (Wood, 1924; Peck and Williamson, 1987; Schofieldand Ruprecht, 1989; Ruprecht and Schofield, 1991; Bari,1998). The magnitude of stream salinity increase is depen-dent on annual rainfall and the extent and location of clearing(Schofield and Ruprecht, 1989).
Different hydrological models have also been developedin the past to represent the changes in physical processes as-sociated with different land use and climate changes. Mostof the early models were lumped and statistical. A dis-tributed conceptual model, the Darling Range CatchmentModel (DRCM), was developed and applied to some catch-ments in the Darling Range of Western Australia (Mauger,1986). Sivapalan et al. (1996) simplified the conceptualform of DRCM and developed the Large Scale CatchmentModel (LASCAM). This model was tested, calibrated andvalidated across a range of different catchments, from smallexperimental to very large (Sivapalan et al., 2002). Topog(Vertessy et al., 1993) and WEC-C (Water and Environmen-tal Consultants-Catchment) are two other fully distributedmodels which are applicable to hill slope and experimentalscale (Croton and Barry, 2001; Croton and Bari, 2001).
Published by Copernicus GmbH on behalf of the European Geosciences Union.
322 M. A. Bari and K. R. J. Smettem: A conceptual model of daily water balance
32
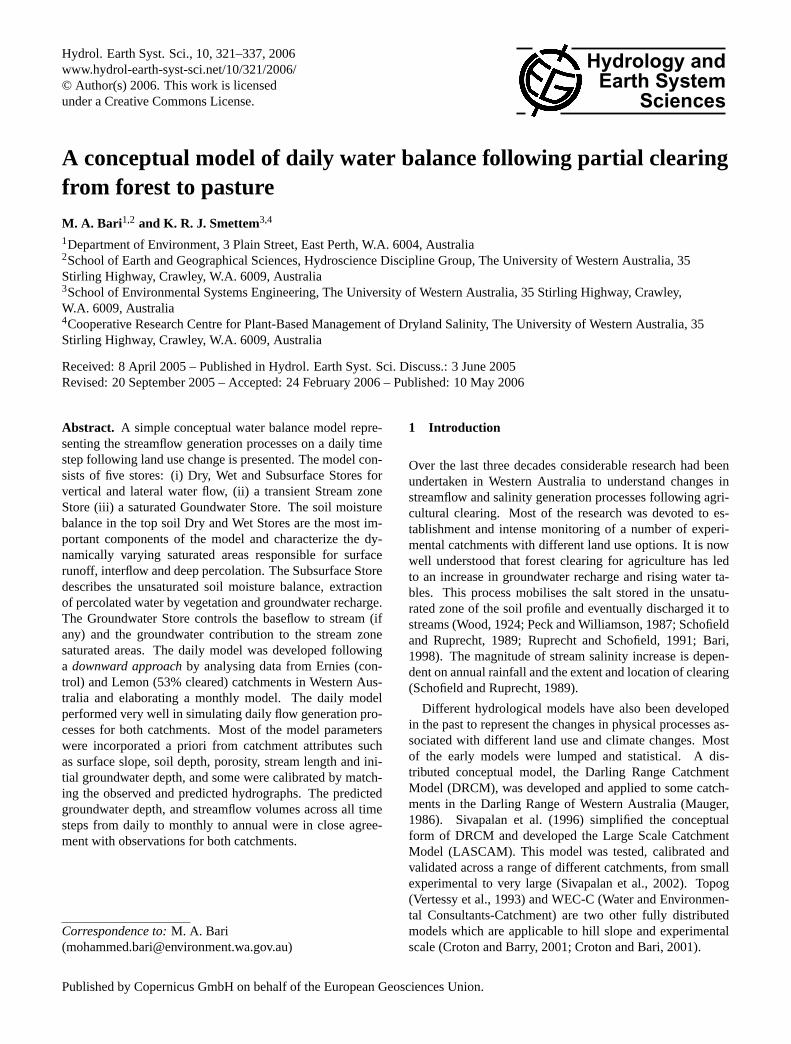
Fig. 1. Location of the experimental catchments
Fig. 1. Location of the experimental catchments.
Although distributed hydrological models are applied allover the world, it is now well understood that the basic limita-tions of these models to represent catchment response with asmall number of parameters, is due to their inability to repro-duce dynamic variation of saturated areas within the catch-ment (Beven, 1989; Binley et al., 1989; Beven, 2001). Infact, the dynamic variation of the saturated area, a functionof accumulation and horizontal movement of water in the topsoil layers, is mainly responsible for the highly non-linearnature of catchment response to storm events (Ruprecht andSchofield, 1989; Todini, 1996). Most of the existing concep-tual and semi-distributed models require a large number ofparameters to represent dynamic variation of the saturated ar-eas. Many of these parameters lack physical meaning as theyrepresent averages at catchment or subcatchment scale. Al-though different automatic calibration techniques have beendeveloped to estimate model parameter sets of particular ap-plications (Duan, 2003), recent comparisons of the perfor-mance of different conceptual rainfall runoff models revealthat model performance depends more on model structureand data quality than on model complexity (Perrin et al.,2001; Gan and Biftu, 2003).
The downward approachin model building, originallyadopted by Klemes (1983), has revealed new insights intothe parsimony of conceptual model structures in WesternAustralia and other parts of the world (Jothityangkoon etal., 2001; Atkinson et al., 2002; Farmer et al., 2003). Themodel building procedure shows that scale of interest, both
time (annual to hourly) and space (point to∼1000 km2),determines the model complexity requirements. These re-cent works have been devoted to water balance prediction ofsteady-state catchments only.
Data collected from experimental catchments in the south-west of Western Australia show different rates of groundwa-ter level rise, originally not connected to stream invert, fol-lowing clearing of deep-rooted native forest for pasture de-velopment. When the rising groundwater level reaches thestream invert and creates groundwater-induced saturated ar-eas, streamflow and salt discharge increases greatly (Crotonand Bari, 2001; Ruprecht and Schofield, 1989). Bari andSmettem (2004) followed thedownward approachto iden-tify the minimal model structure and complexity required torepresent the changes in streamflow generation process fol-lowing land use changes on a monthly time step.
In this paper we extend the work of Bari and Smettem(2004) to examine the additional complexity and structuralchanges required, then develop a model to represent runofffollowing land use change on a daily time step. Data obtainedfrom two experimental catchments (Lemon and Ernies –treated and control respectively) were analysed further to un-derstand the processes and then the monthly model was elab-orated accordingly. The daily model consists of three maincomponents: (i) Dry, Wet and Subsurface Stores for verticaland lateral unsaturated water flow, (ii) Stream zone Store and(iii) a saturated Groundwater Store. The main inclusion is theDry and Wet Stores and a probability distribution function
M. A. Bari and K. R. J. Smettem: A conceptual model of daily water balance 323
33
N
#S#S
Uncleared
3 70
340
360
350
35
370
33
360
360Ernies catchment
350
350
375325
350
350
325 350
G61219203
G61218757
ð
SSS
S
S
S#
#
##
#
275375
375
Lemon catchment
Cleared
300
275
325
300
325
350
350
35032
5325
350
350350
Uncleared
6315000 N
4440
00 E
G61218706
G61218707
G61218708 G61218709
G61218757
G61218740
500 0 500 1000 1500 Metres
Stream5m Contours
Track
Forest
Legend
Catchment
Discharge area
#S
#
Bore locationSample location
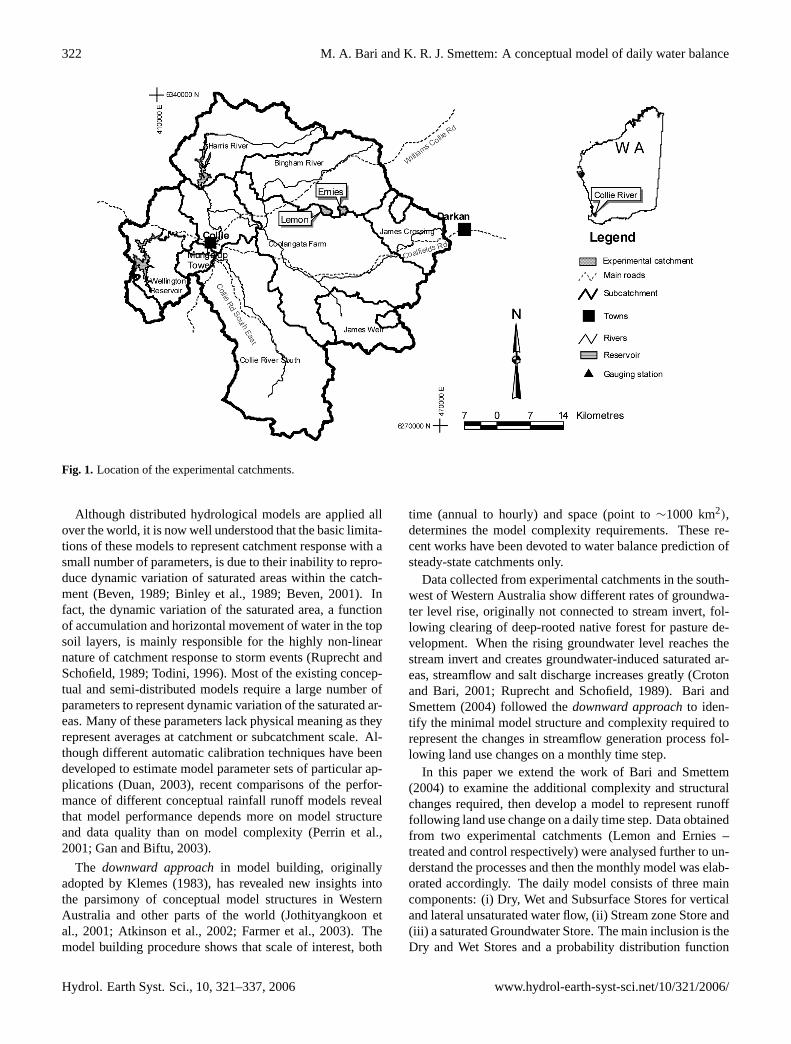
Fig. 2. Detail set up of Ernies and Lemon catchments
Fig. 2. Detail set up of Ernies and Lemon catchments.
for catchment soil moisture stores and dynamic variation ofthe conceptual groundwater level. The objective of the dailymodel is to represent streamflow changes following clearingof native forest with the minimal number of parameters nec-essary to represent the key processes whilst retaining somephysical meaning. Some of the parameters can be estimateda priori but others do require some calibration. We are ul-timately interested developing a basin-scale model in whichthis model will serve as “building block” and additional par-simony can be achieved by giving regionalized estimates forsome parameters.
2 Catchment description
The Lemon and Ernies catchments are located in the Col-lie River catchment, south-west of Western Australia, about250 km south of Perth (Fig. 1). These catchments havea Mediterranean climate, with cool, wet winters and warmto hot, dry summers. The Class A annual pan evaporationand annual rainfall are approximately 1600 mm (Luke et al.,1988) and 650 mm respectively. The soil profile typicallyconsists of 0.5–6.5 m highly permeable top soil overlying10–30 m of clay with low permeability. The areas of Lemonand Ernies catchments are 344 ha and 270 ha respectively,and surface slopes average 12% and 5% respectively. The
324 M. A. Bari and K. R. J. Smettem: A conceptual model of daily water balance
34
Fig. 3. Comparison of daily streamflow between Ernies and Lemon catchments: (a) 1981, (b)1990
Fig. 3. Comparison of daily streamflow between Ernies and Lemon catchments:(a) 1981,(b) 1990.
vegetation was an open forest dominated by jarrah (Euca-lyptus marginata). In the summer of 1976–1977, 53% ofthe Lemon catchment was logged and was sown to cloverand grasses for grazing sheep (Fig. 2). The objective wasto understand changes on flow and salinity generation pro-cesses following clearing. The Ernies catchment remainedas a forested control. Both catchments were instrumented tomeasure salt and water balances. Rainfall and salt fall wererecorded by pluviometers and the streamflow was measuredat a sharp-crested V-notch weir for the period 1974–1998.Electrical conductivity of the stream water was continuouslymeasured using a toroidal cell. At Lemon catchment, a net-work of 72 bores was installed to monitor the groundwaterlevels. Groundwater level and salinity were recorded fromsome of the bores during 1977–1998. Five sites were selectedin each of the catchments to collect soil moisture content andsalt storage (Fig. 2). Hydraulic conductivity of the pallidzone and top soils were also measured (Peck and Williamson,1987).
3 Streamflow generation process
During the pre-treatment period, a similar runoff responsewas observed for both catchments and the groundwater levelwas about 15–20 m below the stream invert (Ruprecht andSchofield, 1991). Following clearing, the deep, permanentgroundwater system beneath the Lemon catchment started torise due to lower evapotranspiration. Groundwater level in-tersected the surface by 1987 and by 1996 achieved a newstability (Bari and Smettem, 2004). After heavy rainfall,a shallow intermittent groundwater system develops on caprock or clay, saturates part of the stream zone and generatesstreamflow by saturation excess overland flow and interflowprocesses. Immediately following clearing, the flow durationof Lemon catchment increased and started flowing about amonth earlier than Ernies catchment (Fig. 3a). The ground-water induced stream zone saturated area increased from nilbefore clearing to 8% of the catchment area in 1990s. Therewas an approximately 1400 mm increase in unsaturated soil
water storage (Bari and Smettem, 2004). When the ground-water system reached the stream bed, streamflow increasedfurther, became perennial and in the dry summer months wasdominated by the baseflow (Fig. 3b).
4 Model description
A downward approachoriginally advocated by Klemes(1983) was followed in developing the daily water balancemodel. Annual data from experimental catchments (withdifferent land use) were analysed and a simple water bal-ance model was developed which needed minimal calibra-tion (Bari et al., 2005). Further analyses of monthly datademonstrated that a minimal model structure of four inter-connecting stores was necessary to represent the landscapehydrological processes (Bari and Smettem, 2004). The fourstores for the monthly water balance model were: (i) Up-per Store, (ii) Subsurface Store, (iii) Groundwater Store and(iv) Stream zone Store (Fig. 4). The Upper Store generatessurface runoff (Qr1), interflow (Qi) and percolation to theSubsurface Store (I ). Trees use most of the percolated waterand little recharges the Groundwater Store. When ground-water discharges to the stream, a transient Stream zone Storeis created. Additional surface runoff (Qr2) is generated fromthe “impervious” stream zone saturated area.
We applied the monthly model with the calibrated param-eter set for both Ernies and Lemon catchments on a dailytime step. The model predicted flow duration quite well butwas unable to reproduce the daily peakflow and recessions(Fig. 5). Therefore, we introduced additional complexity andstructural changes into the model to better represent dailyprocesses. The Upper Store was partitioned into Dry andWet Stores, recharge to groundwater was also divided intopreferential and matrix flow, and the interception componentwas elaborated (Fig. 6).
M. A. Bari and K. R. J. Smettem: A conceptual model of daily water balance 325
35
Fig. 4. Schematic representation of a hill slope by four-store model (after Bari and
Smettem, 2004)Fig. 4. Schematic representation of a hill slope by four-store model(after Bari and Smettem, 2004).
36
Fig. 5. Observed and predicted daily streamflow at Ernies catchmentsFig. 5. Observed and predicted daily streamflow at Ernies catch-ments.
4.1 Evapotranspiration
Evapotranspiration is a major component of the hydrologi-cal cycle in the south-west of Western Australia. About 90%of the annual rainfall is lost by evapotranspiration (Sharma,1983). Annual average interception by mature jarrah forestranges from 13% to 15% of annual rainfall (Croton and Nor-ton, 1998). In the monthly model we set interception to 13%of rainfall (Bari and Smettem, 2004). For the daily model ad-ditional complexity was added as a function of daily rainfall,Leaf Area Index (LAI) and interception storage of the forestcanopy. The maximum interception or canopy storage capac-ity (Csmx) is determined by assuming that canopy saturationoccurs once a certain amount of water accumulates over theplant foliage surface:
Csmx = CiLAI (1)
37
Fig. 6. Flow chart of the hydrological sub-processes in the water balance modelFig. 6. Flow chart of the hydrological sub-processes in the waterbalance model.
The actual interception (Ia) is modelled by a simple account-ing procedure. Actual canopy storage,Cs(t, t+1), during theperiod(t, t+1), depends upon the rainfall and actual storageof the previous time step:
Cs(t+1) = Cs(t)+R(t, t+1) if [Cs(t) + R(t)] < Csmx(2a)
Cs(t + 1) = Csmx if [Cs(t) + R(t)] > Csmx (2b)
Ia = Cs − PET if PET < Cs (3a)
Ia = Cs if PET > Cs (3b)
Effective rainfall (RE) passes through the plant canopyand becomes available for infiltration. Evapotranspirationdemand is reduced and residual potential evapotranspiration(RET) is the energy available for plant transpiration and soilevaporation.
RE(t + 1) = R(t, t + 1) − Ia(t + 1) (4)
RET = PET − Ia (5)
Representation of the actual soil evaporation and planttranspiration of the daily model remained identical to themonthly model (Bari and Smettem, 2004). These two pro-cesses take place from all five stores of the model. The soilevaporation depends upon the moisture content of the stores,
326 M. A. Bari and K. R. J. Smettem: A conceptual model of daily water balance
and Leaf Area Index. Plant transpiration is a function of rel-ative root volume in different stores (RTu, RTt ), residual po-tential evaporation, soil moisture content of different stores,Leaf Area Index and a biological parameter (αt ). For exam-ple soil evaporation from Dry (Esd ) and transpiration fromWet Stores (Etw) are expressed as:
Esd = RETWd
Wdmx + Wwmx
e−csLAI (6a)
Etw = αtRETRTu
RTt
[1 −
(1 −
Ww
Wwmx
)tu]LAI
LAImx
(6b)
4.2 Unsaturated soil water accounting
The unsaturated profile plays an important role in stream-flow generation processes in Western Australia. Depth of theprofile varies across the different rainfall zones. In the HighRainfall Zone (>1100 mm yr−1) the permanent groundwaterlevel lies within 2 m of the stream invert. Therefore, the ver-tical thickness of the unsaturated profile is the shortest. In theLow Rainfall Zone (<900 mm yr−1), under pristine land use,the thickness of the unsaturated profile is in excess of 20 m(Bari and Smettem, 2004). Soil profile data analyses revealthe presence of two distinctive soil horizons. The top soilconsists of 1–7 m thick highly conductive gravelly and sandylaterite. This layer overlies less permeable sandy loams andkaolinitic clay (Johnston, 1987). Often a cemented layer ofaluminosilicate (hard pans) exists below 2–3 m of the topsoil, particularly along the stream zone (Pettit and Froend,1992). Therefore, in the monthly model we divided the un-saturated soil into two stores: (i) Upper Store (ii) SubsurfaceStore (Fig. 4).
When the monthly model was applied on a daily time stepwith updated parameter sets, the peakflow and recessionscould not be predicted (Fig. 5). We postulated that the sharphydrograph rise to peaks and similarly sharp, early reces-sions were due to the formation of dynamic saturated areasalong the stream zone following significant rainfall. At thetreated (Lemon) catchment, further complexity in the dailyflow generation process was evident when the groundwaterlevel reached the streambed. Therefore, a non-linear prob-ability distribution of the depth of the top soil and its wa-ter holding capacity was adopted to represent the dynamicvariation of the saturated areas. A similar concept has beenapplied in other models. For example, in the Xinanjiangmodel the spatial distribution of soil moisture capacity wasexpressed in two probability distribution functions – one upto the field capacity and the other from field capacity to satu-ration (Zhao and Liu, 1995). In the VIC and ARNO modelsa single distribution function was used to describe the soilmoisture capacity (Wood et al., 1992; Todini, 1996). Themajor advantage of this approach is that the catchment soilmoisture balance is functionally related by simple analyticalexpressions to the dynamic contributing areas. Therefore,we incorporate additional complexity and structural changes
into the Upper Store of the monthly model to represent thedaily soil water movement by two inter-connecting stores: (i)Dry Store and (ii) Wet Store.
4.2.1 Dry Store
We know from field observations that up to the drained up-per limit or so-called “field capacity”, the soil matrix has theability to hold water against gravity. The water held againstgravity is available for evapotranspiration only. We definethis water holding capacity of the soil matrix as the “DryStore”. Soil depth, physical properties and “field capacity”determine the potential volume of the Dry Store. Based onextensive drilling carried out in these experimental catch-ments, considerable information exists on the depth and dis-tribution of the top soil layer. Typical depth generally rangesfrom 1 to 7 m and the probability distribution function fitsextremely well to the measured soil depth distribution (Siva-palan and Woods, 1995). Due to the very high infiltrationcapacity of surface soils, we assume that effective rainfall(RE) rapidly infiltrates into the soil matrix. Soil moistureretention capacity (wd) below any elementary surface area isa function of its field capacity (θf ) and soil depth (d ′), suchthat:
wd = d ′θf (7)
Assuming an empirical distribution of soil depths over thecatchment, we represent the water holding capacity by a cu-mulative probability distribution function (Fig. 7a). A catch-ment of surface areaAt consists of pervious and impervious(Ai) areas. If we denoteAw as the part of the catchmentwhere the water content has reached or exceeded field capac-ity, then we can represent it as a proportion of catchment areaas:
x =(Aw − Ai)
(At − Ai)= 1 −
(1 −
wd
wdm
)b
(8)
In the above equation,b is a parameter andwdm is the max-imum possible water retention capacity of any elementaryarea within the catchment. After effective rainfall (RE), partis retained in the Dry Store (Fig. 7) and the other is released(Rf ) as:
Rf =At − Ai
At
wd+RE∫wd
x (σ )dσ if (wd + RE) < wdm (9a)
Rf =At − Ai
At
(wd + RE − wdm) +
wdm∫wd
x (σ )dσ
if (wd + RE) > wdm (9b)
The above two equations can be expressed in termsof catchment average storage (Wd) and maximum storage
M. A. Bari and K. R. J. Smettem: A conceptual model of daily water balance 327
38
Fig. 7. Cumulative distribution of elementary area (a) water retention at field capacity and (b)
generation of excess water.
Fig. 7. Cumulative distribution of elementary area(a) water retention at field capacity and(b) generation of excess water.
(Wdmx) in the Dry Store. After integration:
Rf =At − Ai
At
RE − Wdmx + Wd + Wdmx
{(1 −
Wd
Wdmx
) 1b+1
−RE
(b + 1) Wdmx
}b+1
if 0 < RE < (b + 1)Wdmx
(1−
Wd
Wdmx
) 1b+1
(10a)
Rf =At − Ai
At
[RE − (Wdmx − Wd)]
if RE ≥ (b + 1)Wdmx
(1−
Wd
Wdmx
) 1b+1
(10b)
Therefore the Dry Store water content update at time (t+1)is:
Wd(t + 1) = Wd(t) + RE(t, t + 1) − Etd(t, t + 1)
−Esd(t, t + 1) − Rf (t, t + 1) (11)
4.2.2 Wet Store
The Wet Store represents moisture content in the soil ma-trix from field capacity to saturation. Water held in this storeis free to travel through or across the soil matrix. The WetStore represents the development of an intermittent shallowgroundwater table and contributes interflow (lateral flow) tothe stream and percolation (vertical flow) to the underly-ing Subsurface Store. Soil evaporation and transpiration (ifany) also take place from this store. The Wet Store controlsthe formation of the variably contributing dynamic saturatedarea and surface runoff. It is extended up to the area wherethe moisture content has reached or exceeded field capacity(Fig. 8). The Wet store occupies a fraction (or whole) of thecatchment, part of which is saturated. Like the Dry Store, thecapacity of any elementary area where the water content hasexceeded field capacity can be written as:
ww = d ′(θs − θf ) (12)
39
Fig. 8. Generation of surface runoff following a rainfall event.Fig. 8. Generation of surface runoff following a rainfall event.
We assume that the Wet Store capacity is non-uniformly dis-tributed over the area (Aw), where excess water is being pro-duced (Fig. 8). Part of the Wet Store may reach saturation(As), the proportion of which can be expressed as:
y =(As − Ai)
(Aw − Ai)= 1 −
(1 −
ww
wwm
)c
, As ≤ Aw (13)
In the above equationww is the elementary area water con-tent at saturation andwwm is the maximum possible watercontent in any elementary area within the catchment.
The total surface runoff generated by the catchment hastwo components: (i) from the pervious area (Qr1) and (ii)from the impervious area (Qr2) (Fig. 8). It can be calculatedas:
328 M. A. Bari and K. R. J. Smettem: A conceptual model of daily water balance
Qr =Ai
At
RE + x
(ww + Rf − wwm) +
wwm∫ww
y (σ )dσ
if (ww + Rf ) > wwm (14c)
After integration and transformation we get:
Qr =Ai
At
RE +
[1 −
(1 −
Wd
Wdmx
) bb+1]Rf − Wwmx + Ww + Wwmx
{(1 −
Ww
Wwmx
) 1c+1
−Rf
(c + 1) Wwmx
}c+1
if 0 < Rf < (c + 1)Wwmx
(1−
Ww
Wwmx
) 1c+1
(15a)
Qr =Ai
At
RE +
[1 −
(1 −
Ww
Wwmx
) bb+1]
[Rf − (Wwmx − Ww)]
if Rf ≥ (c + 1)Wwmx
(1−
Ww
Wwmx
) 1c+1
(15b)
The representation of daily interflow and percolation (therate of lateral and vertical drainage from the top soil matrix)remained practically unchanged from the monthly model butwe now assume they occur only from the Wet Store and canbe expressed as:
Qi = 0 if Ww < Wwi (16a)
Qi = Kul
(Ww − Wwi
Wwmx − Wwi
)ia
x if Ww > Wwi (16b)
I = Kuv
[1 + pb
(1 −
Wl
Wlmx
)pa](Ww
Wwmx
)x (17)
Water content update of the Wet Store at time (t+1) is:
Ww(t + 1) = Ww(t) + Rf (t, t + 1) − Etw(t, t + 1)
−Esw(t, t + 1) − Qr1(t, t + 1) − Qi(t, t + 1) − I (t, t + 1)
(18)
4.2.3 Subsurface Store
The Subsurface Store represents the deep unsaturated soilprofile and acts as a delay function for effects of risinggroundwater level on streamflow and salinity (Bari and Smet-tem, 2004). Recharge from the Subsurface to the Groundwa-ter Store occurs in two different processes: (i) from soil ma-trix as excess flow (Rl1), and (ii) preferential flow from pre-ferred pathways (Rl2). Both these processes are accountedfor in this model by incorporating additional complexity tothe monthly model. Similar to the Dry Store, we define thatthe soil water capacity of any elementary area is a function ofdepth (d ′
g−d ′), porosity (φl) and field capacity (θlf ) and can
be described by a distribution function. Therefore, rechargefrom the soil matrix can be calculated as:
Rl1 =
wl+I∫wl
x′ (σ )dσ if (wl + I ) < wlm (19a)
Rl1 =
(wl + I − wlm) +
wlm∫wl
x′ (σ )dσ
if (wl + I ) > wlm (19b)
After integration and transformation the above two equa-tions become:
Rl1 =
I − Wlmx + Wl + Wlmx
{(1 −
Wl
Wlmx
) 1a+1
−I
(a + 1)Wlmx
}a+1
(20a)
Rl1 = [I − (Wlmx − Wl)] (20b)
When the water content in the Subsurface Store becomesless than the catchment wide field capacity (Wldmx), the ex-cess water (Rl1) is recycled for transpiration and recharge tothe groundwater store becomes zero. The second componentof groundwater recharge represents preferential flow to theGroundwater Store. It is represented by the following for-mula (Averjanov, 1950):
Rl2 = 0 if Wl < Wldmx (21a)
Rl2 = Klv
(Wl − Wldmx
Wlmx − Wldmx
)3.3
if Wl > Wldmx (21b)
Therefore, total recharge to groundwater store becomes:
Rl = Rl1 + Rl2 (22)
The groundwater level, Subsurface Store and Groundwa-ter Store contents (1dg,1Wl ,1Wgl) change due to recharge(Rl) to the Groundwater Store, loss of groundwater belowthe gauging station (Qloss), baseflow to the stream zone(Qbl) and transpiration from groundwater (Etg) (Fig. 6). Therepresentation of these processes in the daily model remainedunchanged from the monthly model. The exchange of waterbetween the Subsurface and Groundwater Stores is expressedas:
1Wgl =
(1dg
d ′g − d
)Wl if 1dg < 0 (23a)
1Wgl =
(1dg
dl − d ′g
)Wg if 1dg > 0 (23b)
Therefore the Subsurface Store content at time (t+1) is:
The initial pre-clearing position of the groundwater store isknown and the balance of the store is controlled by dischargeloss from the store, recharge and baseflow to the stream zone.The volume of the Groundwater Store depends on the loca-tion of the conceptual groundwater level and remained iden-tical to the monthly model (Fig. 4). When the conceptualgroundwater level does intersect the stream, it contributes tostreamflow and indirectly controls the groundwater-inducedsaturated areas, predominantly in the stream zone. We alsoincorporated a groundwater loss function to represent theslow migration of the regional groundwater system and lossthrough the fractured basement. Baseflow to Stream zoneStore and groundwater loss can be expressed as:
Qbl = KllL∣∣(ds − dg)
∣∣ tanβ if dg < ds (25a)
Qbl = 0 if dg > ds (25b)
Qloss = ClossWg (26)
Therefore the Groundwater Store update at any time (t+1)is:
Wg(t + 1) = Wg(t) + Rl(t, t + 1) − Qloss(t, t + 1)
−Qbl(t, t + 1) − 1Wgl(t, t + 1) − Etg(t, t + 1) (27)
4.4 Stream zone Store
This store is transient and covers part of the Dry and WetStores. Representation of this store became more complexdue to the conceptualization of the Dry and Wet Stores.This store content is also influenced by soil evaporation, andloss/gain to/from the Dry Store due to contraction/expansionof the saturated area. All the effective rainfall (RE) whichfalls on the stream zone, becomes runoff (Qr2). Stream zoneStore water content at any time is expressed by:
Wsg = 0 if dg > ds (28a)
Wsg =Ai
At
(wdm
b + 1+
wwm
c + 1
)if dg < ds (28b)
Soil evaporation (Ess) and plant transpiration (Ets) alsotakes place from this store. The residual of the baseflow com-ing to the stream zone becomes actual baseflow to stream:
Qb(t + 1) = Qbl(t, t + 1) − Ess(t, t + 1) − Ets(t, t + 1) (29)
We assume a complete ‘displacement’ of Wet Store andStream zone Store water contents and free mixing due tocontraction or expansion of the saturated area. When thegroundwater level increases and the stream zone saturatedarea expands (1Ai), the Dry Store loses water to the streamzone and vice versa. It can be calculated as:
1Wsg =
(1Ai
At
)wdm
b + 1if 1dg < 0 (30)
Therefore the Stream zone Store water content update at anytime (t+1) is:
Wsg(t + 1) = Wsg(t) + 1Wsg(t, t + 1) (31)
4.5 Total streamflow
Total streamflow is the sum of surface runoff, interflow andbaseflow components and can be expressed as:
Qt = Qr + Qi + Qb (32)
5 Data requirements and calibration
For the Ernies catchment, the first five years of data wereused for calibration. As there were significant changes inland use and flow generation processes at the Lemon catch-ment, streamflow and groundwater data up to 1987 wereused for calibration. The rest of the streamflow data wasused for model verification. A trial and error method wasadopted for calibration of the model. The model performancewas evaluated by matching the: (i) observed and predicteddaily streamflow hydrographs and (ii) conceptual and ob-served groundwater levels. A set of statistical criteria was de-fined for measuring the agreement between the predicted andobserved streamflow for both the Ernies and Lemon catch-ments. The statistical criteria include: (a) flow-period ErrorIndex (EI), (b) Nash-Sutcliffe Efficiency (E2) and (c) Cor-relation Coefficient (CC) (Table 1). For an acceptable cal-ibration, both theE2 andCC for monthly streamflow wereset to be greater than 0.8.
In the model Ernies catchment was represented as one sub-catchment (Fig. 4). To represent clearing of forest, Lemoncatchment was divided into two subcatchments with 53%
330 M. A. Bari and K. R. J. Smettem: A conceptual model of daily water balance
40
Fig. 9 Observed and predicted groundwater level at the stream zone of Lemon catchmentFig. 9. Observed and predicted groundwater level at the stream zoneof Lemon catchment.
and 47% of the area respectively (Fig. 2). Except the root-ing depth and Leaf Area Index, all other parameters re-mained identical for both subcatchments. The rooting depthand LAI of one subcatchment representing clearing werechanged from trees to pasture values in 1977 when clearingtook place.
Most of the model parameters were estimated a priorifrom catchment attributes and remained unchanged from themonthly model (Bari and Smettem, 2004). These includegroundwater slope (β), stream length (L), porosity (φl),field capacity (θf , θlf ), soil profile thickness (dl), depthto groundwater level (dg), land use history, rooting depth-distribution (RTu, RTt ) and Leaf Area Index (LAI). Thegroundwater slope that stream lengths were obtained fromobserved groundwater levels and topographic data. Fromdrilling information, porosity, field capacity, top soil thick-ness, average depth to the groundwater level and profilethickness were obtained. Mean Leaf Area Index, relativeroot volumes and rooting depths of pasture and native forestswere estimated from available literature. The parameters as-sociated with interception are calibrated against the through-fall measurements undertaken within the jarrah forest ofWestern Australia (Croton and Norton, 1998).
There are a few parameters in the model whose indica-tive values can be obtained a priori, but needed calibrationby trial and error method for best fit. These include catch-ment hydraulic properties: (i) lateral (Kul) and vertical (Kuv)
conductivity of the top soil, and its relationship with mois-ture content; (ii) lateral conductivity (Kll) of the groundwa-ter system; and (iii) vertical conductivity (Klv) of the deepunsaturated clay profile. The lateral conductivity of the topsoil and vertical conductivity of the interface between the topsoil and clay profile were calibrated to 395 mm day−1 and27.2 mm day−1 respectively for both catchments. The ver-tical hydraulic conductivity (Kuv) falls within the measuredvalue of 0.2–33.7 m day−1 (Sharma et al., 1987). The ver-tical conductivity of the clay layer (Klv) was calibrated to0.8 mm day−1, slightly less than obtained from slug testsof 2.3–7.6 mm day−1 (Peck and Williamson, 1987). One
plausible explanation is that the model seeks to represent thecatchment average effective conductivity while slug test re-sults represent a collection of point data. The parameter (ia)
representing the non-linear relationship between the mois-ture content and lateral conductivity of the Wet Store was cal-ibrated to 2.15 and 3.15 for the Lemon and Ernies catchmentsrespectively (Eq. 16). The other two parameters (pa, pb) re-main unchanged from the monthly model (Eq. 17). Values ofthe other two important parameters (b, c), which express thedegree of homogeneity of soil characteristics over the catch-ment, were determined by calibration and were very simi-lar for both catchments. Initial soil moisture contents of theunsaturated stores were estimated from soil moisture profileanalyses (Bari and Smettem, 2004).
6 Results and discussion
6.1 Groundwater system
The deep groundwater system was about 15–20 m below thesurface and was stable before clearing for both catchments.There was some within-year variation, due to groundwaterrecharge. There was a systematic rise in groundwater levelsfollowing clearing at Lemon catchment but the groundwa-ter remained stable beneath native forest at both catchments(Bari and Smettem, 2004). The daily model represented thetrend in groundwater level very well in both the catchments.For example, the predicted conceptual groundwater level ofLemon catchment rose faster than observed following clear-ing, particularly along the streamlines (Fig. 9). The predictedgroundwater level reached surface by 1987 creating a tran-sient Stream zone Store and saturated areas. Results fromexperimental catchments in Western Australia show that therate of groundwater increase depends on: (i) location andtype of clearing and (ii) annual rainfall. The observed rateof groundwater level rise at Lemon catchment (650 mm an-nual rainfall) was lower than other catchments with higherrainfall and similar clearing (Bari and Ruprecht, 2003; Bariand Smettem, 2004). It also appears to have taken a muchlonger time (1977–1995) to reach equilibrium mainly due tothe low recharge rate, greater soil moisture deficit and greaterunsaturated profile thickness.
6.2 Variable contributing saturated area
The groundwater system has two components: shallow anddeep ground water systems. The shallow groundwater sys-tem is present only in the wet period of the year, whenstreamflow is generated (Bari and Smettem, 2004). The dailymodel represented this process very well. For example, ashallow bore located in the lower part of the stream zone ofthe Ernies catchment retains water only for the wet periodof the year. This corresponds to the expansion and contrac-tion of the saturated areas (Fig. 10a). The predicted within-year variation of the stream zone saturated area at Ernies
Fig. 11. Actual and simulated daily streamflow – Ernies catchment (a) 1974 and (b) 1990Fig. 11. Actual and simulated daily streamflow – Ernies catchment(a) 1974 and(b) 1990.
catchment was similar to the monthly model and the annualmean area was estimated at 2% (Bari and Smettem, 2004).Similar trends in variable contributing saturated areas werealso observed at Lemon catchment, although the magnitudewas generally higher. When the groundwater level reachedstream invert, there was a systematic increase in saturated ar-eas in subsequent years (Fig. 10b). When Lemon catchmentreached a new stability the daily model predicted the within-year variation of the stream zone saturated area to range from2–10%. Site visit and interpretation of Landsat photographsindicate that the stream zone of Lemon catchment, that re-mained saturated over the summer period, increased from 1%in 1991 to 8% by 1998 (Bari et al., 2005). The predicted sat-urated area matches reasonably well with the estimates fromLandsat photographs.
6.3 Streamflow
6.3.1 Daily flow
The Ernies catchment received the highest annual rainfall of851 mm in 1974. As the permanent groundwater system was
far below the stream, streamflow was generated by saturationexcess overland flow and interflow processes only. The pres-ence of groundwater in the shallow bore in the stream zoneis the evidence of the saturation excess overland flow andinterflow generation processes (Bari and Smettem, 2004).The daily model successfully represented the flow genera-tion processes but under predicted the peak flows of the year(Fig. 11a). The observed and simulated hydrographs werevery similar for the average-flow year of 1990 (Fig. 11b).The model precisely predicted the timing of the commence-ment of flow and also the peak flows.
The Lemon catchment received the lowest recorded rain-fall in 1979. If not cleared, it may not have produced anyrunoff at all, as the control catchment did not flow. Themodel predicted the flow generation process very well, in-cluding the flow-duration, peak and recession (Fig. 12a). Thedaily predicted streamflow was in excellent agreement withthe observed values in terms of volume, peak, recession andtiming for 1985, when the groundwater level was slightly be-low the streambed. The catchment received one of the lowestrainfalls of 546 mm in 1997. As the groundwater system rose
332 M. A. Bari and K. R. J. Smettem: A conceptual model of daily water balance
43
Fig. 12. Actual and simulated daily streamflow – Lemon catchment (a) 1979, and (b) 1997Fig. 12. Actual and simulated daily streamflow – Lemon catchment(a) 1979, and(b) 1997.
44
Fig. 13. Observed and predicted flow duration curves - (a) Ernies and (b) Lemon catchmentsFig. 13. Observed and predicted flow duration curves –(a) Ernies and(b) Lemon catchments.
and created permanent groundwater-induced saturated areas(Fig. 9) the streamflow duration increased and ultimately thestream was flowing for the whole year (Fig. 12b). During theperiod of high-rainfall months (May to October), the modelsimulated the peak flows well, but over-estimated the inter-flow component particularly during November and Decem-ber (Fig. 12b).
In addition to the joint plots of observed and predicted hy-drographs, a set of statistical criteria was defined for mea-suring the agreement between the predicted and observedstreamflow for both catchments. The flow-period Error Indexprovides a measure between the observed and predicted flowperiods within a year. For the Ernies catchment the predictedflow-period was 42% lower and 18% greater during the cal-ibration and verification periods respectively. At the Lemoncatchment the flow-period Error Index was lower for boththe calibration and verification period. The Nash-SutcliffeEfficiency was low for the Ernies catchment, probably dueto slight over prediction during the onset of streamflow formost of the years (Table 1). The Correlation Coefficients forboth the catchments were satisfactory.
6.3.2 Flow duration
The observed and predicted flow-duration curves for theErnies catchment matched very well (Fig. 13a). The Erniescatchment was flowing only 15% of the time within a year.During the pre-treatment period, Lemon was flowing for aconsiderably longer period compared to its control. Themodel over predicted daily streamflow between the range of0.01 to 5 mm and the flow duration was lower (Fig. 13b).There was a significant change in flow duration of the Lemoncatchment following clearing. During 1977–1987 flow-duration increased to 40% which was under predicted bythe model. The stream became perennial during 1988–1998when the permanent groundwater was at the surface. Themodel predicted the flow duration and the high flows verywell but the baseflow was over predicted (Fig. 13b).
6.3.3 Monthly streamflow
The predicted monthly streamflow at the Ernies catchmentmatched reasonably well with the observed data and the cor-relations were better than the original monthly model (Bariand Smettem, 2004). The daily model successfully predicted
the January 1982 event and gave improved predictions forother months where the monthly model performed poorly(Fig. 14a). The predicted streamflow for August 1974 wassignificantly lower than observed while for October 1983, thepredicted and observed streamflow was 28 mm and 16 mmrespectively. During 1974–1998 there was 7% bias betweenthe observed and predicted monthly streamflow (Fig. 14a).At the Lemon catchment, the daily model over predicted theJanuary 1982 high rainfall event and over predicted for Au-gust 1974 when the catchment received the greatest rainfall.When the groundwater system was already at the surface,the model occasionally over predicted the winter high flows(Fig. 14b). Overall, the relationship between the observedand predicted monthly flows was improved by using the dailymodel rather than the original monthly model. There was 4%bias between the observed and predicted streamflow. Simi-lar monthly relationships were also obtained when the LAS-CAM model was applied at Wights and Salmon catchments(Sivapalan et al., 1996).
6.3.4 Annual streamflow
At the Ernies catchment, a good agreement between the ob-served and predicted annual streamflow was observed. In1974, when the catchment produced the highest streamflow,the model slightly under predicted the streamflow (Fig. 15a).The model generally predicted the low flow years quite well.The observed and predicted flow volumes over the study pe-riod were 212 mm and 217 mm respectively. The Erniescatchment lost 12 mm from the groundwater system as down-stream discharge and the Subsurface Store decreased by382 mm, which is comparable to the result of the monthlymodel (Bari and Smettem, 2004). The storage reduction canbe attributed to the reduction in groundwater level, whichwas observed beneath other forested catchments in the south-west of Western Australia (Schofield and Ruprecht, 1989).The soil evaporation and interception losses were 378 mmand 2932 mm respectively, slightly higher than the predictionof the monthly model (Table 2). The daily model predicted asurface runoff of 75 mm while the monthly model predictednil, indicating a better representation of daily processes.
The relationship between the observed and predicted annualstreamflow improved significantly compared to that of theannual model (Bari et al., 2005).
During the period of 1974–1984, the model generallyslightly over predicted the annual flow observed at Lemoncatchment. When the groundwater system came to surfacein 1987, the model over predicted the annual streamflow forsome of the years (Fig. 15b). Overall, the observed and pre-dicted streamflow was 1469 mm and 1686 mm respectivelyrepresenting a 15% over prediction. The interception, soilevaporation and transpiration components were 1830 mm,1028 mm and 11 786 mm respectively (Table 2). The Subsur-face Store lost 1343 mm while the Groundwater Store gained2695 mm due to rise in groundwater level. Similar storagechange was also predicted by the annual and monthly models(Bari et al., 2005; Bari and Smettem, 2004). The predictedsurface runoff and interflow components were slightly higherwhile the baseflow was approximately half compared to theprediction of the monthly model. In a related study of dailysalinity modelling, we found that the baseflow component isvery important of obtaining a good process description.
6.3.5 Sensitivity analysis
Sensitivity analysis of three key model parameters wasperformed by changing calibrated value one parameter by±10% at a time. The effects on daily water balance for 1988at both the catchments were evaluated (Table 3). It demon-strates that the relationship between the moisture content andlateral hydraulic conductivity (ia) is the most sensitive pa-rameter. Reducing 10% increased streamflow at the Lemonand Ernies catchments by 16% and 46% respectively. Thedaily peakflow increased while the interflow component de-creased significantly. Increasing the top soil thickness (d) by
10% resulted in a decrease in streamflow by 9% and 26.6% atthe Lemon and Ernies catchment respectively (Table 3). Thepeakflow component was predicted to decrease while inter-flow was predicted to increase. The parameter responsiblefor the spatial distribution of water holding capacity of thetop soil (b) has relatively small impact on daily water bal-ance. Further work is necessary across a range of experi-mental catchments to gain greater insights into the parametersensitivity.
6.4 General discussion
During 1974–1993, the rainfall at Lemon catchment wasabout 5% higher than that of Ernies catchment. Since 1984the rainfall at Lemon catchment was 1% lower than that ofErnies. There was no explanation for this shifting trend inrainfall. Therefore average rainfall obtained from the twocatchments was taken as input to the model. During 1974–1983, annual streamflow at Lemon catchment was slightlyover predicted (Fig. 15b).
Daily pan evaporation was recorded from Ernies climatestation during 1974–1987. There were many gaps in the dataand some of the daily data are questionable. The annual panevaporation data (Luke et al., 1988) was transformed to dailypan evaporation using a simple harmonic function. Therewas no direct measurement of Leaf Area Index of pasture.A maximum value of 2.1 was used by other models, whichwere successfully calibrated and tested on Lemon and othersimilar catchments (Bari and Croton, 2000; Croton and Bari,2001; Bari and Croton, 2002.). The seasonal variation ofLAI was based on the growth pattern of the pasture. Therewere also no data available for rooting depth and distribution.From field observations and experiences gathered by localfarmers, we assumed a maximum pasture rooting depth of3.0 m. Similar values were also used by other models (Bariand Croton, 2000; Croton and Bari, 2001; Bari and Croton,2002).
The daily model along with three others were applied toone catchment of the State of Victoria, identified as a Na-tional Action Plan for Salinity priority catchment (Beverlyet al., 2005). Results show that this model can predict catch-ment yield using readily available data sets and requires min-imum parameterisation and calibration. It can be used as arapid assessment predictive tool for catchment managementand provides subcatchment scale spatial and temporal reso-lution. It could be used as valuable tool to engage the com-munity and provide a simple representation of relative landuse impacts.
Clearing of native forest for pasture development is themajor cause of stream salinity and land degradation in West-ern Australia (Wood, 1924). Other land use changes includeforest thinning, operational logging, forest fire and reforesta-tion (Bari and Ruprecht, 2003). A basin scale operationalmodel, which uses the present model as “building block”,has now been developed and applied to predict the effects of
ia +10 75.4 −12.4 14.4 −32.4−10 99.8 16.0 31.1 46.0
d +10 78.3 −9.0 15.6 −26.6−10 96.2 11.8 29.1 36.5
b +10 88.1 2.4 21.6 1.3−10 83.9 −2.5 20.9 −2.1
logging, forest fire, clearing and reforestation on streamflowand salinity (Bari and Smettem, 2003; Bari and Berti, 2005).The spatial and temporal variations of land use were incor-porated into the input file of the model by changing the pro-portional area of a subcatchment where land use change tookplace and changing only the Leaf Area Index and rootingdepths. The model has been successfully used for predictingthe effects of different rainfall scenarios and climate changeon catchment yield (Bari et al., 2005; Bari and Senatherajah,2005).
7 Summary and conclusion
A conceptual daily model has been developed to representchanges in streamflow generation processes following landuse changes and was successfully applied to two experimen-tal catchments in the south-west of Western Australia. Themodel consists of five inter-connecting stores: (i) Dry, Wetand Subsurface Stores for vertical and lateral water flow, (ii)transient Stream zone Store, and (iii) Groundwater Store.The Dry, Wet and Stream zone Stores represent the dynam-ically varying stream zone saturated area and are responsi-ble for surface runoff, interflow and percolation. The unsat-urated Subsurface Store describes transpiration and quanti-fies recharge to Groundwater Store. The Groundwater Storequantifies the baseflow and development of the groundwaterinduced stream zone saturated areas.
The model was calibrated using daily streamflow data.The first 5 years of data (1974–1978) for Ernies catchmentand 14 years (1974–1987) of data from Lemon catchmentwere used for calibration. Catchment average surface slope,soil depth and distribution, porosity, hydraulic conductivityare the most important parameters. Most of the parameterswere estimated a priori. Trends in the observed groundwaterlevel were used as a guide to incorporate changes in storagecontent following forest clearing.
The groundwater level beneath native forest at Erniescatchment remained stable and was successfully reproducedby the model. Streamflow at Ernies catchment is intermittent– flowing generally May to November. The model providedgood predictions of the daily streamflow in terms of flow du-
ration, peaks and recessions. During the study period (1974–1998), annual streamflow ranged from nil to 72 mm, averag-ing 8.5 mm. This represented only 1.2% of annual rainfall.Overall the predicted total streamflow was 2% higher thanobserved.
At the Lemon catchment the groundwater level rose sys-tematically following clearing and reached the stream bed in1987. It appears that in the 1990s the groundwater system hasreached a new stability. The predicted conceptual ground-water level was in close agreement with the observed data,both beneath the native forest and cleared areas. Follow-ing clearing there was a significant increase in streamflow,flow duration, peakflow and recession at Lemon catchment.When the groundwater reached the stream bed in 1987, theannual streamflow increased more than 10 fold. Overall thepredicted annual streamflow volume was 15% higher thanobserved (R2=0.84).
336 M. A. Bari and K. R. J. Smettem: A conceptual model of daily water balance
Appendix A Symbols and variable names
Ai Total “impervious” area of a catchment (mm2)
1Ai Changes in ‘impervious’ area of a catchment (mm2)
Ap Pervious area of the catchment (mm2)
As Part of the catchment area reaching saturation (mm2)
At Total catchment area (mm2)Aw Part of catchment area where water content exceeded field capacity (mm2)
a Parameter for the soil depth distribution of Subsurface Store (-)b Parameter for the soil depth distribution of top soil (-)c Parameter for the soil depth distribution of top soil(-)Ci Interception store coefficient (-)Closs Parameter for Groundwater Store loss (-)cs Parameter related to soil evaporation (-)Cs Plant canopy storage (mm)Csmx Maximum interception storage capacity (mm)d Average depth of top soil (mm)d ′ Depth of an elementary area of top soil (mm)dl Total depth of the soil profile (mm)dg Average depth to groundwater level (mm)ds Stream depth (mm)d ′g Depth to groundwater level of any elementary area (mm)
1dg Changes in groundwater level (mm)Esd Soil evaporation from Dry Store (mm)Ess Soil evaporation from Stream zone Store (mm)Esw Soil evaporation from Wet Store (mm)Etd Actual transpiration from Dry Store (mm)Etg Actual transpiration from Groundwater Store (mm)Et l Actual transpiration from Subsurface Store (mm)Ets Actual transpiration from Stream zone Store (mm)Etw Actual transpiration from Wet Store (mm)I Percolation (mm)Ia Actual interception (mm)ia Parameter related to lateral conductivity of top soil (-)Kll Lateral hydraulic conductivity of Subsurface Store (mm day−1)
Klv Vertical hydraulic conductivity of the Subsurface Store (mm day−1)
Kul Lateral hydraulic conductivity of West Store (mm day−1)
Kuv Vertical hydraulic conductivity of Wet Store (mm day−1)
L Catchment wide average stream length (mm)LAI Leaf Area Index (-)LAImx Maximum Leaf Area Index (-)pa Parameter related to vertical soil conductivity (-)pb Parameter related to vertical soil conductivity (-)PET Daily pan evaporation (mm)Qi Interflow (mm)Qr Total surface runoff (mm), (Qr1+Qr2)
Qr1 Surface runoff from pervious area (mm)Qr2 Surface runoff from “impervious area”(mm)Qb Baseflow to stream (mm)Qbl Baseflow to Stream zone Store (mm)Qloss Groundwater loss below gauge (mm)Qt Total streamflow (mm)R Actual rainfall (mm)RE Effective rainfall (mm)RET Residual potential evapotranspiration (mm)Rf “Excess water” released from Dry Store to Wet Store (mm)Rl Recharge to Groundwater Store (mm)Rl1 Recharge to Groundwater Store by matrix flow (mm)Rl2 Recharge to Groundwater Store by preferential flow (mm)RTt Total root volume (-)RTu Root volume in the top soil (-)tu Parameter related to transpiration (-)Wd Water content of the Dry Store (mm)Wdmx Maximum capacity of the Dry Store (mm)Wg Water content of the Groundwater Store (mm)1Wgl Changes in water between Subsurface and Groundwater Stores (mm)Wl Water content of the Subsurface Store (mm)Wldmx Water content at field capacity of the Subsurface Store (mm)
Wlmx Maximum capacity of the Subsurface Store (mm)1Wl Changes in water content of the Subsurface Store (mm)Wsg Water content of the Stream zone Store (mm)1Wsg Changes in water content of the Stream zone Store (mm)Ww Water content of the Wet Store (mm)Wwi Threshold value for interflow generation (mm)Wwmx Maximum capacity of the Wet Store (mm)wd Elementary area water retention capacity of Dry Store (mm)wdm Dry Store maximum water retention capacity of an elementary area (mm)wl Water holding capacity of the subsurface elementary area (mm)wlm Maximum water holding capacity of any subsurface elementary area (mm)ww Elementary area water retention capacity of the Wet Store (mm)wwm Wet Store maximum water retention capacity in any elementary area (mm)x Ratio of the “pervious” area of top soil which exceeded field capacity (-)x′ Ratio of the subsurface unsaturated area which exceeded field capacity (-)y Ratio of the “pervious” area of a catchment which reached saturation (-)αt Parameter related to transpiration (-)β Catchment average groundwater slope (mm/mm)θs Water content at saturation of an elementary area (mm3 mm−3)
θf Field capacity of top soil elementary area (mm3 mm−3)
θlf Field capacity of subsurface elementary area (mm3 mm−3)
φl Soil porosity of the subsurface elementary area (mm3 mm−3)
Edited by: L. Pfister
References
Atkinson, S. E., Sivapalan, M., and Woods, R. A.: Climate, soil,vegetation controls on water balance model complexity overchanging time scales, Water Resour. Res., 38, 501–517, 2002.
Averjanov, S. F.: About permeability of subsurface soils in case ofincomplete saturation, Engr. Collect., 7, 19–21, 1950.
Bari, M. A.: The state of the Clearing Control Catchments in West-ern Australia, in: Hydrology in a Changing Environment, editedby: Wheater, H. and Kirky, C., Proceedings of the British hydro-logical Society International Conference, Exeter, United King-dom, John Wiley & Sons, 604 pp, 1998.
Bari, M. A., Berti, M. A., Charles, S., Hauck, E., and Pearcy,M.: Modelling of streamflow reduction due to climate change inWestern Australia – A case study, MODSIM 2005, Melbourne,December 2005, Australia, 2005.
Bari, M. A. and Berti, M. A.: Predicting stream salinity manage-ment options in the Kent River catchment using the LUCICATmodel, in: Hydrology 2005, The Institution of Engineers, Can-berra, Australia, 2005.
Bari, M. A. and Senathirajah, K.: Modelling yields for differentrainfall scenarios at Wungong water supply catchment, West-ern Australia, in: Hydrology 2005, The Institution of Engineers,Canberra, Australia, 2005.
Bari, M. A and Croton, J. T.: Predicting the impacts of land usechanges on streamflow and salinity by a fully distributed catch-ment model, in: Hydro2000, Third International Hydrology andWater resources Symposium, The Institution of Engineers, 311–316, Australia, 2000.
Bari, M. A and Croton, J. T.: Assessing the effects of valley refor-estation on streamflow and salinity using the WEC-C model, in:Hydrology 2002, 27th Hydrology and Water resources Sympo-sium, The Institution of Engineers, Australia, 176pp, 2002.
Bari, M. A and Ruprecht, J. K.: Water yield response to land usechange in south-west Western Australia, Department of Environ-ment, Salinity and Land Use Series No. SLUI 31, 36pp, 2003.
M. A. Bari and K. R. J. Smettem: A conceptual model of daily water balance 337
Bari, M. A. and Smettem, K. R. J.: Modelling monthly runoffgeneration processes following land use changes: groundwater-surface runoff interactions, Hydrol. Earth Syst. Sci., 8(5), 903–922, 2004.
Bari, M. A. and Smettem, K. R. J.: Development of a salt and waterbalance model for a large partially cleared catchment, Aust. J. ofWater Resour., 7(2), 93–99, 2003.
Bari, M. A., Smettem, K. R. J., and Sivapalan, M.: Understandingchanges in annual runoff following land use changes: a system-atic data-based approach, Hydrol. Processes, 19(13), 2463–2479,2005.
Beven, K. J.: Changing ideas in hydrology: the case of physically-based models, J. Hydrol., 105, 157–172, 1989.
Beven, K. J.: How far can we go in distributed hydrological mod-elling? Hydrol. Earth Syst. Sci., 5, 1–12, 2001.
Beverly, C., Bari, M. A., Christy, B., Hocking, M., and Smettem, K.R. J.: Understanding catchment dynamics from land use change;comparison between a rapid assessment approach and a detailedmodelling framework, Aust. J. Exp. Agric., 45, 1–17, 2005.
Binley, A. M., Beven, K. J., and Elgy, J.: A physically-based modelfor heterogeneous hill slopes, II. Effective hydraulic conductivi-ties, Water Resour. Res., 25, 1227–1233, 1989.
Croton, J. T. and Norton, S. M. G.: Rainfall interception in theNorthern Jarrah Forest of Western Australia, Water and RiversCommission, Water Resour. Tech. Series No. WRT-17, 28pp,1998.
Croton, J. C. and Barry, D. A.: WEC-C: A fully distributed, de-terministic catchment model-foundation, formation, testing andapplication, Environ. Model. Software, 16, 583–599, 2001.
Croton, J. C. and Bari, M. A.: Using WEC-C, a fully distributed,deterministic catchment model, to simulate hydrologic responsesto agricultural clearing, Environ. Model. Software, 16, 601–614,2001.
Duan, Q.: Global optimization of watershed model calibration, in:Calibration of Watershed Models, edited by: Duan, Q., Gupta,H. V., Sorooshian, S., Rousseau, A. N., and Turcotte, R., 89–104, 2003.
Farmer, D., Sivapalan, M., and Jothityangkoon, C.: Climate, soiland vegetation controls upon the variability of water balance intemperate and semi-arid landscapes: Downward approach to hy-drological prediction, Water Resour. Res., 39, 1035–1055, 2003.
Gan, T. Y. and Biftu, G. T.: Effects of model complexity and struc-ture, parameter interactions and data on watershed modelling, in:Calibration of Watershed Models, edited by: Duan, Q., Gupta, H.V., Sorooshian, S., Rousseau, A. N., and Turcotte, R., 317–329,2003.
Johnston, C. D.: Preferred water flow and localised recharge in avariable regolith, J. Hydrol., 94, 129–142, 1987.
Jothityangkoon, C., Sivapalan, M., and Farmer, D. L.: Process con-trols of water balance variability in a large semi-arid catchment:Downward approach to hydrological model development, J. Hy-drol., 254, 174–198, 2001.
Klemes, V.: Conceptualisation and scale in hydrology, J. Hydrol.,65, 1–23, 1983.
Luke, G.J., Burke, K.L. and O’Brien, T.M. 1988. Evaporation datafor Western Australia. W. Aust. Dept. of Agric., Div. of Resourc.Manag., Tech. Rep. No. 65. 29pp.
Mauger, G. W.: Darling Range Catchment Model, Vol. 1 – Concep-tual model, Water Authority of Western Australia, Rep. No. WP
9, 47pp, 1986.Peck, A. J. and Williamson, D. R.: Effects of forest clearing on
groundwater, J. Hydrol., 94, 47–66, 1987.Perrin, C., Michel, C., and Andreassian, V.: Does a large number
of parameters enhance model performance? Comparative assess-ment of common catchment model structures on 429 catchments,J. Hydrol., 242, 275–301, 2001.
Pettit, N. E. and Froend, R. H.: Research into reforestation tech-niques for saline groundwater control, Water Authority of W.A.,Surface Water Branch Rep. No. WS97, 42pp, 1992.
Ruprecht, J. K. and Schofield, N. J.: Analysis of streamflow gener-ation following deforestation in southwest Western Australia, J.Hydrol., 105, 1–17, 1989.
Ruprecht, J. K. and Schofield, N. J.: The effect of partial deforesta-tion on hydrology and salinity in high salt storage landscapes. I.Extensive block clearing, J. Hydrol., 129, 19–38, 1991.
Schofield, N. J. and Ruprecht, J. K.: Regional analysis of streamsalinisation in southwest Western Australia, J. Hydrol., 112, 19–39, 1989.
Sharma, M. L.: Evapotranspiration from a eucalyptus commu-nity, in: Evapotranspiration from Plant Communities, edited by:Sharma, M. L., Elsevier, Amsterdam, 1983.
Sharma, M. L., Barron, R. J. W., and Fernie, M. S.: Areal distribu-tion of infiltration parameters and some soil physical propertiesin lateritic catchments, J. Hydrol., 94, 109–127, 1987.
Sivapalan, M. and Woods, R. A.: Evaluation of the effects of gen-eral circulation models’ subgrid variability and patchiness ofrainfall and soil moisture on land surface water balance fluxes,Hydrol. Process., 9, 453–473, 1995.
Sivapalan, M., Ruprecht, J. K., and Viney, N. R.: Water and saltbalance modelling to predict the effect of land use changed inforested catchments, I. Small catchment water balance model,Hydrol. Process., 10, 393–411, 1996.
Sivapalan, M., Viney, N. R., and Zammitt, C.: LASCAM: LargeScale Catchment Model, in: Mathematical Models of Small Wa-tershed Hydrology and Applications, edited by: Singh, V. P., Wa-ter Resources Publications, Louisiana State University, 579–648,2002.
Todini, E.: The ARNO rainfall-runoff model, J. Hydrol., 175, 339–382, 1996.
Vertessy, R. A., Hutton, T. J., O’Shaughnessy, P. J., and Jayasuriya,M. D. A.: Predicting water yield from a mountain ash forest us-ing a terrain analysis based catchment model, J. Hydrol., 150,284–298, 1993.
Wood, W. E.: Increase of salt in soil and streams following the de-struction of native vegetation, J. R. Soc. W. A., 10, 35–47, 1924.
Wood, F. F., Lettenmaier, D. P., and Zartarian, V. G.: A land-surfacehydrology parameterization with subgrid variability for generalcirculation models, J. Geophys. Res., 97, 2717–2728, 1992.
Zhao, R. J. and Liu, X. R.: The Xinanjiang model, in: ComputerModels of Watershed Hydrology, edited by: Singh, V. P., WaterResources Publications, Littleton, Colorado, 215–232, 1995.