eScholarship provides open access, scholarly publishing services to the University of California and delivers a dynamic research platform to scholars worldwide. Peer Reviewed Title: A Conceptual Model of Sedimentation in the Sacramento–San Joaquin Delta Journal Issue: San Francisco Estuary and Watershed Science, 10(3) Author: Schoellhamer, David H. , U.S. Geological Survey Wright, Scott A. , U.S. Geological Survey Drexler, Judy , U.S. Geological Survey Publication Date: 2012 Publication Info: San Francisco Estuary and Watershed Science, John Muir Institute of the Environment, UC Davis Permalink: http://www.escholarship.org/uc/item/2652z8sq Acknowledgements: We thank David Fryberg, Denise Reed, Stuart Siegel, Mark Stacey, the DRERIP review panel, and the other DRERIP model authors for their assistance in developing this model. Justin Ferris, Mick van der Wegen, and two anonymous reviewers provided helpful comments on initial drafts of this manuscript. Keywords: Sediment, sediment transport, sedimentation, Sacramento – San Joaquin River Delta, conceptual model, feedback, open water, tidal marsh, watershed, vegetation, sea level rise, Central Valley Local Identifier: jmie_sfews_11152 Abstract: Sedimentation in the Sacramento–San Joaquin River Delta builds the Delta landscape, creates benthic and pelagic habitat, and transports sediment-associated contaminants. Here we present a conceptual model of sedimentation that includes submodels for river supply from the watershed to the Delta, regional transport within the Delta and seaward exchange, and local sedimentation in open water and marsh habitats. The model demonstrates feedback loops that affect the Delta ecosystem. Submerged and emergent marsh vegetation act as ecosystem engineers that can create a positive feedback loop by decreasing suspended sediment, increasing water column
Transcript
eScholarship provides open access, scholarly publishingservices to the University of California and delivers a dynamicresearch platform to scholars worldwide.
Peer Reviewed
Title:A Conceptual Model of Sedimentation in the Sacramento–San Joaquin Delta
Journal Issue:San Francisco Estuary and Watershed Science, 10(3)
Author:Schoellhamer, David H., U.S. Geological SurveyWright, Scott A., U.S. Geological SurveyDrexler, Judy, U.S. Geological Survey
Publication Date:2012
Publication Info:San Francisco Estuary and Watershed Science, John Muir Institute of the Environment, UC Davis
Acknowledgements:We thank David Fryberg, Denise Reed, Stuart Siegel, Mark Stacey, the DRERIP review panel,and the other DRERIP model authors for their assistance in developing this model. Justin Ferris,Mick van der Wegen, and two anonymous reviewers provided helpful comments on initial draftsof this manuscript.
Keywords:Sediment, sediment transport, sedimentation, Sacramento – San Joaquin River Delta, conceptualmodel, feedback, open water, tidal marsh, watershed, vegetation, sea level rise, Central Valley
Local Identifier:jmie_sfews_11152
Abstract:Sedimentation in the Sacramento–San Joaquin River Delta builds the Delta landscape, createsbenthic and pelagic habitat, and transports sediment-associated contaminants. Here we presenta conceptual model of sedimentation that includes submodels for river supply from the watershedto the Delta, regional transport within the Delta and seaward exchange, and local sedimentationin open water and marsh habitats. The model demonstrates feedback loops that affect the Deltaecosystem. Submerged and emergent marsh vegetation act as ecosystem engineers that cancreate a positive feedback loop by decreasing suspended sediment, increasing water column
eScholarship provides open access, scholarly publishingservices to the University of California and delivers a dynamicresearch platform to scholars worldwide.
light, which in turn enables more vegetation. Sea-level rise in open water is partially counteredby a negative feedback loop that increases deposition if there is a net decrease in hydrodynamicenergy. Manipulation of regional sediment transport is probably the most feasible method to controlsuspended sediment and thus turbidity. The conceptual model is used to identify information gapsthat need to be filled to develop an accurate sediment transport model.
Copyright Information:
Copyright 2012 by the article author(s). This work is made available under the terms of the CreativeCommons Attribution3.0 license, http://creativecommons.org/licenses/by/3.0/
Conceptual Model of Sedimentation in the Sacramento– San Joaquin River DeltaDavid H. Schoellhamer 1†, Scott A. Wright 1, and Judith Z. Drexler 1
ABSTRACT
Sedimentation in the Sacramento–San Joaquin River Delta builds the Delta landscape, creates benthic and pelagic habitat, and transports sediment-associated contaminants. Here we present a conceptual model of sedimentation that includes submodels for river supply from the watershed to the Delta, regional transport within the Delta and seaward exchange, and local sedimentation in open water and marsh habitats. The model demonstrates feedback loops that affect the Delta ecosystem. Submerged and emergent marsh vegetation act as ecosystem engineers that can create a positive feedback loop by decreasing suspended sediment, increasing water column light, which in turn enables more vegetation. Sea-level rise in open water is partially countered by a negative feedback loop that increases deposition if there is a net decrease in hydrodynamic energy. Manipulation of regional sediment transport is probably the most feasible method to control suspended sediment and thus turbidity. The conceptual model is used to iden-tify information gaps that need to be filled to develop an accurate sediment transport model.
KEY WORDS
Sediment, sediment transport, sedimentation, Sacramento–San Joaquin River Delta, conceptual model, feedback, open water, tidal marsh, water-shed, vegetation, sea-level rise, Central Valley, Delta Regional Ecosystem Restoration Implementation Plan (DRERIP).
INTRODUCTION
The Sacramento–San Joaquin River Delta (Delta) is where the rivers of the Central Valley of California merge to become the San Francisco Estuary (Figure 1). The rivers deliver sediment from the Central Valley watershed to the Delta. A sedimen-tation model was included in the Delta Regional Ecosystem Restoration Implementation Plan (DRERIP) suite of conceptual models because sediment deposi-tion creates and sustains the Delta landscape, pelagic habitat depends on suspended sediment, and sedi-ment transports adsorbed nutrients and contaminants.
Deposited sediment creates and sustains the Delta landscape, including habitats such as tidal marsh, floodplain, open channels, and flooded islands. Massive sediment supply during the period of hydraulic mining in the late 1800s caused deposi-tion in Sacramento Valley rivers, the Delta, and San Francisco Bay (Gilbert 1917). Today, a key manage-
1 California Water Science Center, U.S. Geological Survey, Placer Hall, 6000 J Street, Sacramento, CA 95819 USA.
Figure 1 Sacramento–San Joaquin River Delta. Locations in red correspond to the sediment fluxes and budget presented in Figures 3 and 6.
OCTOBER 2012
3
ment question is whether the existing Delta land-scape can be sustained as sea level rises. Sea-level rise and floodplain, marshplain, and channel-form changes are habitat stressors, which can be counter-acted by artificial and natural movement of sediment. The preferred option is natural sediment movement because it is usually less costly and more sustainable. Sediment is the raw material for habitat restoration projects and levee construction. Sediment also depos-its in ports, marinas, and shipping channels, which sometimes require dredging to maintain navigation.
Suspended sediment affects habitat for pelagic organ-isms. Suspended sediment is the primary attenuator of sunlight in the water column of the Delta which, in turn, limits photosynthesis and primary photo-synthetic carbon production (Cloern 1987; Jassby and others 2002). Abundance of some fish species increases in more turbid waters (Nobriga and oth-ers 2005; Feyrer and others 2007). A decline in fish abundance in the 2000s, locally called the pelagic organism decline, has had the most serious conse-quences for delta smelt (Hypomesus transpacificus), for which larval feeding sharply decreases when tur-bidity is less than 18 nephelometric turbidity units (NTU) (Baskerville–Bridges and others 2004), which is roughly equivalent to a suspended-sediment concen-tration (SSC) of 24 mg L-1 (Ganju and others 2007). Water exports from the Delta, which provide drink-ing and irrigation water for much of California, have been limited because of the pelagic organism decline.
Many contaminants are associated with sediment (Turner and Millward 2002; Schoellhamer and oth-ers 2007a; Luengen and Flegal 2009). Suspended sediment moving into, within, and out of estuaries provides a pathway for the transport of sediment-associated contaminants (Turner and others 1999; Turner and Millward 2000; Bergamaschi and others 2001; Le Roux and others 2001). Thus, the fate of these substances is largely determined by the fate of sediment. The San Francisco Estuary is an impaired water body because of several sediment-associated contaminants (Schoellhamer and others 2007a).
In this paper, we summarize a conceptual model of sedimentation in the Delta (Schoellhamer and others 2007b). We discuss critical feedback loops, habitat restoration, uncertainty, and numerical modeling.
Study Area
The Sacramento River drains the northern part of the Central Valley, an area of approximately 60,900 km2. The San Joaquin River drains approxi-mately 35,060 km2 in the southern Central Valley. The Cosumnes and Mokelumne rivers enter the Delta directly from the east, draining areas of approxi-mately 1900 and 1700 km2, respectively. River discharge is greatest during winter and spring, and smallest during the dry summer and early autumn. Flood bypasses were constructed for Central Valley rivers in the early 20th century (Singer and oth-ers 2008). Dams were built in most Central Valley rivers in the mid-20th century (Singer 2007). The Sacramento River was stabilized with rip rap mostly during the latter half of the 20th century (USFWS 2000; Florshiem and others 2008). Tides propagate into most of the Delta when river discharge is small. Suisun Bay is the sub-embayment of San Francisco Bay that is seaward of the Delta. Tides in Suisun Bay are mixed diurnal and semidiurnal, and the tidal range varies from about 0.6 m during the weakest neap tides to 1.8 m during the strongest spring tides. Most of the waters of the Delta are fresh and during the dry season flow from reservoirs is managed to try to maintain a salinity of 2 parts per thousand (ppt) in Suisun Bay.
At the confluence of the four rivers, a complex net-work of natural and man-made channels has devel-oped (Figure 1). The Sacramento–San Joaquin Delta Atlas (DWR 1995) contains detailed information on the history of the Delta; a brief summary is provided here. Levee construction and draining of marshlands began in late 1850. As a result, the Delta today con-sists of a network of slough channels that surround former marshlands commonly termed ‘‘islands,’’ which are primarily used for agriculture. Because of this channelization, only 0.02 km2 of non-vegetated tidal flats exist in the Delta today (DFG 1997). Before channelization, the top soil in the Delta was a peat layer 2 to 15 m thick (Atwater and Belnap 1980). The organic material in peat contains plant litter, root biomass, as well as allochthonous material from the watershed. Carbon sequestration in the Delta ranges from 0.38 to 0.79 Mg ha-1 yr-1 (Drexler 2011). Because of the high organic content of Delta soils,
SAN FRANCISCO ESTUARY & WATERSHED SCIENCE
4
draining of marshes has resulted in significant land subsidence, such that most of the islands are cur-rently below mean sea level, some by as much as 4 m. During the latter half of the 20th century there was a large increase in water exports from the Delta for urban and agricultural use primarily south of the Delta.
Delta Sediment Properties
Important surficial sediment properties in the Delta are size, density, and organic content. Sediment in channels that convey relatively large flows, such as the Sacramento River, San Joaquin River, and Threemile Slough, tend to be sandy and contain bed forms (Dinehart 2002). The relative quantity of fine sediment generally increases seaward. From 1993 to 2003, 18 surficial bed samples collected by the Regional Monitoring Program (RMP) in the lower Sacramento River had a mean of 19% fines and a range of 8% to 50% (RMP [cited 2007]). Eighteen samples from the lower San Joaquin River had a mean of 48% fines and a range of 16% to 79%. Larger river floods that winnow fines from the bed and larger sand supply in the Sacramento River probably account for the difference between the two rivers. At Rio Vista, Thompson and others (2000) observed that large floods increased the percent of sand on the bed (up to nearly 100% from nearly 0%), and benthic assemblages shifted from species that favor muddy sediment to sandy sediment. During the intervals between floods, finer sediment deposited, the bed sediment became finer, and benthos that prefer muddy sediment returned. At two other sites in the Sacramento and San Joaquin rivers, however, the fraction of sand varied over a similar range but appeared unrelated to flow, perhaps because of spa-tial heterogeneity. Fine sediments tend to deposit on marshes, which typically have large expanses of emergent macrophytes (Byrne and others 2001). Grain size affects substrate stability and establishment and growth of submerged aquatic vegetation.
The dry density of bed sediment is the mass of dry sediment per unit volume and it generally increases as grain size increases and organic content decreases. A survey of studies shows that dry density of bed
sediment can vary by a factor of two. Porterfield (1980) estimated that the dry density of estua-rine sediments was 851 kg m-3. Ogden Beeman & Associates and Krone & Associates (1992) estimated a value of 529 kg m-3. Caffrey (1995) measured a dry density of 1,144 kg m-3 for the top centimeter of bed sediment in the channel at Rio Vista.
Organic content of bed sediment is greatest in marshes. Reed (2002) found organic contents of wet-land soils ranged from 7.80 to 39.38%. From 1993 to 2003, 17 bed samples from the lower Sacramento River had a mean of 0.55% total organic carbon (TOC) and a range of 0.14% to 2.10% (RMP [cited 2007]). Seventeen samples from the lower San Joaquin River had a mean of 0.68% TOC and a range of 0.26% to 1.38%. At both sites, TOC generally increased as the fraction of fine sediment increased.
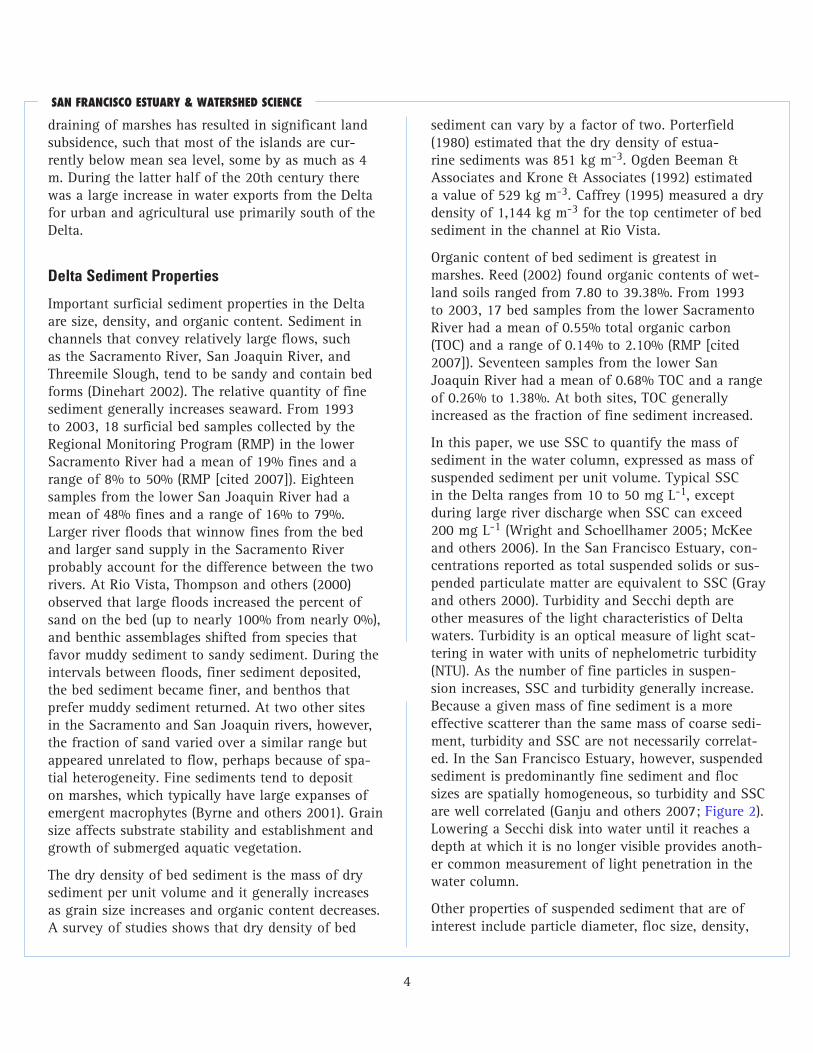
In this paper, we use SSC to quantify the mass of sediment in the water column, expressed as mass of suspended sediment per unit volume. Typical SSC in the Delta ranges from 10 to 50 mg L-1, except during large river discharge when SSC can exceed 200 mg L-1 (Wright and Schoellhamer 2005; McKee and others 2006). In the San Francisco Estuary, con-centrations reported as total suspended solids or sus-pended particulate matter are equivalent to SSC (Gray and others 2000). Turbidity and Secchi depth are other measures of the light characteristics of Delta waters. Turbidity is an optical measure of light scat-tering in water with units of nephelometric turbidity (NTU). As the number of fine particles in suspen-sion increases, SSC and turbidity generally increase. Because a given mass of fine sediment is a more effective scatterer than the same mass of coarse sedi-ment, turbidity and SSC are not necessarily correlat-ed. In the San Francisco Estuary, however, suspended sediment is predominantly fine sediment and floc sizes are spatially homogeneous, so turbidity and SSC are well correlated (Ganju and others 2007; Figure 2). Lowering a Secchi disk into water until it reaches a depth at which it is no longer visible provides anoth-er common measurement of light penetration in the water column.
Other properties of suspended sediment that are of interest include particle diameter, floc size, density,
OCTOBER 2012
5
POC was higher, mostly 2% to 4% of the suspended sediment at Rio Vista. Algal production probably accounted for higher POC in summer when flows were low.
MODEL DESCRIPTION
The conceptual model is qualitative and is composed of drivers, linkages, and outcomes. First, the scope of the model is described, specifically the treatment of suspended and bed load and time scales. The model includes submodels for river supply, regional trans-port, and local sedimentation in open water and marsh habitats.
Suspended and Bed Load
Sand and coarser sediment (diameter larger than 63 μm) not only move in suspension but also can move along the bed by rolling, sliding, and jump-ing, which is called bed load. Based on measure-ments in the late 1950s, Porterfield (1980) estimated that the bed load was 109 metric tons per day in the Sacramento River at Sacramento. This bed load was only 1.4% of the total sediment load. From 1998 to 2000, Dinehart (2002) collected several pairs of bed-form measurements about one week apart to estimate bedload transport rates of 15 to 73 metric tons per day at Garcia Bend downstream from Sacramento. Wright and Schoellhamer (2005) report that the daily suspended-sediment load at Freeport, about 6 kilome-ters downstream from Garcia Bend, averaged about 3,000 metric tons per day during water years 1999 to 2002. Although not temporally aligned, these more recent measurements, when compared, appear to confirm as still valid, Porterfield’s finding that sus-pended load is about 2 orders of magnitude greater than bed load. Because bedload is a small fraction of suspended load, this conceptual model neglects the mass of sediment transported as bed load. Here, we consider how bed load affects the size and properties of bed sediment, however, because it can affect ero-sion. Suspended load in the model includes sand and finer particles.
and organic content. Suspended sediment is primar-ily fine sediment less than 63 μm in diameter. At Freeport on the Sacramento River the median percent of fine suspended sediment was 85% from July 1998 to September 2001, and the range was 46% to 98% (Schoellhamer and Wright 2003). Fine suspended sediment is cohesive, and small primary particles combine to form larger flocs of suspended sediment. In other systems, fine sediment in rivers is floccu-lated (Droppo and others 1997), and limited measure-ments from the Sacramento River at Freeport (Ganju, unpublished data) confirm this. Ganju and others (2007) estimate that the primary particle diameter is 2.5 μm. During a slack after ebb tide at Rio Vista, the median volumetric floc diameter (D50) increased from 20 μm near the water surface to 80 μm near the bed as a result of the settling of larger flocs in the water column (Ganju and others 2007). During maximum flood tide, D50 was 45 to 65 μm and more uniform in the water column. At slack after flood tide, D50 ranged from 40 to 110 μm increasing with depth. Salinity varied from 0 to 1.6 psu.
Schemel and others (1996) found that the particulate organic carbon (POC) content of suspended sedi-ment was inversely related to flow. During floods in 1983 and 1984, POC was 1% to 2% of the suspended sediment at Rio Vista. During periods of low flow,
Figure 2 Comparison of turbidity and SSC measurements, from four locations in San Francisco Bay. Source: Ganju and others 2007.
SAN FRANCISCO ESTUARY & WATERSHED SCIENCE
6
Time Scale
The time scale of our conceptual model is tidally-averaged. Sediment deposits and re-suspends dur-ing flood and ebb tides at the semidiurnal tidal time scale. For example, suspended-sediment deposits at slack tide when water velocity and turbulence are small, and bottom sediment is re-suspended when tidal currents and thus shear stresses increase. In addition, tidal currents are stronger and resuspension is more likely during fortnightly spring tides com-pared to neap tides. By integrating deposition and erosion over many tidal cycles, a tidally-averaged rate of deposition or erosion can be calculated. Thus, for the purposes of this conceptual model, while some of the drivers of sediment transport occur at tidal time scales, a tidally-averaged outcome results. Geomorphic change takes place over years and decades, and is estimated by summing deposition and erosion of the tidally-averaged model over time. While we are not attempting to resolve the tidal time scale, the model should, nonetheless, be applicable to tidal time scales.
Nontidal sedimentation processes are largely episodic. For example, rivers supply most sediment to the Delta during large floods over only a few days per year. This episodic nature is driven largely by sediment pulses from the Sacramento River that deposit sedi-ment in the Delta and move into Suisun Bay (Wright and Schoellhamer 2005; Figure 3). During water years 1999 to 2002, 82% of the sediment was delivered during the wet period (31% of the time) (Wright and Schoellhamer 2005). McKee and others (2006) found that for sediment supplied to Suisun Bay from the Delta: (1) a large flood in January 1997 transported 11% of the sediment supplied from 1995 to 2003; (2) 88% of the annual sediment supply occurred during the wet season; and (3) 43% of the annual sediment supply occurred during the wettest 30-day period. Another episodic forcing is wind waves and associat-ed sediment resuspension in shallow water generated by storms (Ruhl and Schoellhamer 2004).
Spatial Sub-Models
Our conceptual model includes linked submodels at three different spatial scales. First, a conceptual
submodel of riverine sediment supply considers how relevant processes in the watershed affect sediment supply to the Delta. Second, a regional transport submodel transports sediment from the rivers to the Delta, within the Delta itself, and between the Delta and Suisun Bay. Advection and dispersion move sus-pended sediment horizontally, and deposition and erosion occur along the transport pathway. Finally, we describe submodels of local erosion and deposi-tion for open water, marsh, floodplain, and riparian habitats. For brevity, only the open water and marsh submodels are presented in this paper. Floodplain and riparian models are available from Schoellhamer and others (2007b).
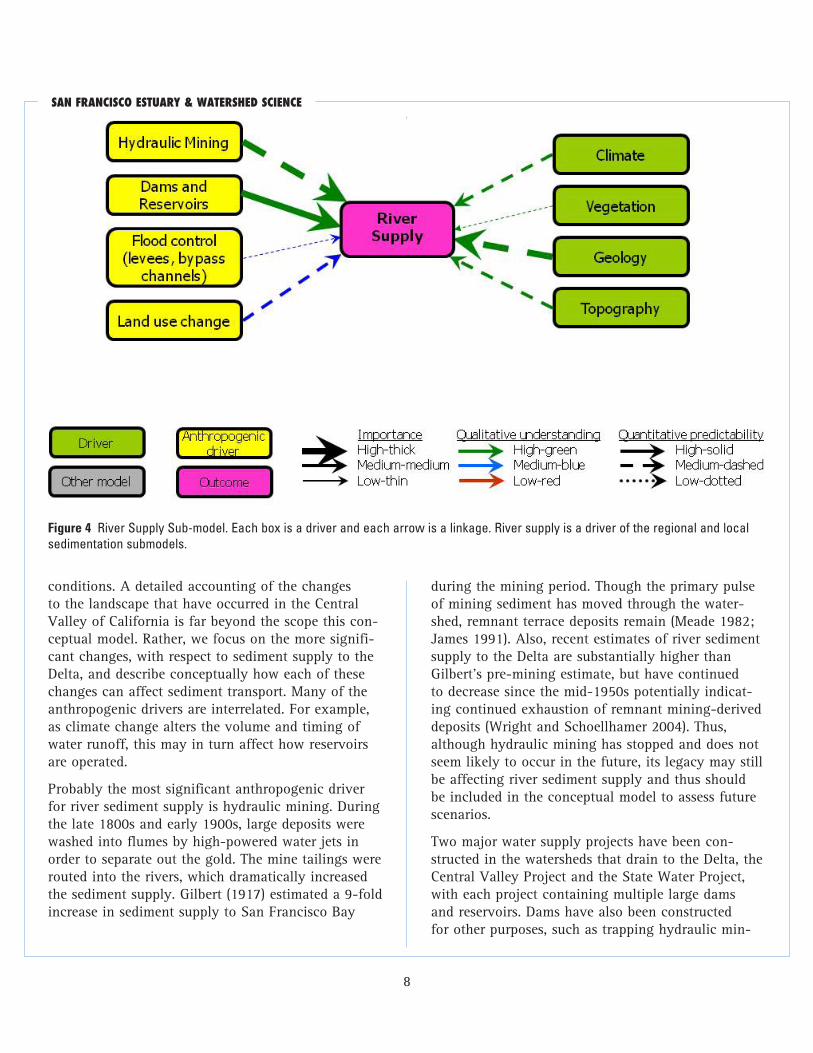
River Supply Sub-Model
The primary outcome of the river supply submodel (Figure 4) is the amount of suspended sediment that enters the Delta from river sources. Several stud-ies (e.g. Porterfield 1980; Wright and Schoellhamer 2005) have documented how the Sacramento River dominates in contributing sediment to the Delta. The structure of this conceptual submodel, however, is such that it could be used to describe the sediment supply from any of the Central Valley watersheds. This river supply submodel is not intended to be a complete watershed submodel.
The amount of water and sediment delivered to a watershed outlet, under natural conditions, is a com-plex function of the watershed's climate, geology, topography, and vegetation. For the watersheds that drain into the Sacramento–San Joaquin Delta, pre-cipitation comes primarily during winter months as rain and snow. Hydrologic processes acting through-out the watershed (e.g., snowmelt, evapotranspira-tion, infiltration, etc.) then determine the amount and timing of water (i.e., flow regime) that reaches the watershed outlet. The flow regime of the river (which sets the transport capacity, i.e., the amount of sediment that could be transported if the supply were unlimited) and the supply of sediment avail-able from the landscape determines the amount of sediment that reaches the watershed outlet. For the size of sediment that dominates the yield to the Delta (finer that 63 μm, or silt and clay), it is likely that the
OCTOBER 2012
7
available supply limits sediment transport volumes. Observations of seasonal variability in the relation-ship between sediment concentration and flow, where sediment concentrations are higher for the same flow during “first flush” events and lower during spring snowmelt events (Goodwin and Denton 1991; Schemel and others 1996; Curtis and others 2006) support the conclusion that fine sediment is supply limited. Thus, human activities that alter watershed sediment supply are likely to have a greater effect on river supply to the Delta than those that modify the flow regime (most activities influence both). In accord with this philosophy, we have not included
two anthropogenic drivers that primarily affect flow regime: climate change and consumptive water use.
Since the discovery of gold in 1848, the watersheds that drain to the Sacramento–San Joaquin Delta have been heavily affected by human activities (Gilbert 1917; James 1991; Singer and others 2008). In gen-eral, human activities tend to increase the amount of sediment transported in rivers through soil erosion, but this increase can be offset by sediment retention in reservoirs, leading Syvitski and others (2005) to conclude that the worldwide flux of terrestrial sedi-ment to the oceans has decreased from prehuman
Figure 3 Tidally-averaged suspended sediment flux in the Delta, 1998–2002. Arrows indicate downstream/down estuary flow paths for the Sacramento (left) and San Joaquin (right) rivers. The vertical scale for the Sacramento River flow path is larger than that for the San Joaquin River flow path and Threemile Slough (TMS). Sacramento River at Freeport (FPT) and Rio Vista (RVS), San Joaquin River at Vernalis (VNS), Stockton (STN), and Jersey Point (JPT), and Mallard Island (MAL) are also shown. Source: Wright and Schoellhamer 2005.
SAN FRANCISCO ESTUARY & WATERSHED SCIENCE
8
conditions. A detailed accounting of the changes to the landscape that have occurred in the Central Valley of California is far beyond the scope this con-ceptual model. Rather, we focus on the more signifi-cant changes, with respect to sediment supply to the Delta, and describe conceptually how each of these changes can affect sediment transport. Many of the anthropogenic drivers are interrelated. For example, as climate change alters the volume and timing of water runoff, this may in turn affect how reservoirs are operated.
Probably the most significant anthropogenic driver for river sediment supply is hydraulic mining. During the late 1800s and early 1900s, large deposits were washed into flumes by high-powered water jets in order to separate out the gold. The mine tailings were routed into the rivers, which dramatically increased the sediment supply. Gilbert (1917) estimated a 9-fold increase in sediment supply to San Francisco Bay
during the mining period. Though the primary pulse of mining sediment has moved through the water-shed, remnant terrace deposits remain (Meade 1982; James 1991). Also, recent estimates of river sediment supply to the Delta are substantially higher than Gilbert’s pre-mining estimate, but have continued to decrease since the mid-1950s potentially indicat-ing continued exhaustion of remnant mining-derived deposits (Wright and Schoellhamer 2004). Thus, although hydraulic mining has stopped and does not seem likely to occur in the future, its legacy may still be affecting river sediment supply and thus should be included in the conceptual model to assess future scenarios.
Two major water supply projects have been con-structed in the watersheds that drain to the Delta, the Central Valley Project and the State Water Project, with each project containing multiple large dams and reservoirs. Dams have also been constructed for other purposes, such as trapping hydraulic min-
Figure 4 River Supply Sub-model. Each box is a driver and each arrow is a linkage. River supply is a driver of the regional and local sedimentation submodels.
OCTOBER 2012
9
ing sediments. The U.S. Army Corps of Engineers National Inventory of Dams (http://geo.usace.army.mil/pgis/f?p=397:3:0::NO::P3_STATES:CA) contains 1,468 dams in California (see web page for inclu-sion criteria) and Nilsson and others (2005), in their recent study of flow regulation of the world’s large river systems, classified the Sacramento–San Joaquin basin as “strongly affected” by dams. Dams primarily affect the reservoir by retaining sediment in it; the channel immediately downstream from the dam will be sediment-deficient and erode to a new equilibrium (Porterfield and others 1978). While this provides a short-term sediment source, the long-term effect is decreased sediment supply (Williams and Wolman 1984). Dams also affect the flow regime, typically reducing high flows and increasing low flows (Singer 2007), which also reduces downstream sediment sup-ply. It follows that dam removal (compared to keep-ing the dam in place) would increase downstream sediment supply by making reservoir sediment depos-its available (short-term) and by no longer retaining incoming sediment (long-term).
A major system of levees and bypass channels has been constructed in the basin to reduce flood hazards, particularly in the lower reaches of the Sacramento River watershed (Kelley 1998). Before this flood-control system, the Sacramento River would overflow its banks and fill vast flood basins for significant periods of time during wet years. More than half the banks of the lower Sacramento River were riprapped during the latter half of the 20th century (USFWS 2000; Florsheim and others 2008). While bank protection would tend to reduce sedi-ment supply from the banks of the river, levees tend to confine flood flows, potentially resulting in ero-sion of the channel bed and increased sediment sup-ply. The levees also serve to isolate the flood basins, which were likely depositional environments during floods, keeping the flood flows and suspended sedi-ment in the channel. However, flood-control bypasses built in the Sacramento River floodplain during the early 20th century (e.g., Yolo Bypass) provide a simi-lar function as the flood basins because they trap substantial amounts of sediment (Singer and others 2008). Thus, the various flood-control measures that have been implemented affect sediment supply in dif-
ferent ways, and these processes have not been quan-tified such that a net effect can be discerned.
Much of the Central Valley has been transformed to agricultural and urban land uses. Logging has also taken place in many of the watersheds. As stated previously, human transformation of the landscape typically results in increased soil erosion (Syvitski and others 2005), thus increasing river sediment sup-ply. Though dams and reservoirs may counteract this effect, many of the land-use changes, particularly by agriculture and urbanization, have taken place down-stream from the major dams in the system. Thus, these changes are likely to have increased sediment supply to the Delta; even in the early 1900’s Gilbert (1917) estimated substantial increases in sediment supply from human activities other than mining. Today, erosion-control practices are often used to minimize these effects.
There has been no comprehensive study of the anthropogenic drivers of sediment supply, so deter-mination of their relative importance is difficult. Wright and Schoellhamer (2004) showed that the amount of sediment trapped annually in just Oroville, Folsom, and Englebright dams in the Sacramento River watershed (2.4 Mm3 yr-1) is of the same order of magnitude as the annual watershed sediment sup-ply, indicating that dams are significantly affect-ing the supply. Singer and others (2008) calculated sediment-deposition rates in flood bypasses that total 1.3 Mm3 yr-1, about one-half the deposition rate in the three reservoirs. It is more difficult to similarly quantify the effects of the other anthropogenic effects (land-use changes, levee protection), and the stud-ies required to do this have not yet been conducted. However, given the extensive land-use changes that have occurred in the Central Valley, and the under-standing that these changes generally result in accel-erated erosion (ASCE 1975; Syvitski and others 2005), it seems likely that land-use changes have been an important driver of river sediment supply.
Regional Transport Submodel
The Delta is where the rivers that drain the Central Valley merge and become an estuary. The regional transport submodel (Figure 5) transports sediment
from the rivers into the Delta. The regional model also transports sediment from the Delta to Suisun Bay. It is also possible to transport sediment from Suisun Bay landward into the Delta because of the complex hydrodynamics in Suisun Bay and the west-ern Delta (see below).
For the regional transport submodel, the Delta is rep-resented as a triangle (Figure 5). The northeast (upper right) apex is where the Sacramento River enters the Delta, and the southeast (lower right) apex is where the San Joaquin River enters. For convenience, these apexes are considered at the U.S. Geological Survey (USGS) sediment gages at Freeport on the Sacramento River and Vernalis on the San Joaquin River. The Yolo Bypass diverts high Sacramento River flows around the city of Sacramento to the Delta, and is shown as an arrow entering the northwest side. The Mokulumne and Cosumnes rivers enter on the east side. The western (left) apex is the boundary between
Suisun Bay and the Delta located at the USGS con-tinuous suspended-sediment monitoring station at Mallard Island.
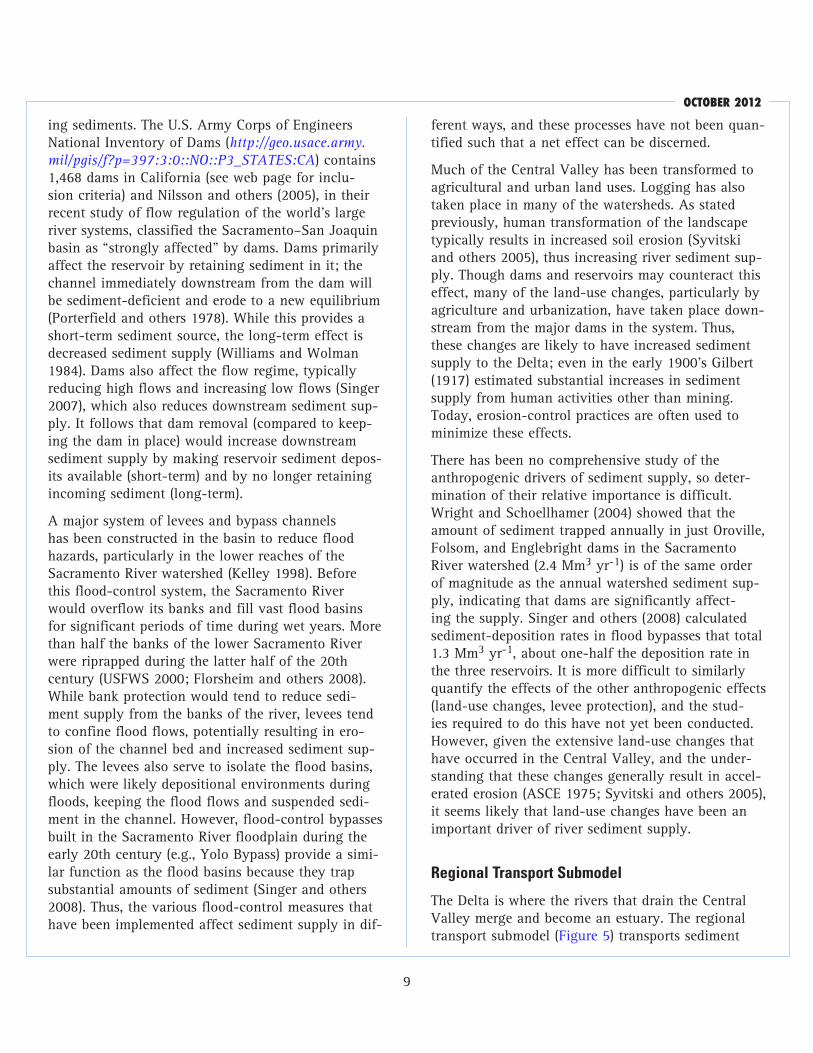
Several rivers supply sediment to the Delta, primar-ily the Sacramento River. During water years 1999 to 2002 the sediment discharge at Freeport (FPT) on the Sacramento River was 5 times greater than the San Joaquin River at Vernalis (Wright and Schoellhamer 2005; Figure 6, VNS). Sediment discharge at Freeport decreased by about one-half from 1957 to 2001 (Wright and Schoellhamer 2004). Reduced sediment supply reduces sediment deposition in the Delta; deposition rates were 4 to 8 times greater from 1944 to 1972 than 1972 to 2005 (Canuel and others 2009). In addition, total suspended solids concentrations in the Delta decreased 50% from 1975 to 1995 (Jassby and others 2002). The second largest source of sedi-ment was the Yolo Bypass (YOL, 28% of the sediment discharge at Freeport). The east side tributaries (EAST)
Figure 5 Regional submodel of sediment transport in the Delta. Line thickness indicates the approximate importance of external sedi-ment supplies (see Figure 6). The Delta exchanges sediment with Suisun Bay.
OCTOBER 2012
11
supplied only 3.3% of the sediment discharge at Freeport. Most sediment is supplied during high flows (Schemel and others 1996; Wright and Schoellhamer 2005; McKee and others 2006).
State and federal water projects export water from the southern Delta (Figure 6, EXP). Wright and Schoellhamer (2005) used sediment deposition vol-umes in Clifton Court Forebay to estimate that exported sediment was about 2% of the sediment dis-charge at Freeport.
Tidally-averaged sediment transport is usually from the Delta into Suisun Bay. For water years 1999 to 2002, Mallard Island suspended sediment flux was seaward, and 51% of the Freeport sediment discharge (Wright and Schoellhamer 2005). On a daily time scale, which is roughly tidally-averaged, McKee and others (2006) found that sediment trans-port was landward on 9 of 198 days for which data were available. Occasional net sediment transport from Suisun Bay into the Delta can be caused by small river flows, gravitational circulation, mete-orologically-forced tidally-averaged flow into the Delta (Tobin and others 1995), and tidal asymmetries
such as greater bottom shear stress during flood tide (Brennan and others 2002) and higher concentrations in Suisun Bay from wind-wave re-suspension (Ruhl and Schoellhamer 2004) or a turbidity maximum (Schoellhamer 2001). Landward sediment transport is approximately 11% of the seaward sediment trans-port during high flows and 52% during low flows (McKee and others 2006). On a tidal time scale, flood tides transport sediment from Suisun Bay into the Delta and ebb tides reverse sediment transport. Tides thus exchange and mix suspended sediment between Suisun Bay and the Delta.
Water movement within the Delta transports sus-pended sediment horizontally, which is represented with gray arrows in the regional submodel (Figure 5). Horizontal transport has two components we will consider: advection is the down current displace-ment of suspended sediment; dispersion is the mixing caused by turbulence and large eddies. For example, a pulse of sediment delivered from a river will oscil-late upstream and downstream because of flood and ebb tides resulting from advection, move closer to the bay after each tidal cycle due to tidal averaging of
Figure 6 Average annual Delta sedi-ment budget based on water years 1999–2002, except for Threemile Slough (TMS), which is based on water years 2001 and 2002 only. Numbers are the annual suspended-sediment flux and the estimated error in thousand metric tons. Arrow thickness indicates relative magnitude of the suspended-sediment flux. Sediment deposition accounts for the decreased sediment fluxes from east to west. Additional sites are Sacramento River at Freeport (FPT), Yolo Bypass (YOL), Delta Cross Channel (DCC), Sacramento River at Rio Vista (RVS), Mallard Island (MAL), Eastside tributaries (EAST), San Joaquin River at Vernalis (VNS), San Joaquin River at Stockton (STN), exports from the State and Federal water projects (EXP), Dutch Slough (DCH), and San Joaquin River at Jersey Point (JPT). Source: Wright and Schoellhamer 2005.
SAN FRANCISCO ESTUARY & WATERSHED SCIENCE
12
the downstream river flow, and spread out as a result of dispersion.
Suspended sediment has an additional complication because the bed acts as a source because of, ero-sion or sink because of deposition, represented by blue arrows in the regional submodel (Figure 5). For example, to determine the quantity of sediment from the Sacramento River delivered to a point in the Delta, horizontal transport and deposition and erosion along the transport pathway must be considered. On the tidal time scale, deposition is more likely to occur near slack tides when water velocity and turbulence are small, and erosion is more likely to occur dur-ing strong tides when water velocity and turbulence are greatest. On a time scale of years, Wright and Schoellhamer (2005) found that two-thirds of the sediment that entered the Delta was deposited in the Delta during water years 1999 to 2002.
Regional spatial variability of suspended sediment within the Delta is dominated by supply from the Sacramento River. The Sacramento River is the pri-mary pathway for sediment transport (Wright and Schoellhamer 2005; Figure 6). At least 82% of the sediment entering the Delta from the Sacramento River watershed either deposits along the Sacramento River or moves past Mallard Island into Suisun Bay. No more than 18% moves into the San Joaquin River portion of the Delta. The suspended-sediment signal of the San Joaquin River attenuates more rap-idly than that of the Sacramento River (Wright and Schoellhamer 2005; Figure 3).
Local Sedimentation Sub-Models
Local processes determine how fast sediment erodes from the bed and how fast suspended sediments settle onto the bed. As a parcel of water moves from the river into the Delta, it tidally oscillates within the Delta, and ultimately exits the Delta. Erosion, deposition, and dispersion determine the suspended-sediment concentration (SSC) of the parcel and the properties of the suspended sediment (primarily size, density, organic content, and settling velocity). At a fixed point in the Delta, the time history of erosion and deposition determine the properties of the bed material. Tidally-averaged rates of deposition and
erosion are integrated over decades to determine the geomorphic evolution of a fixed point in the Delta.
Local sedimentation processes will differ in different habitats. In this paper, we present local sedimenta-tion submodels for open water and marsh habitats. Schoellhamer and others (2007b) also present local sedimentation submodels for floodplain and riparian habitats. Each local sedimentation submodel contains the same drivers and outcomes; only the importance, qualitative understanding, and quantitative predict-ability of the linkages differ.
The open water submodel (Figure 7) includes chan-nels and flooded islands. Delta channels provide the pathways for sediment from the watershed to move through the Delta and enter Suisun Bay (Wright and Schoellhamer 2005).
The marsh submodel for sedimentation (Figure 8) dif-fers from the open water submodel in several ways. Vegetation has a stronger influence on sedimentation in a marsh compared to open water because it damp-ens hydrodynamic energy, which favors deposition over erosion. Thus, the marsh submodel shows depo-sitional linkages being more important than erosional linkages. Vegetation can also provide shading, so the effect of suspended sediment on water column light is less important than open water. Dredging, filling, and armoring now rarely occur in marshes so we consider them inconsequential. A common goal of restoration projects is to encourage marsh vegetation, so we consider the linkage between restoration and vegetation to be highly important. We do not con-sider eposition of leaf litter in this submodel.
Most of the drivers are fundamental physical pro-cesses that are always present in all habitats and the linkages between these drivers are generally impor-tant. Some drivers may or may not be present at a given location (i.e. restoration, dredging, fill, vegeta-tion) and are irrelevant if absent. Because the drivers are linked by fundamental physical laws, the con-ceptual linkages between drivers are well understood. This includes the direction of change, i.e., increased bed stress will erode, not deposit, bottom sediment. Quantitative prediction of the linkages, however, is generally very difficult. This is especially true for erosion. Marshes tend to be depositional, so our limi-
OCTOBER 2012
13
tations on quantitative prediction of erosion are less daunting.
Water in the Delta moves primarily because of tides, waves, river flows, and pumping. Moving water exerts shear on sediment particles in the bed. Turbulence that causes vertical mixing is also gener-ated. In general, faster water generates more shear stress and turbulence. Larger flows from rivers and stronger tides (i.e. spring tides) increase shear stress and turbulence (Brennan and others 2002). Waves
with relatively large height and period will apply greater shear to the bed and increase erosion (Ruhl and Schoellhamer 2004). Winds are strongest and waves largest during spring and summer. Waves gen-erated by boats can also induce erosion from the bed and bank. Bauer and others (2002) found that levees in Georgiana Slough eroded 0.01 to 0.22 mm per boat passage.
Local erosion and deposition is a key driver that affects all model outcomes (SSC and properties, water
Figure 7 Local sedimentation submodel for open water. Each box is a driver and each arrow is a linkage. An increase in a driver either increases (+) or decreases (-) the intermediate outcomes it affects. In addition to being outcomes, purple boxes are also drivers. In addition to being drivers, several green boxes are also intermediate outcomes. The regional submodel is shown in Figure 5.
SAN FRANCISCO ESTUARY & WATERSHED SCIENCE
14
column light, bed particle size and properties, and geomorphic change). Erosion and deposition alter SSC and properties. Net erosion increases SSC, and net deposition decreases SSC. For non-cohesive sedi-ment, erosion of coarser material increases the aver-age settling velocity of suspended sediment. Coarser material settles faster than finer material, so settling velocity will decrease as deposition occurs.
Model outcomes of SSC and properties and bed particle size and properties are also drivers of local erosion and deposition. Bed shear stress and verti-
cal mixing are additional drivers that affect local erosion and deposition. These hydrodynamic drivers are intermediate outcomes from geographic, anthro-pogenic, and other hydrodynamic drivers and the geomorphic change outcome/driver.
As erosion and deposition occur at a site, the bed elevation will change, especially over many years. For example, large sediment supply during the period of hydraulic mining in the late 1800s caused deposi-tion in Sacramento Valley rivers, the Delta, and San Francisco Bay (Gilbert 1917). Channels may fill in or
Figure 8 Local sedimentation submodel for marsh. Each box is a driver and each arrow is a linkage. An increase in a driver either increases (+) or decreases (-) the intermediate outcomes it affects. In addition to being outcomes, purple boxes are also drivers. In addition to being drivers, several green boxes are also intermediate outcomes. The regional submodel is shown in Figure 5.
OCTOBER 2012
15
scour. When deposition (including organic accumula-tion from plant material) on a tidal marsh equals or exceeds sea-level rise, the marsh is sustainable. When deposition is less than sea-level rise, the marsh will eventually become permanently flooded. In this con-ceptual model, local erosion and deposition are con-sidered on a tidally-averaged time scale. Geomorphic change takes place on a decadal time scale, and is the sum (or integration) of local erosion and deposition. That integration includes any episodic riverine supply or erosion events.
Erosion and deposition also alter bed particle size and properties. If bed shear stress exceeds a critical value, particle motion will occur (ASCE 1975), which decreases the stability of the bed and the potential for submerged aquatic vegetation to establish and grow (see DRERIP aquatic plant model, http://www.dfg.ca.gov/ERP/conceptual_models.asp). Erosion tends to winnow finer sediment from the bed, making the bed coarser. Deposition supplies new sediment to the bed, changing organic content, and usually decreasing bed particle size. For cohesive sediment, newly deposited material will have a low density and be relatively erodible (Brennan and others 2002). Consolidation and biostabilization decrease the erodibility of cohe-sive bed sediment with time (Mehta 1989; Widdows and others 2000). Sediment beds that contain both cohesive and non-cohesive sediment generally become less erodible as the fraction of fine cohesive sediment increases (Le Hir and others 2008).
If present, anthropogenic factors can greatly affect local suspended sediment. To prevent erosion, large boulders (rip-rap) are often placed on levees and the sides of channels. Armoring increases bed par-ticle size and decreases erosion. Dredging deepens channels and can suspend bottom sediment. Fill or dredged material disposal decreases water depths and suspends sediment. Filling estuaries and diking tidal wetlands can reduce tidal prism in an estu-ary, which decreases tidal velocities and increases deposition (Hood 2004). Wetland restoration projects are designed to increase vegetation and to provide low hydrodynamic energy at the restoration site to encourage deposition. Restoration of tidal flooding to diked lands can increase tidal prism and tidal veloci-
ties in channels adjacent to the restoration site, which in turn can erode the channels (Kirby 1990).
DISCUSSION
The model includes vegetation and sea-level rise feedback loops, and demonstrates that managing regional transport can affect the distribution of sus-pended sediment in the Delta.
Vegetation Feedback Loops
The ability of macrophytes to slow water velocity is well established (Carpenter and Lodge 1986; Sand–Jensen and Mebus 1996). Macrophytes can choke streams and slow flow, sometimes forming dams that alter channel morphology and width (Wilcox and others 1999). The effect of a particular macrophyte on flow is strongly related to its areal extent, density, canopy height, and phenology. There is a threshold velocity (i.e., extreme events) over which macro-phytes can no longer reduce flow but simply bend out of the way (Wilcox and others 1999).
By reducing velocity, macrophytes attenuate waves and reduce vertical mixing and bed shear stress, which in turn leads to deposition of sediment (Yang 1998; Braskerud 2001). Sedimentation in wetlands and near-shore environments is a function of sedi-ment supply and retention. Whereas sediment sup-ply depends on watershed processes (Wright and Schoellhamer 2004), sediment retention is greatly influenced by local-scale factors such as plant com-munity composition and particular plant species characteristics (Eisma and Dijkema 1997; Pasternack and Brush 1998, 2001; Alizai and McManus 1980). Sedimentation rate is strongly related to plant archi-tecture, canopy height, and plant density (Yang 1998; Alizai and McManus 1980; Leonard and others 2002).
Our open water submodel assumes that vegetation is not an important factor (Figure 7). An exception is the plant Egeria densa, which invaded some of the open waters of the Delta beginning in the 1960s (Jassby and Cloern 2000) and is a likely contribu-tor to the decline in Delta turbidity (Nobriga and others 2008). A positive feedback loop in our con-
ceptual model demonstrates how Egeria densa could successfully invade the Delta and reduce turbidity. Where submerged aquatic vegetation successfully colonizes, hydrodynamic energy and bed shear stress are reduced (Carpenter and Lodge 1986; Sand–Jensen and Mebus 1996). This increases local deposition, which decreases local SSC (Yang 1998; Braskerud 2001). Tidal currents transport this clearer water within the Delta (Figure 7). Thus, Egeria densa fil-ters suspended sediment out of the water that passes through it, and that clearer water moves elsewhere in the Delta and mixes with more turbid water to reduce turbidity elsewhere. Increased light in the water column at the colonization site and downcurrent (landward and seaward because of bidirectional flow) increases vegetation (via the DRERIP aquatic plant model). This increase in vegetation further decreases hydrodynamic energy in this positive feedback loop.
Inundation of the marsh plain via sea-level rise also establishes another positive feedback loop. As sea level rises, plants at lower elevations are the first to be lost because they drown. This results in less over-all organic accumulation on the marsh plain and less trapping of sediment, which ultimately accelerates drowning in other areas of the marsh (Kirwan and others 2008; D’Alpaos 2011). In the worst-case sce-nario, as sea level continues to rise, the entire marsh drowns and converts to open water habitat. The rate at which this process unfolds strongly depends on the rate of sea-level rise, sediment availability from the watershed and wind-wave re-suspension, and above-ground and below-ground productivity. Other fac-tors that also may be important in particular marsh settings include bioturbation, tidal meandering, and plant species composition of the marsh (Morris 2006; D’Alpaos 2011).
Water depth also affects vegetation colonization. Only where the land surface elevation is greater than mean tide level, can brackish emergent vegeta-tion colonize the site (Orr and others 2003). In salt marshes in the South Bay, vegetation was shown to colonize in the range between 0.98 and 2.94 m above mean low water (Orlando and others 2005). Freshwater emergent vegetation colonizes down to 0.2 m below mean lower low water (Simenstad and others 2000).
Sea-Level Rise Feedback Loop
Water depth affects hydrodynamics. As cross-section-ally averaged water depth decreases due to deposition or fill, water velocity will increase if the landward tidal prism and water flow passing through that point is unchanged or increases. As cross-sectionally aver-aged water depth increases because of erosion, dredg-ing, or sea-level rise, water velocity will decrease if the landward tidal prism and the water flow that passes through that point is unchanged or decreases. Wave bottom orbital velocity and the resulting bot-tom shear stress increases as water depth decreases (Dean and Dalrymple 1984). Because of water depth, geomorphic change is both an outcome and driver of this model.
Unlike the vegetation positive feedback loops, sea-level rise in open waters creates a negative feedback loop. Sea-level rise increases water depth, which decreases hydrodynamic energy and bed shear stress, thus increasing the rate of deposition. The net result is that water depth will increase at a slower rate than sea-level rise. Ganju and Schoellhamer (2010) con-ducted 30-year scenarios of sea-level rise and sedi-mentation in Suisun Bay, and found that deposition increased but did not keep up with an assumed sea-level rise of 2 mm yr-1. Thus, increased deposition can reduce the effect of sea-level rise on water depth. This negative feedback loop, however, may still not be enough to prevent marsh drowning. Pfeffer and others (2008) estimated that sea level will rise 800 to 2,000 mm during the 21st century, a much greater rate than Ganju and Schoellhamer (2010) assumed. If sea-level changes are large enough to increase hydro-dynamic energy, by increasing tidal prism or fetch for example, then feedback may be positive rather than negative.
Managing Regional Transport
Regional transport is a driver of SSC and suspended-sediment properties at a specific site in the Delta. Regional drivers of local suspended sediment and properties are shown in the dashed box in Figures 7 and 8. River supply is probably the most important regional driver, and it is discussed in the river supply submodel. Exchange with Suisun Bay was discussed
OCTOBER 2012
17
in the regional submodel. Bay and river boundary conditions communicate with any point in the Delta via advective and dispersive transport and local ero-sion and deposition along the transport pathway. An example of regional influence is that the domi-nant sediment transport pathway in the Delta is the Sacramento River (Figure 3, Wright and Schoellhamer 2005) and wetland deposition is greatest along the Sacramento River (Reed 2002).
Suspended-sediment concentration and the local properties of SSC and bed sediment are controlled by the interaction between river supply and the hydro-dynamics in the Delta. Thus, manipulations of Delta hydrodynamics through reservoir releases, pumping rates, or gate operations may affect the distribution of suspended-sediment concentration and bed-particle size throughout the Delta, and are probably the most feasible techniques for influencing sedimentation in the Delta. For example, during flooding on the San Joaquin and Sacramento rivers when sediment delivery to the Delta is high, the SSC distribution in the Delta could potentially be manipulated through pump and gate operations. Predicting these outcomes is beyond the capabilities of a conceptual model and requires numerical modeling (discussed below).
Restoration
Marshes that are restored via levee breaches start their development as open water habitats. Depositing sediment increases the elevation of the site until veg-etation eventually colonizes the site and creates a marsh. Deposition rate at a restoration site increases as SSC of the water that inundates the site increases. Williams and Orr (2002) used a numerical model to show the effect of SSC on vertical accretion in salt marshes, assuming no erosion of bottom sediment (Figure 9). Vertical accretion of inorganic sediment when SSC is 100 mg L-1 is about 0.025 m yr-1. SSC in the Delta is usually less than 100 mg L-1, the smallest SSC considered in Williams and Orr's study, so it would take at least several decades for one meter of sediment to deposit at a Delta restoration site.
In tidal freshwater marshes such as the Delta, how-ever, organic accumulation is a much larger con-
tributor to marsh formation than it is in saltwater marshes. Organic accumulation includes root bio-mass, plant litter, and any allochthonous inputs from the watershed (Schlesinger 1997). Organic accumula-tion in tidal freshwater marshes has been shown to be of greater importance than inorganic sediment for vertical accretion (Neubauer 2008; Drexler 2011). Therefore, although inorganic sedimentation may be relatively low in Delta marshes, the overall verti-cal accretion rate may be considerably greater than Williams and Orr (2002) estimated because of organic accumulation.
Uncertainty
Here we discuss some key uncertainties of the con-ceptual model, but this is not intended as a complete discussion of uncertainties about sedimentation in the Delta. The sediment budget for the Delta (Figure 6) is quantitatively uncertain. Most of the values are based on only 4 years of data and may not represent future conditions. The second-largest source of sediment is the Yolo Bypass which provides 28% of the sedi-ment discharge of the Sacramento River at Freeport
Figure 9 Effect of SSC on marshplain evolution over time for a site sheltered from wind-wave action. Shaded bar identifies the approximate Spartina colonization elevation. Prediction is based on tides at the San Francisco Presidio, no sea-level rise, and 550 kg m-3 dry density of inorganics typical for San Francisco Bay. National Geodetic Vertical Datum (NGVD) is a vertical datum fixed at the mean sea level of 1929. Source: Williams and Orr (2002).
SAN FRANCISCO ESTUARY & WATERSHED SCIENCE
18
(Figure 6, YOL). Wright and Schoellhamer (2005) used a rating curve based on data from 1957 to 1961 and 1980 to determine Yolo Bypass sediment flux, and a large uncertainty (42%) is associated with that value. In addition, the effect of decreased sediment yield from the Sacramento Valley is unknown, because of lack of data. Uncertainty in sediment supply leads to uncertainty in answering basic questions about the Delta, such as what the deposition rate is, the quan-tity of sediment available for restoration, and whether the Delta will be sustainable given sea-level rise. The east side tributaries (Figure 6, EAST) supplied only 3.3% of the sediment discharge at Freeport using sim-ilarly outdated rating curves. Current data on sedi-ment supply are needed to reduce uncertainty.
Sediment discharge at Freeport decreased by about one-half from 1957 to 2001 (Wright and Schoellhamer 2004). Whether or not that trend will continue is a key uncertainty in predicting future geomorphic changes to the Delta and northern San Francisco Bay (Ganju and Schoellhamer 2010).
Overall, within the conceptual model, physical pro-cesses are qualitatively understood but difficult to quantify. Erosion is more difficult to quantify than deposition. Biological processes that affect sedimenta-tion are not as well understood qualitatively, and are very difficult to predict quantitatively. Thus, studies to quantify sediment supply and physical processes and studies of the interaction of biota and sedimenta-tion are needed.
From Conceptual to Numerical Modeling
The conceptual model described herein is a useful tool for describing the fundamentals of sediment transport in the Delta as well as some of the impor-tant feedback loops. It also provides the basis for the development of numerical modeling tools that would provide more predictive capabilities. The concep-tual framework remains the same, while the drivers become boundary conditions, the linkages become the numerical algorithms, and the outcomes are the numerical model results. Thus, a numerical model of the Delta would use the river supply as boundary conditions, along with a numerical model of Delta hydrodynamics, to predict local SSC, bed sediment
properties, and geomorphic change. The primary link-ages are relations for erosion and deposition rates, which in turn depend on local hydrodynamics, SSC, and bed size and properties (i.e. bed erodibility).
Information gaps that need to be filled to develop an accurate numerical sediment transport model for the Delta can be identified with the conceptual model presented in this paper. The key information gaps are boundary conditions of the regional transport sub-model (Figure 5), initial condition of the bed, data on important but poorly quantified linkages (Figures 7 and 8), and suspended-sediment flux and tempo-ral bed sediment data to calibrate and validate the numerical model.
Numerical models simulate a fixed domain and are driven by external boundary conditions. For a numerical model of sedimentation in the Delta, the regional transport model (Figure 5) shows the exter-nal boundary conditions that need to be measured. Suspended-sediment flux in the Sacramento River at Freeport and San Joaquin River at Vernalis has been measured for many years by the USGS. The Yolo Bypass is the second largest source of sedi-ment to the Delta (Figure 6) and sediment discharge measurements were restarted in WY2011. Sediment discharge from the eastside tributaries is smaller and measurements were restarted in WY2011. The Yolo Bypass is the second largest source of sediment to the Delta (Figure 6) and sediment discharge measure-ments was restarted in WY2011. Sediment discharge from the eastside tributaries is smaller and measure-ments were restarted in WY2011. McKee and others (2006) estimated net sediment discharge from the Delta to Suisun Bay but it is not measured directly. Measurements at these unmeasured locations would provide the boundary condition data needed to accu-rately drive a numerical model.
Initial conditions must also be supplied to a numeri-cal model. The bed property that has the greatest effect on sediment transport is the size of surficial bed sediment. While periodic sampling has occurred at a range of sites in the Delta, no comprehensive compilation and analysis is currently available. Delta-wide bed-sediment sampling the USGS initiated
OCTOBER 2012
19
in WY 2011 should provide the most comprehensive assessment to date.
Important but poorly quantified linkages are shown by thick dotted lines in Figures 7 and 8. These repre-sent the physical processes that would limit accuracy of a numerical sedimentation model and are primarily associated with erosion and deposition. To select an optimal erosion algorithm and coefficients, erosion experiments can be conducted in situ (Amos and oth-ers 2010) or with undisturbed sediment cores (McNeil and others 1996; Law and others 2008; Le Hir and others 2008). To better quantify deposition, especially of fine cohesive sediment, images of particles col-lected by video cameras can be analyzed (Manning and Dyer 2002). An additional important but poorly quantified linkage in the marsh submodel is the effect of vegetation on hydrodynamics, which, in turn, affects sediment deposition. It has long been known that sediment deposition decreases along a transect from a tidal channel into a marsh (e.g., Hatton and others 1983), however, it is unclear how much depo-sition decreases with various types of emergent and submersed vegetation. Therefore, factors such as the structure, areal extent, density, and phenology of dominant marsh plants, which have all been shown to influence sediment deposition and flow velocity (e.g., Carpenter and Lodge 1986; Wilcox and others 1999), need to be better understood to construct an accurate numerical sedimentation model.
To calibrate model coefficients to data, and to test the model by validating it with an independent data set, measurements of suspended-sediment flux (mass per unit time) within the Delta are preferred to measure-ments of concentration (mass per unit volume) (Ganju and Schoellhamer 2009). To accurately simulate geo-morphic change or the load of sediment-associated contaminants, the model must accurately simulate sediment flux. For example, to accurately simulate whether a segment of the Delta is sustainable given sea-level rise, the model must deliver and carry away the correct masses of sediment to and from the seg-ment. During WY 2011 the U.S. Geological Survey began to continuously measure sediment flux at key locations in the Delta, similar to those used by Wright and Schoellhamer (2005) to develop the sedi-ment budget in Figure 6. Velocity-weighted, cross-
sectionally averaged samples of SSC are collected and used to calibrate a continuous point measurement of turbidity. To calculate suspended-sediment flux at a site, the resulting continuous SSC time series is multi-plied by continuously measured water discharge. The measurements have to be continuous because of tidal variability and episodic floods. Measurements of how surficial bed sediment size varies in time also provide calibration and validation data for a numerical model.
CONCLUSIONS
The sedimentation conceptual model demonstrates two key feedback loops. Emergent macrophytes and Egeria densa act as ecosystem engineers that can cre-ate a positive feedback loop for sedimentation. This feedback loop helps explain the successful invasion of the Delta by Egeria densa since the 1960s and its effect on Delta turbidity. It also highlights the importance of maintaining existing marsh vegeta-tion to prevent extensive marsh drowning if sea-level rise accelerates greatly. Sea-level rise in open water is partially countered by a negative feedback loop that increases deposition if there is a net decrease in hydrodynamic energy. Manipulation of regional sedi-ment transport is probably the most feasible method to manipulate SSC to create or control turbidity and thus fish habitat.
Other conclusions include:
1. Sediment supply: Sediment supply is decreasing as a result of trapping behind dams, deposition in flood bypasses, protection of river banks, and diminishment of the hydraulic mining sediment pulse. About two-thirds of the sediment that enters the Delta from the rivers deposits in the Delta.
2. Sustainability: The Delta is depositional, and ade-quate sediment deposition is required for wetlands to keep up with sea-level rise. If sediment supply continues to decrease, and if sea-level rise accel-erates, it will become more difficult to sustain the existing Delta landscapes and habitats.
3. Restoration: Typical SSCs in the Delta range from 10 to 50 mg L-1 except during river floods when the SSC can exceed 200 mg L-1. Natural inorganic
SAN FRANCISCO ESTUARY & WATERSHED SCIENCE
20
wetland sedimentation when SSC is 100 mg L-1 is about 0.025 m yr-1, so inorganic sediment depo-sition rates in the Delta typically are smaller than this value. Plants provide organic accumulation that can exceed inorganic deposition.
4. Light and biota: Suspended sediment is the pri-mary attenuator of sunlight in the water column of the Delta. Photosynthesis, primary production, and fish behavior depend on light, and are likely to change if sediment supply and turbidity con-tinue to decrease.
5. Model uncertainty: Physical processes are quali-tatively understood but difficult to quantify. Erosion is more difficult to quantify than deposi-tion. Biological processes that affect sedimenta-tion are not as well understood qualitatively, and are very difficult to predict quantitatively.
6. Numerical modeling: The conceptual model indi-cates that boundary conditions, bed sediment size, erosion, deposition, biological processes, and suspended-sediment fluxes are key information gaps that need to be filled to develop an accurate numerical model of sedimentation in the Delta.
ACKNOWLEDGEMENTS
We thank David Fryberg, Denise Reed, Stuart Siegel, Mark Stacey, the DRERIP review panel, and the other DRERIP model authors for their assistance in devel-oping this model. Justin Ferris, Mick van der Wegen, and two anonymous reviewers provided helpful com-ments on initial drafts of this manuscript.
REFERENCES
Alizai SAK, McManus J. 1980. The significance of reed beds on siltation in the Tay Estuary. Proceedings of the Royal Society Edinburg. 78:1–13.
[ASCE] American Society of Civil Engineers. 1975. Sedimentation Engineering: Vanoni VA, editor. Manuals and Reports on Engineering Practice 54.
Amos CL, Umgiesser G, Ferrarin C, Thompson CEL, Whitehouse RJS, Sutherland TF, Bergamasco A. 2010. The erosion rates of cohesive sediments in Venice lagoon, Italy: Continental Shelf Research 30:859–870.
Atwater BF, Belknap DF. 1980. Tidal-wetland deposits of the Sacramento–San Joaquin Delta, California. Pacific Coast Paleogeography Symposium 4:89–103.
Bauer BO, Lorang MS, Sherman DJ. 2002. Estimating boat-wake-induced levee erosion using sediment suspension measurements. Journal of Waterway, Port, Coastal, and Ocean Engineering 128(4):152–162.
Bergamaschi BA, Kuivila KM, Fram MS. 2001. Pesticides associated with suspended sediments entering San Francisco Bay following the first major storm of water year 1996. Estuaries 24(3):368–380.
Braskerud BC. 2001. The influence of vegetation on sedimentation and resuspension of soil particles in small constructed wetlands. Journal of Environmental Quality 30:1447–1457.
Brennan ML, Schoellhamer DH, Burau JR, Monismith SG. 2002. Tidal asymmetry and variability of bed shear stress and sediment bed flux at a site in San Francisco Bay, USA. In: Winterwerp JC, Kranenburg C, editors. Fine sediment dynamics in the marine environment. Amsterdam, The Netherlands: Elsevier. p 93–108.
Byrne R, Ingram BL, Starratt S, Malamud–Roam F, Collins JN, Conrad ME. 2001. Carbon-isotope, diatom, and pollen evidence for late Holocene salinity change in a brackish marsh in the San Francisco Estuary. Quaternary Research 55:66–76.
Caffrey JM. 1995. Spatial and seasonal patterns in sediment nitrogen remineralization and ammonium concentrations in San Francisco Bay, California. Estuaries 18(1B):219–233.
[DFG] California Department of Fish and Game. 1997. California wetland and riparian geographic information system. Final report. Sacramento (CA): California Department of Fish and Game.
OCTOBER 2012
21
[DWR] California Department of Water Resources. 1995. Sacramento–San Joaquin Delta atlas. Sacramento (CA): California Department of Water Resources. 121 p.
Canuel EA, Lerberg EJ, Dickhut RM, Kuehl SA, Bianchi TS, Wakeham SG. 2009. Changes in sediment and organic carbon accumulation in a highly-disturbed ecosystem: the Sacramento–San Joaquin River Delta (California, USA). Marine Pollution Bulletin 59(4–7):154–163.
Carpenter SR, Lodge DM. 1986. Effects of submerged macrophytes on ecosystem processes. Aquatic Botany 26:341–370.
Cloern JE. 1987. Turbidity as a control on phytoplankton biomass and productivity in estuaries. Continental Shelf Research 7(11/12):1367–1381.
Curtis JA, Flint LE, Alpers CN, Wright SA, Snyder NP. 2006. Use of sediment rating curves and optical backscatter data to characterize sediment transport in the upper Yuba River watershed, California, 2001–03. U.S. Geological Survey Scientific Investigations Report 05-5246. 84 p. Available from: http://pubs.er.usgs.gov/publication/sir20055246.
D'Alpaos A. 2011. The mutual influence of biotic and abiotic components on the long-term ecomorphodynamic evolution of salt-marsh ecosystems: Geomorphology 126(3–4):269–278. doi:10.1016/j.geomorph.2010.04.027
Dean RC, Dalrymple RA. 1984. Water wave mechanics for engineers and scientists. Englewood Cliffs (NJ): Prentice–Hall. 353 p.
Dinehart RL. 2002. Bedform measurement recorded by sequential single-beam surveys in tidal rivers. Journal of Hydrology 258:25–39.
Drexler JZ. 2011. Peat formation processes through the millennia in tidal marshes of the Sacramento–San Joaquin Delta, California, USA. Estuaries and Coasts 34:900–911.
Droppo IG, Leppard GG, Flannigan DT, Liss SN. 1997. The freshwater floc: A functional relationship of water and organic and inorganic floc constituents affecting suspended sediment properties. Water, Air, and Soil Pollution 99:43–54.
Eisma D, Kijkema KS. 1997. The influence of salt marsh vegetation on sedimentation. In: Eisma D, editor. Intertidal deposits. Boca Raton (FL): CRC Press. p 403–414.
Feyrer F, Nobriga ML, Sommer TR. 2007. Multidecadal trends for three declining fish species: habitat patterns, and mechanisms in the San Francisco Estuary, California, USA. Canadian Journal of Fisheries and Aquatic Sciences 64:723–734.
Florsheim J, Mount JF, Chin A. 2008. Bank erosion as a desirable attribute of rivers. Bioscience 58(6):519–529.
Ganju NK, Schoellhamer DH. 2010. Decadal-timescale estuarine geomorphic change under future scenarios of climate and sediment supply. Estuaries and Coasts 33:15–29.
Ganju NK, Schoellhamer DH. 2009. Calibration of an estuarine sediment transport model to sediment fluxes as an intermediate step for simulation of geomorphic evolution. Continental Shelf Research 29(1):148–158.
Ganju NK, Schoellhamer DH, Murrell MC, Gartner JW, Wright SA. 2007. Constancy of the relation between floc size and density in San Francisco Bay. In Maa JPY, Sanford LP, Schoellhamer DH, editors. Estuarine and Coastal Fine Sediments Dynamics. Elsevier. p. 75–91.
Gilbert GK. 1917. Hydraulic-mining debris in the Sierra Nevada. Washington, DC: U.S. Geological Survey Professional Paper 105. 154 p. Available from: http://pubs.er.usgs.gov/publication/pp105.
Goodwin P, Denton RA. 1991. Seasonal influences on the sediment transport characteristics of the Sacramento River. Proceedings of the Institution of Civil Engineers 91(Part 2):163–172.
Gray JR, Glysson GD, Turcios LM, Schwarz GE. 2000. Comparability of suspended-sediment concentration and total suspended-solids data. U.S. Geological Survey Water Resources Investigations Report 00-4191. 14 p. Available from: http://pubs.er.usgs.gov/publication/wri004191.
Hatton RS, DeLaune RD, Patrick WH. 1983. Sedimentation, accretion, and subsidence in marshes of Barataria Basin, Louisiana. Limnology and Oceanography 28:494–502.
Hood WG. 2004. Indirect environmental effects of dikes on estuarine tidal channels: thinking outside of the dike for habitat restoration and monitoring: Estuaries 27(2):273–282.
James LA. 1991. Incision and morphologic evolution of an alluvial channel recovering from hydraulic mining sediment. Geological Society of America Bulletin 103:723–736.
Jassby AD, Cloern JE. 2000. Organic matter sources and rehabilitation of the Sacramento–San Joaquin Delta (California, USA). Aquatic Conservation: Marine and Freshwater Ecosystems 10:323–352.
Jassby AD, Cloern JE, Cole BE. 2002. Annual primary production: Patterns and mechanisms of change in a nutrient-rich tidal ecosystem. Limnology and Oceanography 47(3):698–712.
Kelley R. 1998. Battling the inland sea: Floods, Public Policy, and the Sacramento Valley. Berkeley (CA): University of California Press. 420 p.
Kirby R. 1990. The sediment budget of the erosional intertidal zone of the Medway Estuary, Kent. Proceedings of the Geological Association 101(1):63–77.
Kirwan ML, Murray AB, Boyd WS. 2008. Temporary vegetation disturbance as an explanation for permanent loss of tidal wetlands. Geophysical Research Letters 35(L05403):5 p. doi:10.1029/2007GL032681. Available from: http://www.agu.org/pubs/crossref/2008/2007GL032681.shtml.
Law BA, Hill PS, Milligan TG, Curran KJ, Wiberg PL, Wheatcroft RA. 2008. Size sorting of fine-grained sediments during erosion: results from the western Gulf of Lions. Continental Shelf Research 28:1935–1946.
Le Hir P, Cann P, Waeles B, Jestin H, Basslullet P. 2008. Erodibility of natural sediments: experiments on sand/mud mixtures from laboratory and field erosion tests. In: Kusuda T, Yamanishi H, Spearman J, Gailani JZ, editors. Sediment and ecohydraulics. Amsterdam, The Netherlands: Elsevier. p 137–153.
Le Roux SM, Turner A, Millward GE, Ebdon L, Apprion P. 2001. Partitioning of mercury onto suspended sediments in estuaries. Journal of Environmental Monitoring 3:37–42.
Leonard LA, Wren PA, Beavers RL. 2002. Flow dynamics and sedimentation in Spartina alterniflora and Phramites australis marshes of the Chesapeake Bay. Wetlands 22(2):415–424.
Luengen AR, Flegal AR. 2009. Role of phytoplankton in mercury cycling in the San Francisco Bay estuary. Limnology and Oceanography 54(1):23–40.
Manning AJ, Dyer KR. 2002. The use of optics for the in situ determination of flocculated mud characteristics. Journal of Optics A: Pure and Applied Optics 4:S71–S81.
McKee LJ, Ganju NK, Schoellhamer DH. 2006. Estimates of suspended sediment flux entering San Francisco Bay from the Sacramento and San Joaquin Delta, San Francisco Bay, California. Journal of Hydrology 323:335–352.
McNeil J, Taylor C, Lick W. 1996. Measurements of erosion of undisturbed bottom sediments with depth. Journal of Hydraulic Engineering 122(6):316–324.
Meade RH. 1982. Sources, sinks, and storage of river sediment in the Atlantic drainage of the United States. Journal of Geology 90:235–252.
Mehta AJ. 1989. On estuarine cohesive sediment suspension behavior. Journal of Geophysical Research 94(C10):14303–14314.
Morris J. 2006. Competition among marsh macrophytes by means of geomorphological displacement in the intertidal zone. Estuarine, Coastal and Shelf Science 69:395–402.
Neubauer SC. 2008. Contributions of mineral and organic components to tidal freshwater marsh accretion. Estuarine, Coastal and Shelf Science 78:78–88.
Nilsson C, Reidy CA, Dynesius M, Revenga C. 2005. Fragmentation and flow regulation of the world's large river systems. Science 308:405–408.
Nobriga ML, Feyrer F, Baxter RD, Chotkowski M. 2005. Fish community ecology in an altered river delta: spatial patterns in species composition, life history strategies, and biomass. Estuaries 28(5):776–785.
Nobriga ML, Sommer TR, Feyrer F, Fleming K. 2008. Long-term trends in summertime habitat suitability for delta smelt (Hypomesus transpacificus): San Francisco Estuary and Watershed Science [Internet]. [cited 2012 Sept 6]; 6(1). Available from http://escholarship.org/uc/item/5xd3q8tx.
Ogden Beeman & Associates, Ray B. Krone & Associates. 1992. Sediment budget study for San Francisco Bay. Final report prepared for the San Francisco District, U.S. Army Corps of Engineers.
Orlando JL, Drexler JZ, Dedrick KG. 2005. South San Francisco Bay tidal marsh vegetation and elevation surveys—Corkscrew Marsh, Bird Island, and Palo Alto Baylands, California, 1983. U.S. Geological Survey Data Series Report 134. 51 p. Available from: http://pubs.er.usgs.gov/publication/ds134.
Orr M, Crooks S, Williams PB. 2003. Will restored tidal marshes be sustainable?. San Francisco Estuary and Watershed Science [Internet]. [cited 2012 Sept 6]; 1(1). Available from: http://escholarship.org/uc/item/8hj3d20t.
Pasternack GB, Brush GS. 1998. Sedimentation cycles in a river-mouth tidal freshwater marsh. Estuaries 21(3):407–415.
Pasternack GB, Brush GS. 2001. Seasonal variations in sedimentation and organic content in five plant associations on a Chesapeake Bay tidal freshwater delta. Estuarine, Coastal and Shelf Science 53:93–106.
Pfeffer WT, Harper JT, O'Neel S. 2008. Kinematic constraints on glacier contributions to 21st-century sea-level rise. Science 321:1340–1343.
Porterfield G. 1980. Sediment transport of streams tributary to San Francisco, San Pablo, and Suisun Bays, California, 1909–1966. U.S. Geological Survey Water–Resources Investigations Report 80–64. 92 p.
Porterfield G, Busch RD, Waananen AO. 1978. Sediment transport in the Feather River, Lake Oroville to Yuba City, California. U.S. Geological Survey Water-Resources Investigations Report 78–20. 73 p.
Reed DJ. 2002. Understanding tidal marsh sedimentation in the Sacramento–San Joaquin Delta, California. Journal of Coastal Research Special Issue 36:605–611.
Regional Monitoring Program (RMP) [Internet]. Data Query Tool; [cited 2007 Feb 21]. Available from: http://www.sfei.org/rmp/wqt.
Ruhl CA, Schoellhamer DH. 2004. Spatial and temporal variability of suspended-sediment concentrations in a shallow estuarine environment. San Francisco Estuary and Watershed Science [Internet]. [cited 2012 Sept 6]; 2(2). Available from http://escholarship.org/uc/item/1g1756dw.
Sand–Jensen K, Mebus JR. 1996. Fine-scale patterns of water velocity within macrophyte patches in streams: Oikos 76:169–180.
Schemel LE, Hager SW, Childers D. 1996. The supply and carbon content of suspended sediment from the Sacramento River to San Francisco Bay. In: Hollibaugh JT, editor. San Francisco Bay: the ecosystem. Pacific Division, American Association for the Advancement of Science. p 237–260.
Schlesinger WH. 1997. Biogeochemistry: an analysis of global change. New York (NY); Academic Press. 588 p.
Schoellhamer DH. 2001. Influence of salinity, bottom topography, and tides on locations of estuarine turbidity maxima in northern San Francisco Bay. In: McAnally WH, Mehta AJ, editors. Coastal and estuarine fine sediment transport processes. Amsterdam, The Netherlands: Elsevier. p 343–357. Available from http://ca.water.usgs.gov/abstract/sfbay/elsevier0102.pdf.
Schoellhamer DH, Wright SA. 2003. Continuous monitoring of suspended sediment discharge in rivers by use of optical backscatterance sensors. In: Bogen J, Fergus T, Walling DE, editors. Erosion and sediment transport measurement: technological and methodological advances. International Association for Hydrological Science Publication 283. p 28–36. Available from http://iahs.info/redbooks/a283/iahs_283_028.pdf.
Schoellhamer DH, Mumley TE, Leatherbarrow JE. 2007a. Suspended sediment and sediment-associated contaminants in San Francisco Bay. Environmental Research 105:119–131.
Schoellhamer D, Wright S, Drexler J, Stacey M. 2007b. Sedimentation conceptual model. CALFED Science Program. Delta Regional Ecosystem Restoration Implementation Plan conceptual models. Available from: http://science.calwater.ca.gov/pdf/drerip/DRERIP_sediment_conceptual_model_final_111307.pdf.
Simenstad C, Toft J, Higgins H, Cordell J, Orr M, Williams P, Grimaldo L, Hymanson Z, Reed D. 2000. Sacramento–San Joaquin Delta breached levee wetland study (BREACH) preliminary report. Wetland Ecosystem Team, University of Washington, School of Fisheries.
Singer MB. 2007. The influence of major dams on hydrology through the drainage network of the Sacramento River basin, California. River Research and Applications 23:55–72.
Singer MB, Aalto R, James LA. 2008. Status of the lower Sacramento Valley flood-control system within the context of its natural geomorphic setting. Natural Hazards Review 9(3):104–115.
Syvitski JPM,Vörösmarty CJ, Kettner AJ, Green P. 2005. Impact of humans on the flux of terrestrial sediment to the global coastal ocean. Science 308:376–380.
Thompson B, Lowe S, Kellog M. 2000. Results of the benthic pilot study, 1994–1997. Part 1–macrobenthic assemblages of the San Francisco Bay–Delta, and their responses to abiotic factors. Regional Monitoring Program Technical Report 39. Oakland (CA): San Francisco Estuary Institute. 39 p.
Tobin A, Schoellhamer DH, Burau JR. 1995. Suspended-solids flux in Suisun Bay, California. In: Proceedings, First International Conference on Water Resources Engineering; 1995 Aug 14–18; San Antonio (TX). 2:1511–1515.
Turner A, Hyde TL, Rawling MC. 1999. Transport and retention of hydrophobic organic micropollutants in estuaries: implications of the particle concentration effect. Estuarine, Coastal and Shelf Science 49:733–746.
Turner A, Millward GE. 2000. Particle dynamics and trace metal reactivity in estuarine plumes: Estuarine, Coastal, and Shelf Science 50:761–774.
Turner A, Millward GE. 2002. Suspended particles: their role in estuarine biogeochemical cycles, Estuarine, Coastal and Shelf Science 55:857–883.
[USFWS] U.S. Fish and Wildlife Service. 2000. Impacts of riprapping to ecosystem functioning, Lower Sacramento River, California. Available from: http://www.fws.gov/sfbaydelta/documents/Riprap_Effects_2004_revision.pdf.
Widdows J, Brown S, Brinsley MD, Salkeld PN, Elliott M. 2000. Temporal changes in intertidal sediment erodibility: influence of biological and climatic factors. Continental Shelf Research 20:1275–1290.
Wilcox RJ, Champion PD, Nagels JW, Croker GF. 1999. The influence of aquatic macrophytes on the hydraulic and physico-chemical properties of a New Zealand lowland stream. Hydrobiologia 416:203–214.
Williams GP, Wolman MG. 1984. Downstream effects of dams on alluvial rivers. U.S. Geological Survey Professional Paper 1286 p. Available from: http://pubs.er.usgs.gov/usgspubs/pp/pp1286.
Williams PB, Orr MK. 2002. Physical evolution of restored breached leveed salt marshes in the San Francisco Bay estuary. Restoration Ecology 10(3):527–542.
Wright SA, Schoellhamer DH. 2004. Trends in the Sediment yield of the Sacramento River, California, 1957–2001. San Francisco Estuary and Watershed Science [Internet]. [cited 2012 Sept 6]; 2(2). Available from: http://escholarship.org/uc/item/891144f4.
Wright SA, Schoellhamer DH. 2005. Estimating sediment budgets at the interface between rivers and estuaries with application to the Sacramento–San Joaquin River Delta. Water Resources Research 41. Available from: http://www.agu.org/pubs/crossref/2005/2004WR003753.shtml. doi:10.1029/2004WR003753.
Yang SL. 1998. The role of a Scirpus marsh in attenuation of hydrodynamics and retention of fine sediment in the Yangtze Estuary: Estuarine, Coastal and Shelf Science 47:227–233.